Congressional District Interactive Map: Medicaid Enrollment by Eligibility Group
There are several options under consideration in Congress to significantly reduce Medicaid spending to help pay for tax cuts, with the recently passed House budget resolution targeting cuts to Medicaid of up to $880 billion or more over a decade. Medicaid is the primary program providing comprehensive health and long-term care to 83 million people living in the U.S (particularly those with low-incomes) and accounts for nearly $1 out of every $5 spent on health care. Medicaid is administered by states within broad federal rules and jointly funded by states and the federal government, meaning restrictions in federal Medicaid spending could leave states with tough choices on how to offset reductions through cuts to Medicaid, cuts to other programs, or tax increases.
In the months ahead, members of Congress will be considering and voting on various proposals to cut the Medicaid program. President Trump and Speaker Johnson have promised to leave Medicaid intact, cutting only fraud, waste, and abuse. However, if Medicaid is cut by $880 billion over 10 years, that would reduce federal spending by 13% relative to KFF’s projections of Medicaid spending under current law (which estimate spending growth using the Congressional Budget Office’s Medicaid projections). Cuts of that magnitude would force states to raise new revenues or reduce Medicaid spending by eliminating coverage for some people, covering fewer services, or cutting payment rates for providers.
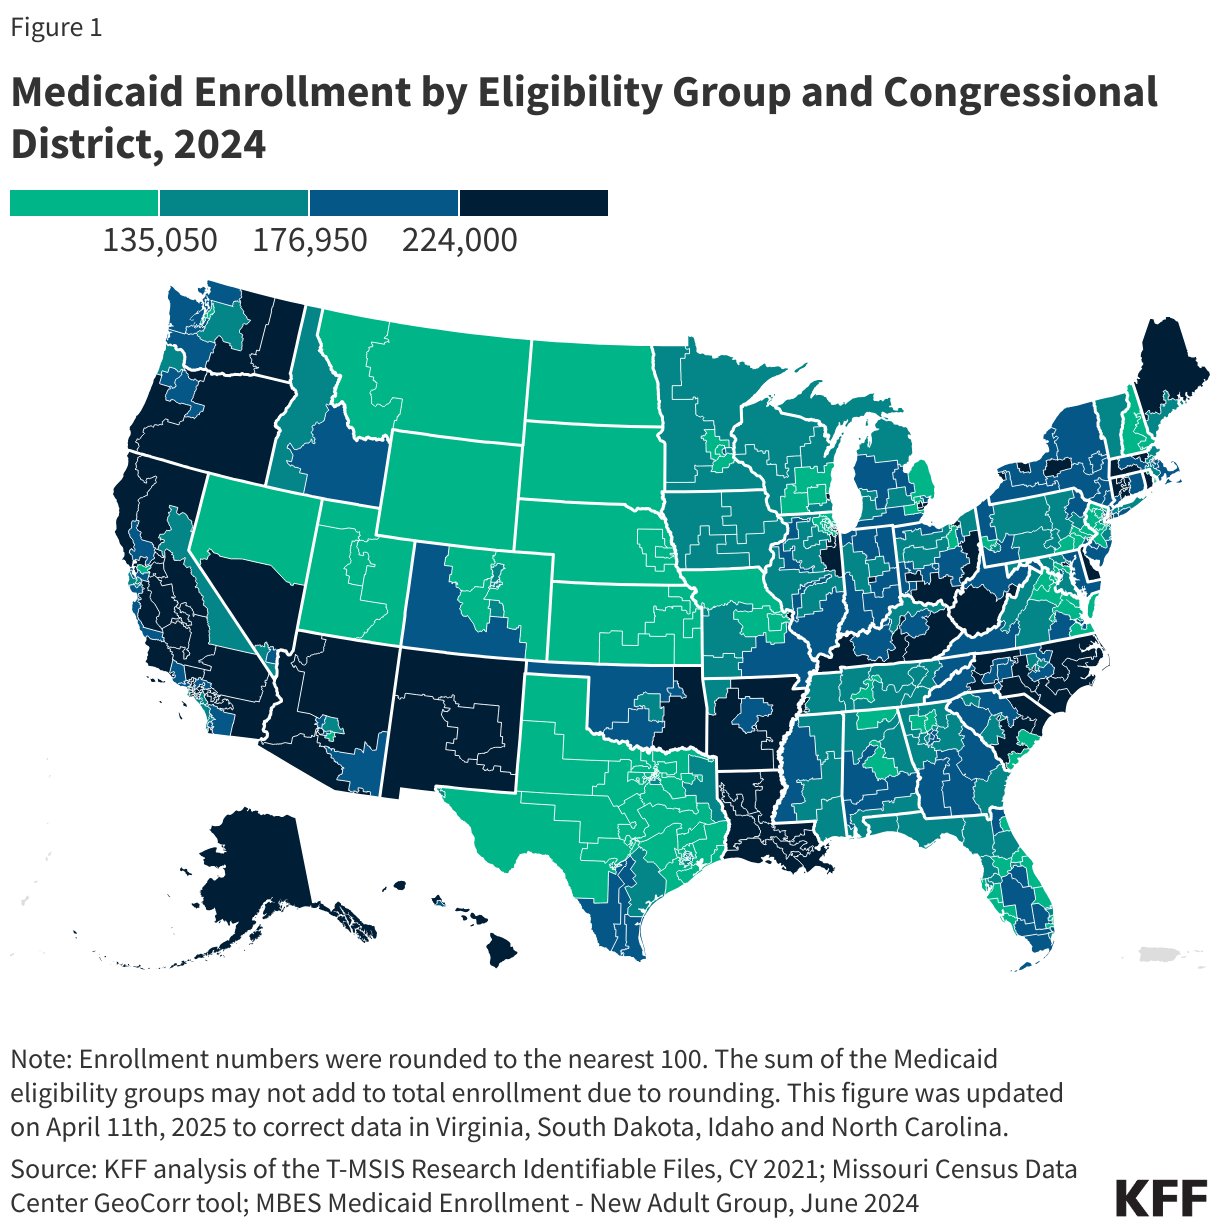
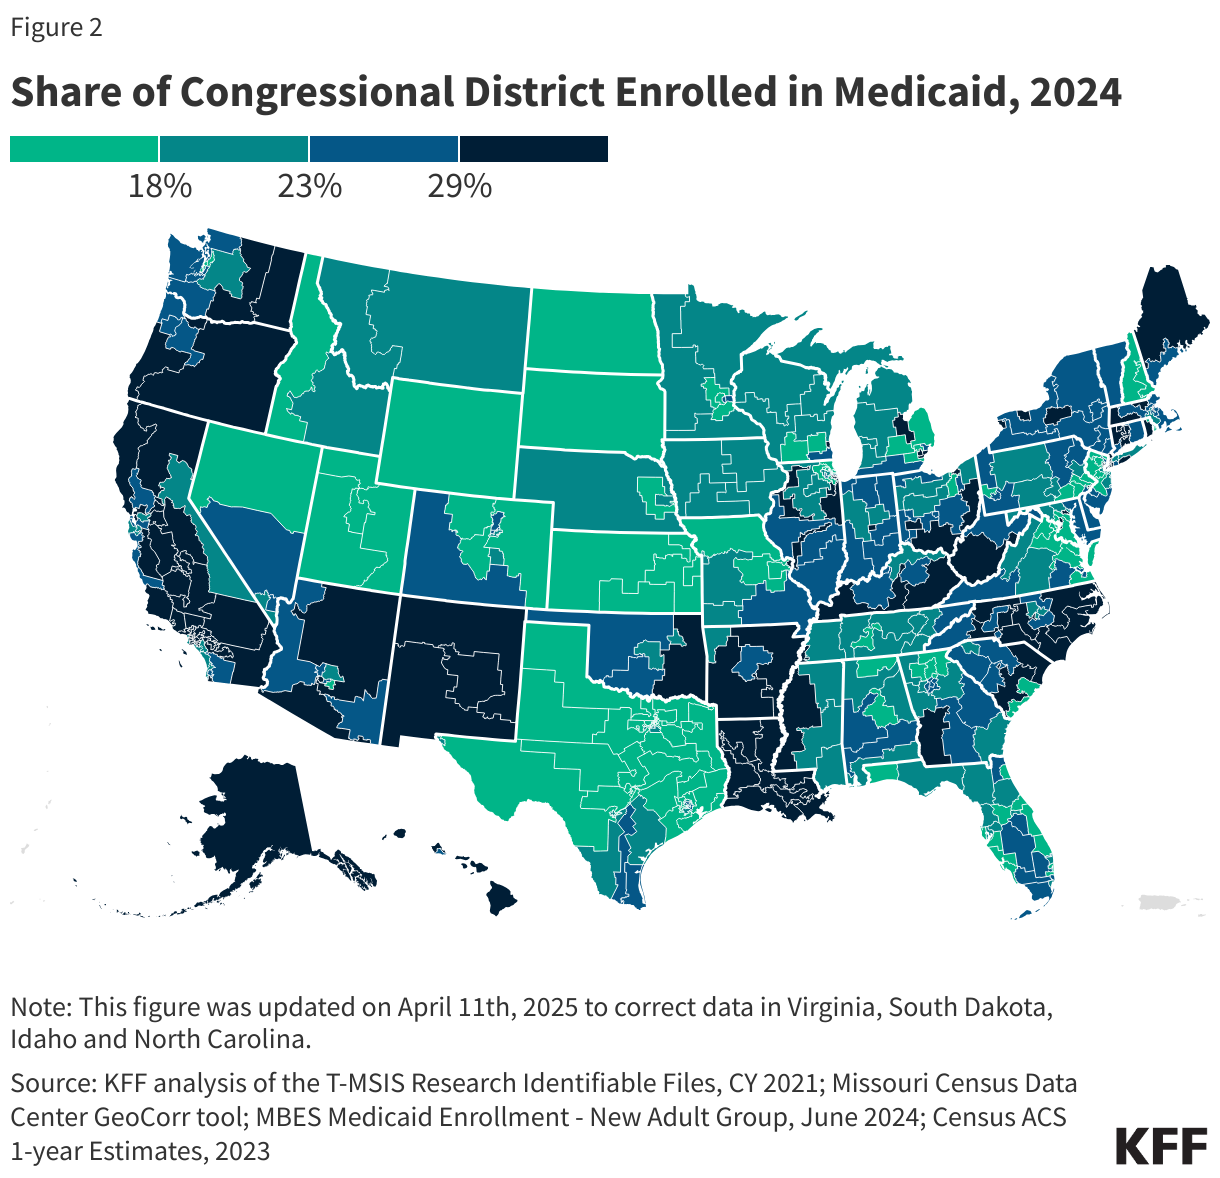
The interactive maps below illustrate how many people are enrolled in Medicaid and what percentage of the population is enrolled in Medicaid for each congressional district. Enrollment numbers include enrollment in each of the major Medicaid eligibility groups, highlighting whose coverage may be at risk in upcoming deliberations. Key takeaways include:
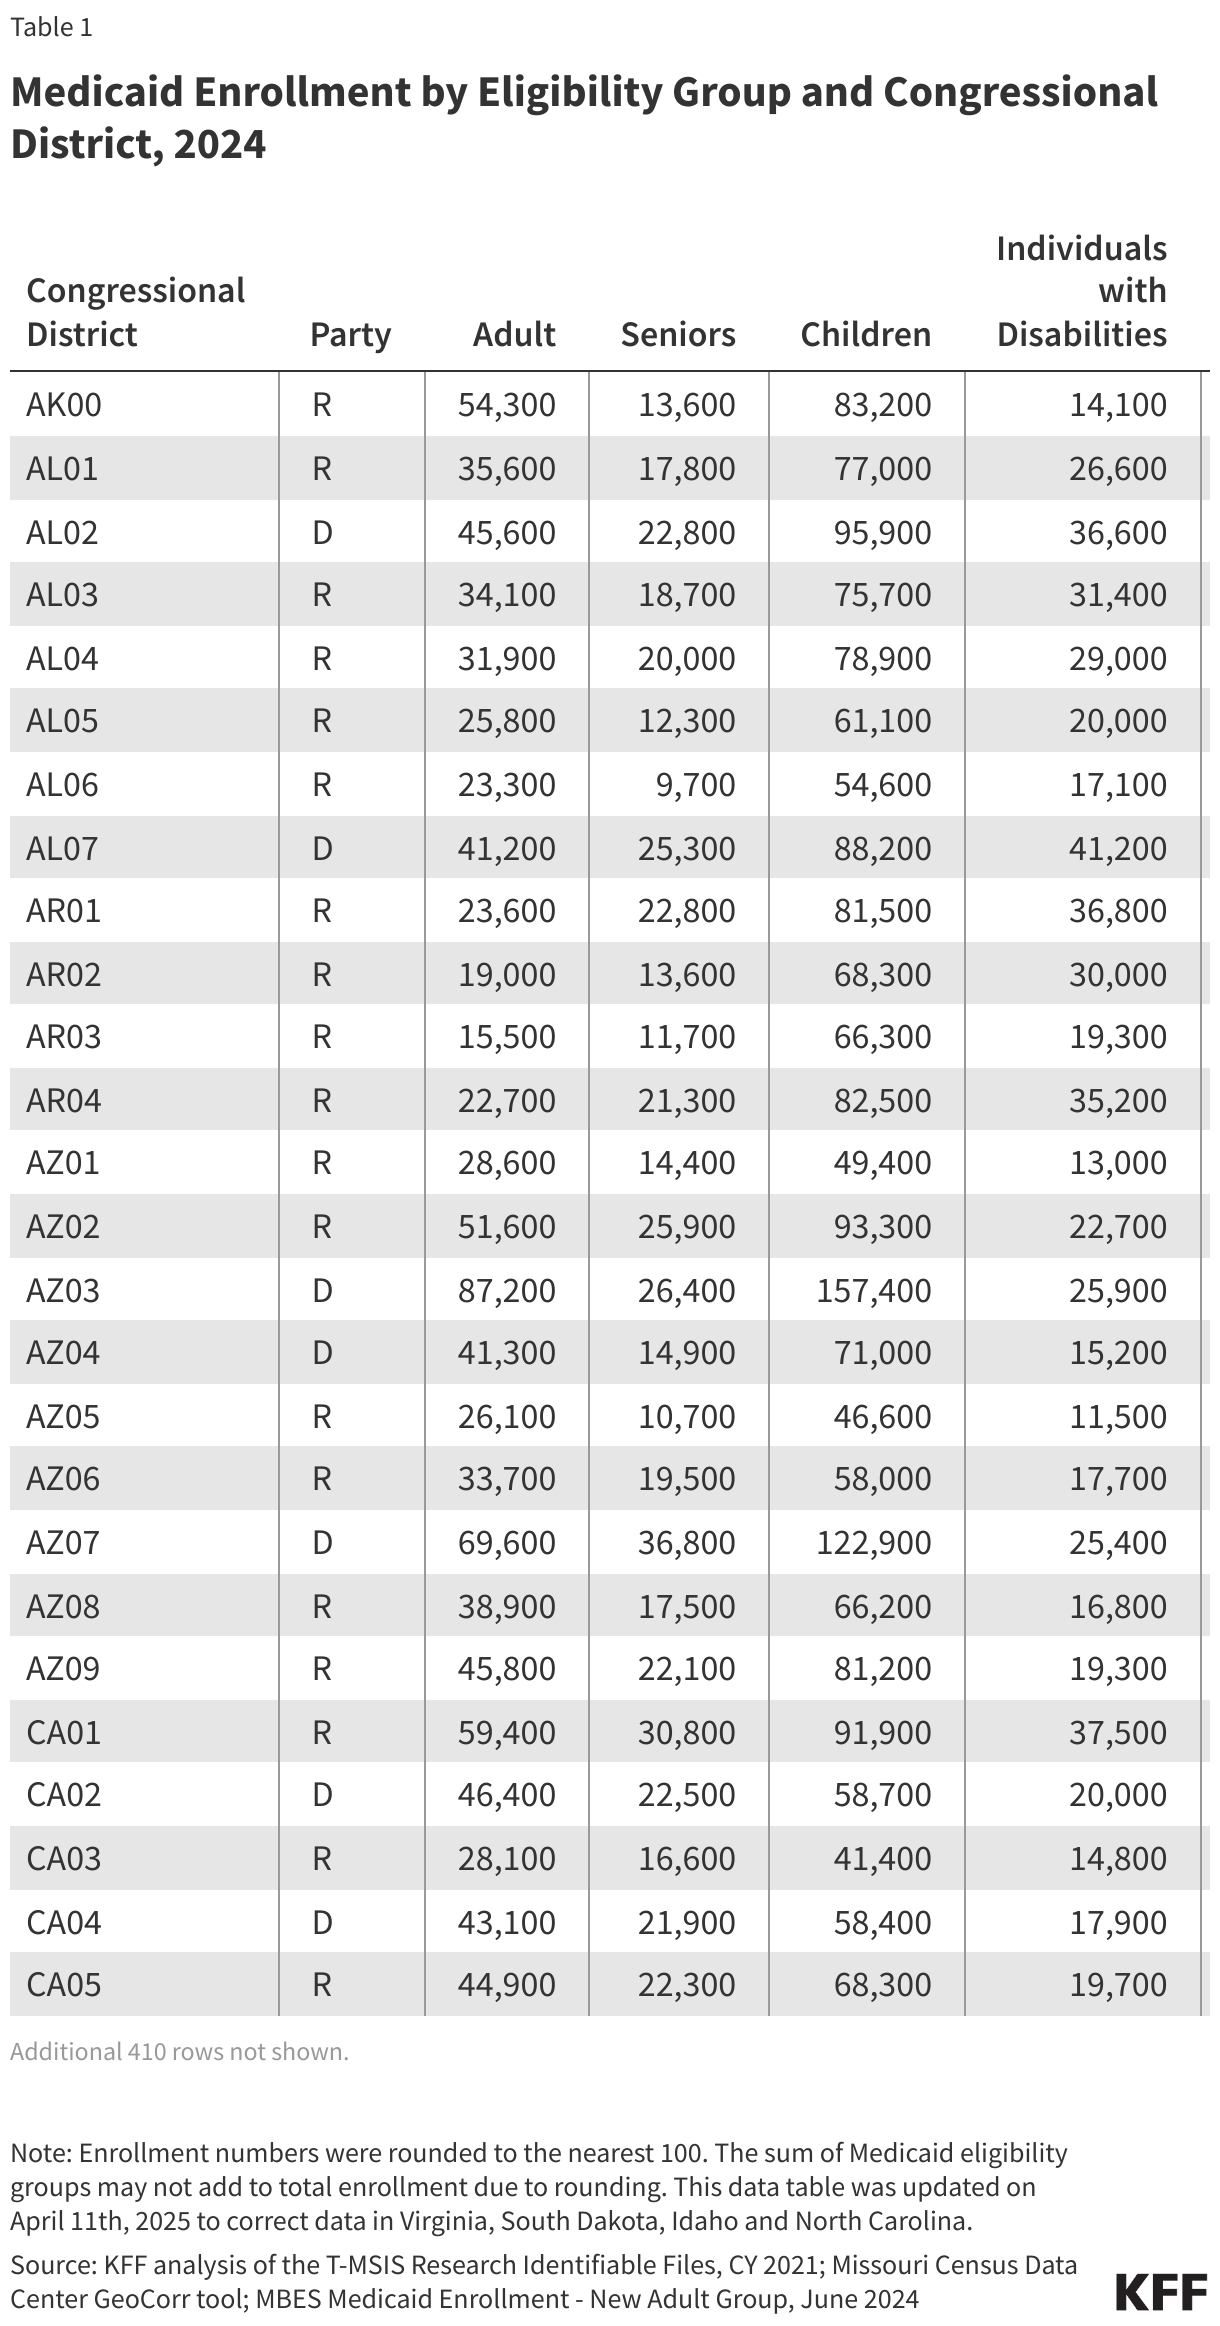
- There are 53,000 or more Medicaid enrollees living in each congressional district, with enrollment as high as 510,000 in some districts. In each congressional district, there are at least: 3,500 Medicaid enrollees ages 65 and older, 2,000 enrollees eligible because of a disability, 7,400 child enrollees, and 5,300 other adult enrollees.
- In half of all Republican congressional districts, 21% or more of the population is enrolled in Medicaid; and in half of all Democratic districts, 26% or more of the population is enrolled in Medicaid.
- Republican districts have a higher share of Medicaid enrollees who are children and who are eligible because of a disability compared with Democratic districts that have a higher share of expansion enrollees and adults ages 65 and older.
- The top 10 Republican districts with the highest number of Medicaid enrollees are: CA22 (495,200); KY05 (397,800); CA23 (355,400); CA01 (316,800); LA05 (312,600); NY11 (304,100); LA03 (303,000); WV01 (300,100); LA04 ( 288,400); and WA04 (278,000).
- The top 10 Democratic districts with the highest number of Medicaid enrollees are: NY15 (510,100); CA43 (473,500); CA37 (470,600); CA21 (462,900); CA34 (453,800); NY13 (426,200); NY14 (423,800); CA13 (417,800); AZ03 (410,900) and CA25 (397,400).
Methods
Data: To calculate Medicaid enrollment by eligibility group and congressional district, this analysis uses the 2021 T-MSIS Research Identifiable Demographic-Eligibility and Claims Files, the Missouri Census Data Center’s Geocorr 2022 data, the Medicaid new adult group enrollment data collected through MBES for June 2024 (downloaded in February 2025), and the Census American Community Survey 1-Year Estimates, 2023.
Assigning Medicaid Enrollees to Congressional Districts: This analysis used the Missouri Census Data Center’s Geocorr 2022 tool to create a zip code-to-congressional district crosswalk and a county-to-congressional district crosswalk. Using those crosswalks, we assigned Medicaid enrollees to 119th congressional districts in the T-MSIS data.
In some cases, a county or a zip code can be split among multiple congressional districts. In those cases, enrollees were randomly assigned to a congressional district based on an allocation factor from the Geocorr 2022 tool that is calculated using the 2020 decennial census.
For each state, we calculated the percentage of people living in a zip code that aligned with a single congressional district and the percentage of people living in a county that aligned with a single congressional district. In most states, the zip code alignment was better, and we used the zip code crosswalk. In 9 states (AL, IA, KY, MS, MT, NC, NE, RI, and WV), the county alignment was better, so we used the county code crosswalk.
We applied the T-MSIS distributions of enrollees in eligibility groups and congressional districts to the MBES administrative enrollment data. Those data report enrollment for adults eligible through the Affordable Care Act (ACA) and for all other Medicaid enrollees on a quarterly basis.
Expansion States with Missing/Incomplete Expansion Data: Idaho and Virginia have data quality issues in the reporting of their ACA adult population in 2021 T-MSIS data, and North Carolina and South Dakota had not yet expanded Medicaid as of 2021. In those four states, we used the distribution of non-disabled adult enrollment to apportion ACA enrollment across congressional districts.
