
The Pennsylvania Health Care Landscape
As one of the most populous states in the U.S., the health and health care of Pennsylvanians have important implications for the nation at large. Pennsylvania is experiencing changes to its health care delivery and payment systems as the state expands Medicaid, provides new coverage options through the federal health insurance marketplace, and streamlines application and enrollment processes for coverage programs. This fact sheet provides an overview of population health, health coverage, and the health care delivery system in Pennsylvania in the era of health reform.
Demographics
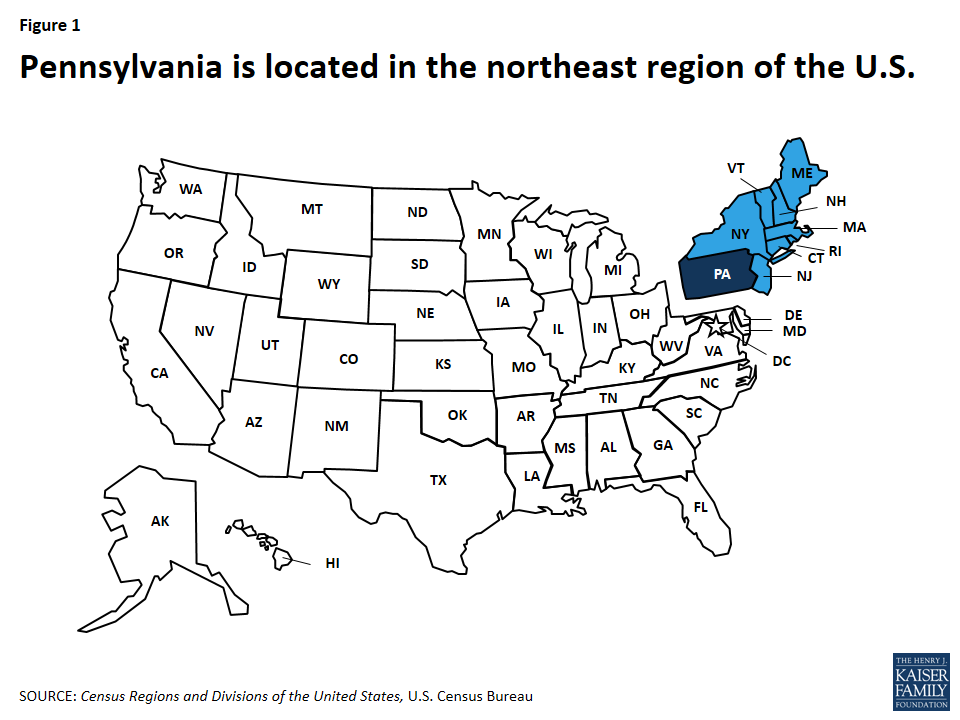
Figure 1: Pennsylvania is located in the northeast region of the U.S.
Pennsylvania is home to more than 12.6 million people, making it the sixth most populous state in the U.S.1 With nearly 45,000 square miles, Pennsylvania is the 32nd largest state.2 Pennsylvania is bordered by six states and is one of nine states located in the country’s Northeast region (Figure 1). In the Northeast, it is the second most populous state after New York. Pennsylvania’s topography is carved out by the Appalachian Mountains, which run through the center and cover most of the state, giving it rolling hills, ridges and plateaus, and valleys.3
Much of Pennsylvania is rural, but the majority of the population lives in metropolitan areas. Among the state’s 67 counties, seven had total populations that met or exceeded 500,000 (See Figure 15, Appendix). The majority of the state’s population (87%) lives in metropolitan areas, and four counties (Philadelphia, Allegheny, Montgomery, and Bucks) account for one-third of the state’s population.4 Additionally, 52 of the state’s 67 counties are within the Appalachian region,5 accounting for almost half of the population (45%).
Social and demographic population patterns in Pennsylvania, including race/ethnicity, citizenship status and age distribution, are less diverse than other states in the Northeast and the United States overall (Table 1). A larger share of Pennsylvanians identify as White compared to the national average (77% versus 62%), while fewer identify as Hispanic (7% in Pennsylvania versus 18% nationally). Additionally, 17% of the population are 65 or older, compared to 15% nationally. More than nine in ten (94%) are U.S.-born citizens and nearly one-third of nonelderly adults (32%) have at least a college degree. Over eight in ten residents (81%) live in a household with at least one full-time worker.
| Table 1: Selected Demographic Characteristics of the Pennsylvanian Population, Compared to the Northeast and United States Overall, 2014 |
|||
| Pennsylvania | Northeast | United States | |
| Race/Ethnicity | |||
| White | 77% | 67% | 62% |
| Black | 10% | 11% | 12% |
| Hispanic | 7% | 13% | 18% |
| Other Race/Ethnicity | 5% | 9% | 9% |
| Age | |||
| 0-18 | 23% | 23% | 25% |
| 19-64 | 60% | 61% | 61% |
| 65+ | 17% | 16% | 15% |
| Citizenship Status | |||
| U.S.-Born Citizen | 94% | 84% | 87% |
| Naturalized Citizen | 3% | 9% | 6% |
| Non-Citizen | 3% | 8% | 7% |
| Educational Attainment of Nonelderly Adults (19-64) | |||
| Less than High School | 8% | 8% | 10% |
| High School Graduate | 34% | 28% | 29% |
| Some College/Assoc. Degree | 26% | 26% | 30% |
| College Graduate or Greater | 32% | 38% | 31% |
| Employment Characteristics of Nonelderly | |||
| Households with at Least 1 Full-time Worker | 81% | 82% | 82% |
| NOTE: Data may not sum to 100% due to rounding and data restrictions. SOURCE: Kaiser Family Foundation estimates based on the Census Bureau’s March 2015 Current Population Survey (CPS: Annual Social and Economic Supplement). |
|||
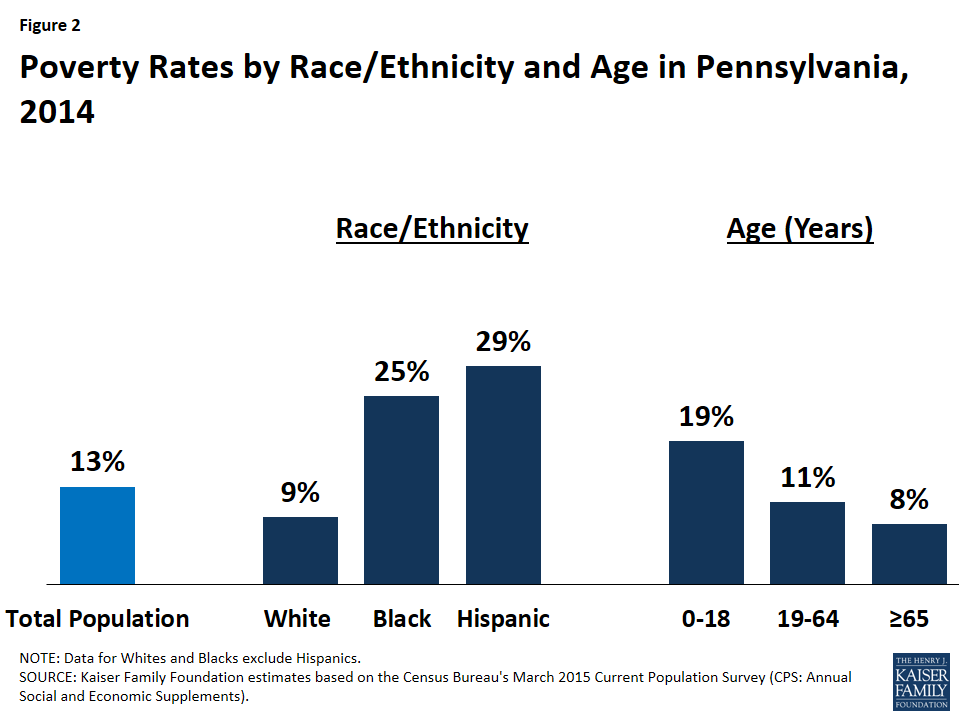
Figure 2: Poverty Rates by Race/Ethnicity and Age in Pennsylvania, 2014
While the overall share of Pennsylvanians living in poverty is slightly lower than the national average (13% vs. 15%), Pennsylvania has wide disparities in poverty rates by race/ethnicity and age. In Pennsylvania, Blacks and Hispanics are approximately three times as likely as Whites to be poor (Figure 2). As in most other states, children in Pennsylvania are substantially more likely than adults to live in a poor household. As of 2014, almost one in five (19%) Pennsylvania children under age 19 was living in poverty, compared to one in ten nonelderly adults (11%) and 8% of adults age 65 and older.
Population Health
Pennsylvania falls below national averages in rankings of state population health. Pennsylvania ranks 29th among the 50 states in the United Health Care Foundation’s report, America’s Health Rankings 2015.6 In the Commonwealth Fund rankings of state health system performance, Pennsylvania dropped from 14th to 20th between 2009 and 2015.7 Compared to other states, Pennsylvania has heart disease and drug related mortality rates above national averages.8 Conversely, Alzheimer’s disease and alcohol-related death rates in Pennsylvania are below national averages.9 The teen pregnancy rate has been steadily declining to just over half of what it was two decades ago (49 pregnancies per 1,000 women aged 15-19 in 2010 compared to 89 per 1,000 in 1988) which is below the national average of 57 pregnancies per 1,000.10
According to the Centers for Disease Control and Prevention (CDC), Pennsylvania had one of the highest cancer incidence and death rates in the United States in 2012. At 476.1 cases per 100,000 people, Pennsylvania had the seventh highest cancer incidence rate nationally and the fourth highest among states in the Northeast. Ranked seventeenth nationally and second among states in the Northeast, Pennsylvania’s cancer death rate is 174.9 deaths per 100,000 people. At 63.9 cases per 100,000 among all Pennsylvanians, lung and bronchus cancer had the highest incidence rate. However, prostate cancer and breast cancer both had higher incidence rates among each gender. In 2012, the CDC reported 101.7 cases of prostate cancer per 100,000 men and 128.2 cases of breast cancer per 100,000 women.11
Along with states across the nation, Pennsylvania is currently experiencing an unprecedented number of heroin, opioid, and substance use deaths. The Pennsylvania State Coroners Association reported that deaths resulting from drug poisoning continue to increase, with the state seeing an average increase of 20% in most counties between 2013 and 2014. At the time of reporting, the number of drug-related deaths in 2014 was almost 2,500. Almost half (49%) of overdose deaths are caused by opioid medications (25%) and non-legal drugs12 (24%). The typical overdose victim is white, male, aged 41-50, and single.13 Early 2015 data indicate that the number of deaths due to overdose continues to climb.
Disparities in health and health care access exist in Pennsylvania. As in other states across the country, measures of health status in Pennsylvania vary by race/ethnicity, and patterns across these measures in Pennsylvania are similar to national data (Table 2). Around one quarter of Black (27%) and Hispanic (23%) residents report being in fair or poor general health compared to 16% of those who identify themselves as White. Additionally, Blacks (24%) are more likely to smoke than Whites (19%). Disparities in access to care also exist in Pennsylvania. As at the national level, Hispanics in Pennsylvania are more likely to report having no usual source of care (36%) compared to Blacks (18%) and Whites (12%.) Additionally, White (15%) and Hispanic (24%) residents in Pennsylvania are more likely than Blacks (11%) not to have had a doctor visit in the past 2 years.
| Table 2: Selected Measures of Health Status and Health Access by Race/Ethnicity in Pennsylvania Compared to the United States, 2014 |
|||||||
| Share reporting that they: | Pennsylvania | United States | |||||
| White | Black | Hispanic | White | Black | Hispanic | ||
| Have fair or poor general health | 16% | 27% | 23% | 16% | 22% | 26% | |
| Smoke | 19% | 24% | NSD | 18% | 20% | 14% | |
| Have no usual source of care | 12% | 18% | 36% | 18% | 23% | 41% | |
| Have not had a checkup in the past 2 years | 15% | 11% | 24% | 17% | 11% | 22% | |
| Are overweight or obese | 64% | 73% | 67% | 63% | 73% | 70% | |
| Have frequent mental distress | 35% | 38% | 40% | 34% | 35% | 34% | |
| Have diabetes | 11% | 15% | 11% | 10% | 15% | 11% | |
| NSD means not sufficient data. Data may not sum to 100% due to rounding and data restrictions. Data for Whites and Blacks exclude Hispanics. SOURCE: KCMU analysis of the Centers for Disease Control and Prevention (CDC)’s Behavioral Risk Factor Surveillance System (BRFSS) 2014 Survey Results. |
|||||||
Disparities in health and health access exist across the geographic regions of the state, with Pennsylvanians living in rural communities more likely to have unmet heath needs and have poor access to health care than those in urban communities. A 2012 report from the Pennsylvania Department of Health found that individuals living in rural communities had higher rates for cancer, obesity, heart disease, and diabetes. According to the same report, children and nonelderly adults living in rural communities were also more likely to be uninsured.14
State and local efforts are working to address health disparities in Pennsylvania. Pennsylvania’s Office of Health Equity (OHE) was integrated into the Pennsylvania Department of Health in 2007 and has collaborated with health department staff, other state government agencies, educational institutions, health providers and community based organizations to reduce health disparities and achieve health equity.15 In 2010, the U.S. Department of Health and Human Services Office of Minority Health awarded Pennsylvania a three year grant to increase support of community programs working to eliminate health disparities and increase the number of minority professionals and physicians providing care to underserved and underrepresented populations throughout Pennsylvania.16 Educational institutions in the state are also working to study and improve health equity across Pennsylvania. For example, the Center for Health Equity at the University of Pittsburgh is working to understand and reduce health disparities in underserved populations, particularly those in Western Pennsylvania, through research and education, and by providing capacity building services to community organizations in the region.17
State Economy
Pennsylvania’s economy continues to recover after the recession. As of December 2015, Pennsylvania had a lower unemployment rate (4.8%) than the national average (5%).18 In 2014, Pennsylvania’s total state Gross Domestic Product (GDP) was $658 billion, making it the 6th largest economy in the country. Pennsylvania also experienced a 3.4% increase in its GDP between 2013 and 2014, less than the national average of 4.1% growth. The health care and social assistance sectors are major contributors to the state economy, accounting for over one-tenth of the total increase in GDP between 2013 and 2014. Government is another major contributor to the state’s economy accounting for 11% of the Pennsylvania’s GDP in 2014.19
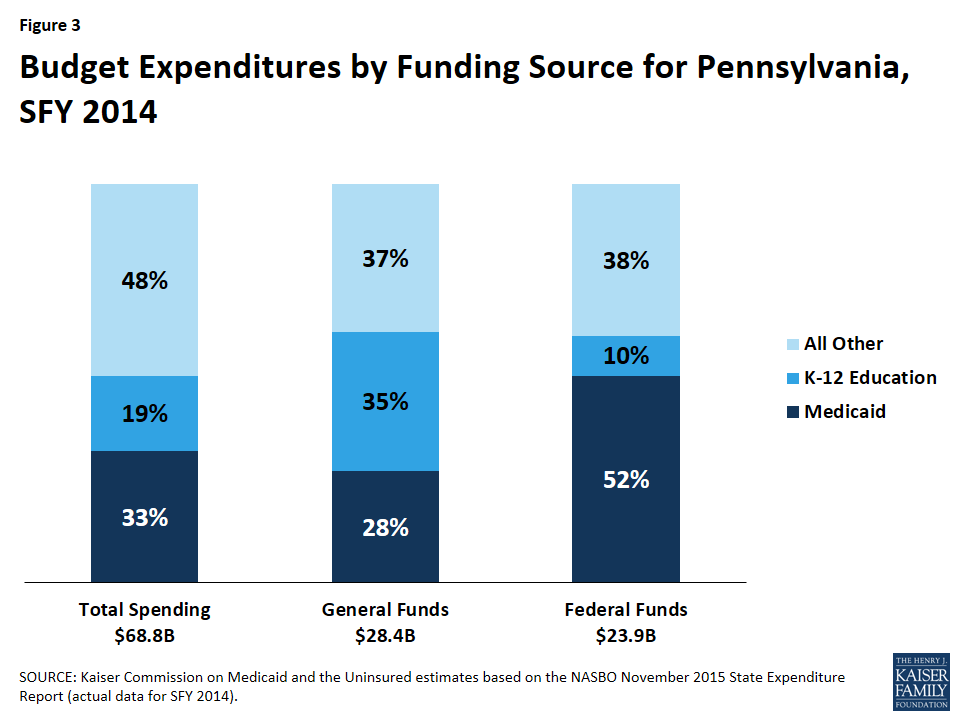
Figure 3: Budget Expenditures by Funding Source for Pennsylvania, SFY 2014
Health Coverage Programs in Pennsylvania’s Budget
Medicaid spending accounted for one-third of total state budget spending in SFY 2014 (Figure 3). Medicaid is the second largest category of state general fund spending behind elementary and secondary education and is the single largest source of federal funds flowing into the state.20 Medicaid costs are shared by the state and the federal government, with the federal government paying more than half (54%) of the cost of Pennsylvania Medicaid. For every dollar that Pennsylvania spends on Medicaid, the federal government sent $1.15 in matching funds to the state in fiscal year 2014.21
While a majority of Medicaid enrollees in Pennsylvania are children and nonelderly adults, the elderly and people with disabilities account for most of the program’s expenditures. As of fiscal year 2011, children made up 44% of Medicaid enrollees in Pennsylvania but accounted for about one-fifth (18%) of total Medicaid expenditures (Figure 4). Elderly people and people with disabilities accounted for just over one-third (35%) of enrollees but 72% of total program costs. Average spending per beneficiary in Pennsylvania was $7,811, the fifth highest in the Northeast and much higher than the national average of $5,790 (Figure 5).

Figure 4: Medicaid Enrollment and Expenditures, FY 2011
Health Coverage in Pennsylvania
In 2014, 92% of all Pennsylvanians had health insurance (Figure 6). Almost six in ten (59%) Pennsylvanians were covered under private health insurance, with 53% of Pennsylvanians covered by employer sponsored insurance and the remaining 6% covered by individual22 coverage. Almost one fifth (18%) were covered by Medicaid or other public coverage, and less than one in ten (8%) of all Pennsylvanians were left uninsured.
Individuals who remained uninsured in 2014 were primarily low-income, in working families, and White non-Hispanic. Because most elderly Pennsylvanians are covered by Medicare, most uninsured are nonelderly (under age 65). The majority of nonelderly uninsured Pennsylvanians in 2014 had at least one full-time worker in their household (72%) and had income below 400% of the FPL (88%). Two-thirds (66%) of nonelderly uninsured Pennsylvanians identified as White, 16% identified as Black, 14% identified as Hispanic (Figure 7). Additionally, Figure 16 (Appendix) demonstrates that the uninsured rate varies across counties in Pennsylvania.
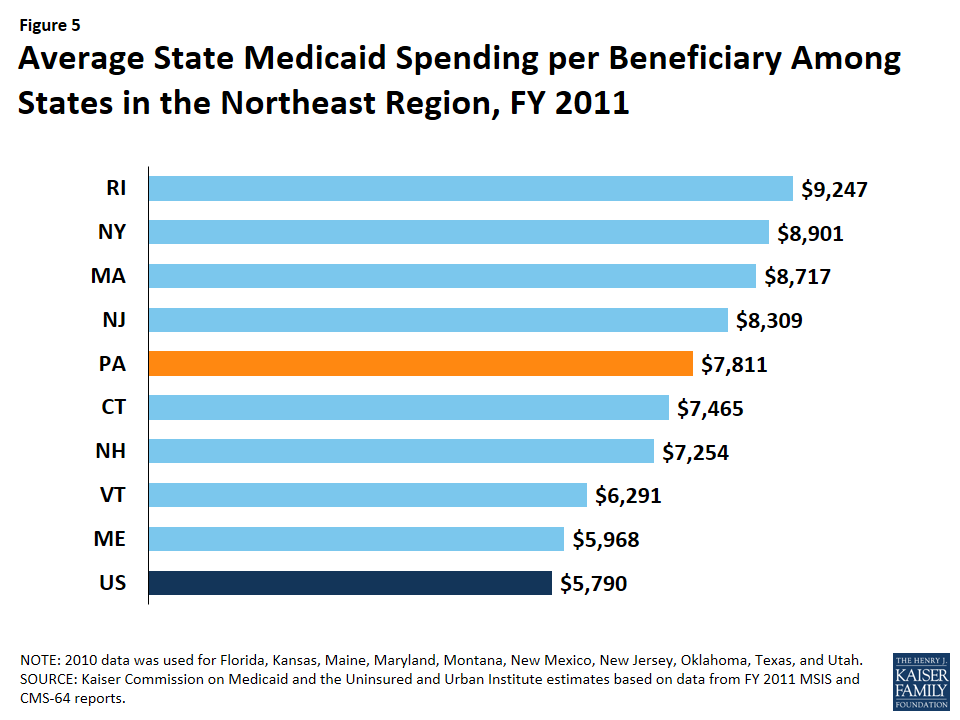
Figure 5: Average State Medicaid Spending per Beneficiary Among States in the Northeast Region, FY 2011
15% of Pennsylvanians, almost two million beneficiaries, were enrolled in Medicare in 2014.23 Medicare consists of four parts: Part A, Part B, Part C, and Part D. Together considered traditional Medicare, Part A covers inpatient hospital and skilled nursing facility stays, some home health visits, and hospice care, and Part B covers physician visits, outpatient services, preventive services, and some home health. In 2014, 904,000, or 39%, of Pennsylvania’s Medicare beneficiaries are enrolled in a private plan through Part C, also known as Medicare Advantage.24,25 Medicare Part D covers outpatient prescription drugs through private plans that contract with Medicare, including both stand-alone prescription drug plans (PDPs) and Medicare Advantage drug plans (MA-PD plans). Today, over one million Pennsylvanians are currently enrolled in a PDP.
Children in Pennsylvania with family incomes above Medicaid eligibility levels26 are covered through the state’s separate CHIP program. In 1992, House Bill 20, the Children’s Health Insurance Act, created Pennsylvania’s Children’s Health Insurance Program (CHIP).27 This program was used as the model for the federal government’s State Children’s Health Insurance Program (SCHIP) program created in 1997. In Pennsylvania, families with incomes above 208% FPL are required to pay premium and co-payment amounts as determined by the state for children enrolled in CHIP.28 As required by the ACA, the state increased Medicaid eligibility limits in 2014 for all children, regardless of age, causing some children enrolled in CHIP coverage to be moved to Medicaid coverage. These children are called “stair-step kids” and are still funded at CHIP levels.29
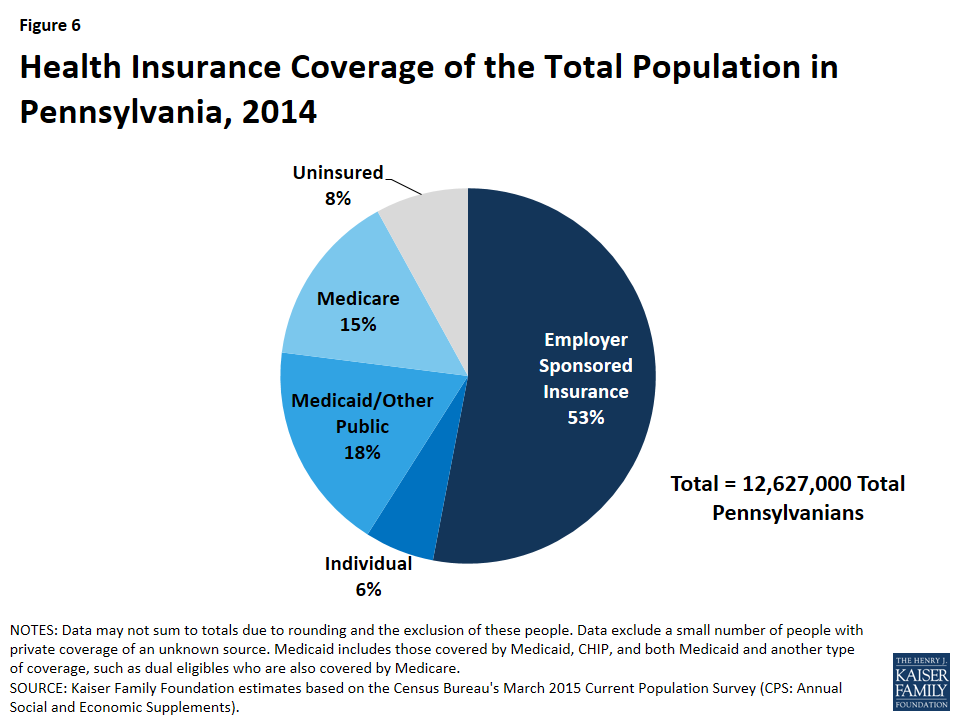
Figure 6: Health Insurance Coverage of the Total Population in Pennsylvania, 2014
Pennsylvanians were more likely to report difficulty affording health care and problems with medical bills compared to the US overall. Over half (52%) of Pennsylvanians surveyed reported that it was very or somewhat difficult for their family to afford health care, versus 42% in the U.S. overall. Among Pennsylvanians with insurance, 21% reported that deductibles and 18% reported that premiums posed the greatest financial burden. These shares were higher than for the US overall, where 17% said deductibles and 14% said premiums were the biggest financial burden. Relatedly, Pennsylvanians were more likely to report skipping or delaying health care, including skipping dental care or check-ups, not filling a prescription, or relying on home remedies/over the counter drugs instead of visiting the doctor, due to cost than the general public (57% vs. 50%). Pennsylvanians were also more likely to report problems paying medical bills compared to the general public (36% vs. 26%) (Figure 8).30
Implementation of the Affordable Care Act in Pennsylvania
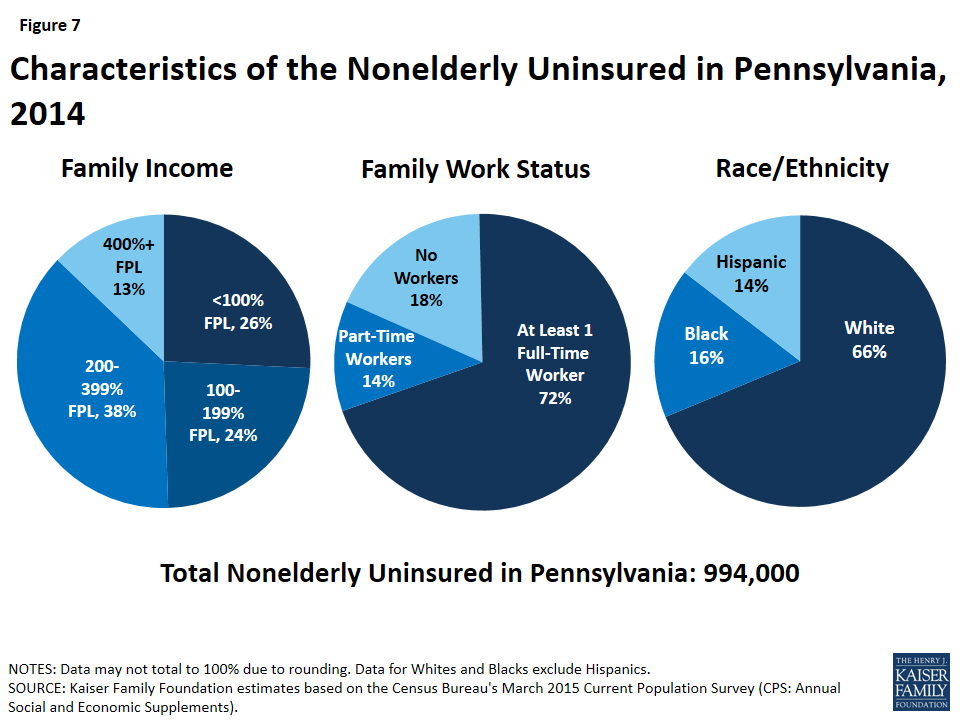
Figure 7: Characteristics of the Nonelderly Uninsured in Pennsylvania, 2014
A main goal of the ACA was to decrease the number of uninsured people, including many of the 1.2 million Pennsylvanians who were uninsured prior to ACA implementation. The ACA accomplished this through market insurance reforms and by establishing new coverage pathways, including providing premium subsidies to most individuals with incomes up to 400% FPL to purchase coverage on the Health Insurance Marketplace and an expansion of Medicaid to cover nearly all nonelderly adults up to 138% FPL ($16,394 per year for an individual or $27,820 for a family of three in 2016). The Supreme Court decision on the ACA’s constitutionality effectively made the adult Medicaid expansion a state option.31
Pennsylvania implemented the ACA in two parts: the health insurance Marketplace in January 2014 and the Medicaid expansion in January 2015. Former-Governor Tom Corbett elected to have the state implement the Medicaid expansion on January 1, 2015 through a Section 1115 waiver. After taking office in January 2015, current Governor Tom Wolf continued the implementation under a traditional Medicaid expansion rather than the previously negotiated waiver.
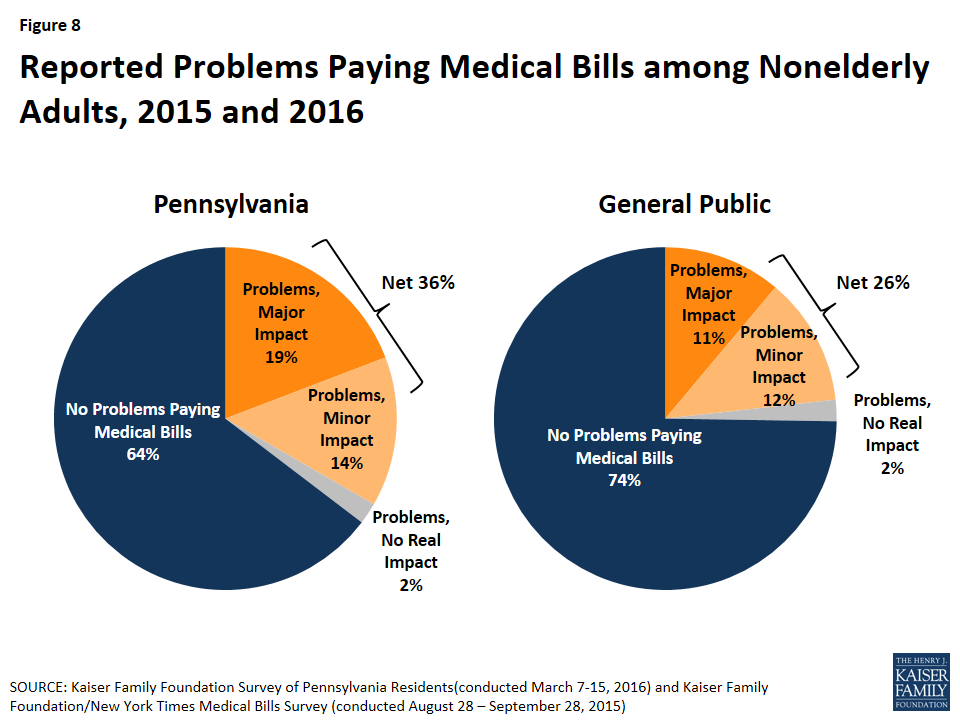
Figure 8: Reported Problems Paying Medical Bills among Nonelderly Adults, 2015 and 2016
Following implementation of the ACA, the uninsured rate in Pennsylvania decreased from 14% in 2013 to 10% in 2015 (Figure 9). Most of this decrease occurred between 2013 and 2014, coinciding with the availability of Marketplace coverage. Within the nonelderly population, nonelderly adults (adults aged 18-64) saw a large decrease in their uninsured rate, reflecting that changes in coverage under the ACA were implemented to increase coverage for this population. Between 2013 and 2015, the uninsured rate for nonelderly adults decreased 5 percentage points from 16% to 11%.
Compared to Medicaid expansion states as a whole, a higher share of uninsured Pennsylvanians remain eligible for coverage as of early 2015, reflecting that Pennsylvania implemented the Medicaid expansion a year after most other states. Sixty-six percent of the uninsured in Pennsylvania were eligible for some financial assistance to obtain health coverage, compared to 58% in all Medicaid expansion states (Figure 10). In Pennsylvania, almost one in five (18%) were eligible for premium tax credits to help them purchase private coverage in the Marketplace, and nearly half (48%) were eligible for Medicaid and CHIP.32 The majority of individuals eligible for Medicaid are adults, reflecting the increased eligibility levels afforded by the Medicaid expansion.
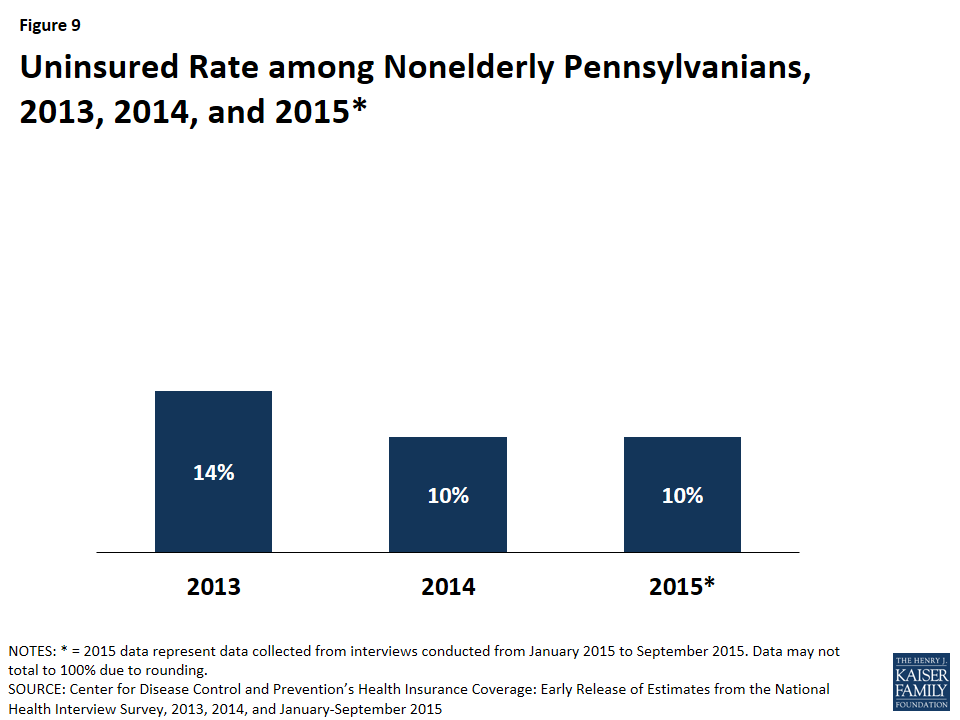
Figure 9: Uninsured Rate among Nonelderly Pennsylvanians, 2013, 2014, and 2015*
As part of the ACA, all states are required to implement new, simplified eligibility and enrollment processes, and Pennsylvania has made progress in implementing some of these changes. As of January 2016, individuals in Pennsylvania can apply for both Medicaid and Health Insurance Marketplace coverage through multiple pathways, including in-person, over the phone, by mail, and online.33 There is room for improvement in processing applications in that the state reports that less than 25% of application determinations are being completed in real-time and less than 25% of renewals are completed using ex-parte strategies. 34 Focus group participants in March 2016 who had applied for Medicaid coverage through the state’s online portal, COMPASS, reported the process was quick and the system was easy to navigate.35
Health Insurance Marketplace
Pennsylvanians are able to shop for health plans through HealthCare.gov, the federal Health Insurance Marketplace. Pennsylvania is one of 34 states in which the federal government has established and is running the Health Insurance Marketplace.36 Premiums for Marketplace coverage vary across Pennsylvania, but all remain below the national average (Figure 11). Focus group participants with Marketplace coverage in Pennsylvania were positive about their ACA coverage and grateful for health insurance. However, they had difficulty weighing plan options, including the impact of tiered insurance networks, with many reporting having to switch plans every year. Marketplace participants also reported that they struggled with out-of-pocket costs and the financial impacts of medical bills. 37
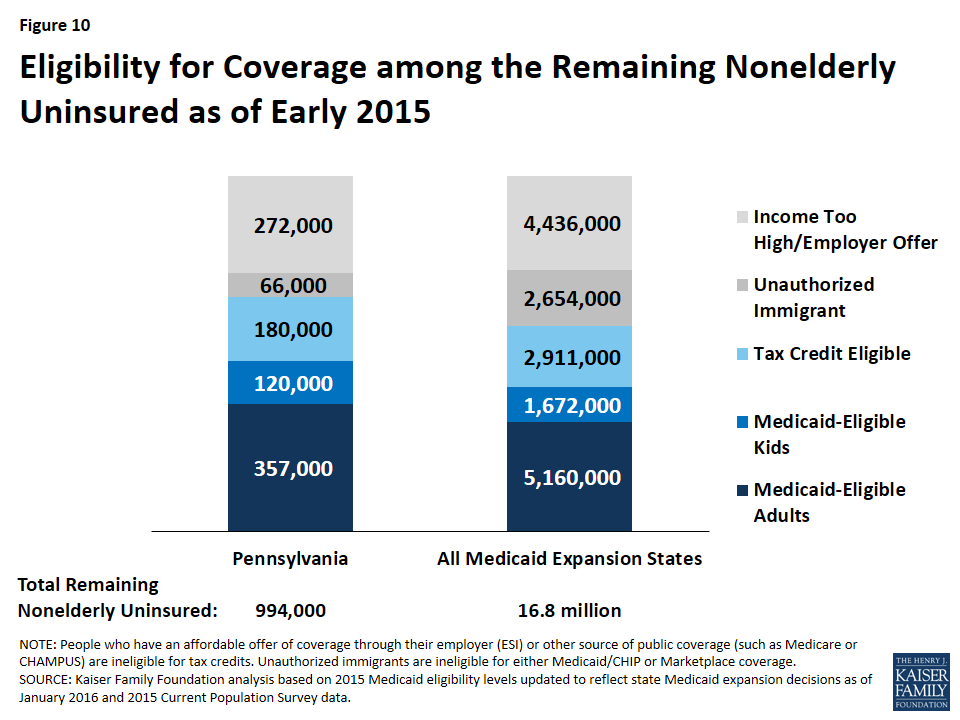
Figure 10: Eligibility for Coverage among the Remaining Nonelderly Uninsured as of Early 2015
On February 1, 2016, at the end of the Marketplace’s third open enrollment period, 439,000 Pennsylvanians had selected a Marketplace plan, three quarters (75%) of whom were eligible for premium subsidies to purchase coverage.38 One third (33%) of Marketplace enrollees in Pennsylvania were under age 35.39 Over one third (37%) of Pennsylvanians enrolled in Marketplace coverage were new customers, down from 41% during the Marketplace’s second open enrollment period.40 Among all states, Pennsylvania had the 14th largest share of the potential Marketplace population enrolled in a Marketplace plan as of February 2016 (49% vs. 46% in the US) and was tied with Vermont with the fifth largest share in the Northeast, above Connecticut, Rhode Island, and New York (Figure 12).
Support for outreach and enrollment in Pennsylvania is being provided by the federal government and private organizations. In 2015, six organizations received $3.1 million in navigator grant funds from the federal government to provide enrollment assistance to consumers in the state (Table 3). Two of these six organizations, Pennsylvania Mental Health Consumers’ Association (PMHCA) and Pennsylvania Association of Community Health Centers (PACHC), operate statewide and have been awarded grants for all three open enrollment periods.41 Since 2013, federal funding for consumer assistance in Pennsylvania has increased by over $400,000 and the number of organizations increased from four to six.
| Table 3: Navigator Grant Recipients, their Funding Levels, and Percent of Total Grants Distributed, 2013-2015 | |||
| Organization | 2013 Funding | 2014 Funding | 2015 Funding |
| Total Funding Level | $2,709,185 | $2,407,734 | $3,123,494 |
| Consumer Health Coalition | — | $505,000 | $727,118 |
| Mental Health America (MHA) | $547,754 | — | — |
| National Healthy Start Association | — | $163,166 | — |
| Penn Asian Senior Services | — | $255,000 | $290,061 |
| Pennsylvania Association of Community Health Centers (PACHC) | $739,005 | $809,943 | $946,649 |
| Pennsylvania Mental Health Consumers’ Association (PMHCA) | $424,625 | $424,625 | $503,759 |
| Public Health Management Corporation | — | — | $390,907 |
| Resources for Human Development (RHD) | $997,801 | — | — |
| Young Women’s Christian Association of Pittsburgh | — | $250,000 | $265,000 |
| NOTE: “–“denotes that that organization was not a Navigator grant recipient in that year. SOURCE: Center for Consumer Information and Insurance Oversight, 2013, 2014, and 2015 Navigator Grant Recipients, https://www.cms.gov/cciio/programs-and-initiatives/health-insurance-marketplaces/assistance.html |
|||
Medicaid Expansion in Pennsylvania
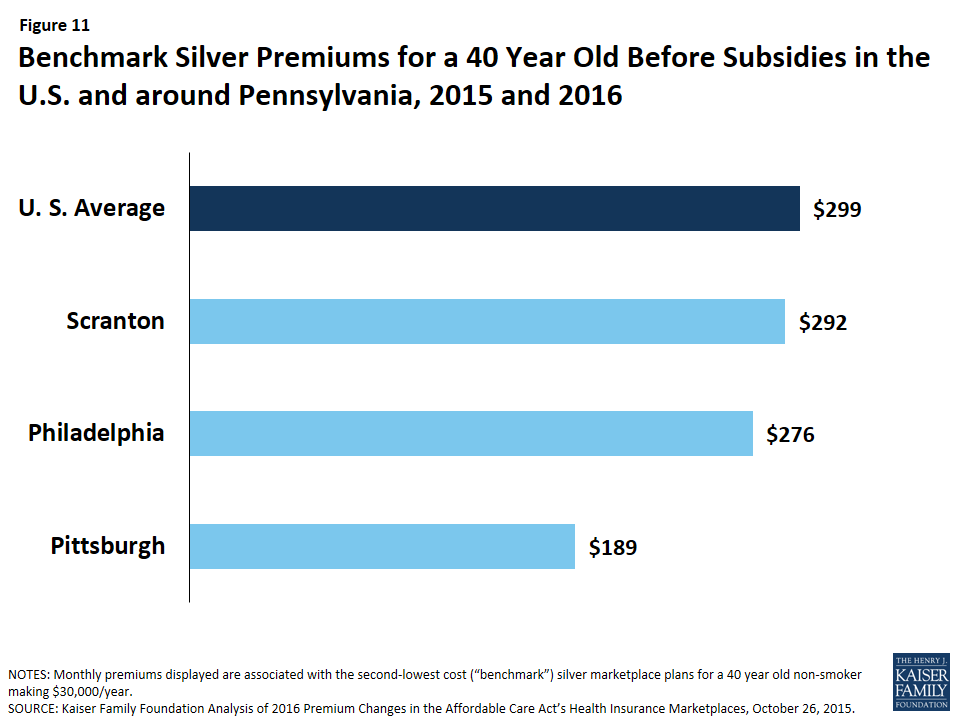
Figure 11: Benchmark Silver Premiums for a 40 Year Old Before Subsidies in the U.S. and around Pennsylvania, 2015 and 2016
Pennsylvania is one of 32 states currently adopting the ACA Medicaid expansion.42 While most states implemented the Medicaid expansion on January 1, 2014, former Governor Tom Corbett received approval in August 2014 to implement the Medicaid expansion through a Section 1115 demonstration called Healthy Pennsylvania. Coverage under the waiver became effective January 1, 2015. However, newly-elected Goveror Tom Wolf announced in February 2015 that Pennsylvania would withdraw the Healthy Pennsylvania waiver and related benefit change requests from Centers for Medicare and Medicaid Services (CMS) and instead implement a traditional Medicaid expansion called Health Choices. The transition from Healthy Pennsylvania to Health Choices was completed in the summer of 2015.43
With the adoption of the Medicaid expansion, eligibility levels for parents and childless adults have increased (Figure 13). As a result of the coverage expansion on January 1, 2015, Pennsylvania increased parent eligibility from 38% of the federal poverty level (FPL) in 2014 to 138% FPL in 2015. Similarly, eligibility levels for childless adults increased from 0% to 138% FPL. Eligibility levels for children and pregnant women remain higher at 319% FPL (through a separate CHIP program) and 220% FPL, respectively.
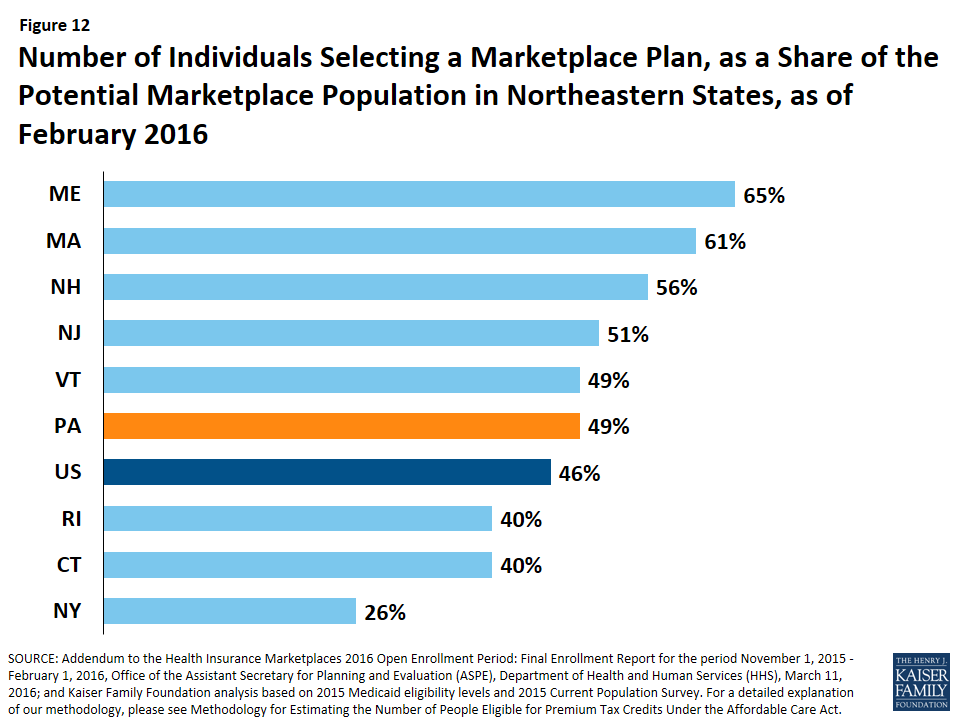
Figure 12: Number of Individuals Selecting a Marketplace Plan, as a Share of the Potential Marketplace Population in Northeastern States, as of February 2016
Between Summer 2013 and January 2016, Medicaid enrollment in Pennsylvania increased by 15%, or over 368,000 individuals.44 The majority of that increase (239,200 individuals) occurred between December 2014 and June 2015 as a result of the Medicaid expansion that took effect January 1, 2015 in Pennsylvania. While children remain a substantial share of total enrollment, the share of children has decreased from 53% of total enrollment in December 2014 to 49% in January 2016.45
Focus group participants in March 2016 reported positive experiences with their Medicaid coverage. Specifically, they reported being able to find doctors and access needed care and noted that costs were minimal with Medicaid, which was important to them because they felt they had no capacity to take on new costs. 46
Delivery System and the Safety Net
Pennsylvania is in the process of reforming its payment and delivery system to promote new care delivery models focused on multi-payer approaches with patient, provider and payer interest. In February 2013, Pennsylvania was awarded a $1.5 million State Innovation Model (SIM) Model Design grant by CMS to develop a State Health Care Innovation Plan that would improve care quality and reduce costs for patients and emphasize population health management and coordination with public health and social supports.47 Implementing and expanding new payment models, such as Accountable Provider Organizations (APO) and Patient-Centered Medical Homes (PCMH), would allow the state to provide “super-utilizers” with the appropriate services through community-based care teams.48 Pennsylvania plans to expand its use of telemedicine to bring outpatient and inpatient care to underserved and rural parts of the state. The state also plans to expand its use of health information technology and data usage to improve provider performance, allow insurers to track accountability and modify payment, and inform consumer’s provider choices. By creating a Healthcare Transformation Support Center that will provide training courses, including medical home training, and disseminate best practices to providers throughout the state, the state plans to strengthen the workforce. It also plans to use the enhanced telemedicine infrastructure to create the Pennsylvania Health Learning Network, which will provide primary care physicians with access to trainings and consulting services with specialists on complex patients. In December 2014, the state was awarded another $3 million SIM Model Design grant to continue refining the plan proposed in Round One.49
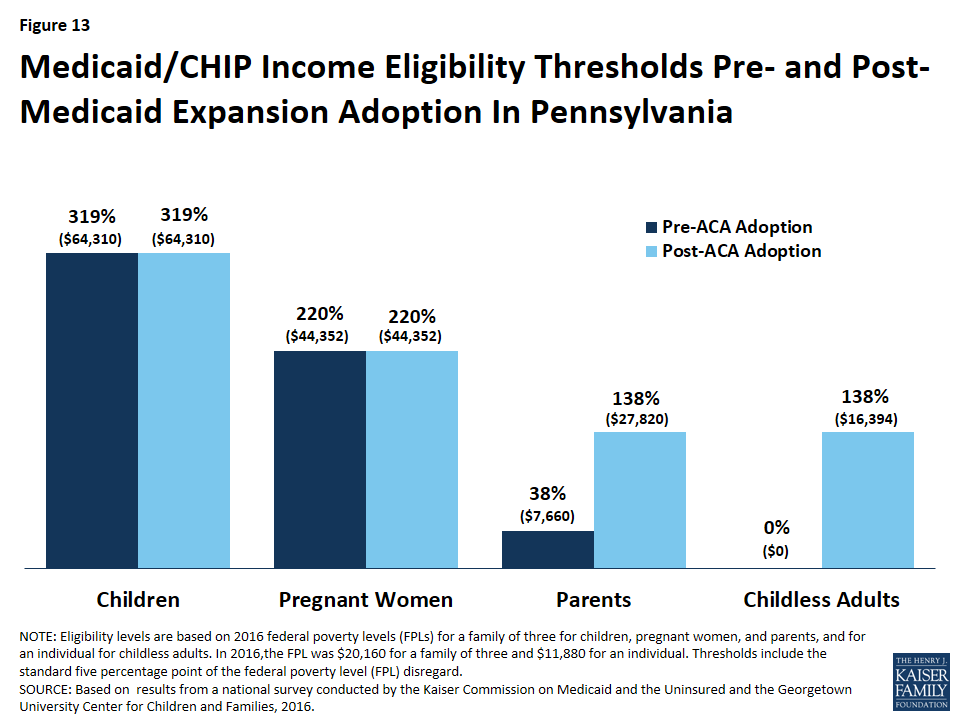
Figure 13: Medicaid/CHIP Income Eligibility Thresholds Pre- and Post- Medicaid Expansion Adoption In Pennsylvania
Large provider organizations play important roles in both insuring patients and delivering care to Pennsylvanians. Geisinger Health System in northeast and central Pennsylvania and the University of Pittsburgh Medical Center (UPMC) in western Pennsylvania are both health care systems that expanded into providing insurance, including Medicaid managed care plans, in their respective geographic locations. Geisinger Health System is a physician-led fully integrated health services organization that serves over 3 million residents across 48 counties in Pennsylvania and insures almost 493,000 people through Geisinger Health Plan.50 In 2007, Geisinger expanded into research by opening its Center for Health Research to investigate a wide range of subjects including obesity, chronic rhinosinusitis, overactive bladder, and veterans’ mental health.
Most Medicaid beneficiaries are enrolled in managed care plans for physical health. In Pennsylvania, 70% of the total Medicaid population are enrolled in one of the state’s nine managed care plans.51 Of the nine managed care plans, five are owned by a multi-state parent firm, including three owned by Independence Blue Cross and one owned by Aetna.52 Almost half (49%) of Medicaid MCO beneficiaries in Pennsylvania are enrolled in a plan owned by a multi-state parent firm.53 Additionally, two plans are run by local health care systems, Geisinger Health Plan and UPMC Health Plan, Inc. Together, these two plans insure one quarter (25%) of Pennsylvania Medicaid beneficiaries enrolled in a managed care plan. Behavioral health services in Pennsylvania are administered through county Mental Health and Developmental Services (MH/DS) program offices. These offices serve as a referral source, and most services are delivered by plans and local providers that contract with the county.54
In July 2015, after releasing a request for information (RFI), Pennsylvania received public comments and responses to help the state develop new procurements for the provision of Medicaid managed care for physical health. As a result, the state plans to incorporate ways to improve coordination between physical and behavioral health services, expand value-based purchasing and team-based approaches to care delivery, and promote community-based public health initiatives into the managed care contracts.55
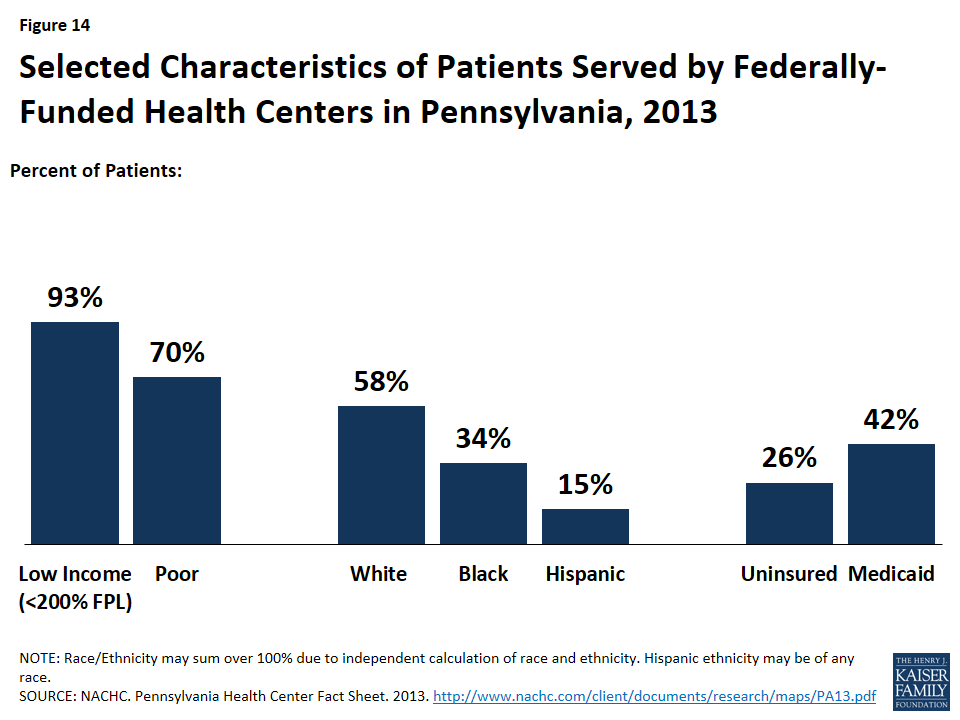
Figure 14: Selected Characteristics of Patients Served by Federally-Funded Health Centers in Pennsylvania, 2013
Pennsylvania’s safety net providers continue to play an important role in delivering health care to the state’s vulnerable populations. Pennsylvania’s community health centers and hospitals provide access to primary, preventive, and acute care services for low-income and underserved residents. Pennsylvania is home to 40 federally qualified health centers (FQHCs), which operate 257 sites throughout the state. In 2013, the state’s FQHCs saw over 680,000 patients and provided nearly 2.3 million patient visits.56 Over a quarter (26%) of their patients were uninsured and 42% had Medicaid coverage (Figure 14). Nearly all (93%) had incomes below 200% FPL, including about three-quarters (70%) who had income below the federal poverty level.
Following national trends, Pennsylvania continues to shift toward community, rather than institutional, long term services and supports (LTSS). In FY 2013, Pennsylvania’s Medicaid program spent $8.3 billion on LTSS, devoting approximately 42%, or $3.5 billion, to home and community-based services (HCBS).57 The share of LTSS dollars that have been devoted to HCBS increased from 30% in FY 2008 to 42% in FY 2013, which mirrors a national shift toward serving more people in home and community-based settings rather than institutions. This is due in large part to beneficiary preferences for HCBS, the fact that HCBS typically are less expensive than comparable institutional care, and states’ community integration obligations under the Supreme Court’s Olmstead decision.58
In December 2014, the State’s Long-Term Care Commission released a summary of Medicaid and state-only funded LTSS programs for older adults and adults with physical disabilities, as well as several recommendations for improving care coordination, service delivery, quality, outcomes, and fiscal sustainability, in its final report.59 In February 2015, through a combination of executive, budget and legislative actions, Governor Wolf announced a joint initiative between the Department of Human Services and the PA Department of Aging that would “provide choices for seniors, efficiencies in home and community-based care delivery, and protections so that seniors receive the high quality of care that they seek in their homes.”60 Other rebalancing initiatives taken up by the state include the Medicaid Money Follows the Person Demonstration and Balancing Incentive Program, which are both time-limited and offer enhanced federal funding.61As recommended in the Commission’s final report, the State plans to implement Medicaid managed LTSS for seniors in 2016, which has historically been covered under fee-for-service.
There are unmet needs for care in Pennsylvania. As of April 2014, Pennsylvania had 159 primary care Health Professional Shortage Areas (HPSA), and 64% of the primary health care need in Pennsylvania was being met.62 The state had 116 mental health and 160 dental HPSAs, and about 60% of the need for mental health care and 40% of the need for dental services was being met. As of 2014, Pennsylvania ranked 4th in the country for the ratio of medical students to 100,000 population (63.5 in Pennsylvania, compared to 30.3 nationally).63 However, Pennsylvania ranked 36th among states in the percentage of physicians completing graduate medical education in the state who remain in-state to practice (41%). Pennsylvania is one of 17 states with licensure laws that limit the autonomy of nurse practitioners in at least one area of practice.64
Looking Ahead
With 12.7 million inhabitants, health coverage and care decisions Pennsylvania make will continue to have important implications for the national healthcare landscape. Individuals who have gained coverage in the Marketplace and through Medicaid are continuing to interact with their new health plans and seek care. Meanwhile, the health care system in Pennsylvania, like all states, is evolving and changing to meet new demands as providers adapt to the changing health coverage landscape. Additionally, as more individuals gain coverage, it will be interesting to see how Pennsylvania grapples with insurance and care affordability issues Pennsylvanians have reported. As the Medicaid expansion in Pennsylvania continues in its second year of implementation, Pennsylvania will continue to enroll individuals who were previously uninsured but now eligible, and the way Pennsylvanians access care will continue to shift in the coming years.
APPENDIX
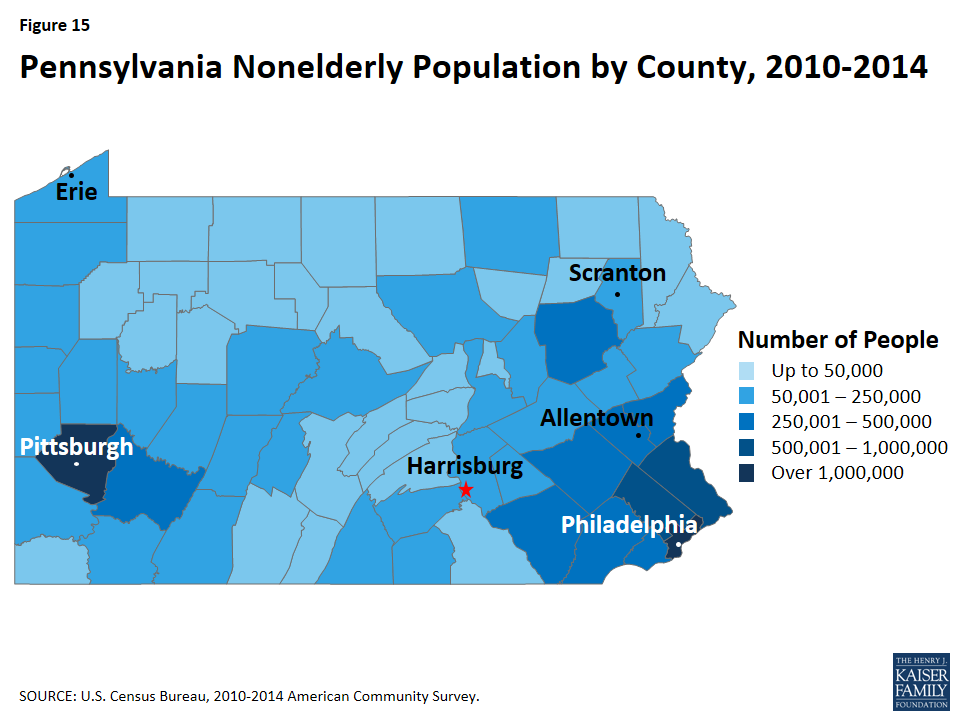
Figure 15: Pennsylvania Nonelderly Population by County, 2010-2014
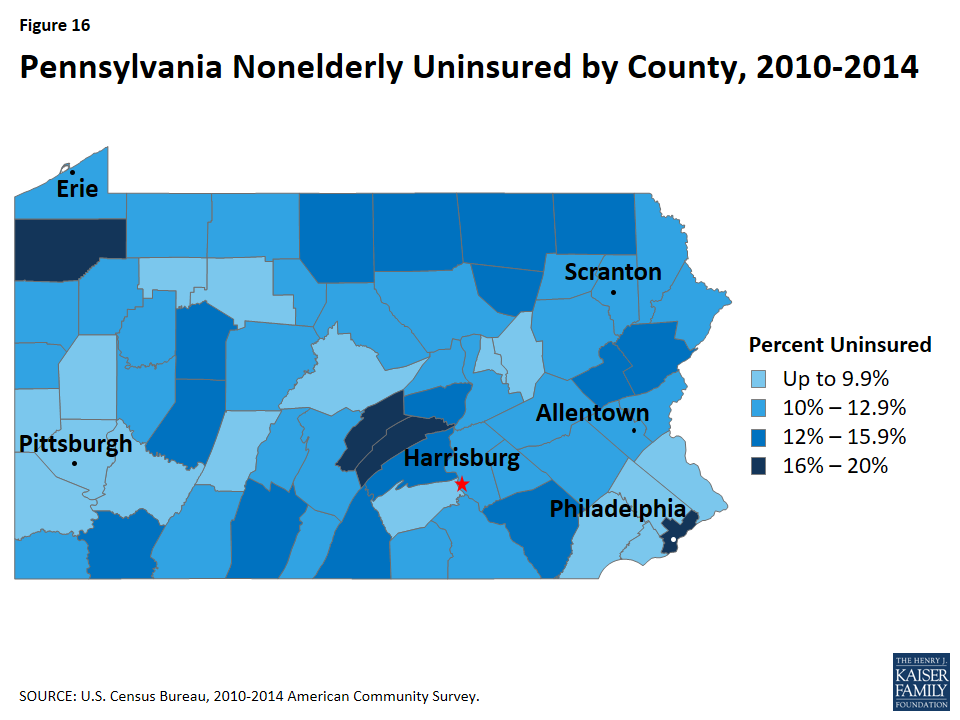
Figure 16: Pennsylvania Nonelderly Uninsured by County, 2010-2014
Endnotes
The Kaiser Family Foundation’s State Health Facts. Data Source: Kaiser Family Foundation estimates based on the Census Bureau's March 2015 Current Population Survey (CPS: Annual Social and Economic Supplement). Accessed February 10, 2016. “Total Number of Residents,” https://www.kff.org/other/state-indicator/total-residents/.
World Atlas, United States, http://www.worldatlas.com/aatlas/infopage/usabysiz.htm.
World Atlas, Pennsylvania, http://www.worldatlas.com/webimage/countrys/namerica/usstates/paland.htm.
US Census Bureau, 2010-2014 American Community Survey, County Total Population Estimates.
Counties in the Appalachia region include both rural and urban counties. For more information see, Appalachian Regional Commission, Pennsylvania Counties in Appalachia, (February 17, 2016), http://www.arc.gov/appalachian_region/Pennsylvania.asp.
United Health Care Foundation, America’s Health Rankings (2015), http://www.americashealthrankings.org/
The Commonwealth Fund. Aiming Higher: Scorecard on State Health System Performance, 2014. http://www.commonwealthfund.org/publications/fund-reports/2014/apr/2014-state-scorecard
The Centers for Disease Control and Prevention (CDC), National Center for Health Statistics, Division of Vital Statistics, National Vital Statistics Reports (NVSR) Volume 64, Number 2, Table 19, http://www.cdc.gov/nchs/data/nvsr/nvsr64/nvsr64_02.pdf.
The Centers for Disease Control and Prevention (CDC), National Center for Health Statistics, Division of Vital Statistics, National Vital Statistics Reports (NVSR) Volume 64, Number 2, Table 19, http://www.cdc.gov/nchs/data/nvsr/nvsr64/nvsr64_02.pdf.
K. Kost and S. Henshaw. “U.S. Teenage Pregnancies, Births and Abortions, 2010: National and State Trends by Age, Race and Ethnicity.” http://www.guttmacher.org/pubs/USTPtrends10.pdf.
United States Cancer Statistics (USUC), Centers for Disease Control and Prevention (CDC), 2012 State vs. National Comparisons, https://nccd.cdc.gov/USCS/statevsnational.aspx?Year=2012&Variable1=Pennsylvania
According to the Pennsylvania State Coroners Association2014 Drug Report, non-legal drugs include heroin, cocaine, and marijuana.
Pennsylvania State Coroners Association, Report on Overdose Statistics 2014 (Harrisburg, PA: Pennsylvania State Coroners Association, December 2015), http://www.pacoroners.org/Uploads/Pennsylvania_State_Coroners_Association_Drug_Report_2014.pdf
Pennsylvania Department of Health (2012) Pennsylvania Health Disparities Report 2012. Harrisburg, PA.
Pennsylvania Department of Health, Office of Health Equity. http://www.health.pa.gov/Your-Department-of-Health/Offices%20and%20Bureaus/Health%20Equity/Pages/default.aspx#.VsTilvkrJQK
U.S. Department of Health and Human Services Office of Minority Health, Pennsylvania Department of Health Office of Health Equity, http://minorityhealth.hhs.gov/omh/content.aspx?lvl=2&lvlID=14&ID=10199
University of Pittsburgh, Graduate School of Public Health, Center for Health Equity. http://www.healthequity.pitt.edu/mission.
Pennsylvania and state figures from Table 3, Civilian Labor Force and Unemployment by State and Selected Area, Seasonally Adjusted (January 26, 2016), http://www.bls.gov/news.release/laus.t03.htm. U.S. figure from Bureau of Labor Statistics, Unemployment Rate (Seasonally Adjusted) (February 17, 2016), http://data.bls.gov/cgi-bin/surveymost?bls.
U.S. Bureau of Economic Analysis, Current-Dollar GDP by State, Pennsylvania, 2014 (December 10, 2015).
Kaiser Commission on Medicaid and the Uninsured estimates based on the NASBO November 2015 State Expenditure Report (actual data for SFY 2014).
80 Fed. Reg. 73779-73782. (November 25, 2015), at https://www.gpo.gov/fdsys/pkg/FR-2015-11-25/pdf/2015-30050.pdf.
Includes individuals and families that purchased or are covered as a dependent by non-group insurance.
State Health Facts. “Health Insurance Coverage of the Total Population” (Kaiser Family Foundation, 2014), https://www.kff.org/other/state-indicator/total-population/
State Health Facts. “Medicare Advantage: Total Enrollment” (Kaiser Family Foundation, 2015), https://www.kff.org/medicare/state-indicator/total-enrollment-2/
State Health Facts. “Medicare Advantage Enrollment as a Percent of Total Medicare Population” (Kaiser Family Foundation, 2015), https://www.kff.org/medicare/state-indicator/enrollees-as-a-of-total-medicare-population/
Medicare Advantage beneficiaries can enroll in a private health plan, such as a health maintenance organization (HMO) or preferred provider organization (PPO), and receive all traditional Medicare-covered benefits covered under traditional Medicare and typically Part D benefits.
Medicaid eligibility for infants up to age one is 220% FPL; children between one and six years of age is 162% FPL; and children over age six is 138% FPL.
Pennsylvania (State). Legislature. House. No. 1992-113 Children’s Health Care Act. (HB 20). Session of 1992 (December 2, 1992). Commonwealth of Pennsylvania Legislative Reference Bureau. Web. 6 April 2015.
Tricia Brooks, Sean Miskell, Samantha Artiga, Elizabeth Cornachione, and Alexandra Gates, Medicaid and CHIP Eligibility, Enrollment, Renewal, and Cost-Sharing Policies as of January 2016: Findings from a 50-State Survey (Washington, DC: Kaiser Family Foundation’s Commission on Medicaid and the Uninsured, January 2016), https://www.kff.org/medicaid/report/medicaid-and-chip-eligibility-enrollment-renewal-and-cost-sharing-policies-as-of-january-2016-findings-from-a-50-state-survey/
Medicaid eligibility for infants up to age one increased from 185% FPL in 2013 to 220% FPL in 2014; eligibility for children between one and six years of age increased from 133% FPL in 2013 to 162% FPL in 2014; and eligibility for children over age six increased from 100% FPL in 2013 to 138% FPL in 2014.
Kaiser Family Foundation Survey of Pennsylvania Residents (Menlo Park, California: Kaiser Family Foundation, March 2016), http://files.kff.org/attachment/topline-methodology-kaiser-family-foundation-survey-of-pennsylvania-residents
MaryBeth Musumeci, A Guide to the Supreme Court’s Affordable Care Act Decision (Washington, D.C.: Kaiser Family Foundation, June 2012), https://www.kff.org/health-reform/issue-brief/a-guide-to-the-supreme-courts-affordable/.
KCMU analysis based on 2015 Medicaid eligibility levels updated to reflect state Medicaid expansion decisions as of January 2016 and 2015 Current Population Survey data
Tricia Brooks, Sean Miskell, Samantha Artiga, Elizabeth Cornachione, and Alexandra Gates, Medicaid and CHIP Eligibility, Enrollment, Renewal, and Cost-Sharing Policies as of January 2016: Findings from a 50-State Survey (Washington, DC: Kaiser Family Foundation’s Commission on Medicaid and the Uninsured, January 2016), https://www.kff.org/medicaid/report/medicaid-and-chip-eligibility-enrollment-renewal-and-cost-sharing-policies-as-of-january-2016-findings-from-a-50-state-survey/
Ibid. Real-Time Eligibility Determinations: determining the eligibility of an individual within 24 hours. Ex parte Renewals: re-determining eligibility at renewal using electronic data matches with reliable sources of data prior to requiring enrollees to complete a renewal form.
Focus groups were conducted by Kaiser Family Foundation in March 2016 with low-income Medicaid and Marketplace enrollees to learn about their experiences with their coverage. Medicaid focus group held in Philadelphia; Marketplace groups in Philadelphia and Harrisburg.
“Governor Corbett Announces State-Based Insurance Exchange Decision.” Press release from Governor Tom Corbett. December 12, 2012. http://www.prnewswire.com/news-releases/governor-corbett-announces-state-based-insurance-exchange-decision-183204971.html
Focus groups were conducted by Kaiser Family Foundation in March 2016 with low-income Medicaid and Marketplace enrollees to learn about their experiences with their coverage. Medicaid focus group held in Philadelphia; Marketplace groups in Philadelphia and Harrisburg.
Health Insurance Marketplace Open Enrollment Snapshot - Week 13, Centers for Medicare and Medicaid Services, Department of Health and Human Services (HHS), February 4, 2016, https://www.cms.gov/Newsroom/MediaReleaseDatabase/Fact-sheets/2016-Fact-sheets-items/2016-02-04.html.
Health Insurance Marketplaces 2016 Open Enrollment Period: Final Enrollment Report for the period: November 1, 2015 - February 1, 2016, Office of the Assistant Secretary for Planning and Evaluation (ASPE), Department of Health and Human Services (HHS), March 11, 2016, https://aspe.hhs.gov/sites/default/files/pdf/187866/Finalenrollment2016.pdf
Addendum to the Health Insurance Marketplaces 2016 Open Enrollment Period: Final Enrollment Report for the period: November 1, 2015 - February 1, 2016, Office of the Assistant Secretary for Planning and Evaluation (ASPE), Department of Health and Human Services (HHS), March 11, 2016, https://aspe.hhs.gov/sites/default/files/pdf/188026/MarketPlaceAddendumFinal2016.pdf
According to ASPE’s January 2016 Enrollment Report: “New Consumers” are those individuals who selected a 2016 Marketplace medical plan (with or without the first premium payment having been received directly by the issuer) as of the reporting date, and did not have a Marketplace plan selection as of November 2015.
Center for Consumer Information and Insurance Oversight, “2015 Navigator Grant Recipients”, (Centers for Medicare and Medicaid Services, May 8, 2015), https://www.cms.gov/CCIIO/Programs-and-Initiatives/Health-Insurance-Marketplaces/Downloads/Navigator-Grantee-Summaries_UPDATED_October-2015_508-MM.pdf
Medicaid Expansion in Pennsylvania: Transition from Waiver to Traditional Coverage, (Washington, D.C.: Kaiser Family Foundation, August 3, 2015), https://www.kff.org/medicaid/fact-sheet/medicaid-expansion-in-pennsylvania/
Pennsylvania Department of Human Services News Release, “Pennsylvania Releases Detailed Medicaid Expansion Timeline,” (March 9, 2015), http://listserv.dpw.state.pa.us/scripts/wa.exe?A3=ind15&L=NEWS-RELEASES&E=quoted-printable&P=496868&B=--_000_390C74D65912E345AFF2FFADF656E68DFD7D72C430ENHBGMBX02PAL_&T=text%2Fhtml;%20charset=us-ascii&XSS=3
State Health Facts. “Total Medicaid and CHIP Child Enrollment, Summer 2013 to December 2015” (Washington, D.C.: Kaiser Family Foundation, February 18, 2016), https://www.kff.org/health-reform/state-indicator/total-monthly-medicaid-and-chip-enrollment/.
State Health Facts. “Monthly Child Enrollment in Medicaid and CHIP, Summer 2013 to December 2015” (Washington, D.C.: Kaiser Family Foundation, February 18, 2016), https://www.kff.org/other/state-indicator/total-medicaid-and-chip-child-enrollment/.
Focus groups were conducted by Kaiser Family Foundation in March 2016 with low-income Medicaid and Marketplace enrollees to learn about their experiences with their coverage. Medicaid focus group held in Philadelphia; Marketplace groups in Philadelphia and Harrisburg.
CMS, “State Innovation Models Initiative: Model Design Awards Round One,” (accessed February 19, 2016) http://innovation.cms.gov/initiatives/state-innovations-model-design/
“Pennsylvania State Health Care Innovation Plan” (December 2013), http://astho-sim.wikispaces.com/file/view/Pennsylvania-State%20Innovation%20Plan%20%282%29%20%283%29.pdf/540903688/Pennsylvania-State%20Innovation%20Plan%20%282%29%20%283%29.pdf.
CMS, “State Innovation Models Initiative: Model Design Awards Round One,” (accessed February 195, 2016) http://innovation.cms.gov/initiatives/state-innovations-model-design/.
Geisinger Health System, Transforming Health Care through Innovation 2014 System Report, https://www.geisinger.org/pages/newsroom/includes/pdf/ar-final-2014.pdf
State Health Facts. “Medicaid Managed Care Penetration Rates by Eligibility Group” (Washington, D.C.: Kaiser Family Foundation, July 1, 2015), https://www.kff.org/medicaid/state-indicator/managed-care-penetration-rates-by-eligibility-group/.
State Health Facts. “Medicaid MCOs and their Parent Firms” (Washington, D.C.: Kaiser Family Foundation, March 2015), https://www.kff.org/other/state-indicator/medicaid-mcos-and-their-parent-firms/.
Pennsylvania Department of Human Services, “Monthly Physical Health Managed Care Program Enrollment Report, December 2015” (February 19, 2016), http://www.dhs.pa.gov/cs/groups/webcontent/documents/document/c_221673.pdf.
Pennsylvania Department of Human Services, “County Mental Health System,” (March 17, 2016), http://www.dhs.pa.gov/provider/mentalhealth/countymentalhealthsystem/index.htm#.VusEvKcrIdU
Department of Human Services, HealthChoices RFI Major Themes or Comments, July 20, 2015, http://www.dhs.pa.gov/cs/groups/webcontent/documents/document/c_199643.pdf.
National Association of Community Health Centers, Pennsylvania Health Center Fact Sheet, http://www.nachc.com/client/documents/research/maps/PA13.pdf.
Steve Eiken, Kate Sredl, Brian Burwell, Paul Saucier, Medicaid Expenditures for Long-Term Services and Supports (LTSS) in FY 2013: Home and Community-Based Services were a Majority of LTSS Spending, (Centers for Medicare and Medicaid Services and Truven Health Analytics, June 308, 2015), https://www.medicaid.gov/medicaid-chip-program-information/by-topics/long-term-services-and-supports/downloads/ltss-expenditures-fy2013.pdf.
The Olmstead decision found that the unjustified institutionalization of persons with disabilities violates the Americans with Disabilities Act. Olmstead v. L.C. 527 U.S. 581 (1999), http://www.law.cornell.edu/supct/html/98-536.ZS.html.
Pennsylvania Department of Human Services, “Long Term Care Commission Final Report” (December 2014), http://www.dhs.state.pa.us/cs/groups/webcontent/documents/report/c_134443.pdf
Governor Tom Wolf. “Governor Announces Initiative to Improve Home- and Community-Based Care Services for Seniors in Pennsylvania.” February 27, 2015. http://www.governor.pa.gov/Pages/Pressroom_details.aspx?newsid=1574#.VP3A-fx4p9U
The Affordable Care Act created the Balancing Incentive Program to provide financial incentives to states to implement certain structural reforms to increase access to Home and Community Based Services (HCBS) as an alternative to institutional care. Pennsylvania was one of 21 states approved to participate in the Balancing Incentive Program (State Health Facts, Balancing Incentive Program (Kaiser Family Foundation, Oct. 2015), https://www.kff.org/medicaid/state-indicator/balancing-incentive-program/).
- Bureau of Clinician Recruitment and Service, Health Resources and Services Administration (HRSA), U.S. Department of Health & Human Services, HRSA Data Warehouse: Designated Health Professional Shortage Areas Statistics, as of April 28, 2014, https://datawarehouse.hrsa.gov/Tools/HDWReports/Reports.aspx
Association of American Medical Colleges, Pennsylvania Physician Workforce Profile 2014, https://www.aamc.org/download/447222/data/pennsylvaniaprofile.pdf.
American Association of Nurse Practitioners, State Practice Environment 2015, https://www.aanp.org/images/documents/state-leg-reg/stateregulatorymap.pdf.
