The Utah Health Care Landscape
Demographics
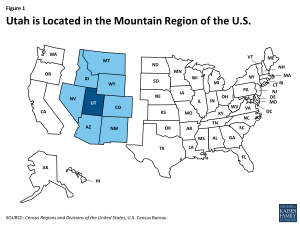
Utah is home to just over 2.8 million people, making it the 33rd most populous state in the U.S.1 At over 82,000 square miles, Utah is the 12th largest state, but ranks 41st in population density.2 Utah is land-locked and is one of the eight states located in the country’s Mountain region (Figure 1).3 Utah’s topography is diverse. The Rocky Mountains run through the middle of the state, with the flat lands and deep river canyons of the Colorado Plateau to the East and South and salt beds and lakes, including Great Salt Lake, to the North and West.4 Utah is home to five National Parks, the third most of any state behind Alaska and California.5
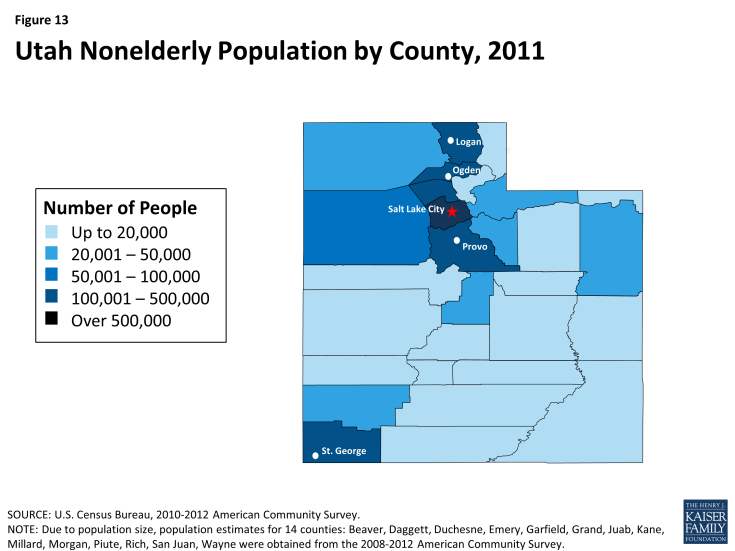
Utah is a mostly rural state but the majority of the population lives in urban areas. Among the state’s 29 counties, only 7 had nonelderly populations that met or exceeded 50,000 in 2012 (See Figure 13, Appendix).6 Eighty-nine percent of the state’s population lives in urban areas and 37% of the total state population lives in Salt Lake City County.7 With an unemployment rate of 3.6% in July 2014, Utah has the second lowest unemployment rate in the country after North Dakota and equal to Nebraska, which is lower than the U.S. average of 6.2%.8
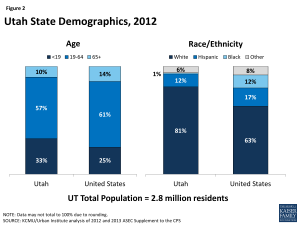
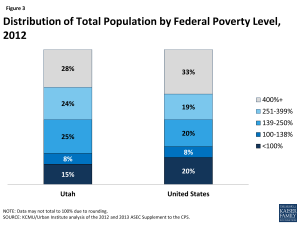
The age distribution of Utah residents is younger than the U.S. overall and people of color make up a smaller share of the state’s population. More than eight in ten (81%) Utah residents identify as White, compared to 12% who identify as Hispanic and 1% who identify as Black (Figure 2).9 Ninety-five percent of Utah residents are U.S. citizens.10 Utah is a young state, with one third of its population, or nearly 939,000 individuals, under 19 years of age.11 More than one in seven individuals in Utah (15%) are living in poverty (have income below 100% of the federal poverty level (FPL) or $11,670 for an individual, $19,790 for a family of 3 in 2014) and nearly three-quarters (72%) have family income levels below 400% FPL (Figure 3).12
However, like in other states, poverty in Utah is not equally distributed by race and age. Eleven percent of those who identified as White were living in poverty in 2012, compared to 34% of those who identified as Hispanic and 31% who identified as another race. In addition, among individuals under age 19, 19% were living in poverty, while only 14% of adults age 19-64 and 10% of adults age 65 and over were living in poverty.13
State Economy
Utah has experienced consecutive years of state economic growth. Like other states across the country, Utah experienced budgetary challenges during the recent economic downturn. However, the state’s economy continues to improve.14 In 2013, Utah’s Gross Domestic Product (GDP) was $141.2 billion, which makes it the 32rd largest economy in the U.S.15 Like many other states across the country, Utah experienced an increase in its GDP from 2012 to 2013 and Utah was among the 10 states that experienced the largest percentage increase to its state economy that year.16 Agriculture, manufacturing, and mining are major industries in the state, as well as tourism, business development, and construction.17 Utah ended State Fiscal Year (SFY) 2013 with a $242 million revenue surplus.18
Population Health
The overall population health in Utah is ranked above the national average. Utah ranked 6 among the 50 states for total population health in the United Health Care Foundation’s report, America’s Health Rankings 2013.19 Compared to other states across the country, Utah has a low prevalence of both obesity and diabetes.20,21 However, Utah has a higher share of adults who report experiencing frequent mental distress than the national average.22 Death rates due to influenza and pneumonia in Utah are higher than the national average,23 which may in part be explained by low flu shot and pneumonia vaccination rates among children under 4 years and adults 65 years and older.24 Utah’s smoking and binge drinking rates are also lower than the national average.25
Disparities in health and health care access exist in Utah. Like other states across the country, measures of health status in Utah vary by race/ethnicity and patterns across these measures in Utah are similar to national averages. Despite low obesity rates statewide, those who identify as Black or Hispanic (both 26%) are slightly more likely to be obese than those who identify as White (24%).26 Hispanics (32%) are less likely than Whites (39%) or Blacks (38%) to report experiencing frequent mental distress.27 In addition Hispanics (24%) and Blacks (17%) are more likely to report being in fair or poor overall health than Whites (12%).28 Further, Hispanics (16%) and Blacks (15%) are 1.5 times as likely to be binge drinkers as Whites (10%).29
Disparities in access to care also exist in Utah. Among Blacks and Hispanics, nearly half (both 45%) report that they do not have a usual source of care, compared to 23% of Whites.30
Coverage
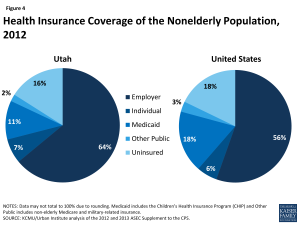
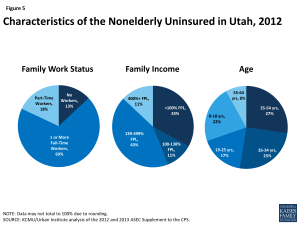
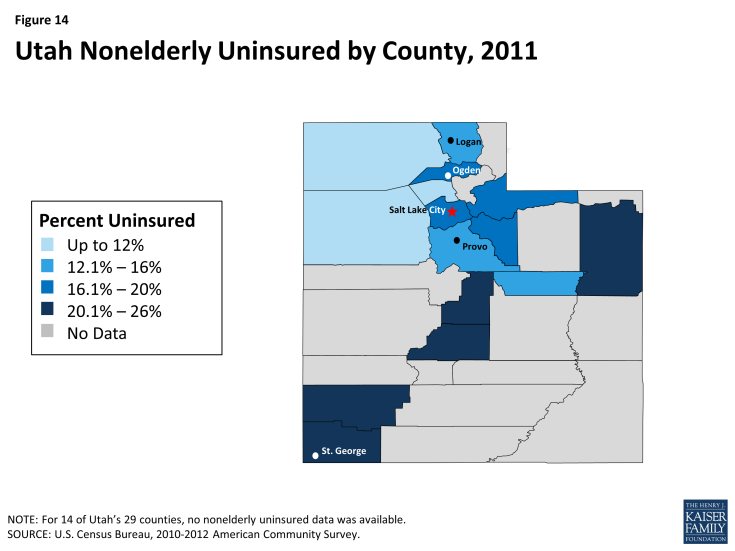
Over 400,000 people, or 16% of Utah’s nonelderly population, were uninsured in 2012.31 Among the 84% of Utahns with health insurance, the largest share (64% of the state population) have employer-sponsored coverage, followed by Medicaid (11%), and individual private insurance (7%)(Figure 4).32 Utah’s nonelderly uninsured rate is slightly lower than the national average of 18%, which reflects the range of uninsured rates across the country from 4% in Massachusetts to 24% in Texas. As shown in Figure 14 (Appendix), the nonelderly uninsured in Utah are not equally distributed across the state’s counties, with the southwest, northeast, and central counties having higher uninsured rates than other areas of the state. As in other states across the U.S., the majority of the uninsured have at least one full-time worker in their households, have income below 400% of the Federal Poverty Level, and are under age 55 (Figure 5).33
Medicaid
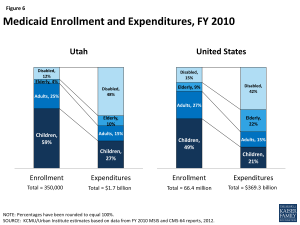
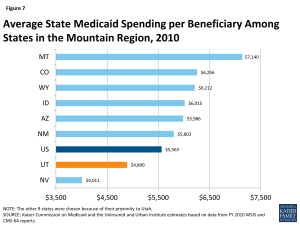
Similar to the national picture, the largest group of Medicaid enrollees in Utah is children, but the elderly and individuals with disabilities account for the most Medicaid spending. Based on data from FY 2010, children made up six in ten (59%) Medicaid enrollees in Utah, but accounted for just over one-quarter (27%) of total Medicaid expenditures (Figure 6).34 On the other hand, the elderly and people with disabilities accounted for less than one-fifth of enrollees (16%), but over half (58%) of total program costs. Average spending per beneficiary in Utah was $4,890, less than the national average of $5,563 and less than all but one state in the Mountain Region (Figure 7).35
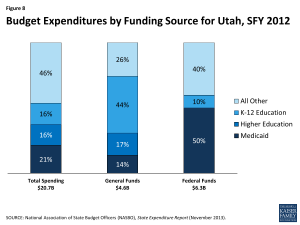
Medicaid costs are shared by the state and the federal government, with the federal government paying 70.3% of the cost of Utah Medicaid; therefore, for every $1.00 that Utah spends on Medicaid, the federal government sends $2.37 in matching funds to the state.36 Utah also provides coverage to certain groups of children up to 205% FPL through a separate CHIP program, for which the federal government pays 79.4% of the cost.37 The combined federal and state spending on Medicaid in Utah for FY 2012 was $1.9 billion.38 This spending accounted for 21% of total state spending that year, 14% of state general fund spending, and 50% of all federal funds spent by the state (Figure 8).39 Medicaid is the third largest category of state general fund spending behind elementary and secondary education (51%) and higher education (16%); at the same time, Medicaid is the single largest source of federal funds flowing into the state.40
Utah has used a Medicaid waiver to extend coverage to certain adults. Since February 2002, Utah has had a statewide Section 1115 Medicaid Demonstration Waiver, called Utah’s Primary Care Network (PCN).41 This waiver allowed the state to reduce coverage for previously eligible parents in order to finance an expansion of a primary and preventive care benefit package for up to 25,000 uninsured adults ages 19-64 with family incomes up to 100% FPL who were not previously eligible for Medicaid. The waiver also allows the state to cover high-risk pregnant women whose income makes them ineligible for Medicaid, to provide premium assistance ($50 for an individual, $100 for a family) for adults up to 20o% FPL to help pay for approved employer coverage or COBRA, and to provide premium assistance to children up to 205% FPL who are CHIP-eligible but opt for employer coverage.42 On December 24, 2013, CMS approved an extension of the PCN waiver through December 31, 2014.43 In the approval letter, CMS specified that adults over 100% FPL who will no longer be eligible for the PCN after January 1, 2014 should be enrolled in short-term coverage in the state program and then the state should assist them with selecting new coverage in the Marketplace prior to March 31, 2014.44
Health Reform
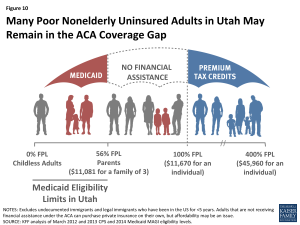
The Affordable Care Act (ACA) could provide financial assistance for coverage to a majority of nonelderly uninsured Utahns, if the state takes up the Medicaid expansion. A main goal of the ACA is to extend health coverage to many of the 47 million nonelderly uninsured individuals across the country, including many of the 407,000 uninsured Utahns. The ACA accomplishes this through insurance reforms and by establishing new coverage pathways, including the expansion of Medicaid to cover nearly all nonelderly individuals up to 138% FPL ($16,105 for an individual, $27,310 for a family of 3 in 2014), and by providing premium subsidies to most individuals with incomes up to 400% FPL, who are not eligible for other coverage, to purchase coverage on the Health Insurance Marketplace (Figure 9). As a result of the Supreme Court decision on the ACA, the Medicaid expansion is effectively a state option.45 Utah is one of 2 states still debating whether to take up the Medicaid expansion.46 Among uninsured nonelderly Utahns prior to January 2014, 15% are eligible for Medicaid or CHIP and 31% are eligible for premium subsidies under the ACA, while many remain ineligible for financial assistance (Figure 10).47
Medicaid Expansion
Without the Medicaid expansion, 58,000 currently uninsured adults who would have been eligible for Medicaid will remain in the coverage gap.48 Under the Medicaid expansion, the federal government pays 100% of the cost of coverage for those newly eligible through 2016, which will then phase down to 90% in 2020 and beyond. In May 2013, Public Consulting Group released an impact analysis for the state on the Medicaid expansion, which found that, if the state took up the Medicaid expansion in January 2014, it would save the state and counties $131 million over the first ten years and provide coverage to 123,000 previously uninsured adults.49 While the analysis predicts that expanding Medicaid would cost the state an additional $260 million through 2023, it would save the counties and state $188 million on public assistance expenditures and generate $203 million in new state and county tax revenue.50
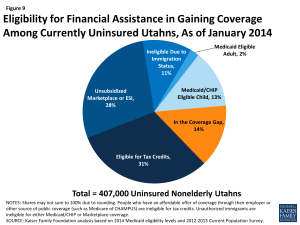
Figure 9: Eligibility for Financial Assistance in Gaining Coverage Among Currently Uninsured Utahns, As of January 2014
After agreeing to study its options regarding the Medicaid expansion decision, Utah’s Governor Gary Herbert announced in January 2014 that “doing nothing is no longer an option”. Governor Herbert released a concept paper, entitled the “Healthy Utah Plan”, in February 2014.51 This plan would require a waiver from the federal government and the details are still being discussed. The legislative session came to a close on March 13, 2014 without passing Medicaid expansion legislation. Governor Herbert has continued negotiations with CMS over the Healthy Utah Plan. Governor Herbert announced that they had reached a “conceptual agreement” on the Governor’s plan after meeting with HHS Secretary Sylvia Mathews Burwell on September 9, 2014; details and a formal waiver submission are still forthcoming.52 Should an agreement be reached before the legislative session resumes in January, Governor Herbert may call the legislature back into special session.53
Under the ACA, all states are required to streamline and simplify the enrollment process for health coverage. Regardless of a state’s Medicaid expansion decision, all states must implement new eligibility and enrollment processes under the ACA, including a transition to determining income eligibility for most groups using Modified Adjusted Gross Income (MAGI)(Figure 11).54,55 Individuals can enroll in coverage through multiple pathways, including in person, over the phone, by mail, and online. Under the new MAGI eligibility rules, the eligibility levels are 205% FPL for children, 144% FPL for pregnant women, and 56% FPL for parents in Utah.56 MAGI rules apply to coverage determinations for Medicaid and for coverage purchased in the Marketplace.
Health Insurance Marketplace
Health insurance marketplace reform was a priority in Utah prior to the Affordable Care Act. In 2008, former Governor Jon Huntsman (R) signed House Bill 133, which required the Legislature, the Department of Health, the Insurance Department, and the Governor’s Office of Economic Development to work together to develop a strategic plan for health system reform.57 Governor Huntsman signed House Bill 188 in 2009, which paved the way for the newly created Office of Consumer Health Services to expand health insurance access and increase market flexibility and transparency through the creation of the Utah Health Exchange.58 The Utah Health Exchange, which was later renamed Avenue H in 2012, was set up as a small business exchange to allow employers to participate in a defined contribution arrangement and compare, select, and enroll in commercial health insurance online. Upon taking office, current Governor Gary Herbert (R) signed additional health system reform legislation into law, including House Bill 294 in 2010 and House Bill 128 in 2011, the latter of which reauthorized the Health System Reform Task Force to evaluate options for bringing the state’s existing exchange into compliance with the ACA.59,60
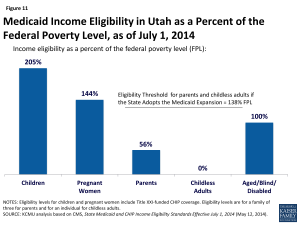
Figure 11: Medicaid Income Eligibility in Utah as a Percent of the Federal Poverty Level, as of July 1, 2014
Utah is one of 27 states in which the federal government has set up and is running the Individual Health Insurance Marketplace, meanwhile the state will continue to operate Avenue H as the marketplace for small businesses.61 In 2012, Governor Herbert negotiated with HHS over the extent to which the state would have to modify its Avenue H to comply with the ACA and operate as a State-based Health Insurance Marketplace.62 Although, Utah received conditional approval from HHS in January 2013 to run a State-based Marketplace, Governor Herbert subsequently proposed that the state maintain Avenue H as the state’s small business (SHOP) marketplace, while having the federal government run a Federally-facilitated Marketplace for individual coverage in the state.63 HHS granted approval for this proposal in May 2013.64,65
Multiple providers are offering plans in Utah’s Individual Marketplace and monthly premiums are among the lowest in the country. Six insurance providers are offering 99 Qualified Health Plans in Utah’s Individual Marketplace in 2014.66 At $209 per month, Salt Lake City has the ninth lowest monthly premium for a Benchmark Health plan among major cities across the country, before premium tax credits.67
The Affordable Care Act also provided for the establishment of Consumer Operated and Oriented Plans (CO-OPs). CO-OPs are a new type of non-profit, member-governed health insurance. They may operate locally, state-wide, or in multiple states and must be licensed as issuers in each state in which they operate. They are intended to offer more affordable, consumer friendly, and high quality health insurance options to compete with existing health insurers. CO-OPs may offer insurance both in and outside the state Marketplaces. An October 2013 analysis by the National Alliance of State Health CO-OPS (NASHCO) found that average individual premiums in the states offering CO-OPs are 8% lower than the other states.68 While CO-OPs offer the lowest premiums in some state Health Insurance Marketplaces, they offer among the highest premiums in others.69 Utah is one of 23 states currently offering CO-OPs. The state’s CO-OP, Arches Health Plan, received an $89.7 million loan from HHS in 2011 and began offering coverage January 1, 2014.70
As of April 2014, 84,601 Utahns had enrolled in Marketplace coverage. Of the anticipated 331,000 Utahns who might enroll in Marketplace coverage, 206,000 (62%) are estimated to be eligible for premium subsidies to help pay for their coverage.71 Ongoing litigation may potentially impact the availability of premium subsidies in states with Federally-facilitated Marketplaces, such as Utah; however, until the issue is resolved in court, the federal government will continue to provide premium subsidies.72 As of April 19, 2014, 84,601 individuals in Utah had selected a Marketplace plan, 73,427 (87%) of whom are receiving premium subsidies.73
Safety Net
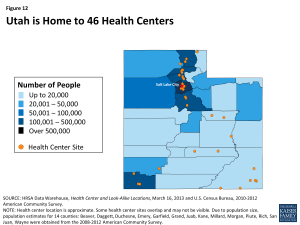
Utah’s safety net delivery system will continue to play an important role in delivering health care to the state’s vulnerable population. Utah’s community health centers and hospitals provide access to needed primary, preventive, and acute care services for low-income and underserved residents. Utah is home to 11 federally qualified health centers (FQHCs) operating 46 clinic sites throughout the state (Figure 12).74 In 2011, the state’s FQHCs saw over 112,000 patients and had over 370,000 patient visits.75 Fifty-six percent of patients were uninsured, while 19% had Medicaid.76 Three quarters were below 100% FPL.77,78 The Department of Health and Human Services awarded Utah’s 11 FQHCs $2.1 million for Fiscal Years 2013 and 2014 to assist with outreach and enrollment under the ACA.79 In 2009, the state’s Association for Utah Community Health (AUCH) was awarded a two-year CHIPRA outreach grant, through which the state was able to identify successful outreach and enrollment strategies, including the importance of both one-on-one assistance by an enrollment specialist throughout the application and enrollment process and the importance of collaboration and communication among the state’s Medicaid agency, Department of Health, and enrollment specialists.80
In addition, 42 of Utah’s hospitals received Disproportionate Share Hospital (DSH) payments in Fiscal Year 2013.81 Since Utah does not have designated safety net hospitals, DSH payments, which are intended for hospitals treating the uninsured and underinsured, provide insight into which hospitals are providing services to Utah’s low-income population. The hospitals, including 21 rural hospitals, received a total of $29.6 million in federal funds in Fiscal Year 2013.82
Despite Utah’s existing safety net, there are Health Professional Shortage Areas (HPSAs) and unmet need for care. As of July 2013, Utah had 58 primary care HPSAs and only 68% of the primary health care needs in the state was being met.83 The state had 37 mental health HPSAS and 48 dental HPSAs, and only 63% of the need for mental health and 53% of the need for dental care in the state was being met.84 Utah is one of 19 states that have reduced autonomy for nurse practitioners in at least one area of their practice, while 19 states and DC states allow nurse practitioners full autonomy and 12 states have more limited autonomy than Utah.85
Looking Ahead
Utah experienced the third fastest population growth rate of 3.3% from 2010 to 2012.86 Despite a low unemployment rate and high share of individuals with employer-sponsored coverage, more than one in seven Utahans were uninsured prior to January 1, 2014. The ACA provides the opportunity to extend coverage to the majority of these individuals; however, without the Medicaid expansion, 14% of the uninsured may remain without affordable health coverage options.
There is much to watch in Utah looking forward. Individuals who have newly gained coverage in the Marketplace are beginning to interact with their new health plans; Governor Herbert is continuing conversations with CMS to work toward a final decision on the Medicaid expansion; and the state’s safety net providers will continue to adapt to the changing health coverage landscape. It remains to be seen how these and other changes under the ACA will impact the health, health care access, and health care utilization of Utahans in the future.
Appendix
Endnotes
Urban Institute and Kaiser Commission on Medicaid and the Uninsured estimates based on the Census Bureau's March 2012 and 2013 Current Population Survey (CPS: Annual Social and Economic Supplements).
World Atlas, United States, http://www.worldatlas.com/aatlas/infopage/usabysiz.htm.
U.S. Department of Commerce, Economics, and Statistics Administration, Census Regions and Divisions of the United States (U.S. Census Bureau), http://www.census.gov/geo/maps-data/maps/pdfs/reference/us_regdiv.pdf.
World Atlas, Utah: Geography, http://www.worldatlas.com/webimage/countrys/namerica/usstates/utland.htm.
For a list of U.S. National Parks by state, see: http://www.listofusnationalparks.com/national-parks-list-by-state/.
US Census Bureau, 2010-2012 American Community Survey, County Total Population Estimates. For more information about Urban/Rural definitions, see: USDA Economic Research Service, Rural Definitions State-Level Maps: Utah (2000), http://www.ers.usda.gov/datafiles/Rural_Definitions/StateLevel_Maps/ut.pdf.
USDA Economic Research Service, State Fact Sheets: Utah, 2012 Population (February 20, 2014), http://www.ers.usda.gov/data-products/state-fact-sheets/state-data.aspx?StateFIPS=49&StateName=Utah#Pf669f4c9093d4b0a843889df2cf5c5a1_2_39iT0 and US Census Bureau, 2012 County Total Population Estimates.
Utah and state figures from Table 3, Civilian Labor Force and Unemployment by State and Selected Area, Seasonally Adjusted (August 18, 2014), http://www.bls.gov/news.release/laus.t03.htm. U.S. figure from Bureau of Labor Statistics, Unemployment Rate (Seasonally Adjusted) (August 18, 2014), http://data.bls.gov/cgi-bin/surveymost?bls.
UI/KCMU estimates based on March 2012 and 2013 CPS.
Ibid.
Ibid.
Ibid.
Ibid.
Governor’s Office of Management & Budget, Budget Information Archive, http://gomb.utah.gov/budget-policy/budget-information-archive/.
Bureau of Economic Analysis, Gross Domestic Product by State 2013 (June 11, 2014).
Bureau of Economic Analysis, Widespread But Slower Growth in 2013 (June 11, 2014), http://www.bea.gov/newsreleases/regional/gdp_state/2014/pdf/gsp0614.pdf.
Utah Economic Council, Utah Economic Outlook 2014, http://business.utah.gov/wp-content/uploads/2014UtahEconomicOutlook.pdf.
Office of Utah Governor Gary Herbert, “Governor Announces 2013 Revenue Surplus” (September 17, 2013), http://www.utah.gov/governor/news_media/article.html?article=9341.
United Health Care Foundation, America’s Health Rankings: State Ranking Overview: 2013 (2013), http://www.americashealthrankings.org/reports/annual.
The adult obesity rate in Utah in 2013 was 24.1%, the 6th lowest rate across the country. The 2011 obesity rates for 10-17 year-olds was 11.6%, the 8th lowest rate across the country (Trust for America’s Health, The State of Obesity 2014 (Robert Wood Johnson Foundation, September 2014), http://stateofobesity.org/adult-obesity/).
Only 7% of adults in Utah have been told by a doctor they have diabetes, compared to 10% nationally (KCMU analysis of the Center for Disease Control and Prevention (CDC)'s Behavioral Risk Factor Surveillance System (BRFSS) 2012 Survey Results).
In Utah, 37.9% of adults reported experiencing frequent mental distress, compared to a US average of 35.6% (KCMU analysis of the Center for Disease Control and Prevention (CDC)'s Behavioral Risk Factor Surveillance System (BRFSS) 2012 Survey Results).
In Utah, the death rate for influenza and pneumonia is 17 per 100,000, compared to 15 per 100,000 nationally (The Centers for Disease Control and Prevention (CDC), National Center for Health Statistics, Division of Vital Statistics , National Vital Statistics Reports (NVSR) Volume 61, Number 4, Table 19, May 8, 2013, http://www.cdc.gov/nchs/data/nvsr/nvsr61/nvsr61_04.pdf).
Only 71% of children (ages 19-35 months) in Utah receive their vaccinations, compared to 75% nationally (Estimated Vaccination Coverage with Individual Vaccines and Selected Vaccination Series Among Children 19-35 Months of Age by State -- U.S., National Immunization Survey, Q1/2010-Q4/2010. National Immunization Program, Centers for Disease Control and Prevention). Among those 65 and older in Utah, only 56% receive their yearly flu shot and 70% have been vaccinated against pneumonia, compared to 59% and 68% nationally (KCMU analysis of the Center for Disease Control and Prevention (CDC)'s Behavioral Risk Factor Surveillance System (BRFSS) 2012 Survey Results).
The smoking prevalence for Utah is 11%, compared to 19% nationally; the binge drinking was 11% compared to a national average of 17% (Behavioral Risk Factor Surveillance System (BRFSS) 2012 Survey Results)
Trust for America’s Health, The State of Obesity 2014 (September 2014).
KCMU analysis of 2012 BRFSS.
Ibid.
Ibid.
Ibid.
UI/KCMU estimates based on March 2012 and 2013 ASEC Supplement to the CPS.
Ibid.
Ibid.
KCMU/Urban Institute estimates based on data from FY 2010 MSIS and CMS-64 reports, 2012.
Kaiser Commission on Medicaid and the Uninsured and Urban Institute estimates based on data from FY 2010 MSIS and CMS-64 reports.
Federal Register, November 30, 2012 (Vol 77, No. 231), pp 71420-71423, at http://www.gpo.gov/fdsys/pkg/FR-2012-11-30/pdf/2012-29035.pdf.
The CHIP income eligibility limit in Utah is effectively 205% FPL, including a 5% income disregard. Martha Heberlein, Tricia Brooks, Joan Alker, Samantha Artiga, and Jessica Stephens, Getting into Gear for 2014: Findings from a 50-State Survey of Eligibility, Enrollment, Renewal, and Cost-Sharing Policies in Medicaid and CHIP, 2012-2013 (January 2013), http://www.kff.org/medicaid/report/getting-into-gear-for-2014-findings-from-a-50-state-survey-of-eligibility-enrollment-renewal-and-cost-sharing-policies-in-medicaid-and-chip-2012-2013/ and Federal Register, January 21, 2014 (Vol 79, No. 13), pp 3385-3388, http://www.gpo.gov/fdsys/pkg/FR-2014-01-21/pdf/2014-00931.pdf.
Urban Institute estimates based on data from CMS (Form 64) (September 16, 2013).
National Association of State Budget Officers (NASBO), State Expenditure Report (November 2013), http://www.nasbo.org/sites/default/files/State%20Expenditure%20Report%20%28Fiscal%202011-2013%20Data%29.pdf.
NASBO, State Expenditure Report (November 2013).
Utah’s Section 1115 Primary Care Network Medicaid Demonstration Approval Letter and Document, December 24, 2013: http://www.medicaid.gov/Medicaid-CHIP-Program-Information/By-Topics/Waivers/1115/downloads/ut/ut-primary-care-network-ca.pdf.
The CHIP income eligibility limit in Utah is effectively 205% FPL, including a 5% income disregard.
Utah’s Section 1115 Primary Care Network Medicaid Demonstration Approval Letter and Document, December 24, 2013.
Ibid.
MaryBeth Musumeci, A Guide to the Supreme Court’s Affordable Care Act Decision (Kaiser Family Foundation, June 2012), https://www.kff.org/health-reform/issue-brief/a-guide-to-the-supreme-courts-affordable/.
State Health Facts, Status of State Action on the Medicaid Expansion Decision, 2014 (August 28, 2014), https://www.kff.org/health-reform/state-indicator/state-activity-around-expanding-medicaid-under-the-affordable-care-act/.
KCMU analysis based on 2014 Medicaid eligibility levels and 2012-2013 CPS.
This analysis used the adult Medicaid eligibility limit in Utah of 47% FPL, which was in effect January 1, 2014. Kaiser Commission on Medicaid and the Uninsured, The Coverage Gap: Uninsured Poor Adults in States that Do Not Expand Medicaid (Kaiser Family Foundation, October 2013), http://www.kff.org/health-reform/issue-brief/the-coverage-gap-uninsured-poor-adults-in-states-that-do-not-expand-medicaid/.
Public Consulting Group, State of Utah Medicaid Expansion Assessment: Impact Analysis: 2014-2023 (May 2013), http://www.health.utah.gov/documents/PCGUtahMedicaidExpansionAnalysis.pdf.
Ibid.
Utah Governor Gary Herbert, “Governor unveiled an alternative plan to Medicaid expansion - The ‘Healthy Utah Plan’ fixes the hole without expanding Medicaid” (February 27, 2014), http://www.utah.gov/governor/news_media/article.html?article=9747.
Lisa Riley Roche, “Herbert reaches understanding ‘conceptually’ on Medicaid expansion” (Deseret News, September 9, 2014), http://www.deseretnews.com/article/865610609/Herbert-reaches-understanding-conceptually-on-Medicaid-expansion.html.
Utah State Legislature, Health Reform Task Force (August 28, 2014), http://utahlegislature.granicus.com/MediaPlayer.php?view_id=2&clip_id=17721&meta_id=522315.
Medicaid.gov, “Medicaid and CHIP Eligibility Levels” (September 30, 2013), http://medicaid.gov/AffordableCareAct/Medicaid-Moving-Forward-2014/Medicaid-and-CHIP-Eligibility-Levels/medicaid-chip-eligibility-levels.html.
Kaiser Commission on Medicaid and the Uninsured, Medicaid Eligibility for Adults as of January 1, 2014 (Kaiser Family Foundation, October 2013), http://www.kff.org/medicaid/fact-sheet/medicaid-eligibility-for-adults-as-of-january-1-2014/.
KCMU analysis based on CMS, State Medicaid and CHIP Income Eligibility Standards Effective January 1, 2014 (October 24, 2013).
Utah House Bill 133 (2008), http://le.utah.gov/~2008/bills/hbillenr/hb0133.pdf.
Utah House Bill 188 (2009), http://le.utah.gov/~2009/bills/hbillenr/hb0188.pdf.
Utah House Bill 294 (2010), http://www.exchange.utah.gov/images/stories/hb0294.pdf.
Utah House Bill 128 (2011), http://www.exchange.utah.gov/images/stories/hb0128_-_Legislation_2011_Session.pdf.
State Health Facts. “State Decisions for Creating Health Insurance Marketplaces” (Kaiser Family Foundation, May 28, 2013), http://www.kff.org/health-reform/state-indicator/health-insurance-exchanges/.
Utah House Bill 144 (2012), http://le.utah.gov/~2012/bills/hbillint/hb0144.pdf.
HHS Letter to Governor Herbert Giving Utah Conditional Approval to Run at State-Based Exchange (January 3, 2013), http://www.cms.gov/CCIIO/Resources/Files/Downloads/ut-blueprint-exchange-letter-01-03-2013.pdf.
CMS Letter to Governor Herbert Agreeing to His Proposal (May 10, 2013), http://www.cms.gov/CCIIO/Resources/Fact-Sheets-and-FAQs/Downloads/utah-marketplace-letter-5-10-2013-508.pdf.
Avenue H website, now operating as a SHOP exchange, http://www.avenueh.com/.
For a listing of participating health insurance companies, see: Healthcare.gov, Health Plan Information for Individuals and Families, https://www.healthcare.gov/health-plan-information/.
This is the monthly premium for a single, 40-year-old at 250% FPL. With premium tax credits, the monthly premium drops to $193. To see how Utah compares to other states, see: State Health Facts, “ 2014 Monthly Premiums for a Single 40-Year-Old at 250 Percent of Poverty in a Major City in Each State” (Kaiser Family Foundation), https://www.kff.org/other/state-indicator/2014-monthly-premiums-for-a-single-40-year-old-at-250-percent-of-poverty-in-a-major-city-in-each-state/.
Although 23 states are offering CO-OPs, due to lack of data for three states (Hawaii, Kentucky, and Massachusetts), this analysis compared 22 states offering CO-OPs to the remaining 27 states and DC. National Alliance of State Health CO-OPS (NASHCO), Exchange Weighted Average Premiums, 47 States and DC (October 2, 2013).
John Holahan, Rebecca Peters, and Kevin Lucia, The Launce of the Affordable Care Act in Selected States: Insurer Participation, Competition, and Premiums (Robert Wood Johnson Foundation and Urban Institute, March 2014), http://www.rwjf.org/content/dam/farm/reports/issue_briefs/2014/rwjf411402/subassets/rwjf411402_3.
State Health Facts, Consumer Oriented and Operated Plan (CO-OP) Loans Awarded (Kaiser Family Foundation, January 1, 2014), https://www.kff.org/health-reform/state-indicator/co-op-loans/.
State Health Facts, State-by-State Estimates of the Number of People Eligible for Premium Tax Credits Under the Affordable Care Act (Kaiser Family Foundation, November 2013), https://www.kff.org/report-section/state-by-state-estimates-of-the-number-of-people-eligible-for-premium-tax-credits-under-the-affordable-care-act-table-1/.
Larry Levitt and Gary Claxton, The Potential Side Effects of Halbig (Kaiser Family Foundation, July 31, 2014), https://www.kff.org/health-reform/perspective/the-potential-side-effects-of-halbig/.
Office of the Assistant Secretary for Planning and Evaluation (ASPE), Profiles of Affordable Care Act Coverage Expansion Enrollment For Medicaid/CHIP and the Health Insurance Marketplace, 10-1-13 to 3-31-14 (HHS, May 1, 2014), http://aspe.hhs.gov/health/reports/2014/MarketPlaceEnrollment/Apr2014/Marketplace_StateSum.cfm.
HRSA, Health Center and Look-alike Sites Facility Directory (as of September 8, 2014), http://findahealthcenter.hrsa.gov/Search_HCC.aspx?byCounty=1.
National Association of Community Health Centers, Incorporated (NACHC) analysis of the 2011 Uniform Data System, Bureau of Primary Health Care, Health Resources and Services Administration, Department of Health and Human Services, Special Data Request, March 2013, http://www.nachc.com/client//2012%20Key%20data.pdf.
NACHC analysis of the 2011 Uniform Data System.
National Association of Community Health Centers, Utah Health Center Fact Sheet, http://www.nachc.com/client/documents/research/UT12.pdf.
For additional information about FQHCs in Utah compared to the rest of the U.S., see: Peter Shin, Jessica Sharac, and Sara Rosenbaum, The Potential Impact of the Affordable Care Act on Uninsured Community Health Center Patients: A Nationwide and State-by-State Analysis (George Washington University School of Public Health and Health Services, October 16, 2013), http://sphhs.gwu.edu/sites/default/files/GG%20uninsured%20impact%20brief.pdf.
HRSA, Utah: Health Center Outreach and Enrollment Assistance, http://www.hrsa.gov/about/news/2013tables/outreachandenrollment/ut.html.
Jennifer Edwards, Diana Rodin, and Samantha Artiga, Profiles of Medicaid Outreach and Enrollment Strategies: One-on-One Assistance through Community Health Centers in Utah (Kaiser Commission on Medicaid and the Uninsured, Kaiser Family Foundation, March 2013), https://www.kff.org/medicaid/issue-brief/profiles-of-medicaid-outreach-and-enrollment-strategies-one-on-one-assistance-through-community-health-centers-in-utah/.
State of Utah Department of Health, Disproportionate Share Dollars Paid for FFY2013, http://health.utah.gov/medicaid/stplan/Inpatient/WebDSHFY2013.pdf.
Ibid.
Bureau of Clinician Recruitment and Service, Health Resources and Services Administration (HRSA), U.S. Department of Health & Human Services, HRSA Data Warehouse: Designated Health Professional Shortage Areas Statistics, as of July 29, 2013, http://ersrs.hrsa.gov/reportserver/Pages/ReportViewer.aspx?/HGDW_Reports/BCD_HPSA/BCD_HPSA_SCR50_Smry_HTML&rs:Format=HTML4.0.
Ibid.
American Association of Nurse Practitioners, State Practice Environment 2013, http://www.aanp.org/legislation-regulation/state-legislation-regulation/state-practice-environment.
From 2010 to 2012, Utah’s population grew by 3.3%, behind North Dakota (4%) and Texas (3.6%)(U.S. Census Bureau’s March 2010 and 2012 Current Population Survey).


