Kaiser Health Tracking Poll: September 2015
This month’s Kaiser Health Tracking Poll finds that about 8 in 10 of the public favors Medicare and private insurance covering discussions about end-of-life treatment options between doctors and patients, and about 9 in 10 say doctors should have these discussions with their patient. However,relatively few (17 percent) say they’ve had such discussions. On another topic, 6 in 10 of the public say they are opposed to the “Cadillac Plan Tax” that imposes a tax starting in 2018 on higher cost employer-sponsored health plans, although some are swayed by arguments about how the tax would affect health care costs. Overall, opinion of the health care law has remained divided with similar shares reporting favorable views (41 percent) and unfavorable views (45 percent), with opinion starkly divided by party.
Kaiser Health Tracking Poll: September 2015 Findings
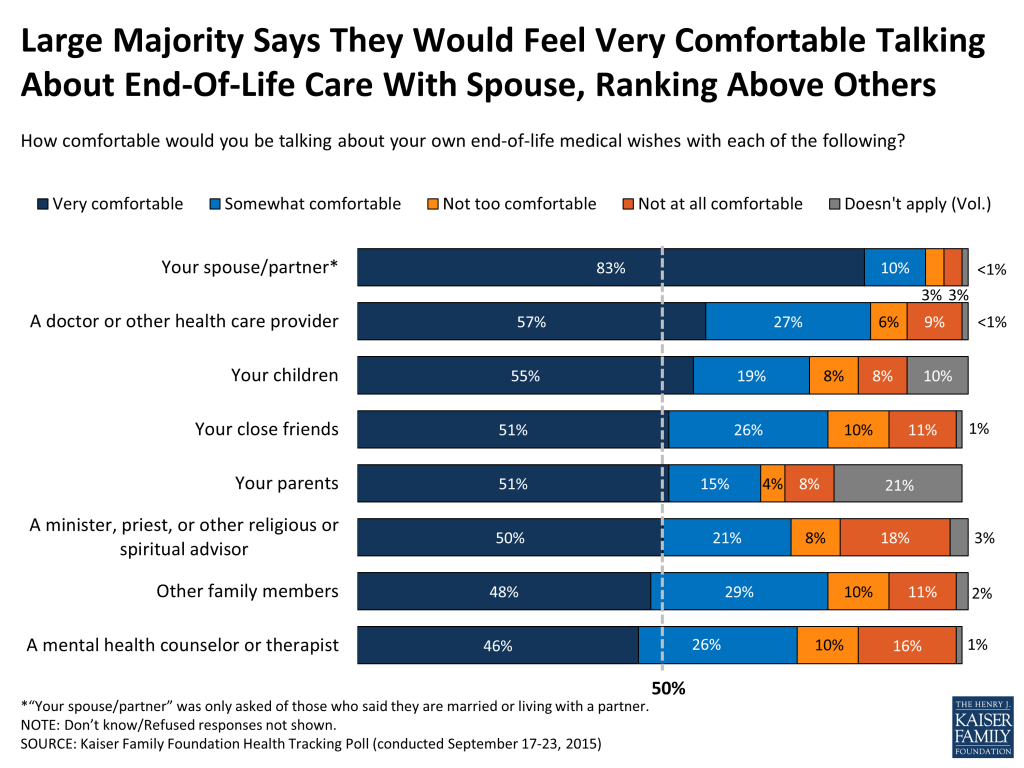
As the Centers for Medicare & Medicaid Services prepares to finalize a plan to pay physicians for discussing end-of-life treatment options with Medicare patients, this month’s Kaiser Health Tracking Poll finds that about 8 in 10 of the public favors Medicare and private insurance covering such discussions and about 9 in 10 say doctors should have these discussions with their patients. However, relatively few (17 percent) say they’ve had such discussions with a doctor or other health care provider, including 27 percent of people age 65 or older, while half of the public says they would want to have such a discussion. Over 8 in 10 say they would feel very comfortable talking about their end-of-life medical wishes with their spouse or partner and closer to half say they would be very comfortable talking with a doctor, their children, their close friends or their parents.
As Congressional lawmakers returned from August recess, some have proposed eliminating the so-called “Cadillac Plan Tax” that imposes a tax starting in 2018 on higher cost employer-sponsored health plans and 6 in 10 of the public is opposed to this tax, reflective of an overall anti-tax sentiment among Americans. However, when the public is presented with arguments about how the tax would affect health care costs, opinion can be swayed. For example, after hearing that the tax may help lower health care costs, some Americans are swayed to support the tax, resulting in a majority (55 percent) of Americans with a favorable view of the provision. On the other hand, negative arguments push opposition somewhat higher.
Overall, opinion of the health care law has remained divided with similar shares reporting favorable views (41 percent) and unfavorable views (45 percent), with opinion starkly divided by party. The public largely favors increased health plan transparency and says they would use such information when shopping for insurance.
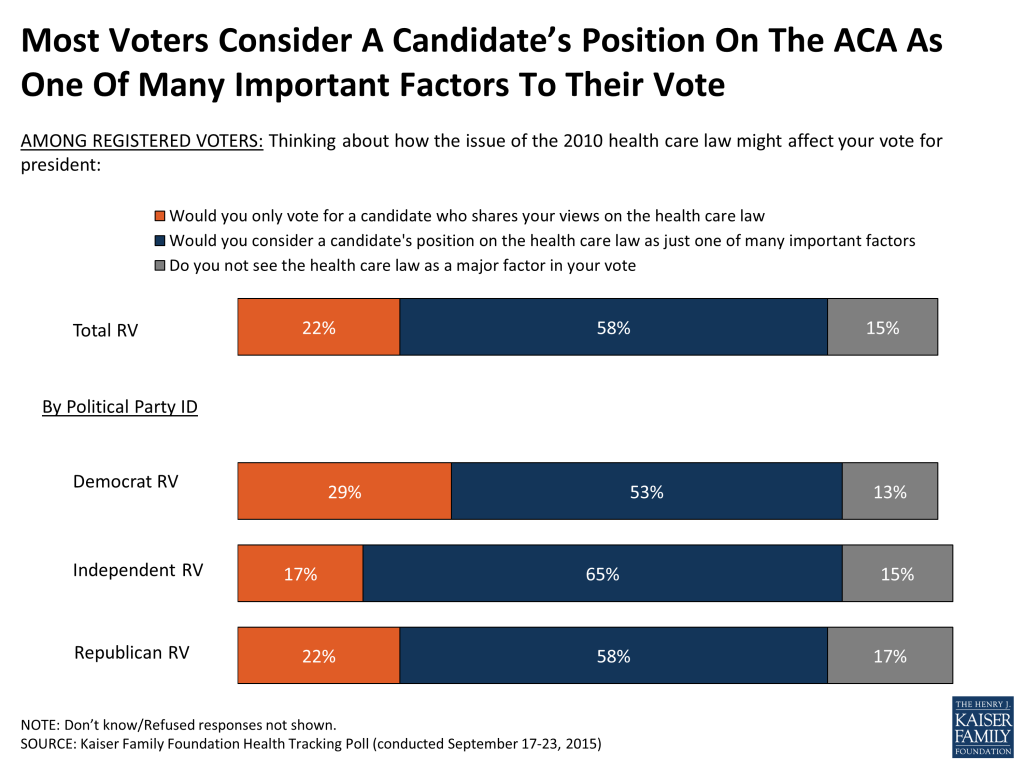
The Kaiser Health Policy News Index finds that the 2016 presidential election is the most widely followed news story included in this month’s Index, placing far ahead of health policy news stories. In an early measure of how voters perceive the health care law in relation to their preferences for presidential candidates, this month’s survey finds that more than half (58 percent) of those who say they are currently registered to vote say that they would consider a presidential candidate’s position on the health care law as just one of many important factors in their vote. Far fewer say that they would only vote for a candidate who shares their views on the law (22 percent) or that they do not see the law as a major factor (15 percent).
Public’s Views Of End-Of-Life Care Issues
Earlier this year, the Administration announced plans to start paying physicians for separate office visits to discuss end-of-life issues with their Medicare patients and is expected to implement them with final regulations soon.1 There is broad support (81 percent) for requiring Medicare to cover discussions between doctors and patients about end-of-life treatment options. Similarly, the public supports private health insurance covering these discussions as well (83 percent).
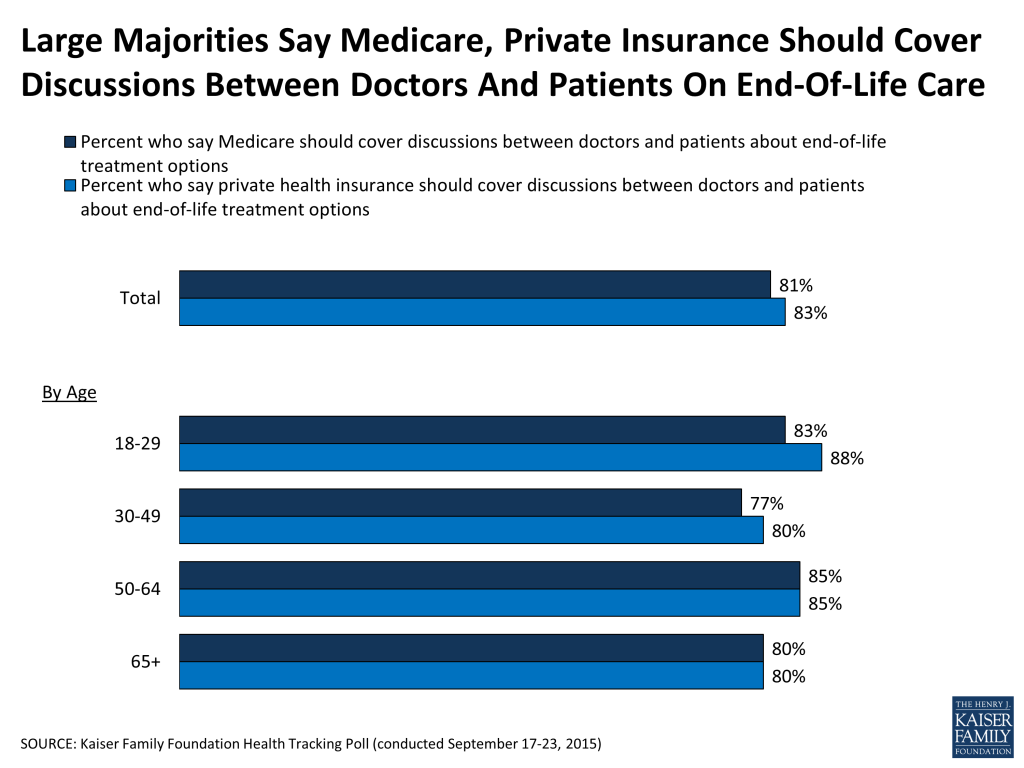
About 9 in 10 (89 percent) say doctors should discuss end-of-life care issues with their patients. But, relatively few (17 percent) say they’ve had such discussions with a doctor or other health care provider, including 34 percent of people age 75 or more, 23 percent of people age 65-74, 19 percent of those age 50-64 and 12 percent of those age 18-49. In addition, those who report having a debilitating disability or chronic condition are more likely to say they have discussed their end-of-life care wishes with a health care provider than those without a disability (31 percent vs. 13 percent). A third of the public says they have participated in a discussion with a doctor about another family member’s wishes about their care at the end of life, including 46 percent of those ages 50-64. Across age groups, many say they would want to have such a discussion about their own end-of-life care (50 percent overall).
| Table 1: Opinions And Experiences Discussing End-of-Life Care Issues With Doctors By Age | |||||
| BY AGE | |||||
| Total | 18-49 | 50-64 | 65-74 | 75+ | |
| Do you think doctors should discuss end-of-life care issues with their patients, or not? | |||||
| Yes, doctors should | 89% | 89% | 91% | 87% | 78% |
| No, doctors should NOT | 9 | 9 | 6 | 8 | 18 |
| Have you ever had a conversation with a doctor or other health care provider about your wishes for your care at the end of your life, or not?If not: Would you want to talk with a doctor or other health care provider about your wishes for your care at the end of your life, or is this not something you would want to talk with a doctor about? | |||||
| Yes, have had conversation with doctor | 17 | 12 | 19 | 23 | 34 |
| No, have NOT had conversation with doctor | 83 | 87 | 81 | 76 | 66 |
| No, but would want to | 50 | 54 | 48 | 43 | 32 |
| No, would NOT want to | 31 | 31 | 30 | 30 | 33 |
| Have you ever participated in a discussion with a doctor or other health care provider about another family member’s wishes for their care at the end of their life, or not? | |||||
| Yes | 33 | 26 | 46 | 36 | 29 |
| No | 67 | 74 | 54 | 64 | 71 |
| NOTE: Don’t Know/ Refused responses not shown. | |||||
Those who say they would not want to talk to a doctor about their wishes for their care at the end of life are less likely than those who say they would want to talk with a doctor to say doctors and patients should be discussing such issues (75 percent vs. 97 percent) and that they would be very comfortable talking about it with a number of people in their lives, for example their spouse (71 percent vs. 87 percent) or a doctor (27 percent vs. 70 percent). They are also less likely to be white and more likely to be male, Hispanic, and to say they are conservative on most political issues than those who say they are willing to talk with a doctor.
Large majorities say they would feel comfortable talking about their own end-of-life medical wishes with a variety of people in their lives. Taking the top spot is a spouse or partner, with 83 percent saying they would be very comfortable discussing their end of life medical wishes with their significant other. In addition, roughly half say they would be very comfortable talking with a doctor or other health care provider (57 percent), their children (55 percent), close friends (51 percent), their parents (51 percent), a minister, priest or other religious or spiritual advisor (50 percent), other family members (48 percent), or a mental health counselor or therapist (46 percent).
Views Of Cadillac Tax & Medical Device Tax
Cadillac Plan Tax
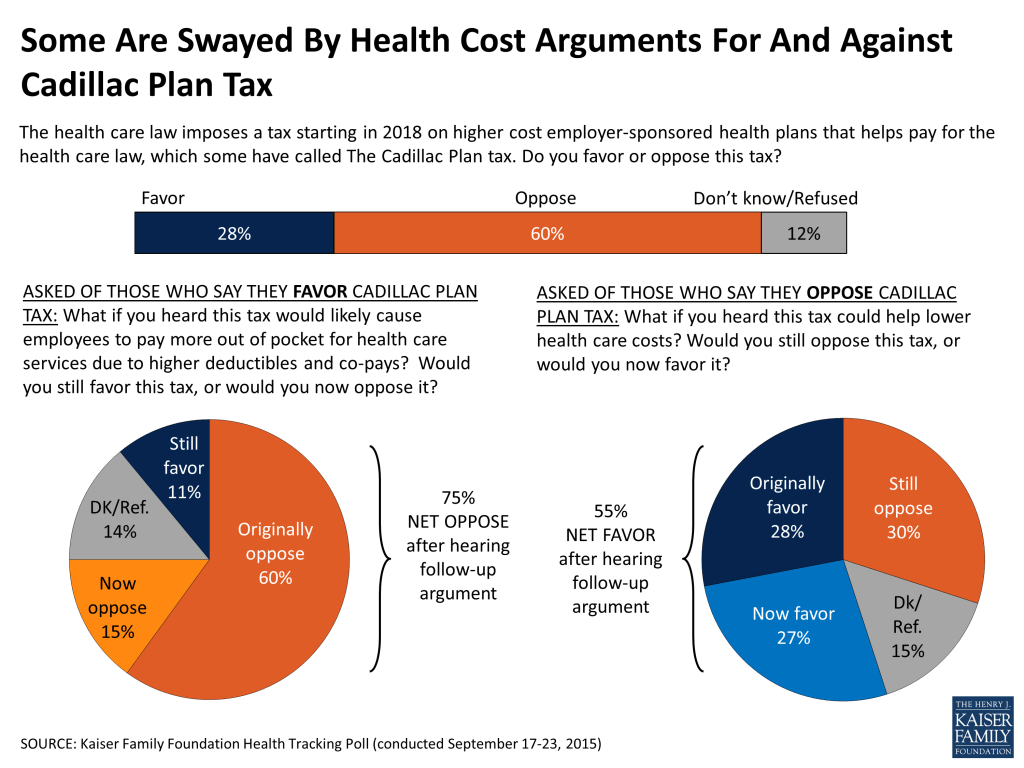
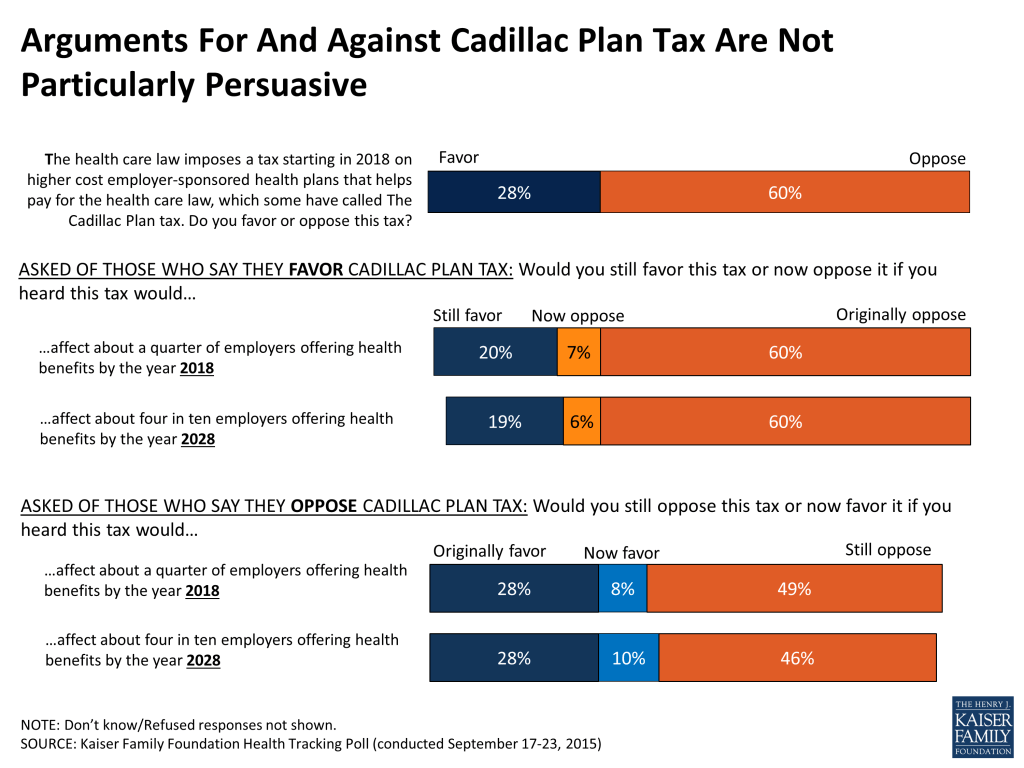
Congressional lawmakers have recently discussed repealing a provision of the Affordable Care Act that helps pay for other provisions of the law – the so-called “Cadillac Plan Tax” that imposes a tax starting in 2018 on higher cost employer-sponsored health plans. The U.S. public has a generally unfavorable view of taxes, so it is somewhat not surprising that 6 in 10 (60 percent) oppose the Cadillac tax.
Some arguments for or against the tax can persuade some to alter their view of the tax, particularly arguments about the tax’s potential effect on health care costs. When those who initially oppose the tax are told that the tax could help lower health care costs, 27 percent change their minds to say that they now favor the tax, pushing overall support over the 50 percent mark to 55 percent. Alternatively, after those who initially favor the Cadillac tax hear the “tax would likely cause employees to pay more out of pocket for health care services due to higher deductibles and co-pays,” 15 percent say they would now oppose the law, pushing overall opposition to three quarters of the public.
Arguments about how many employers would be affected by the tax in 2018 and 2028 are less persuasive and move opinion for relatively few who initially favored or opposed the Cadillac tax. After those who initially favor the tax are told it “would affect about a quarter of employers offering health benefits by the year 2018,” 7 percent of the public changes positions and now says they oppose the tax. In addition, hearing that the “tax would affect about 4 in 10 employers offering health benefits by the year 2028” moves 6 percent of people to change their minds and now oppose the tax.
On the other hand, when those who are initially opposed to the tax are given the same arguments, 8 percent of the public are moved to now favor the tax when they hear it will affect a quarter of employers offering benefits in 2018 and 10 percent are moved to now favor it after hearing how many employers it would affect in 2028.
Republicans and independents are less favorable towards the tax than Democrats, who may be more likely to have a favorable view of the tax due to its role in helping fund other parts of the health care law, a law that Democrats widely support.
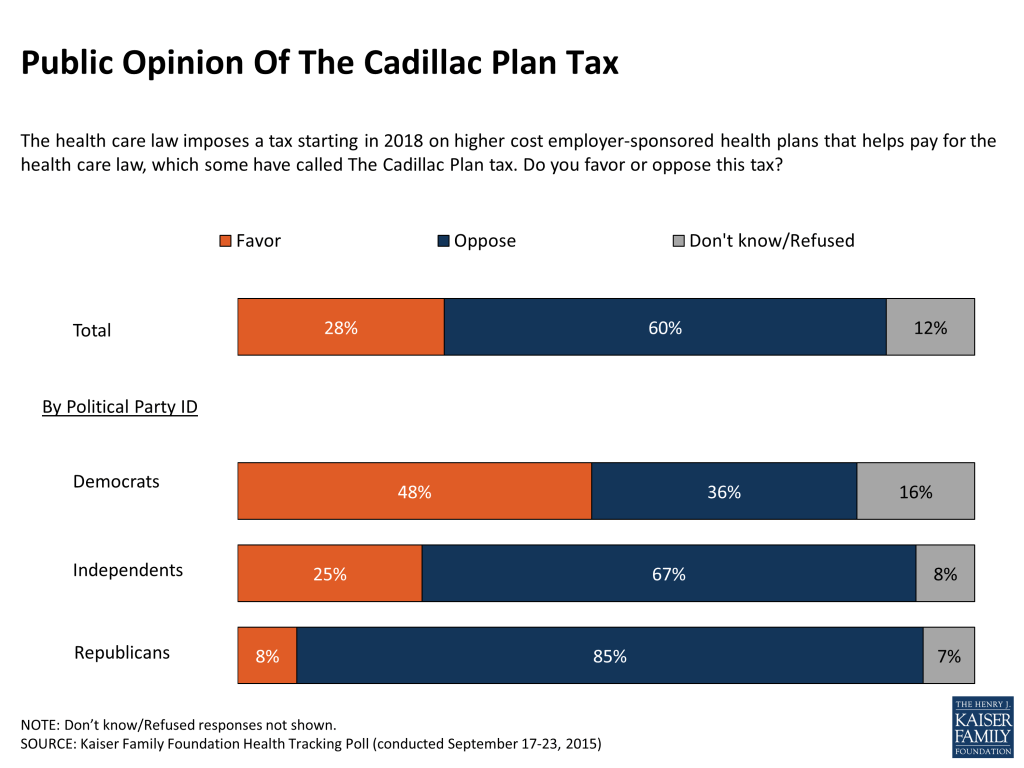
Despite the opposition to the Cadillac tax, relatively few Americans (34 percent) are aware the law includes the provision, while the remainder either think the law does not include such a tax (34 percent) or are unsure (32 percent).
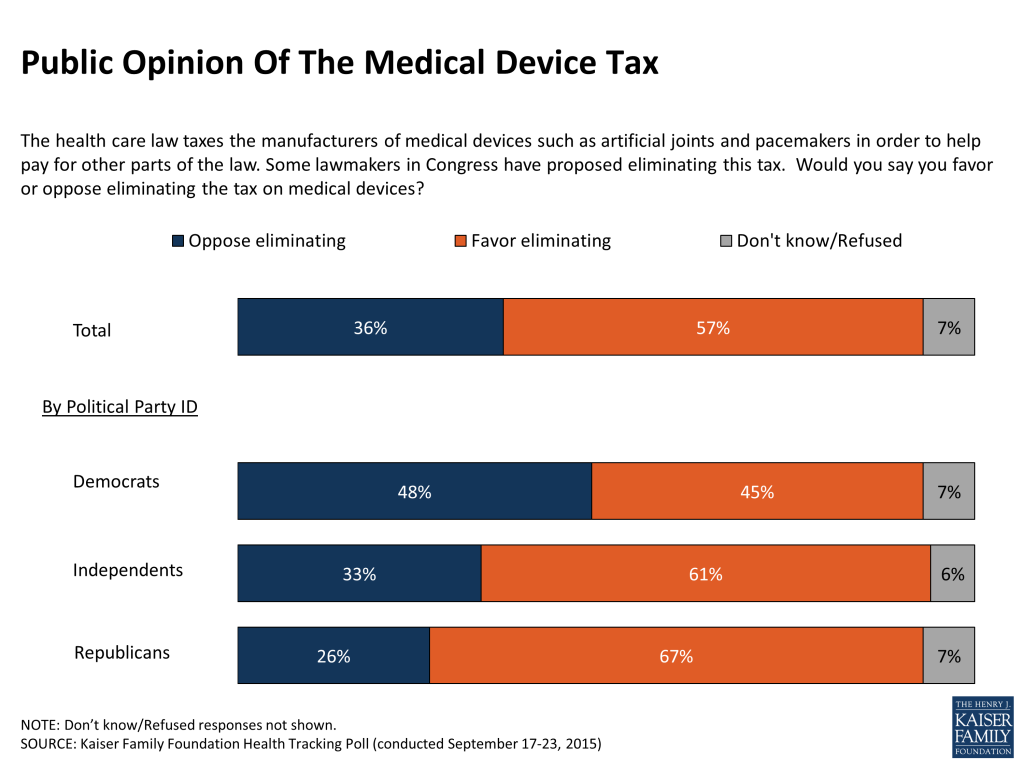
Medical Device Tax
The other tax that helps pay for the health care law that has been recently under fire is the medical device tax that taxes the manufacturers of medical devices such as artificial joints and pacemakers. About 6 in 10 Americans (57 percent) favor repealing the medical device tax, and, like for the Cadillac tax, opposition to the tax is higher for Republicans and independents than Democrats.
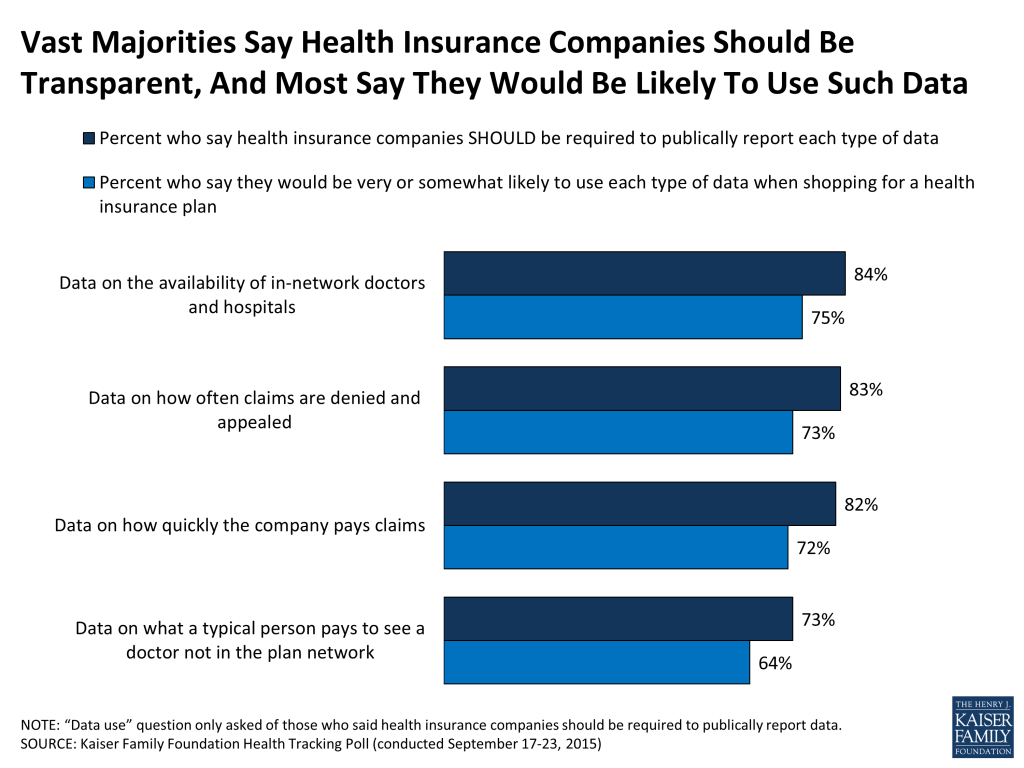
Large Majorities Support Public Disclosure Of Health Plan Data
The ACA included a number of provisions to increase health plan transparency to help consumers better understand their health insurance choices and how coverage works in practice, for example, by requiring plans to disclose data about how often claims are denied or appealed, or on the availability of network providers and what consumers end up paying out of pocket for care out of network.2 Under the law, transparency reporting requirements were to take effect in 2010 for plans outside of the marketplace and in 2014 for marketplace plans, though provisions have not yet been implemented. A recent notice proposes to delay implementation further, though it has not yet been finalized.3
The public is largely supportive of health insurance companies publically releasing a variety of data points, including data on the availability of in-network doctors and hospitals (84 percent), data on how often claims are denied or appealed (83 percent), data on how quickly the company pays claims (82 percent), and data on what a typical person pays to see a doctor not in the plan network (73 percent). Roughly 7 in 10 say they would be at least somewhat likely to use each of these types of information when shopping for a health insurance plan. Republicans are somewhat less supportive of requiring health insurance companies to release data, but still at least 6 in 10 support public disclosure.
The Public’s Overall Views Of The Health Care Law
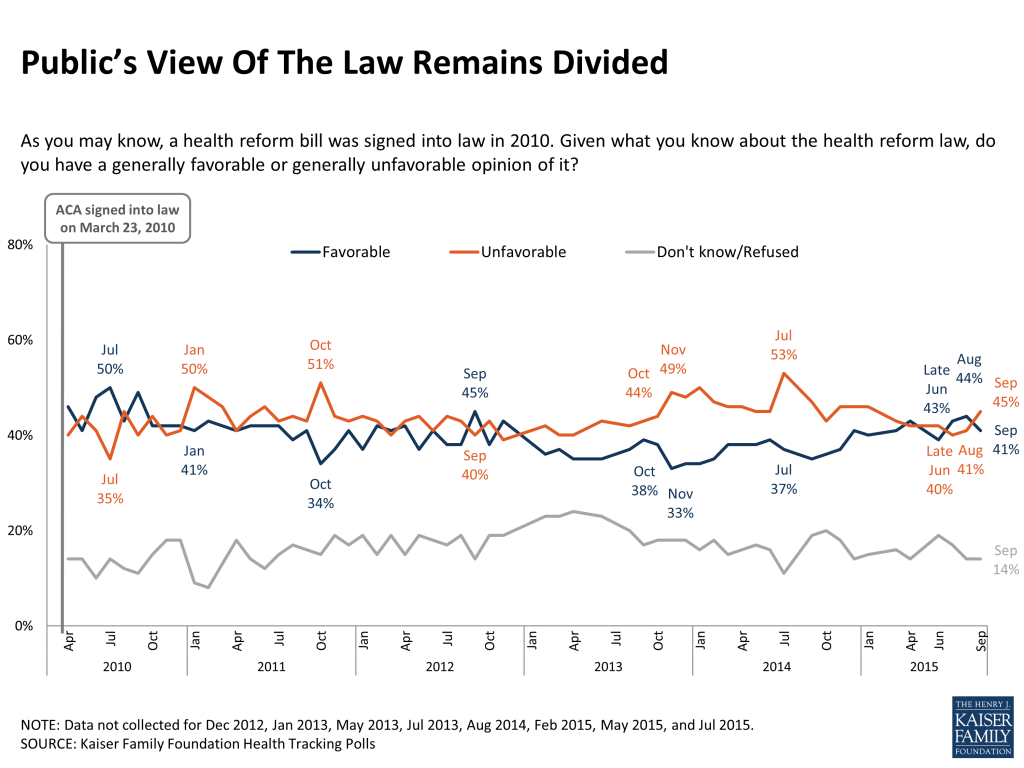
Americans Divided In Opinion Of ACA
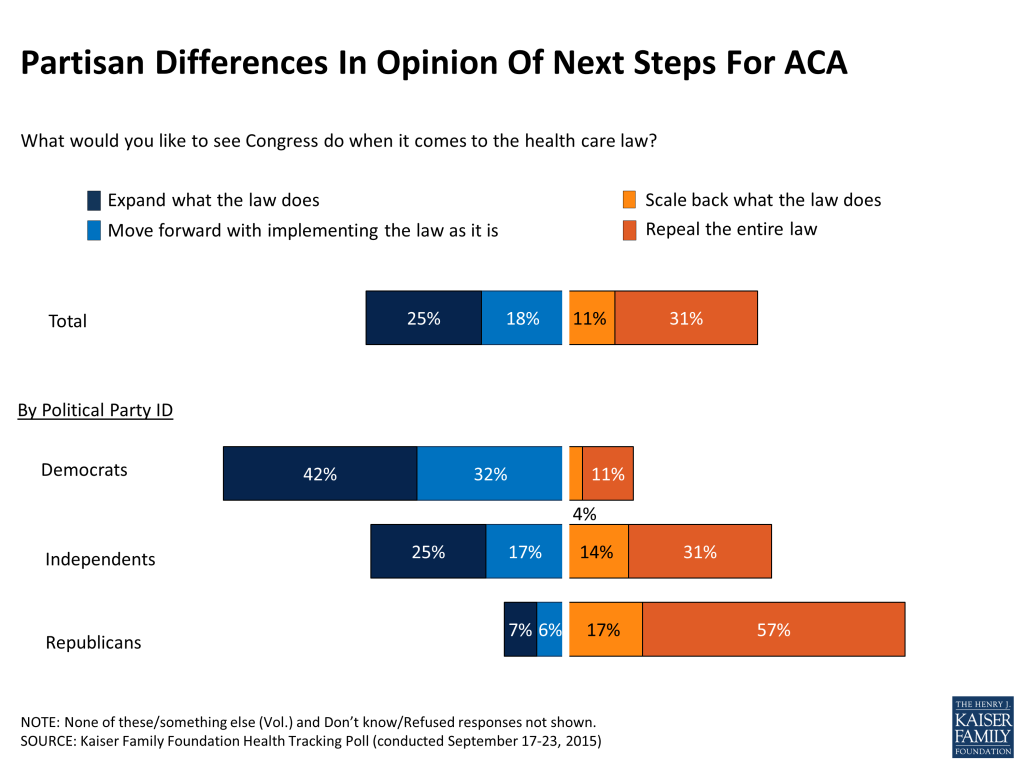
After public opinion of the health care law tilted negatively for much of 2014, opinion has been fairly evenly divided over the course of 2015, and this month is no exception; 41 percent say they have a favorable view and 45 percent say they have an unfavorable view. Not surprisingly, opinion of the law continues to vary by political party identification, with most Democrats reporting a favorable view (67 percent), most Republicans reporting an unfavorable view (73 percent), and independents falling in the middle with 47 percent reporting an unfavorable view and 41 percent reporting a favorable view.
Next Steps
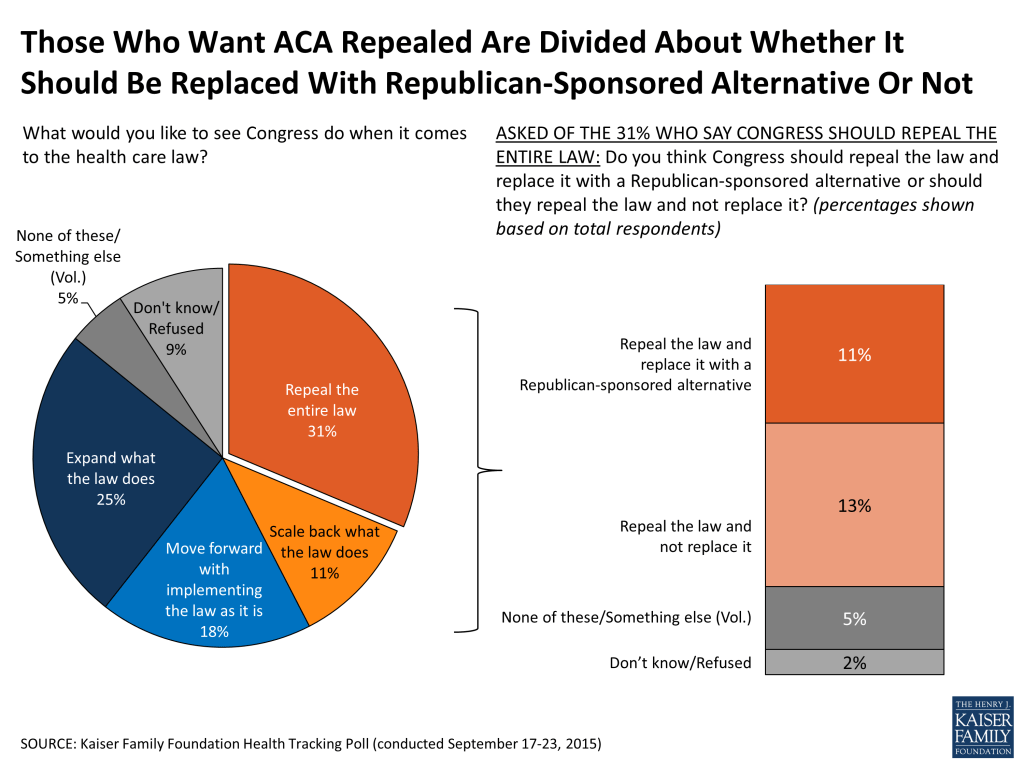
Opinion about what Congress should do next when it comes to the health care law has also been relatively constant this year. A quarter of the public (25 percent) say they want Congress to expand what the law does, and about 2 in 10 (18 percent) say they would like Congress to move forward with implementing the law as it is. On the other end of the spectrum, 1 in 10 (11 percent) say they would like to see the law scaled back and 3 in 10 (31 percent) say they want Congress to repeal the law entirely.
A deeper look at those who say they want Congress to repeal the law reveals a split in opinion about what Congress should do if the law were to be repealed; replace it with a Republican-sponsored alternative or not replace it. Thirteen percent of the public overall say they think Congress should repeal the law and not replace it, while 11 percent say they would like to see it replaced, and 7 percent volunteered that they don’t like either of these two options or they don’t know what they think should happen if the law were repealed.
Kaiser Health Policy News Index: September 2015
The Kaiser Health Policy News Index is designed to help journalists and policymakers understand which health policy-related news stories Americans are paying attention to, and what the public understands about health policy issues covered in the news.
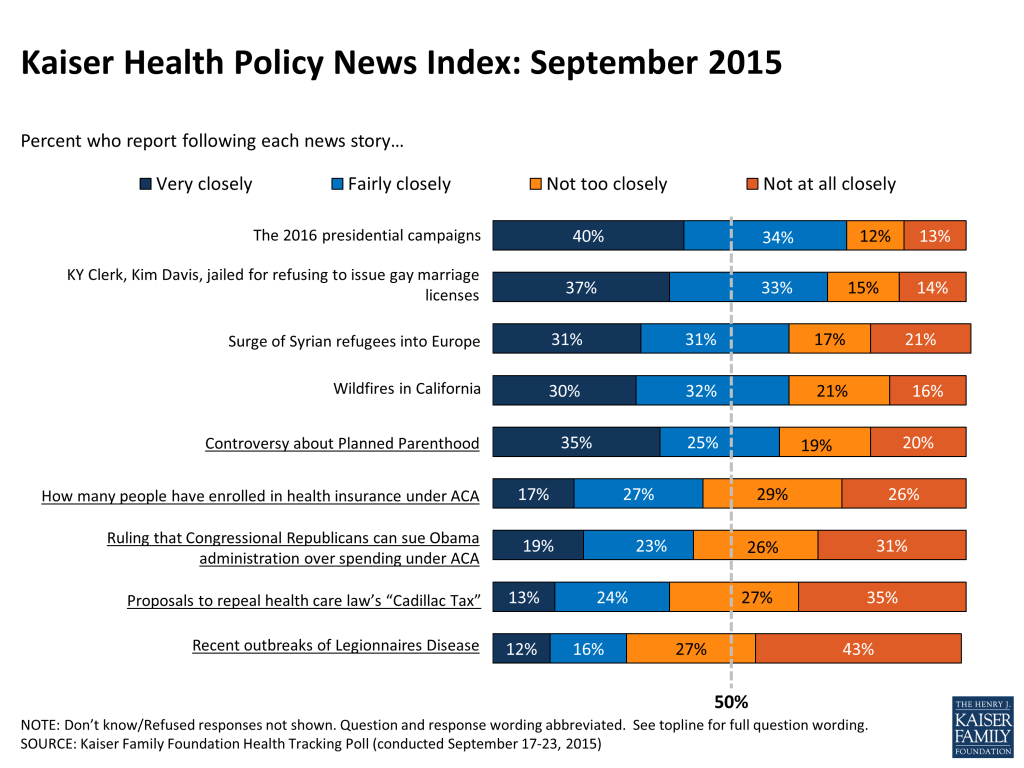
Consistent with last month’s Kaiser Health Policy News Index, news coverage of the 2016 presidential campaigns topped the list as the most closely followed news story among those asked about in the Index this month, with three-quarters of Americans (74 percent) reporting that they “very” or “fairly” closely followed the story. Majorities across the political spectrum – Democrats, Republicans and independents alike – all report closely following news about the presidential campaigns, although Republicans are more likely to say they have been following “very” closely than Democrats or independents. In other national news, 7 in 10 (70 percent) say they closely followed the coverage of the Kentucky Clerk, Kim Davis, who was jailed for refusing to issue marriage licenses to gay couples. Additionally, about 6 in 10 report closely following news about the wildfires in California and the surge of Syrian refugees into Europe (62 percent each). More than half of the public (60 percent) say they closely followed the controversy about Planned Parenthood, similar to the share who reported closely following the story last month (57 percent).
Fewer than half of the public report following the health stories asked about in this month’s Index. About 4 in 10 say they closely followed stories about how many people have enrolled in health insurance options under the health care law (44 percent), the federal ruling that Congressional Republicans can sue the Obama administration over spending under the health care law (42 percent), and proposals to repeal the health care law’s “Cadillac Tax” which imposes a tax on higher cost employer-sponsored health plans starting in 2018 (37 percent). About 3 in 10 (28 percent) report closely following news about the recent outbreaks of Legionnaires Disease in the US.
Early Glimpse Of Voters’ Thoughts About The ACA And The Election
Although the general election is still over a year away, it appears that the public is already tuned into the media coverage of the race, since it has topped the Kaiser Health Policy News Index for the last two months. As an early measure of how the health care law may or may not factor into voters’ preferences for the candidates, this month’s survey finds that nearly 6 in 10 of those who say they are currently registered to vote say that they would consider a presidential candidate’s position on the health care law as just one of many important factors in their vote (58 percent). Far fewer say that they would only vote for a candidate who shares their views on the law (22 percent) or that they do not see the law as a major factor in their vote (15 percent). At this early point in the race, roughly similar shares of Democratic (29 percent), Republican (22 percent), and independent (17 percent) voters say they would only vote for a candidate who shares their views on the health care law. Of course, there is still plenty of time for voter opinions to shift as the election approaches.
Kaiser Health Tracking Poll: September 2015 Methodology
This Kaiser Health Tracking Poll was designed and analyzed by public opinion researchers at the Kaiser Family Foundation (KFF). The survey was conducted September 17-23, 2015, among a nationally representative random digit dial telephone sample of 1,202 adults ages 18 and older, living in the United States, including Alaska and Hawaii (note: persons without a telephone could not be included in the random selection process). Computer-assisted telephone interviews conducted by landline (481) and cell phone (721, including 429 who had no landline telephone) were carried out in English and Spanish by Princeton Data Source under the direction of Princeton Survey Research Associates International (PSRAI). Both the random digit dial landline and cell phone samples were provided by Survey Sampling International, LLC. For the landline sample, respondents were selected by asking for the youngest adult male or female currently at home based on a random rotation. If no one of that gender was available, interviewers asked to speak with the youngest adult of the opposite gender. For the cell phone sample, interviews were conducted with the adult who answered the phone. KFF paid for all costs associated with the survey.
The combined landline and cell phone sample was weighted to balance the sample demographics to match estimates for the national population using data from the Census Bureau’s 2013 American Community Survey (ACS) on sex, age, education, race, Hispanic origin, nativity (for Hispanics only), and region along with data from the 2010 Census on population density. The sample was also weighted to match current patterns of telephone use using data from the July-December 2014 National Health Interview Survey. The weight takes into account the fact that respondents with both a landline and cell phone have a higher probability of selection in the combined sample and also adjusts for the household size for the landline sample. All statistical tests of significance account for the effect of weighting.
The margin of sampling error including the design effect for the full sample is plus or minus 3 percentage points. Numbers of respondents and margins of sampling error for key subgroups are shown in the table below. For results based on other subgroups, the margin of sampling error may be higher. Sample sizes and margins of sampling error for other subgroups are available by request. Note that sampling error is only one of many potential sources of error in this or any other public opinion poll. Kaiser Family Foundation public opinion and survey research is a charter member of the Transparency Initiative of the American Association for Public Opinion Research.
| Group | N (unweighted) | M.O.S.E. |
| Total | 1,202 | ±3 percentage points |
| Party Identification | ||
| Democrats | 347 | ±6 percentage points |
| Republicans | 307 | ±6 percentage points |
| Independents | 385 | ±6 percentage points |
| Age | ||
| 18-29 | 180 | ±8 percentage points |
| 30-49 | 316 | ±6 percentage points |
| 50-64 | 365 | ±6 percentage points |
| 65+ NET | 341 | ±6 percentage points |
| 65-74 | 224 | ±8 percentage points |
| 75+ | 109 | ±11 percentage points |
| Disability or Chronic Condition | ||
| Yes | 260 | ±7 percentage points |
| No | 935 | ±4 percentage points |
| Registered Voters | ||
| Total RV | 1,009 | ±4 percentage points |
| Democrat RV | 299 | ±7 percentage points |
| Republican RV | 282 | ±7 percentage points |
| Independent RV | 320 | ±6 percentage points |
Endnotes
- Kaiser Family Foundation, 10 FAQs: Medicare’s Role In End-of-Life Care, July 2015, https://modern.kff.org/medicare/fact-sheet/10-faqs-medicares-role-in-end-of-life-care. ↩︎
- Kaiser Family Foundation, Health Insurance Transparency Under The Affordable Care Act, May 2012, https://modern.kff.org/health-reform/perspective/health-insurance-transparency-under-the-affordable-care-act. ↩︎
- For more information on the proposed information collection notice visit, https://www.cms.gov/Regulations-and-Guidance/Legislation/PaperworkReductionActof1995/PRA-Listing-Items/CMS-10572.html?DLPage=1&DLEntries=10&DLSort=1&DLSortDir=descending ↩︎