Trends in Overall and Non-COVID-19 Hospital Admissions
Newly available data shows that the rise in the number of COVID-19 cases in the fall of 2020 was accompanied by a decline in non-COVID-19 hospital admissions during that time period. Our analysis includes medical records data of hospital admissions through December 5, 2020 from the Epic Health Research Network and updates an earlier paper that analyzed hospital admissions data through August 8, 2020. These new data provide additional information to help assess the economic impact of the COVID-19 pandemic on hospitals and insurers and also adds to our understanding of the extent to which people are continuing to delay or forgo care nearly one year into the pandemic. We analyze trends in total hospital admissions and then separately analyze non-COVID-19 admissions both overall and by patient region, age, and sex. We calculate actual admissions as a share of total predicted admissions in 2020 based on trends from past years. Key findings include:
- Total hospital admissions dropped to 69.2% of predicted admissions during the week ending April 4, 2020—the lowest point in the year—before rising again and staying at or above 90% since June 2020. As of the week ending December 5, 2020, total admissions were at 94.2% of what was predicted.
- The decrease in hospital admissions from March 8 to December 5, 2020 represent 8.5% of the total expected admissions for all of 2020.
- In November 2020, as COVID-19 cases surged, non-COVID-19 hospitalizations started to decline again and were about 80% of predicted hospitalizations by the end of the month. This suggests that people may once again be delaying or forgoing care due to the pandemic, in some cases likely due to hospital capacity constraints.
- Based on our data through the beginning of December, the more recent decline in non-COVID-19 admissions has been steepest in the Midwest and West. In both of those regions, non-COVID-19 admissions were at roughly 76% of predicted levels at the end of November, as COVID-19 cases were surging in many parts of those regions.
This new analysis is based on electronic medical record (EMR) data from Epic Health Research Network (EHRN) and includes all inpatient hospital admission volume from Dec 31, 2017 to December 5, 2020, involving patients who either were discharged or died as of January 13, 2021. Data are aggregated weekly and pooled from 34 health care organizations in the United States, representing 97 hospitals that span 26 states and cover 20 million patients. These states represent 73.0% of COVID-19 cases as of January 21, 2021 and also represent 76.7% of the U.S. population.1 Predicted volume was calculated using historical data from Dec 31, 2017 to Jan 25, 2020.2 COVID-19 admissions were identified as admissions with either a documented COVID-19 diagnosis (U07.01) or other respiratory diagnosis involving a patient who either had tested positive or presumptive positive for COVID-19 or received a COVID-19 diagnosis within 14 days of the admission.
Background and Prior Studies on 2020 Health Care Trends
Several recent studies show that, beginning in March 2020, social distancing measures, concerns over hospital capacity, and fears of contracting COVID-19 led to sharp declines in health care spending.3 Across all health care services, not including pharmaceutical drugs, expenditures were down 32% in April 2020 on an annualized basis, compared to April 2019. Spending on health care services has since increased and as of the third quarter of 2020, year-to-date health services spending was down by 2.4% (relative to year-to-date spending as of third quarter in 2019). Changes in year-to-date spending varied by type of service, with physician office revenue down 4.0% and hospital revenue down 1.7% by the third quarter of 2020 (relative to year-to-date spending as of third quarter in 2019).
A recent EHRN analysis of EMR data found similar patterns to those presented here for overall emergency department (ED) visits, with a sharp decline (down roughly 50% of predicted ED visit volume) followed by slight recovery that has still left overall ED visits at about 65-70% of predicted volume as of the beginning of December 2020.4 Further, breaking down ED visit patterns by specific conditions, it was found that trends in visits associated with more severe (i.e., historically more likely to be admitted) conditions, such as stroke and acute myocardial infarction, experienced a smaller decline in Spring 2020 and recovered more quickly to predicted levels as compared to visits related to less severe conditions, such as dermatitis and conjunctivitis.5 Analysis of EMR data for breast, cervical, and colon cancer screenings showed an even sharper decline beginning in early March followed by an increase in screenings; even so, screening rates have remained far below 2019 levels.6 By mid-June, weekly volumes for these cancer type screenings remained roughly 30-35% lower than their pre-COVID-19 levels.
Findings
Trends in Overall Hospital Admissions
Our analysis of EMR data shows a precipitous drop in hospital admissions starting the week ending March 14, 2020, falling to a low of 69.2% of predicted admissions during the week ending April 4, 2020 (Figure 1)—soon after the March 13, 2020 national emergency proclamation. Admissions gradually began to increase soon after that date and, by July 4, 2020, admissions were back to approximately 95% of their predicted level and have hovered at around 93-95% in October and November.
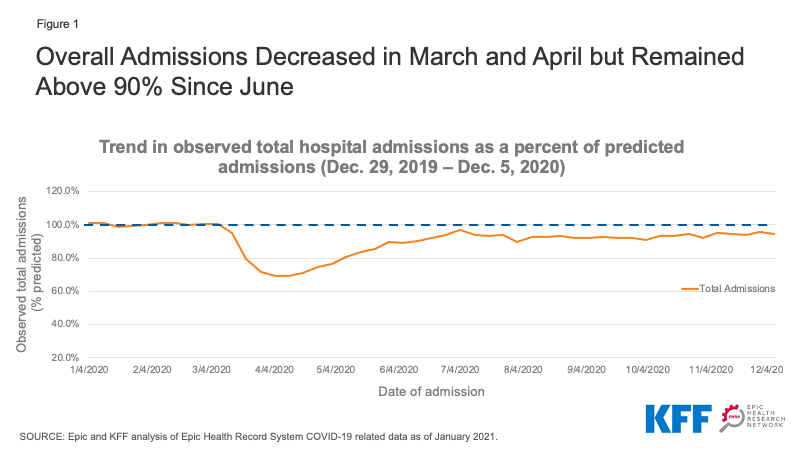
Figure 1: Overall Admissions Decreased in March and April but Remained Above 90% Since June
The decrease in admissions between March 8 and December 5, 2020 account for 8.5% of the total number of admissions predicted during the 2020 calendar year. If the number of admissions remained at about 94% of predicted admissions (as they were on December 5) through the end of 2020, total admissions would be 8.9% below the predicted volume for the entire year.
IMPLICATIONS FOR HOSPITAL FINANCES
This drop in admissions was not something that hospitals could have anticipated at the beginning of the year and the steep decline in admissions early in the pandemic may have been difficult for some hospitals to weather. Hospitals’ financial strength differs widely. One recent study found that the median hospital had enough cash on hand to pay its operating expenses for 53 days in 2018, but the 25th percentile hospital only had enough cash on hand for 8 days.7 Smaller hospitals, public hospitals and rural hospitals are among those most likely to face financial challenges in the wake of revenue loss related to COVID-19. Some of these hospitals may be at risk of closing or merging if they do not have the financial resources to make up for declines in revenue caused by the declines in admissions shown in our data.
Hospitals and other health care providers have qualified for various types of federal assistance during the coronavirus pandemic. However, much of this money was not initially targeted to safety net hospitals operating on narrow margins.8 Most notably, hospitals and other health care providers received grants from the $178 billion provider relief fund that is being distributed by the Department of Health and Human Services (HHS). Hospitals qualified for grants that were the equivalent to a minimum of 2% of revenue and on average received grants that amounted to about 5.6% of revenue.9 Hospitals that qualified for additional grants either qualified by seeing a high number of COVID-19 inpatients by June 10 or were children’s hospitals, rural hospitals and/or safety net hospitals. About $26 billion remains available for future grant allocations as of February 3, 2021.10
In the coronavirus stimulus bill that was signed into law on December 27, 2020, Congress specified that 85% of the remaining money must be used to reimburse providers for lost revenue or expenses caused by the coronavirus pandemic.11 It is not clear, however, how the drop in admissions translates into lost revenue for hospitals, which would depend on the type of admissions that were missed and which insurers paid for those admissions. Private insurers typically reimburse at higher rates than Medicare or Medicaid, and reimbursement widely varies by type of admission.12
Hospitals and other providers that participate in traditional Medicare were also eligible for loans through the Medicare Accelerated and Advance Payment Programs, which are designed to help hospitals facing cash flow disruptions during an emergency. About 80% of the $100 billion in loans went to hospitals.13 CMS began distributing the loans in March 2020. Repayment for the loans was originally set to begin in August, but Congress later delayed when repayments would begin and extended the period for repayment.14 Providers will now begin repaying the loans one year after their initial loan payment was received, meaning repayment should begin in March 2021.
In addition, Medicare has increased payments to hospitals by 20% for all COVID-19 inpatients during the current public health emergency. The Biden Administration has indicated the public health emergency will likely remain in place throughout 2021. The Congressional Budget Office originally estimated that this change will increase Medicare spending by about $3 billion.15 Hospitals may also be eligible for loans being distributed by the Treasury department, the Federal Reserve, and Small Business Administration.
IMPLICATIONS FOR INSURER FINANCES
Health insurers, in contrast, may be benefiting financially from this decline in hospital admissions and certain other medical services since the start of the pandemic. KFF analysis found that at the end of the third quarter of 2020 average gross margins for health insurers had increased compared to 2019 and 2018 across the individual market, group market, Medicare Advantage and Medicaid Managed Care markets. KFF’s analysis also examined trends in medical loss ratios, or the percent of premium income that insurers pay out in the form of medical claims. Generally, lower medical loss ratios mean that insurers have more income remaining after paying medical costs to use for administrative costs or keep as profits. Compared to the same period in 2019, average loss ratios through the third quarter of 2020 were lower across the individual market, group market, Medicare Advantage and Medicaid Managed Care markets.
Trends in Non-COVID-19 Admissions
We used EMR data from EHRN to look at overall trends in non-COVID-19 admissions and also specifically at non-COVID-19 admissions by patient sex, age and region. By looking specifically at non-COVID-19 admissions, we can more easily assess declines in the use of health care due to voluntary and mandatory delays in non-emergency care. Looking at overall trends, we found that non-COVID-19 admissions reached a low of 63.4% of predicted admissions for the week ending April 11, 2020 (Figure 2). By June 2020, non-COVID-19 admissions had increased and reached a high of 92.0% of predicted levels the week ending July 4, 2020—but dipped back down soon after COVID-19 admissions began to increase again in the fall and fell to approximately 80% of predicted levels by the week ending December 5, 2020.
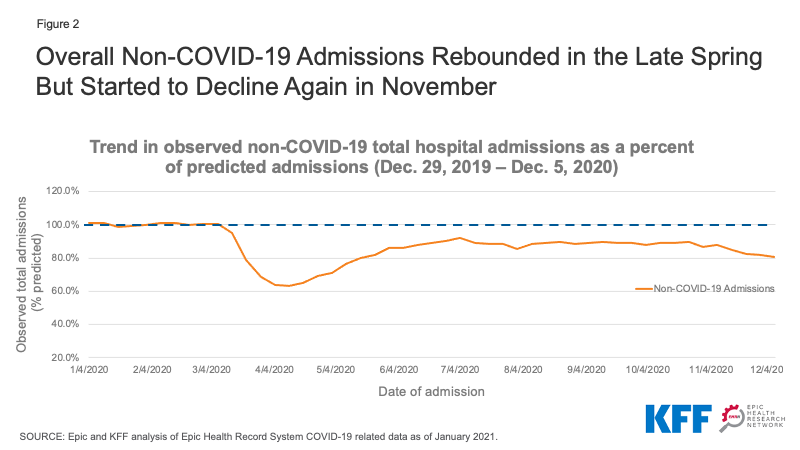
Figure 2: Overall Non-COVID-19 Admissions Rebounded in the Late Spring But Started to Decline Again in November
Our analysis does not include specific diagnoses or procedures to assess which types of admissions had the steepest declines. Declines in certain types of admissions—such as car crashes—may be explained by changes in habits due to the coronavirus pandemic. However, as discussed earlier in this paper, declines in cancer screenings suggest that the overall decline in admissions is also a sign of patients delaying or foregoing preventive care and therefore not starting necessary treatments. Some cancer treatments were also delayed earlier in the pandemic,16 although those treatments may now have resumed in many cases. In other cases, hospitals have delayed or cancelled non-emergency procedures due to capacity constraints.17
Non-COVID-19 Admissions By Region
We examined how non-COVID-19 admission trends varied across geographic regions, using the regions defined by the U.S. Census Bureau. To give a sense of the geographic distribution of our dataset, admissions from the Northeast, Midwest, South, and West regions account for approximately 24%, 25%, 28%, and 23% of overall admissions, respectively. While all regions experienced a large drop in COVID-19 admissions early in the pandemic followed by a rebound, the smaller decline in non-COVID-19 admissions in November and early December 2020 has not been uniform across the country. Non-COVID-19 admissions for hospitals as a percent of predicted volume dropped from 85.5% to 76.0% in the Midwest and 84.3% to 75.7% in the West between the weeks ending November 7 and December 5, 2020 (Figure 3). During this same month, COVID-19 cases were surging in many parts of these regions. Hospitals in the South went from 87.8% of predicted non-COVID-19 volume to 82.3% during that same period. Meanwhile, hospitals in the Northeast had experienced the steepest decline in non-COVID-19 admissions early in the pandemic, but non-COVID-19 admissions remained at a higher level than other regions in the fall of 2020 and were at 91.2% of predicted volume the week ending December 5, 2020.
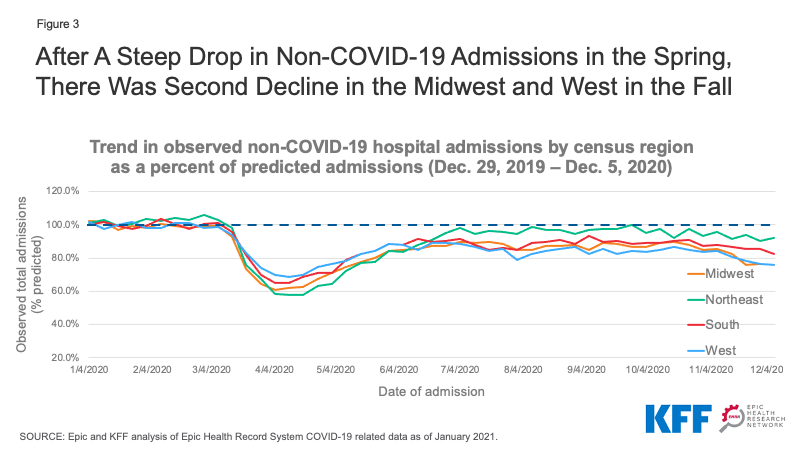
Figure 3: After A Steep Drop in Non-COVID-19 Admissions in the Spring, There Was Second Decline in the Midwest and West in the Fall
Non-COVID-19 Admissions by Age
We stratified the EHRN admissions data by age to assess trends in non-COVID-19 admissions for patients age 65 and older compared to younger patients. We found that admissions for patients age 65 and older was just 53.4-63.0% of predicted levels in April 2020, compared to 68.6-75.1% of predicted levels for younger patients (Figure 4). This may suggest that older patients, at a higher risk of serious illness or death due to COVID-19, were more reluctant than younger patients to enter a hospital if not absolutely necessary. Non-COVID-19 admissions rebounded more slowly for older patients compared to those who are younger, but by September both age groups reached about 88% of predicted admissions. In the week ending December 5, 2020, non-COVID-19 admissions dipped again to 81.5% of predicted admissions for patients under 65 and 79.2% for patients age 65 and older.

Figure 4: After an Early Steep Drop in Non-COVID-Admissions for Those Age 65 and Older, Their Admissions Later Increased
Non-COVID-19 Admissions by Sex
Non-COVID-19 admissions for both male and female patients dropped to approximately 65% of predicted admissions in April 2020 and then increased to roughly 85-90% of predicted admissions by the summer (Figure 5). In November, non-COVID-19 admissions for both males and females dropped slightly to about 80% of predicted admissions. On an absolute level, admissions for female patients remained about approximately 20% higher than for male patients (data not shown). Much of this differential is likely due to women’s admissions for childbirth.
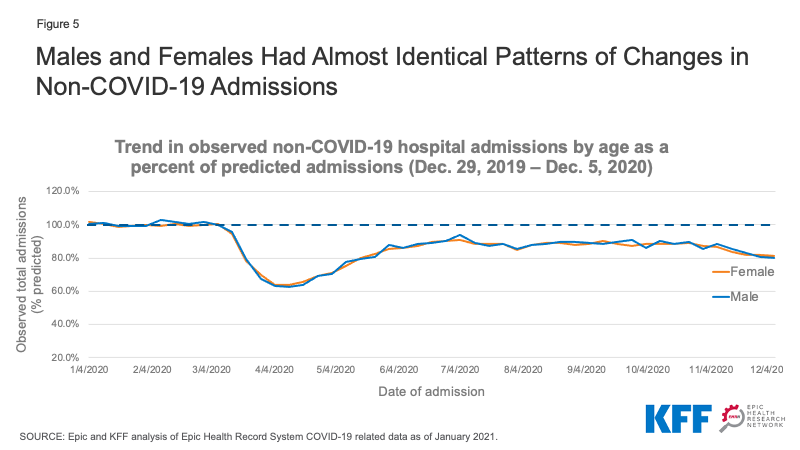
Figure 5: Males and Females Had Almost Identical Patterns of Changes in Non-COVID-19 Admissions
Implications
This updated analysis from the Epic Health Research Network provides additional insights into patterns of hospital admissions during the COVID-19 pandemic—and the impact that trends in COVID-19 cases has on non-COVID-19 admissions. By looking at the patterns in non-COVID-19 admissions, we can see how changes in behavior had a differential impact by region, age, and sex. The levels of non-COVID-19 admissions seen in the fall of 2020 suggest that people may be delaying care in ways that could be harmful to their long-term health. The impact of that forgone care will be an important subject of future analysis.
Tyler Heist, Ph.D., and Sam Butler, M.D., are with the Epic Health Research Network. Karyn Schwartz, M.P.H., is with KFF.