



What Does Democratic Control of Congress Mean for Global Health?

Author: Jennifer Kates
Published: Nov 10, 2026

After unprecedented disruptions and changes made by the Trump administration to U.S. global health funding and programs, altering the larger global health landscape, and eventually leading to its new America First Global Health Strategy (AFGHS), what might Democratic control of Congress mean going forward?

First, and importantly, the election was not about global health or foreign aid. It was largely about what Americans are experiencing at home and their concerns about the economy and affordability, including their own health care costs, though foreign policy also registered, including opposition to the Iran war and other conflicts.

At the same time, the Trump administration’s moves to end USAID received significant public attention. And, when asked, the public does care about the health of those around the world and believes that the Trump administration’s cuts have had a negative impact on their health and on how the U.S. is viewed in the world.

So, what might a Democratic Congress do on global health?

  • Oversight. Congress has broad oversight authority over the executive branch, including through hearings, investigations, legislative report language, document requests, and other actions. Since 2025, Congress has used some of this authority to provide oversight of global health, the AFGHS and its bilateral MOUs with countries, including through reporting requirements and other language in appropriations legislation, and through select hearings, although these have been limited. While there were congressional inquiries over the past two years, Democrats will likely be sharper in their questions and willing to challenge the administration more than the President’s own party. There are also likely to be stronger calls for data and transparency, given concerns about the loss of data, and lack of information on the AFGHS MOUs and implementation plans, which has limited the ability of Congress and others to monitor the status of services and programs and, ultimately, health outcomes. There is also likely to be increased oversight of what happened to USAID and the implications of shuttering the agency for global health and development efforts.
  • Appropriations. Despite the many changes made by the Trump administration to global health, the Republican-controlled Congress continued to appropriate near level funding for global health programs in most cases. At the same time, the administration rescinded some of this funding and has redirected appropriated funds from their originally intended purpose. Both Republicans and Democrats have pushed back on this and more is to be expected with the Democrats in the majority, including stronger appropriations language regarding exactly how funding should be spent. If the administration were to rebuff these efforts, Congress has the ability to go to court (though it is not clear if they would on these issues).
  • Authorizing & Shaping the Future. More generally, there are many questions about how to make the new AFGHS successful and what the future of the U.S. global health response should be given the changes made by the administration, but also broader changes happening in global health. These questions have been raised by both Republicans and Democrats in the current Congress, and Democrats could continue to lay out a vision for the future, including:
    • How transition and sustainability of U.S. global health programs can responsibly be achieved, and what are the right early warning indicators and metrics that could be used to assess progress? What data and monitoring systems are needed?;
    • What is the future role of PEPFAR, the President’s Emergency Plan for AIDS Relief, the largest component of the U.S. global health portfolio? What will be the continued focus on HIV as the U.S. seeks to integrate HIV programs into country health systems?;
    • How should those who are most vulnerable and at-risk best be reached, as more responsibility for financing and service delivery is transferred to countries?;
    • Where and under what circumstances might the U.S. want to continue to provide bilateral global health support, especially to countries that are most financially vulnerable and/or experience unexpected shocks or crises in the future?; and
    • How might the U.S. engage multilaterally on global health (as it has been doing even under the Trump administration through new partnerships with the Global Fund to Fight AIDS, Tuberculosis and Malaria and a resumption of funding for Gavi, The Vaccine Alliance), including through expanded pooled procurement to promote affordable access to health products?

These issues are part of a longer-term project, but one that Congress could increasingly weigh in on now.

What we still don’t know. Of course, there remain many unknowns and questions about the next two years, even with the shift in control of Congress. The administration has and likely still will use executive authority broadly and on global health specifically. Congress cannot simply rescind the many executive orders the administration has issued. It is also unknown how the administration might react to more oversight of these issues – President Trump could still ignore what Congress demands, double down on the current path, or seek to pursue greater cooperation in some areas. There may be changes in agency personnel that could impact global health programs, such as if Secretary of State Rubio or Secretary of HHS Kennedy step down, each of whom has authority over different aspects of global health policy. Finally, while bipartisanship has historically been the “secret sauce” of U.S. global health over multiple Congresses and administrations and even carrying through, albeit to a lesser extent, the past two years, there will be numerous changes in Congress that create some uncertainty in this regard. This includes the loss of several Republican global health champions (e.g., Senators Collins and Graham), the elevation of Democratic champions as part of the majority (e.g., Senators Murray, Schatz, and Coons and Representative Frankel), and the entrance of more than 100 new members of Congress, most of whom will be new to global health and development. Ultimately, whether bipartisanship on global health holds, or becomes more fractured, will be an important determinant of the future story.
The Business of Health with Chip Kahn

The Drug Enterprise in the Age of AI

November 10, 2026

Listen on YouTube

About this Episode


Episode 23, AI Series: AI is speeding up the search for new medicines. Can it make the discoveries themselves?

Few people are better placed to answer than Dr. Elias Zerhouni. He ran the National Institutes of Health, then global R&D at Sanofi. He co-founded ModeX Therapeutics, which uses machine learning to design antibodies that don’t exist in nature, and he is now vice chairman and president of its parent company, OPKO Health.

His test for AI: give it every piece of data available in the early 1950s, and it would not have found the double helix. The spark, he argues, is still human.

Chip and Dr. Zerhouni dig into what AI is actually doing in drug development, how the FDA stacks up against regulators abroad, and what a slowdown in AI — and the erosion of American research — could mean for the next generation of cures.

The Host


Headshot photo of Chip Kahn wearing a navy blue suit with a red tie, red pendant on lapel, and glasses.

Sr. Visiting Fellow

Charles N. Kahn III is a senior visiting fellow at KFF. He is also a visiting senior fellow at the American Enterprise Institute and a nonresident senior scholar at the University of Southern California’s Schaeffer Center for Health Policy & Economics. He serves as co-chair of the international Future of Health collaborative.

Guest


Former National Institutes of Health Director (2002-2008); Vice Chairman and President of OPKO Health; Professor Emeritus, Johns Hopkins University

Elias Zerhouni, MD, is currently Vice Chairman and President of OPKO Health. He was the President, Global Research & Development, and a member of the Executive Committee for Sanofi from January 2011 to July 2018.

Dr. Zerhouni’s academic career was spent at Johns Hopkins University and Hospital where he was professor of Radiology and Biomedical Engineering and senior adviser for Johns Hopkins Medicine. He served as Chair of the Russell H. Morgan Department of Radiology and Radiological Sciences, Vice Dean for Research and Executive Vice Dean of the School of Medicine from 1996 to 2002 before his appointment as Director of the National Institutes of Health (NIH) from 2002 to 2008. In that position he oversaw NIH’s 27 Institutes and Centers with more than 18,000 employees and a budget of $29.5 billion (2008).

In November 2009, President Obama appointed Dr. Zerhouni as one of the first presidential U.S. science envoys. Dr. Zerhouni also served as senior fellow to the Bill and Melinda Gates foundation from 2009 to 2010 and senior advisor to the CEO of Sanofi.

Dr. Zerhouni has founded or co-founded five start-up companies, authored more than 200 publications and holds several patents. He has assumed positions on several Boards, the board of the Lasker Foundation, Research!America, the NIH Foundation and Danaher Corporation. He is also a member of the Council of the U.S. National Academy of Medicine and a member of the U.S. National Academy of Engineering. He received the prestigious Legion of Honor medal from the French National Order in 2008 and was elected in 2010 as a member of the French Academy of Medicine and appointed as Chair of Innovation at the College de France in 2011.


SERIES

This weekly podcast features insightful conversations between host Chip Kahn and his guests, who discuss the business of health care, connecting the dots between the health care business, policy, and patients.

The podcast’s first series on AI in health care illuminates how AI is changing health care, and features guests who are deploying this technology, managing its consequences, and designing policy around it.

Medicare Cuts to 340B Drug Payments Will Hit Safety-Net Hospitals While Benefiting For-Profit Hospitals

Published: Nov 6, 2026

Editorial Note: Originally published on July 29, 2026, this brief has been updated to reflect changes in the final rule.

The recently finalized 2027 Medicare Hospital Outpatient Perspective Payment System (OPPS) rule from the Centers for Medicare & Medicaid Services (CMS) includes a rule to reduce Medicare’s reimbursement for 340B drugs. The rule will reduce reimbursement for 340B drugs from average sales price (ASP) plus 6% (what Medicare generally pays for Part B outpatient drugs administered by providers) to ASP minus 28%, a 32% reduction (CMS originally proposed reducing reimbursement to ASP minus 33.4%). CMS indicated that this change will better align Medicare reimbursement with hospitals’ costs of acquiring 340B drugs.

The 340B Drug Pricing Program requires drug manufacturers participating in Medicaid to sell outpatient drugs to eligible nonprofit and government providers at a substantial discount, allowing providers to earn larger profits when being reimbursed for 340B drugs. The intent of the program is to support providers, such as certain disproportionate share hospitals and federally qualified health clinics, that care for low-income and other underserved populations. Critics have raised concerns that the 340B program, which has grown substantially over time, is not well-targeted; that savings from the program are not shared with patients; and that the program incentivizes hospitals to acquire clinics and physician practices in order to extend 340B discounts to those settings, enabling them to generate more revenue. Supporters of the program say that revenues generated by the difference between Medicare (and other payer) reimbursement for 340B drugs and the discounted price help 340B providers care for underserved populations and invest in operations.

CMS based the amount of the payment reduction on the maximum allowed acquisition costs under the 340B program, after also considering a cost acquisition survey of 340B drugs completed by hospitals in early 2026 (CMS originally proposed setting reimbursement to ASP minus 33.4% based on the survey, but set reimbursement using the maximum allowed acquisition costs in the final rule to simplify future updates, among other reasons). This change revives an earlier effort by CMS to reduce Medicare payments for 340B drugs that was implemented in 2018 under the first Trump administration, but the Supreme Court overturned that rule in 2022 because the agency had not first conducted a cost acquisition survey. CMS’s Medicare 340B payment reduction will take effect on January 1, 2027, and will have disparate effects on different types of hospitals, as described more below.

CMS’s finalized cut to 340B drug reimbursement will reduce Medicare spending on 340B drugs by an estimated $4.65 billion in 2027, while increasing spending on non-drug outpatient services by the same amount because of budget neutrality requirements. Under federal law, CMS is generally required to maintain the same amount of aggregate spending through OPPS regardless of reimbursement changes (i.e., maintain budget neutrality). Based on this requirement, CMS finalized a 7.5% across-the-board increase in payments for non-drug outpatient services covered under the OPPS, which the agency estimates will offset the impact of cuts to spending on 340B drugs in 2027.

The budget neutrality requirement means that savings from reductions in 340B payments to 340B hospitals would be redistributed to both 340B and non-340B hospitals through higher payments for non-drug outpatient services. Similarly, Medicare beneficiaries would face lower cost sharing on 340B drugs (e.g., based on 20% coinsurance applied to a lower amount) but higher cost sharing for non-drug outpatient hospital services. CMS estimates that Medicare beneficiaries who use 340B drugs would save $1.1 billion in total in 2027, but cost sharing would increase for beneficiaries who use non-drug outpatient hospital services based on Medicare’s proposed 7.5% payment increase.

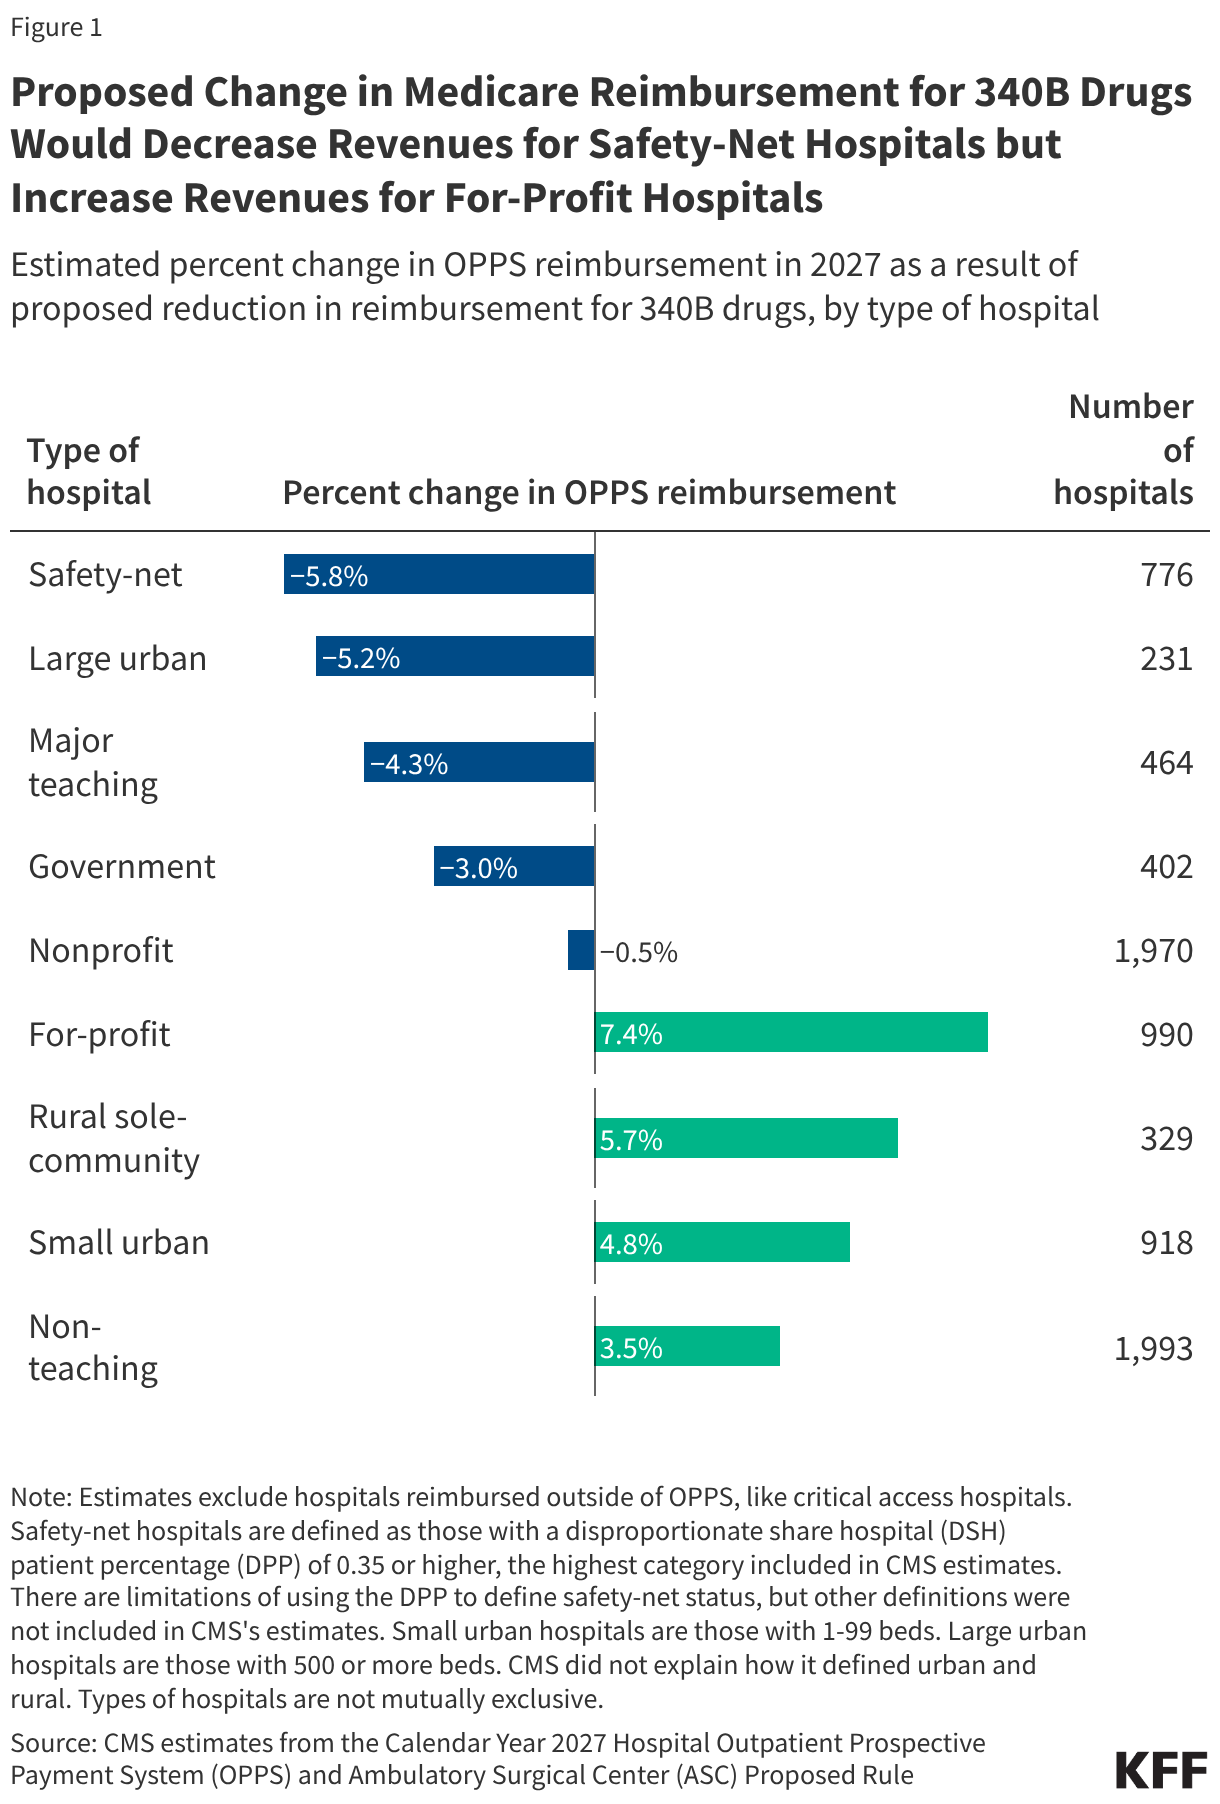
Proposed cuts will reduce revenues among safety-net hospitals while increasing revenues among for-profit hospitals, among other differences. For 340B hospitals, total Medicare revenues will decrease or increase depending on how reliant they are on revenues from 340B drugs versus non-drug outpatient services, but non-340B hospitals would experience revenue increases only based on the higher payment rate for non-drug outpatient services. CMS’s rule to reduce reimbursement for 340B drugs will exempt rural sole community hospitals (SCHs) (rural hospitals that are the only source of short-term, acute inpatient care in a region), children’s hospitals, and PPS-exempt cancer hospitals. Changes will not affect hospitals that are not reimbursed under the OPPS, including critical access hospitals (CAHs), which make up the majority of rural hospitals.

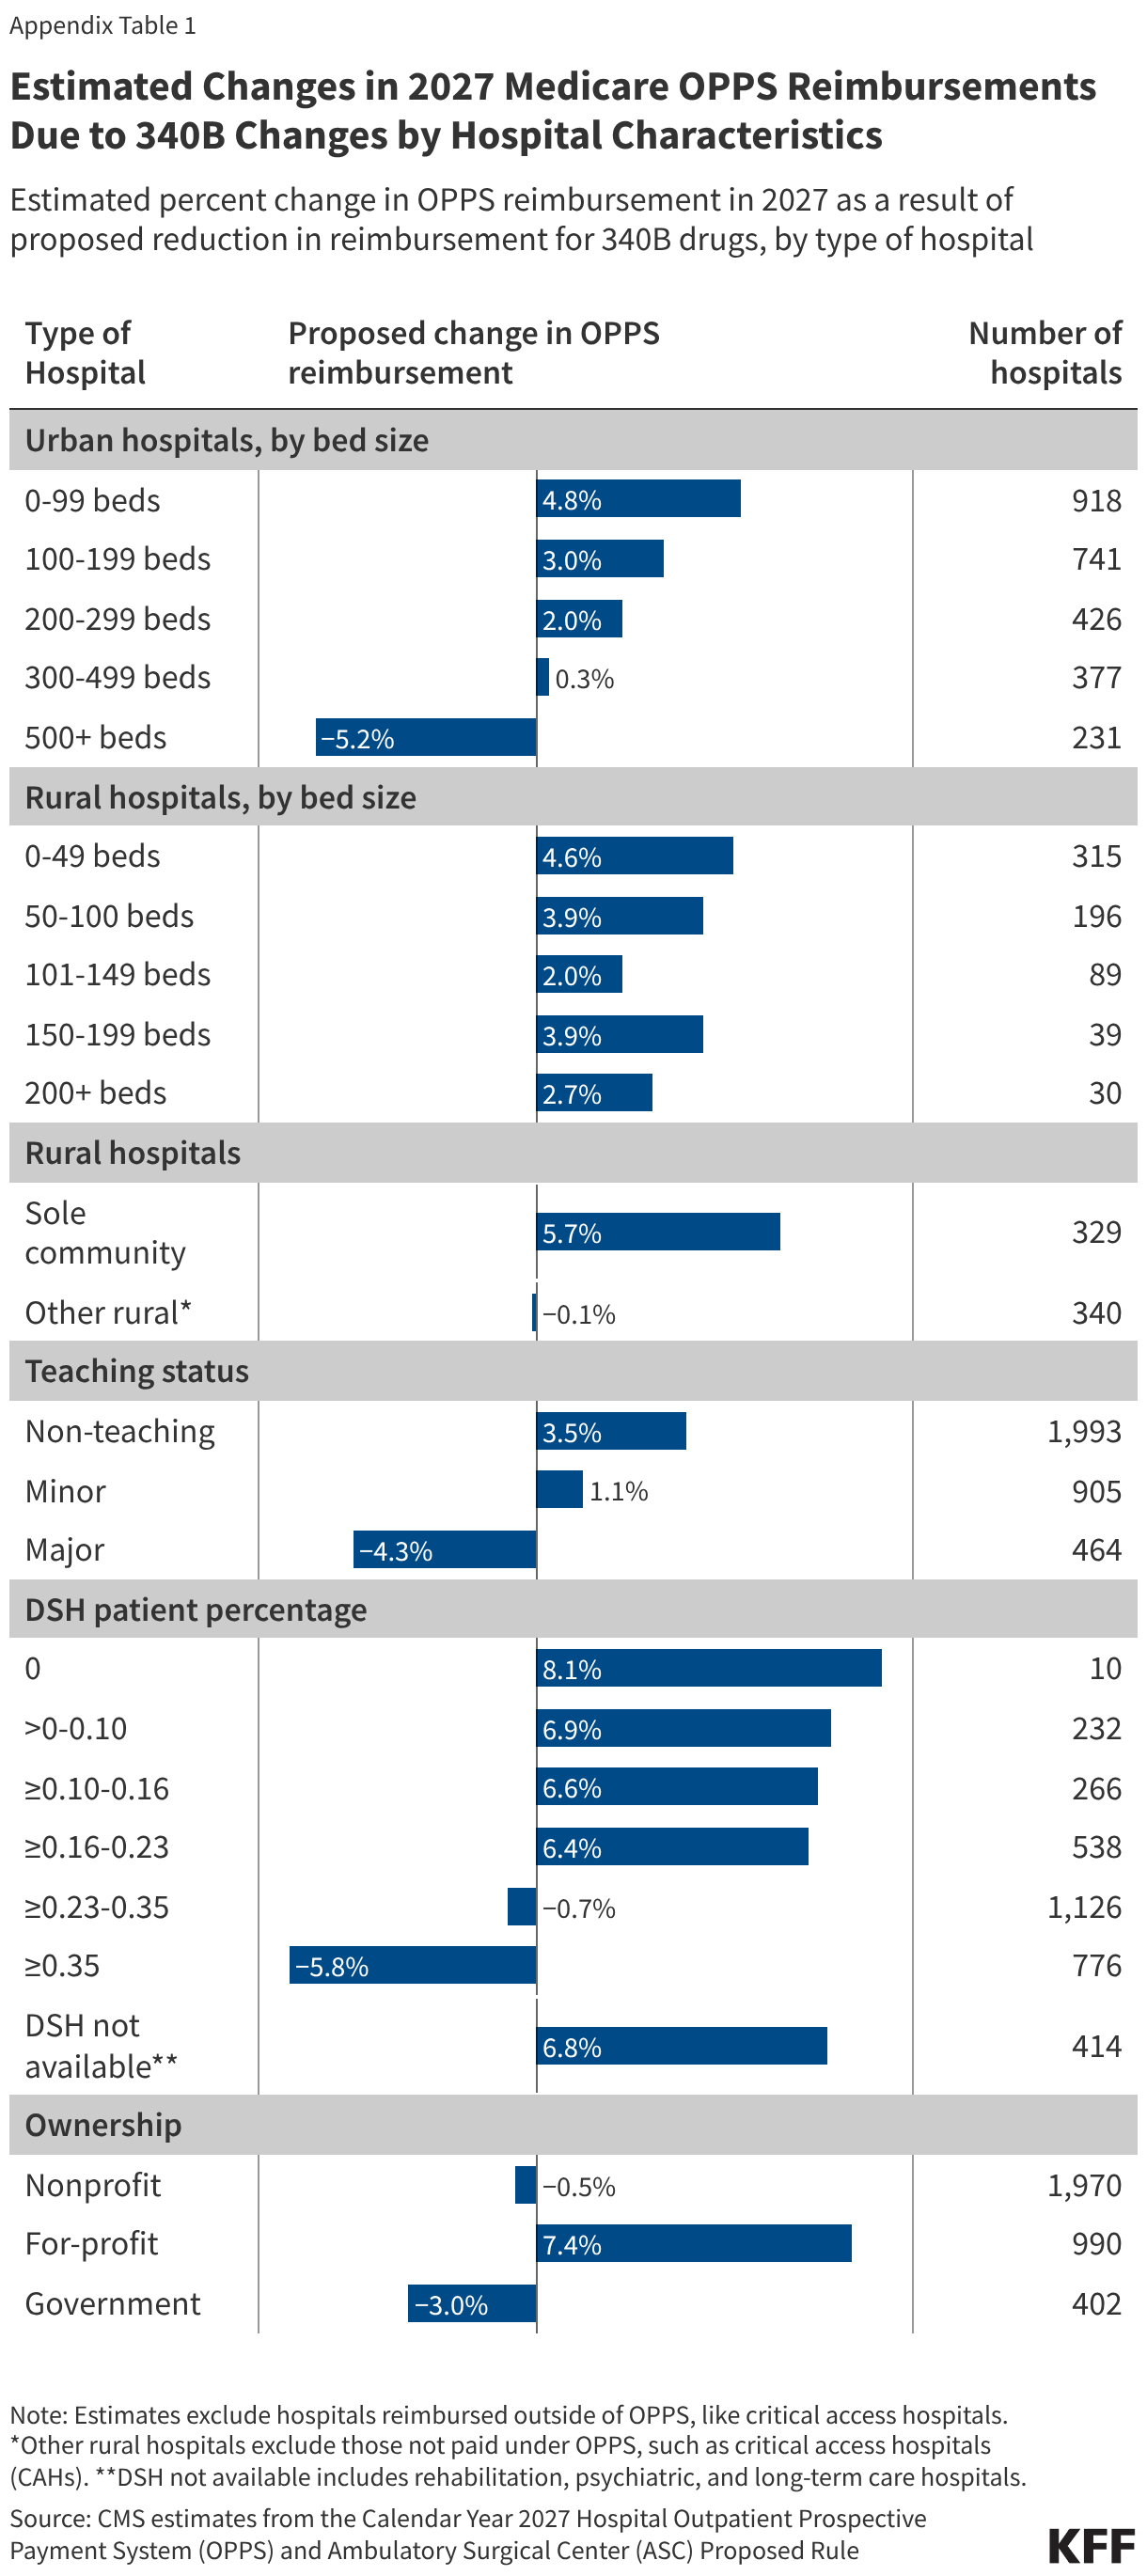
In the aggregate, some types of hospitals will lose or benefit more from these changes than others, based on estimates from CMS (Figure 1):

  • Safety-net hospitals will face a 5.2% net reduction of OPPS revenue under this proposal (see figure notes for definition of “safety-net hospitals”). Other types of hospitals will also see net reductions in OPPS revenue in the aggregate, including large urban hospitals (with 500 beds or more) (-4.8%), major teaching hospitals (-3.9%), government hospitals (-2.9%), and nonprofit hospitals (-0.4%). Some hospitals that will see the largest decrease in revenue likely fall into more than one of these categories (e.g., major teaching hospitals tend to be large urban hospitals).
  • For-profit hospitals will see a 6.8% net increase in OPPS revenues. For-profit hospitals are not eligible for the 340B program and so will only see increases in reimbursement for non-drug outpatient services. Other types of hospitals will also face net increases in Medicare OPPS reimbursement in aggregate, including rural SCHs (5.3%), small urban hospitals (with 0 to 99 beds) (4.5%), and non-teaching hospitals (3.5%). 
Change in Medicare Reimbursement for 340B Drugs Will Decrease Revenues for Safety-Net Hospitals but Increase Revenues for For-Profit Hospitals (Table)

Reductions in 340B payments could add to the financial challenges facing safety-net hospitals while increasing margins of for-profit hospitals. Safety-net hospitals have lower operating margins than average and so could have an especially difficult time absorbing any revenue losses from the 340B payment cut, while for-profit hospitals have much higher operating margins than the average hospital. Additionally, safety-net hospitals, which are particularly dependent on Medicaid revenues, are likely to be disproportionately affected by the 2025 reconciliation law, as it achieves most of its health care savings through federal Medicaid spending reductions.

The substantial growth of the 340B program in recent years has led hospitals, pharmaceutical companies, and policymakers to focus on whether and how to change the program. At the federal level, lawmakers have proposed options that would preserve or narrow the scope of the program and have proposed increasing transparency around the program, such as by requiring hospitals to report 340B savings. At the state level, some states have passed laws that would preserve the ability of hospitals to use multiple contract pharmacies to dispense 340B drugs, among other things. Other states have implemented requirements for hospitals to disclose the amount of savings generated from the 340B program (as required by Minnesota) or how those savings are spent.

Some pharmaceutical companies have attempted to start providing 340B drug discounts through a rebate model, an approach that would require hospitals to purchase 340B drugs at a non-discounted price and receive post-sale rebates after submitting claims information. These efforts have been halted by the courts due to lack of authorization from HHS, the agency that administers the 340B program. In 2025, the Trump administration attempted to implement the 340B Rebate Model Pilot Program, but a court halted the pilot after a lawsuit was filed by the hospital industry. HHS announced a revised rebate model pilot in July 2026, which has also been challenged in court.

Appendix

Estimated Changes in 2027 Medicare OPPS Reimbursements Due to 340B Changes by Hospital Characteristics (Table)

Status of State Medicaid Expansion Decisions

Published: Nov 6, 2026

The Affordable Care Act’s (ACA) Medicaid expansion expanded Medicaid coverage to nearly all adults with incomes up to 138% of the Federal Poverty Level ($21,597 for an individual in 2025) and provided states with an enhanced federal matching rate (FMAP) for their expansion populations.

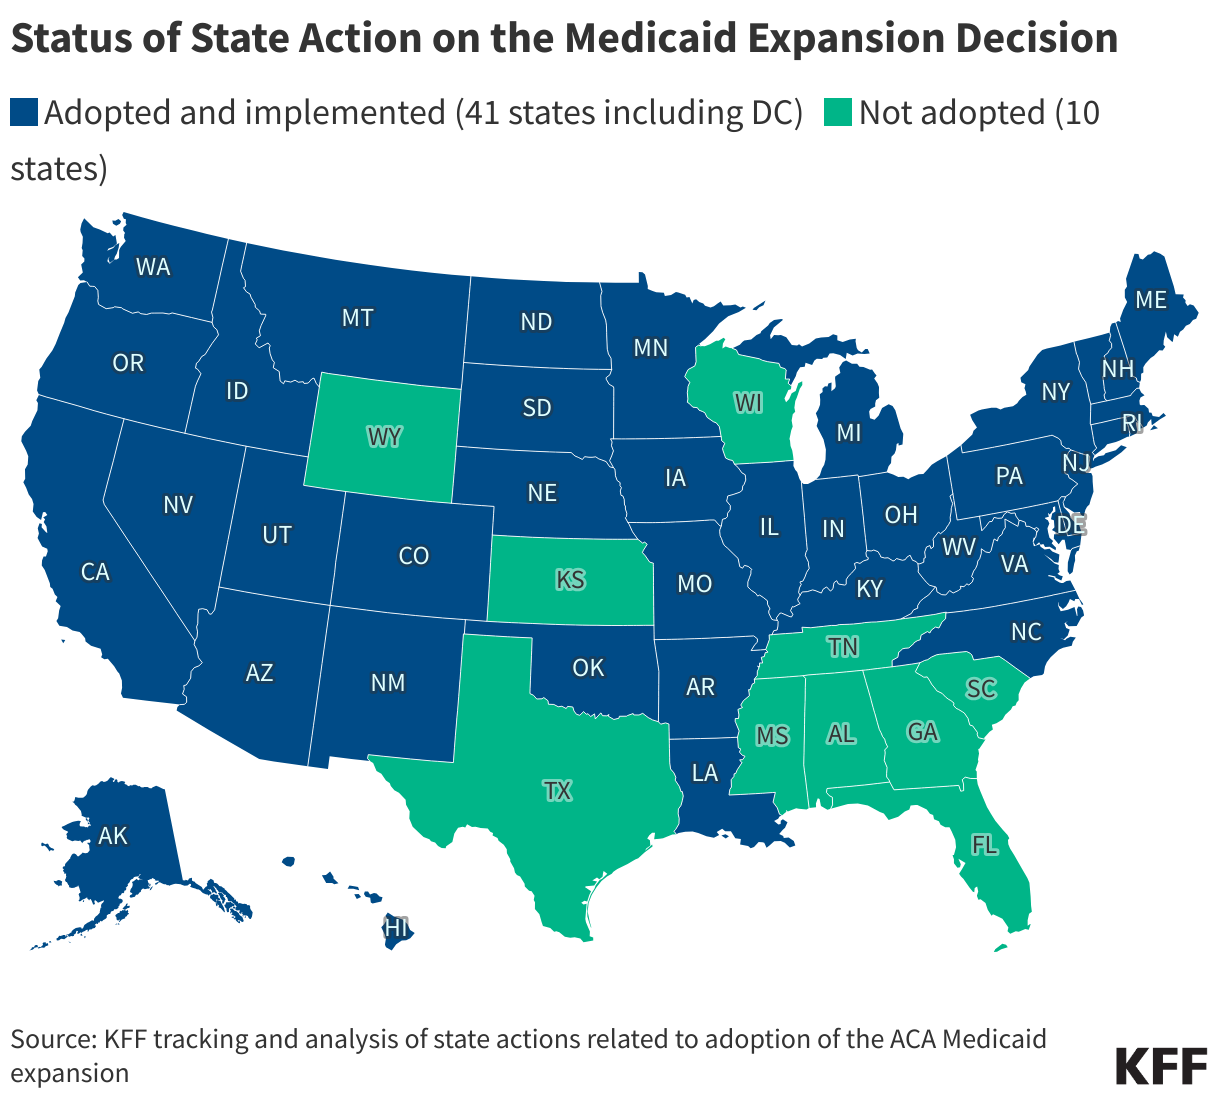
To date, 41 states (including DC)   have adopted   the Medicaid expansion and 10 states   have not adopted   the expansion. Current status for each state is based on KFF tracking and analysis of state expansion activity.

These data are also available in a table format. The map may be downloaded as a Powerpoint.

Status of State Action on the Medicaid Expansion Decision (Choropleth map)
Key States with Expansion Activity (Table)

Medicaid Expansion Resources

KFF Tracker: America First MOU Bilateral Global Health Agreements

Published: Nov 6, 2026

Editorial Note: Originally published on January 13, 2026, this resource will be updated as needed, most recently on November 6, 2026, to reflect additional developments. Download a one-page fact sheet of this tracker.

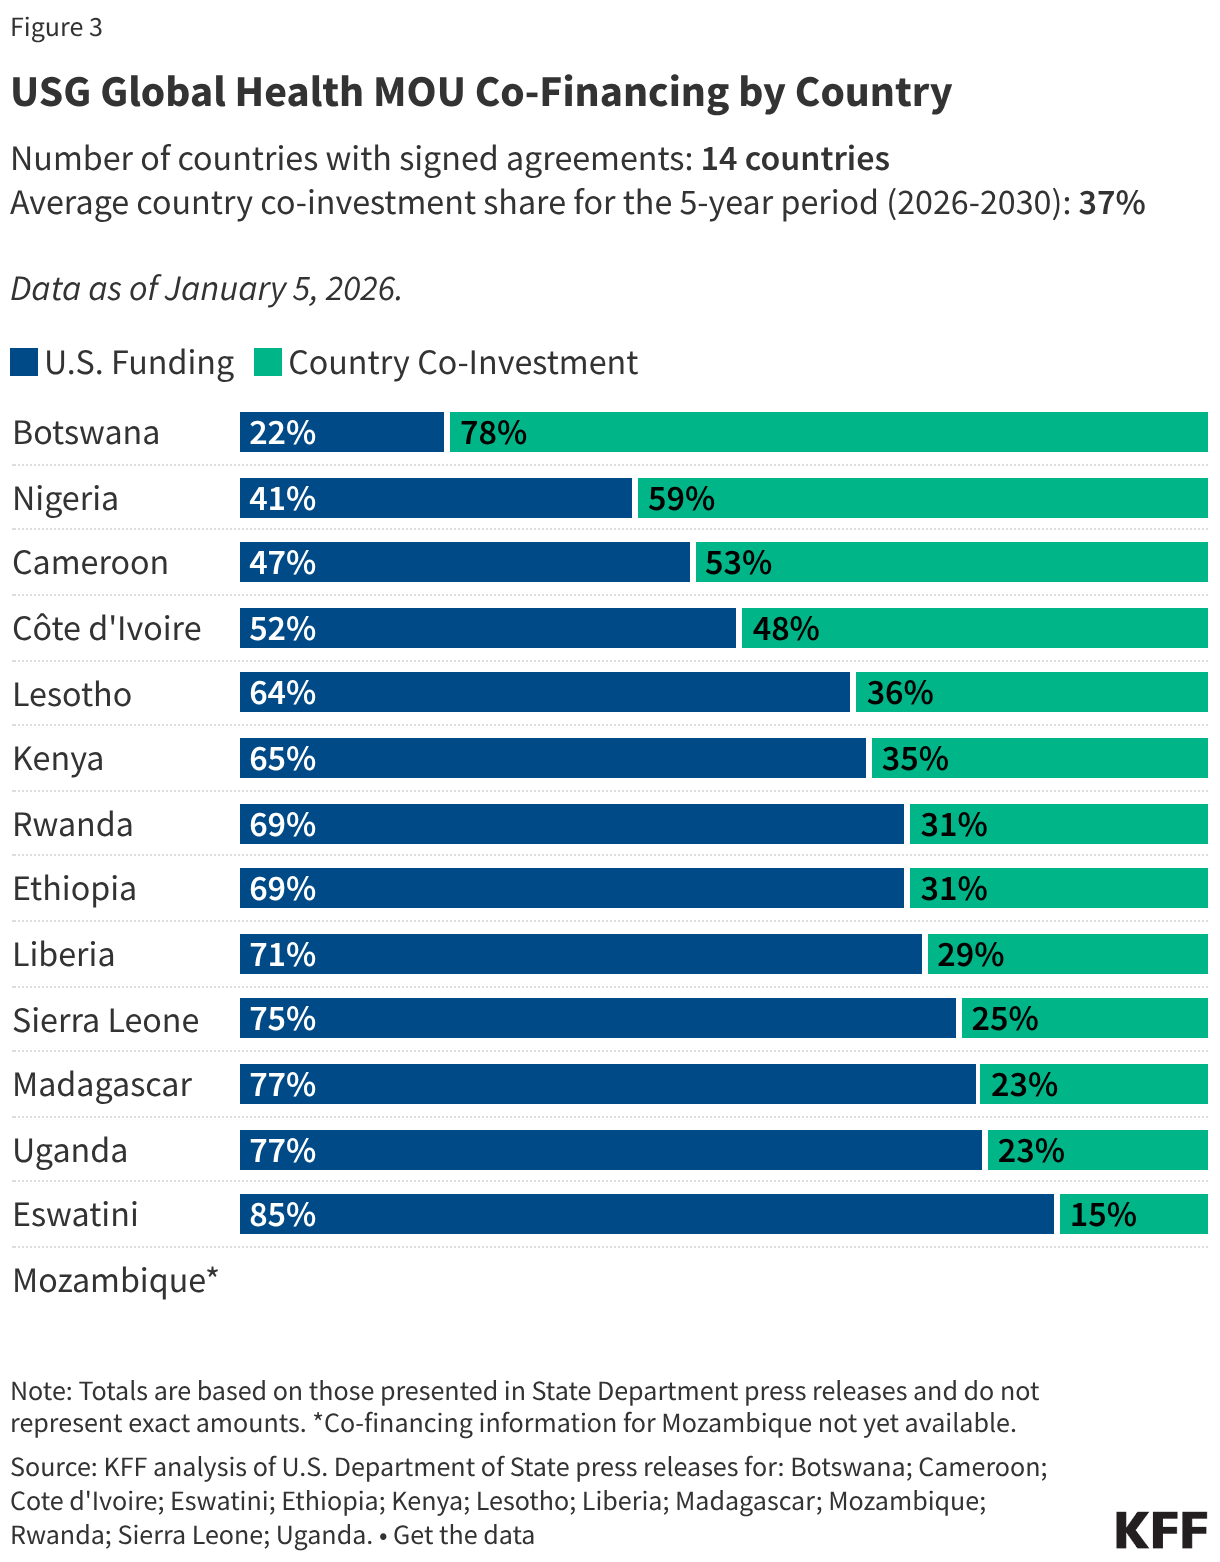
On September 18, 2025, the U.S. government (USG) released its new America First Global Health Strategy, which details how the U.S. will engage in global health efforts moving forward. As part of this new strategy, the U.S. has announced that it will be establishing bilateral health cooperation agreements with countries that receive U.S. global health assistance. These agreements, or memoranda of understanding (MOUs), between the U.S. and partner countries represent five-year plans (for the period 2026-2030) outlining U.S. engagement in each country’s health efforts with the goal of “helping countries move toward more resilient and durable health systems.” Central to these plans is transitioning country programs from U.S. assistance to long-term country ownership, with a pledge from each partner country to increase its domestic health spending, or co-investment in health, over the next five years as the U.S. decreases its health assistance. The U.S. began signing these agreements in late 2025 and this process is ongoing. Implementation is slated for later this year.

This tracker provides an overview of the MOUs signed to date. Data are based on press releases issued by the State Department, U.S. embassies and partner country Ministries of Health, as well as MOU documents (if publicly available). See Methods for more information. This tracker will be updated as agreements are signed and more data become available.

USG Global Health MOUs by Country (Table)
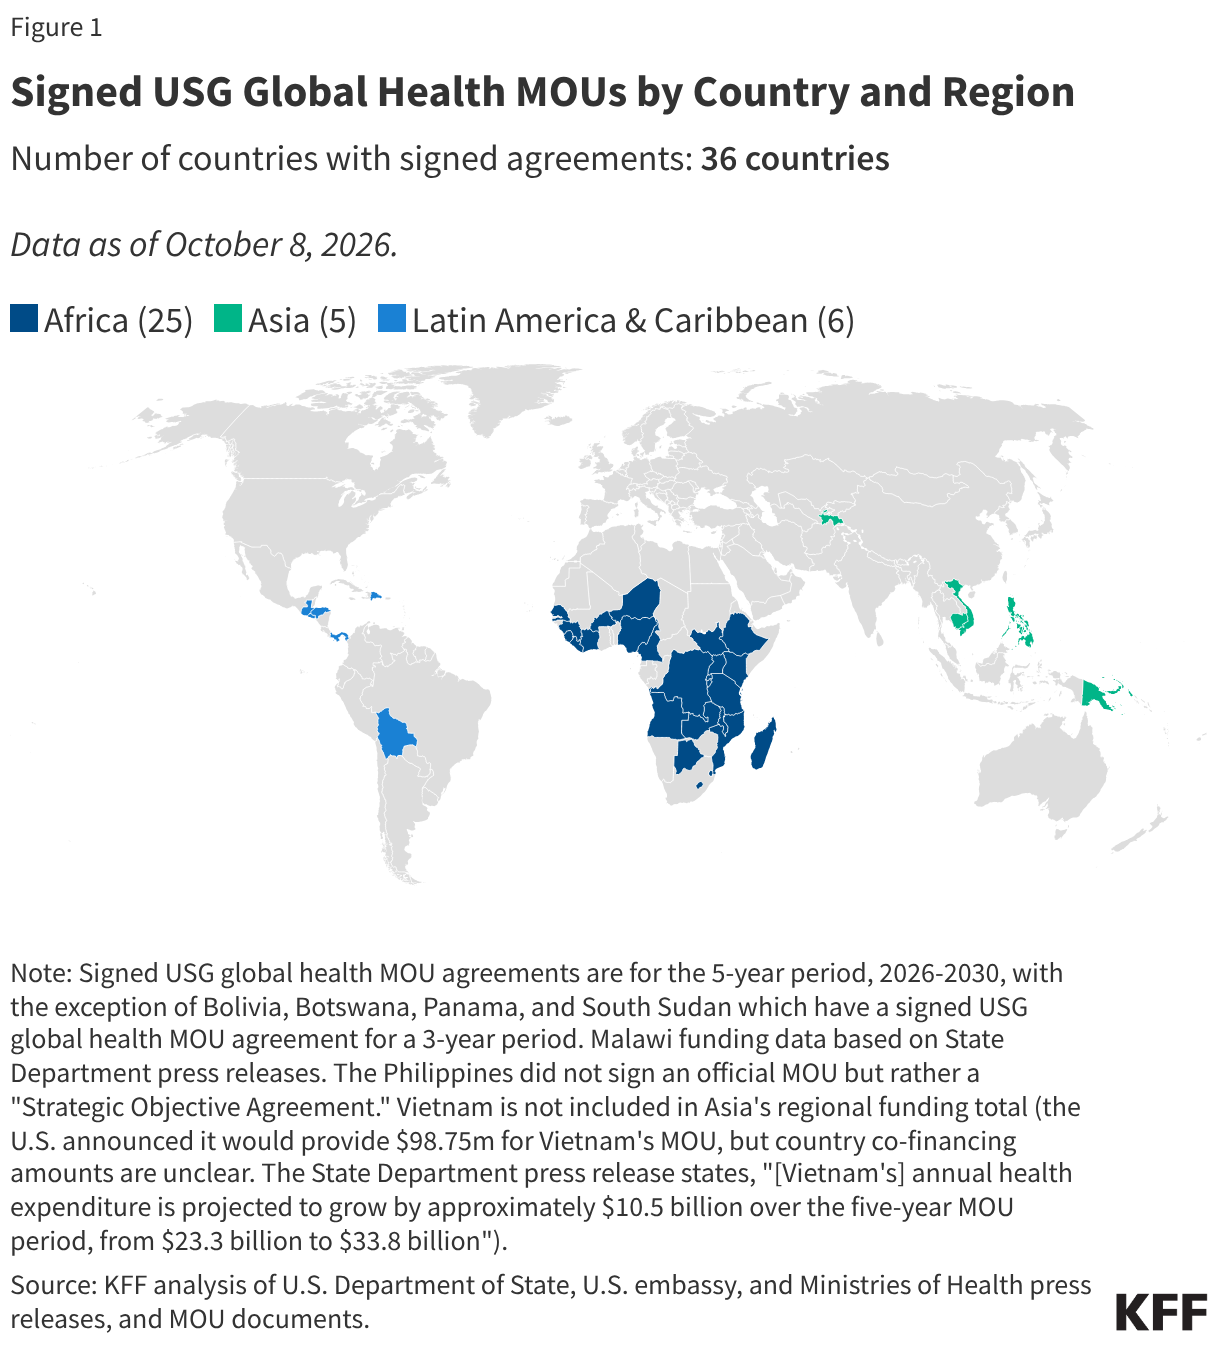
Signed USG Global Health MOUs by Country and Region (Choropleth map)
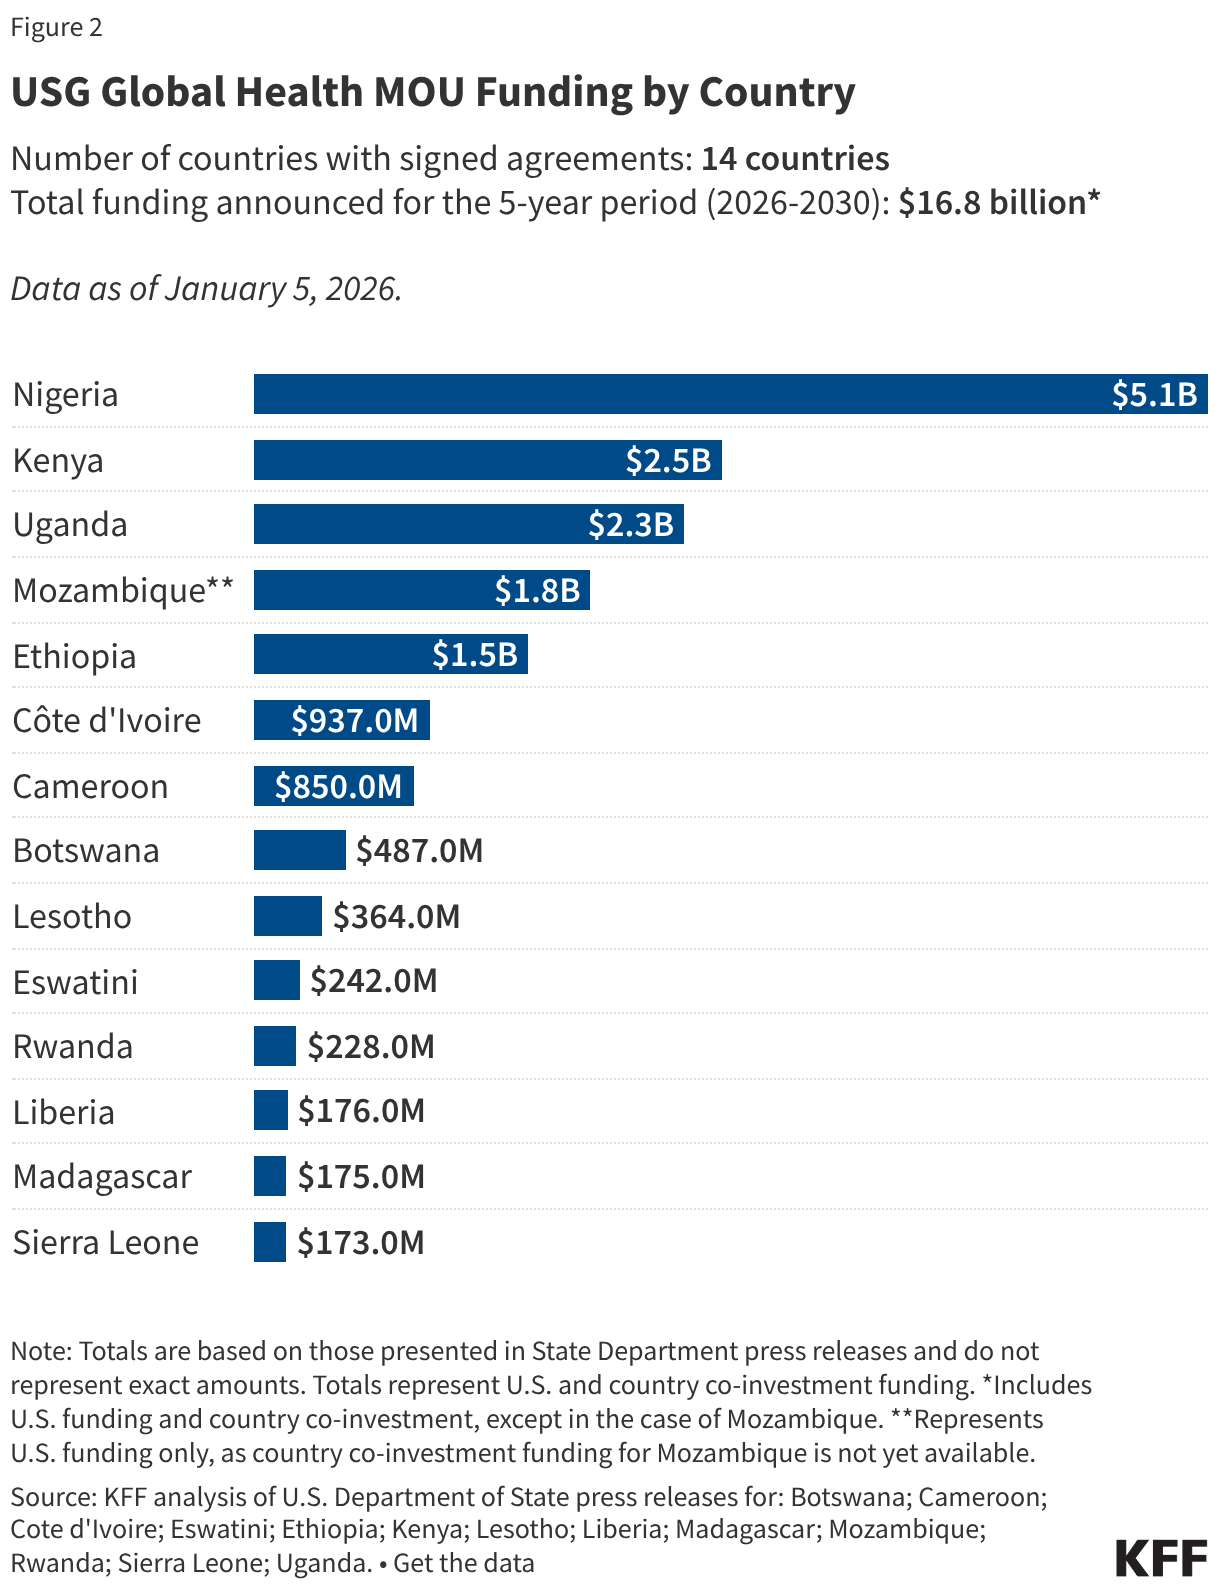
Global Health MOU Funding by Country (Bar Chart)
USG Global Health MOU Co-Financing Share by Country (Stacked Bars)
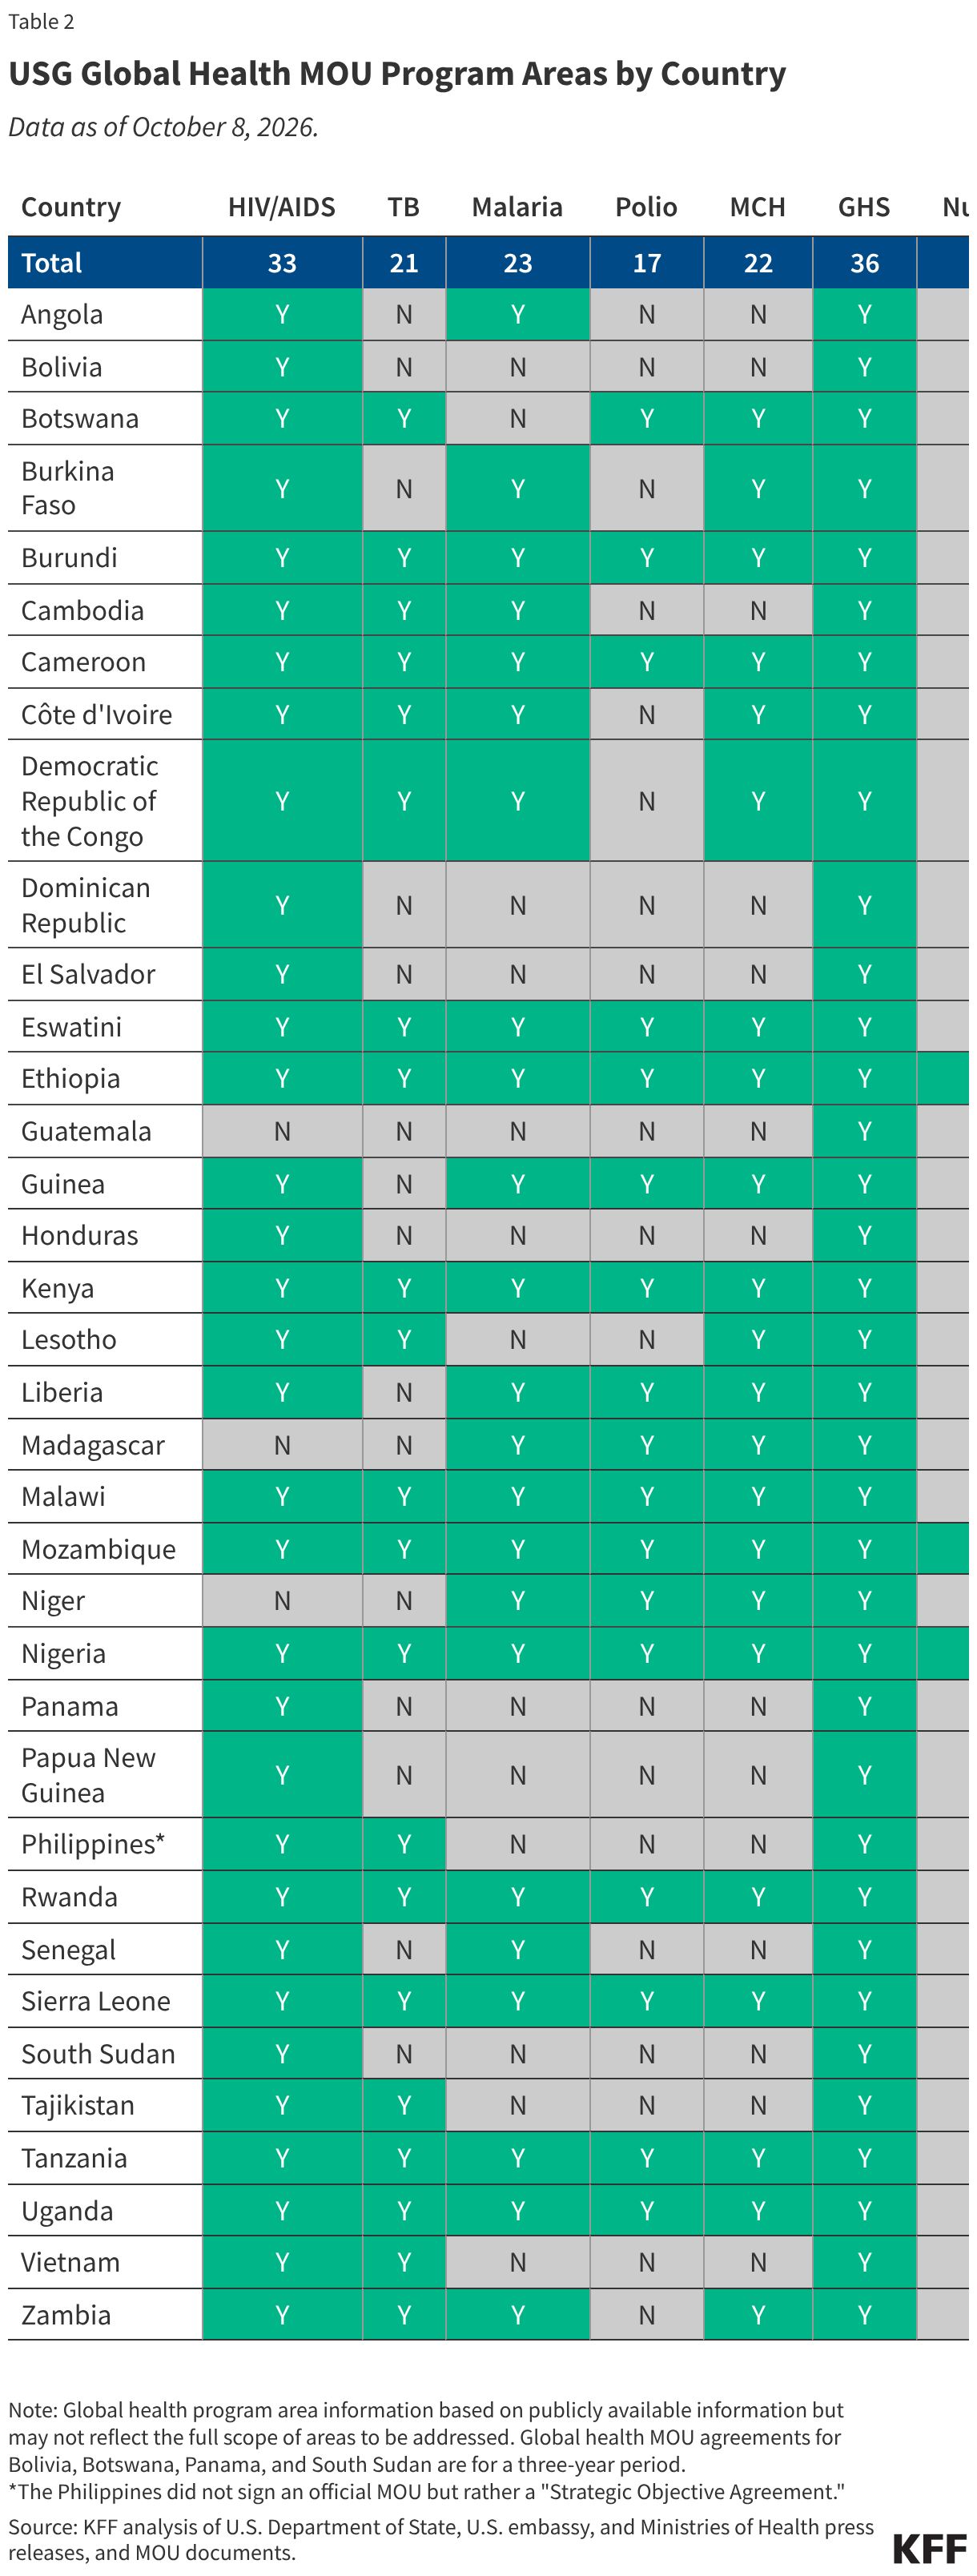
USG Global Health MOU Program Areas by Country (Table)
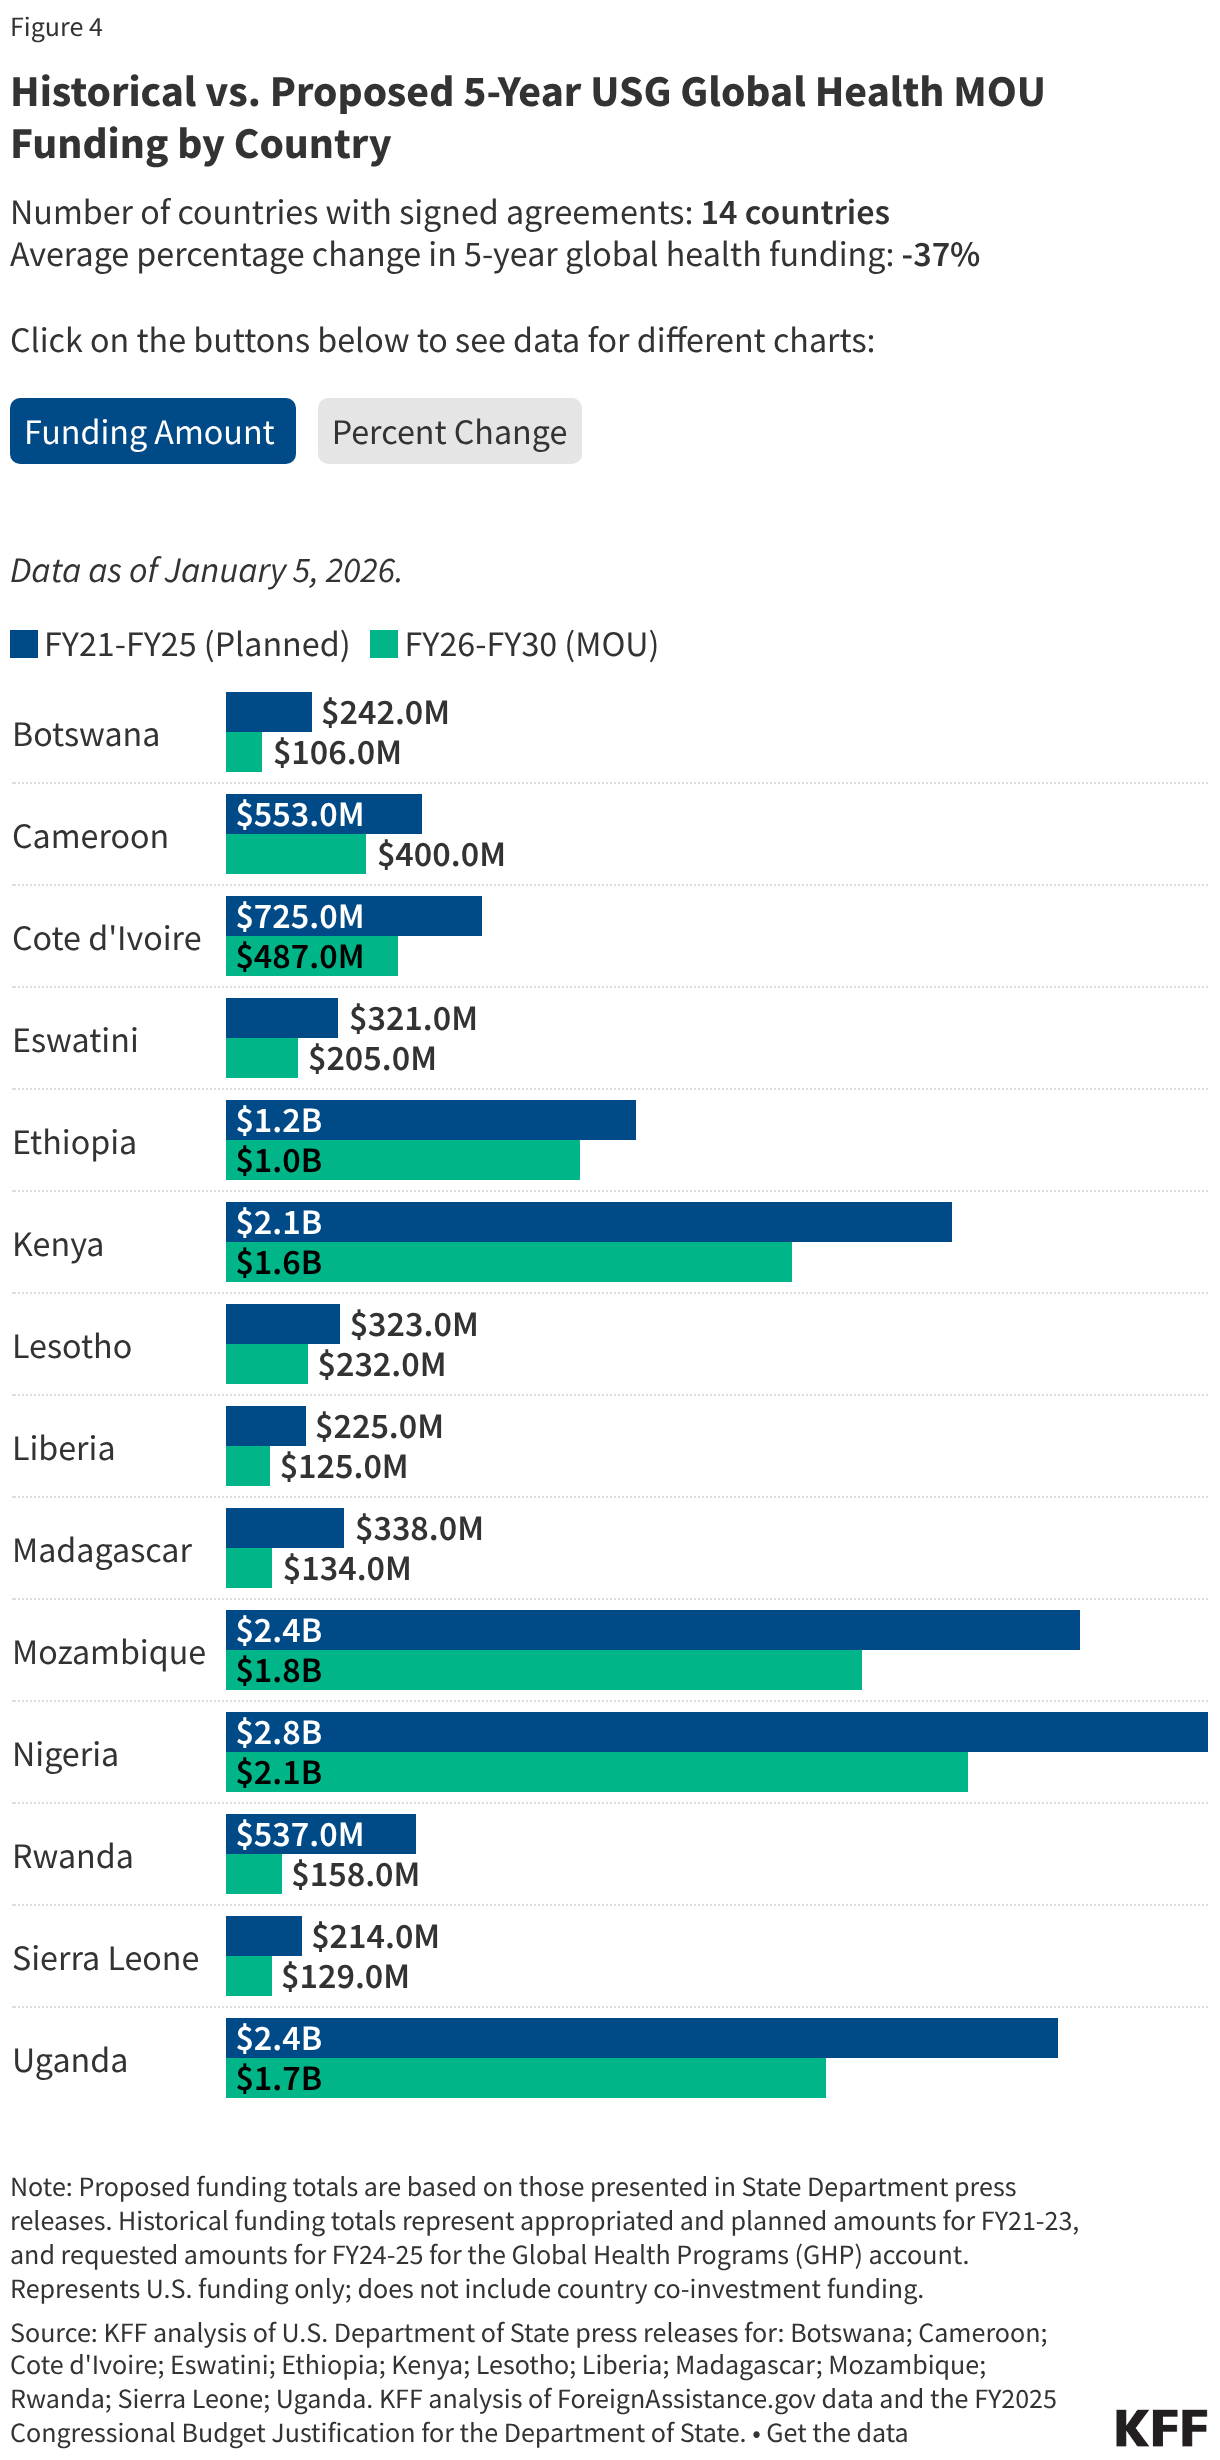
Historical vs. Proposed 5-Year USG Global Health MOU Funding by Country (Grouped Bars)

Countries with Publicly Available MOUs

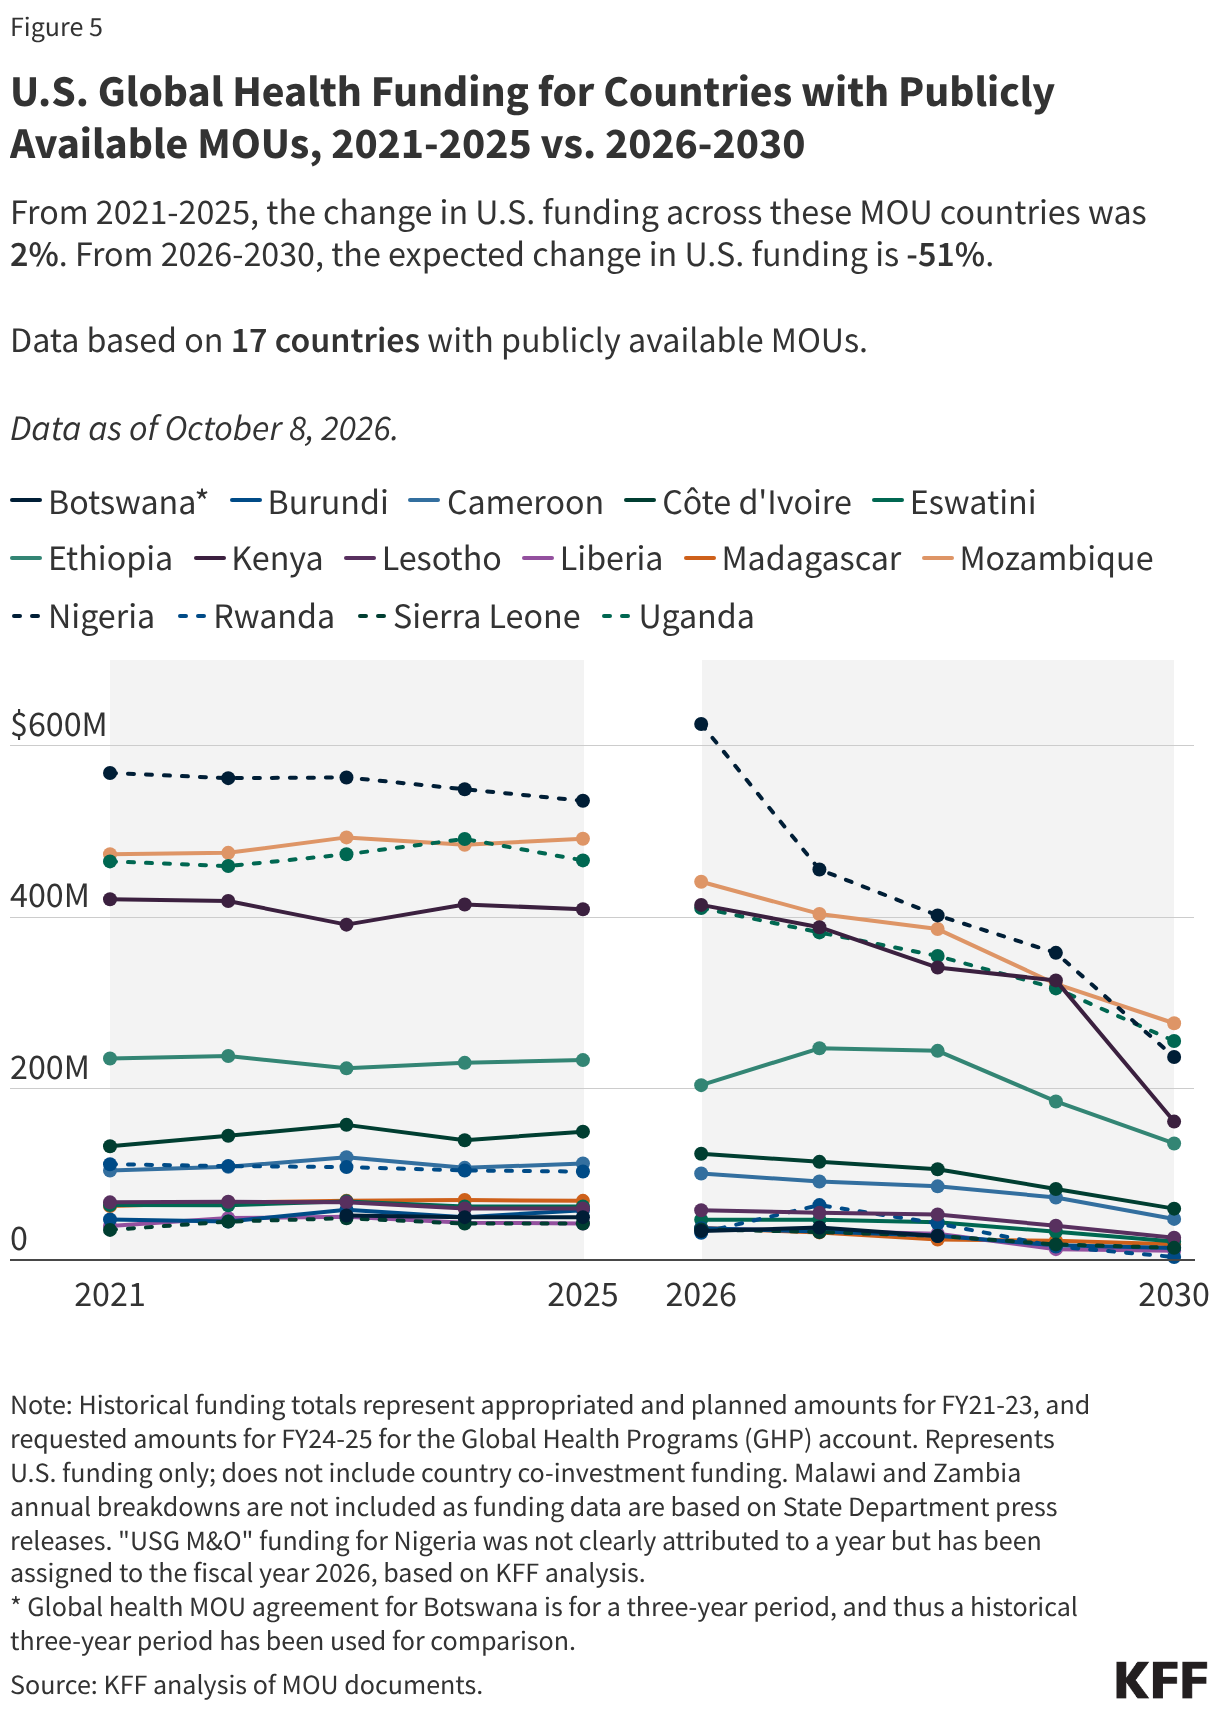
Note: The figures in this section get updated as MOUs become publicly available and we are able to review the data. Therefore, there may be data lags, and figures may not yet contain details from all publicly available MOUs that are noted in the previous section.

U.S. Global Health Funding for Countries with Publicly Available MOUs, 2021-2025 vs. 2026-2030 (Line chart)
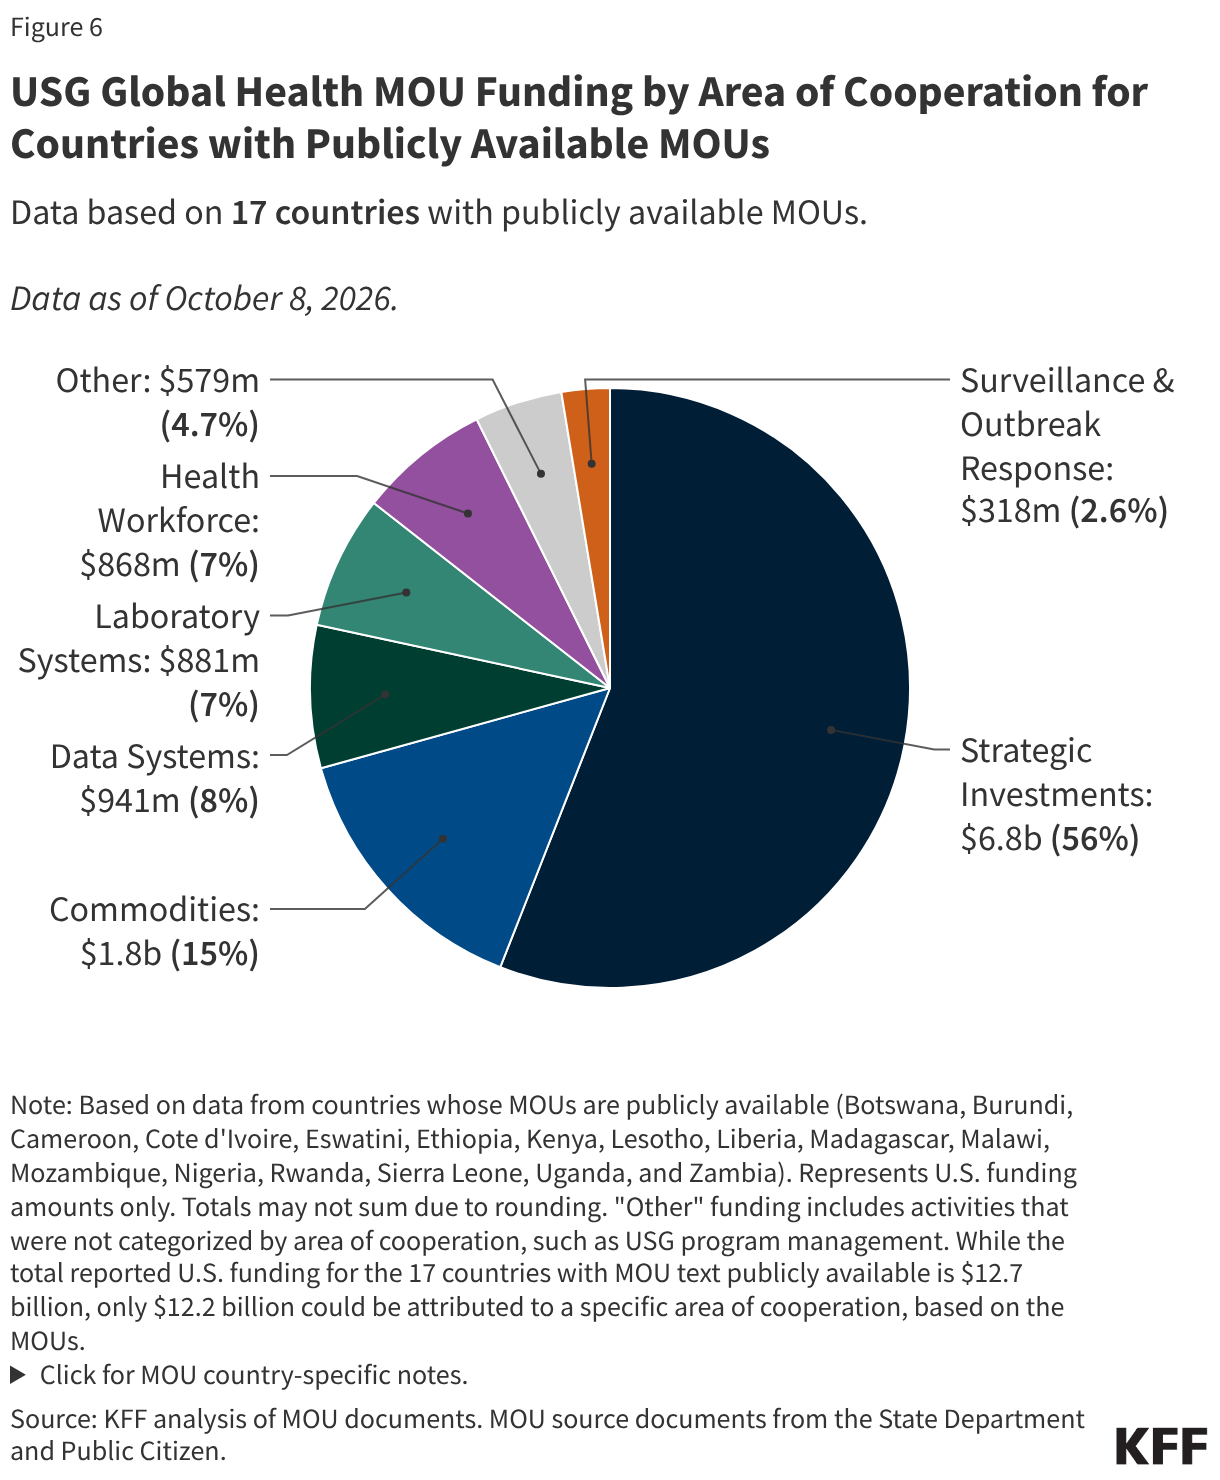
USG Global Health MOU Funding by Area of Cooperation for Countries with Publicly Available MOUs (Pie Chart)
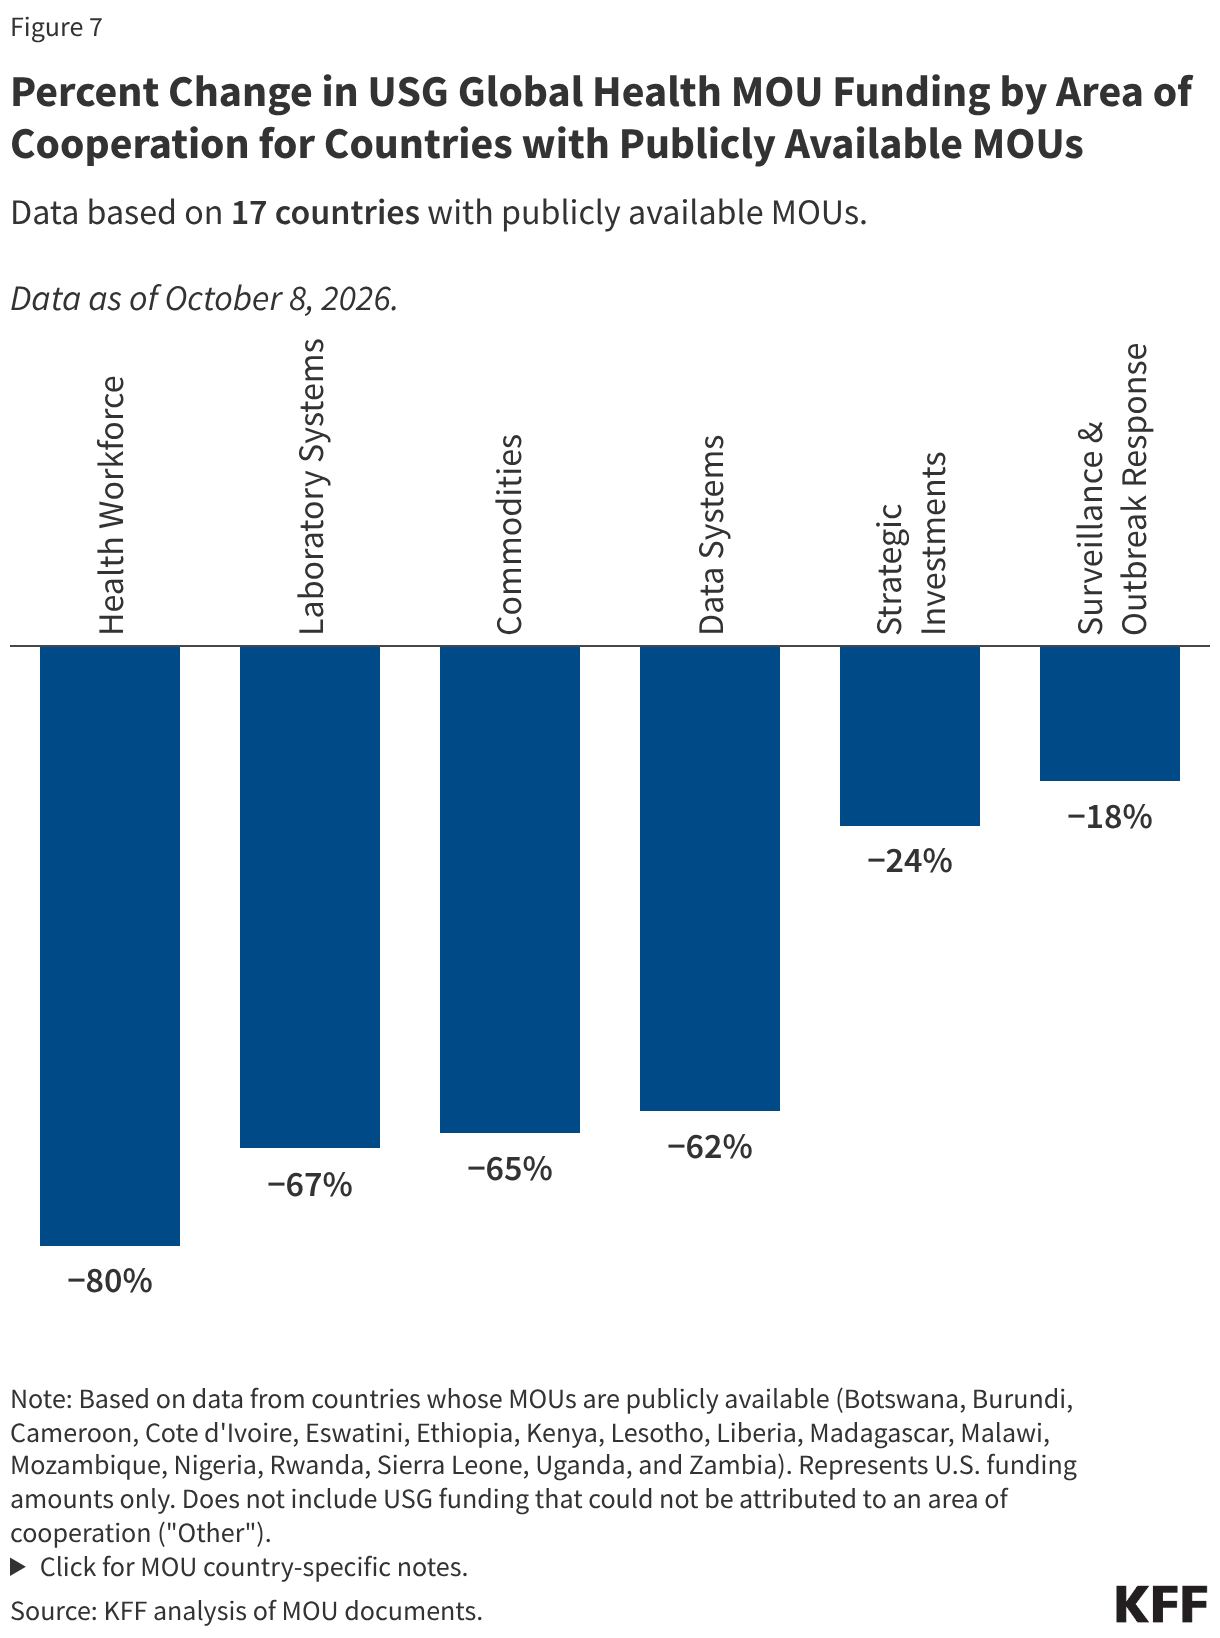
Percent Change in USG Global Health MOU Funding by Area of Cooperation for Countries with Publicly Available MOUs (Column Chart)
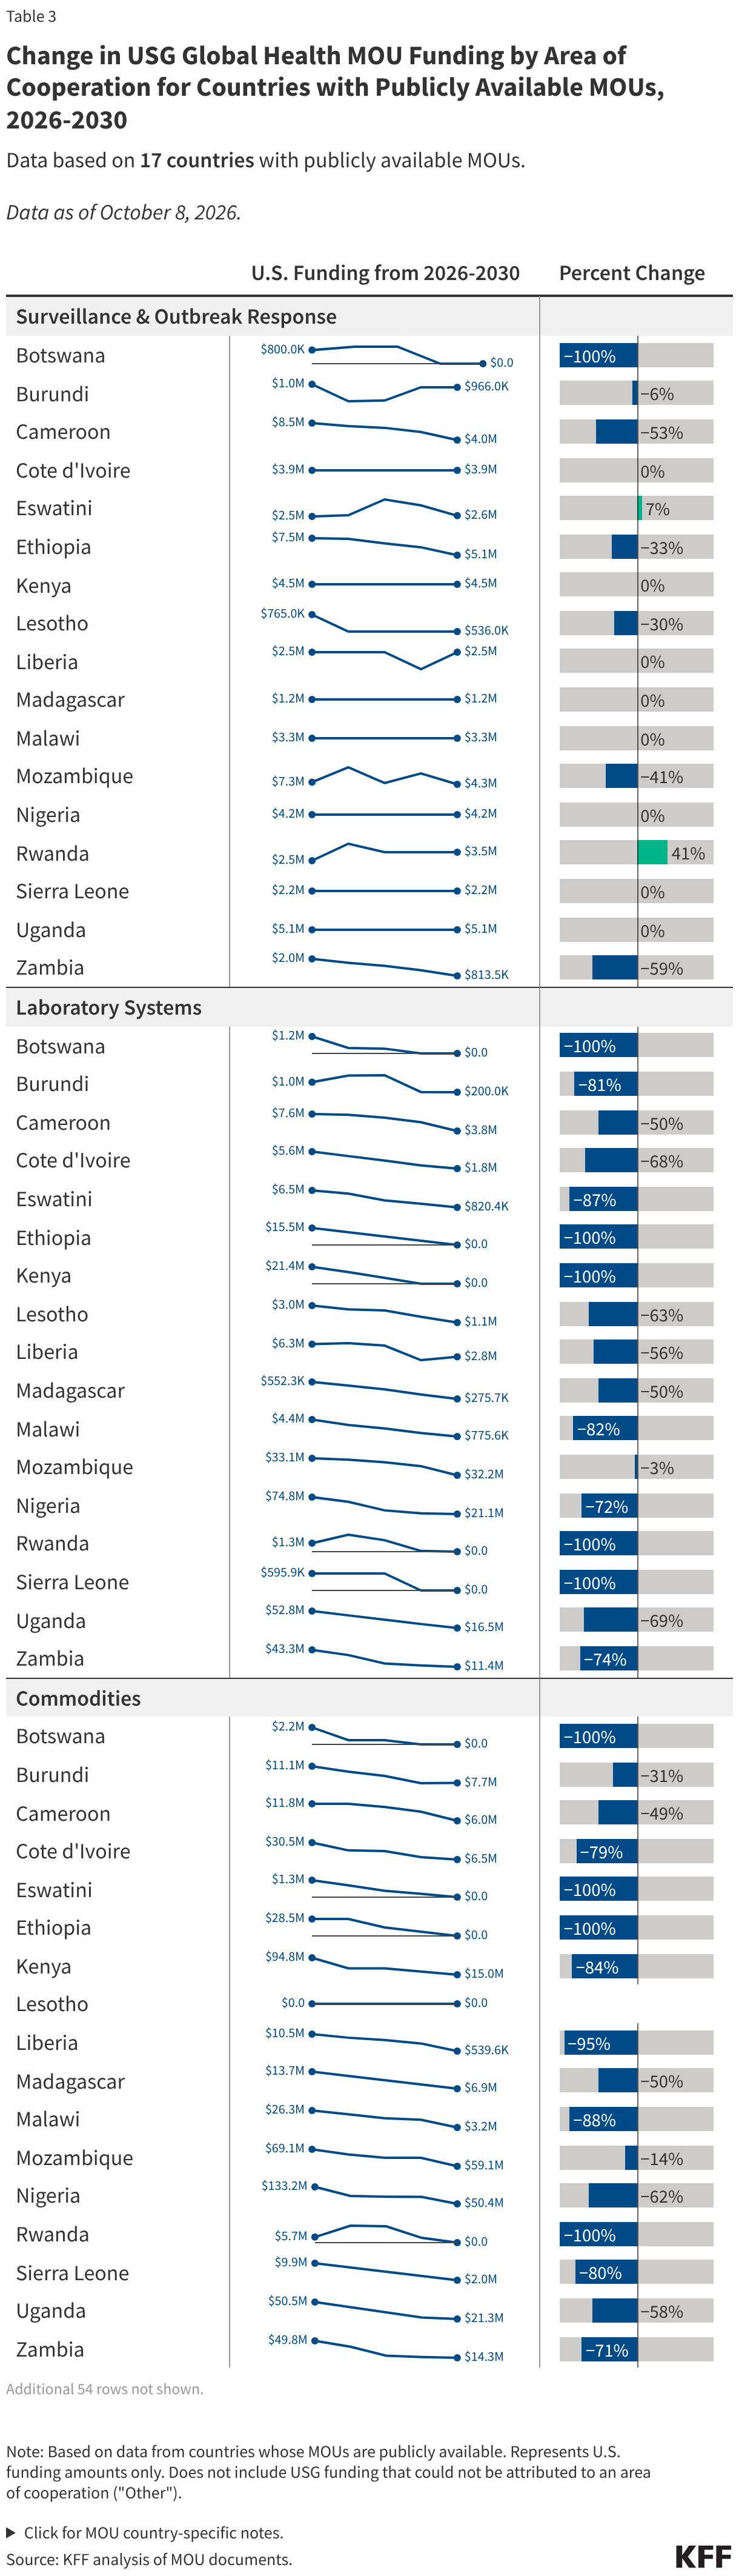
Change in USG Global Health MOU Funding by Area of Cooperation for Countries with Publicly Available MOUs, 2026-2030 (Table)
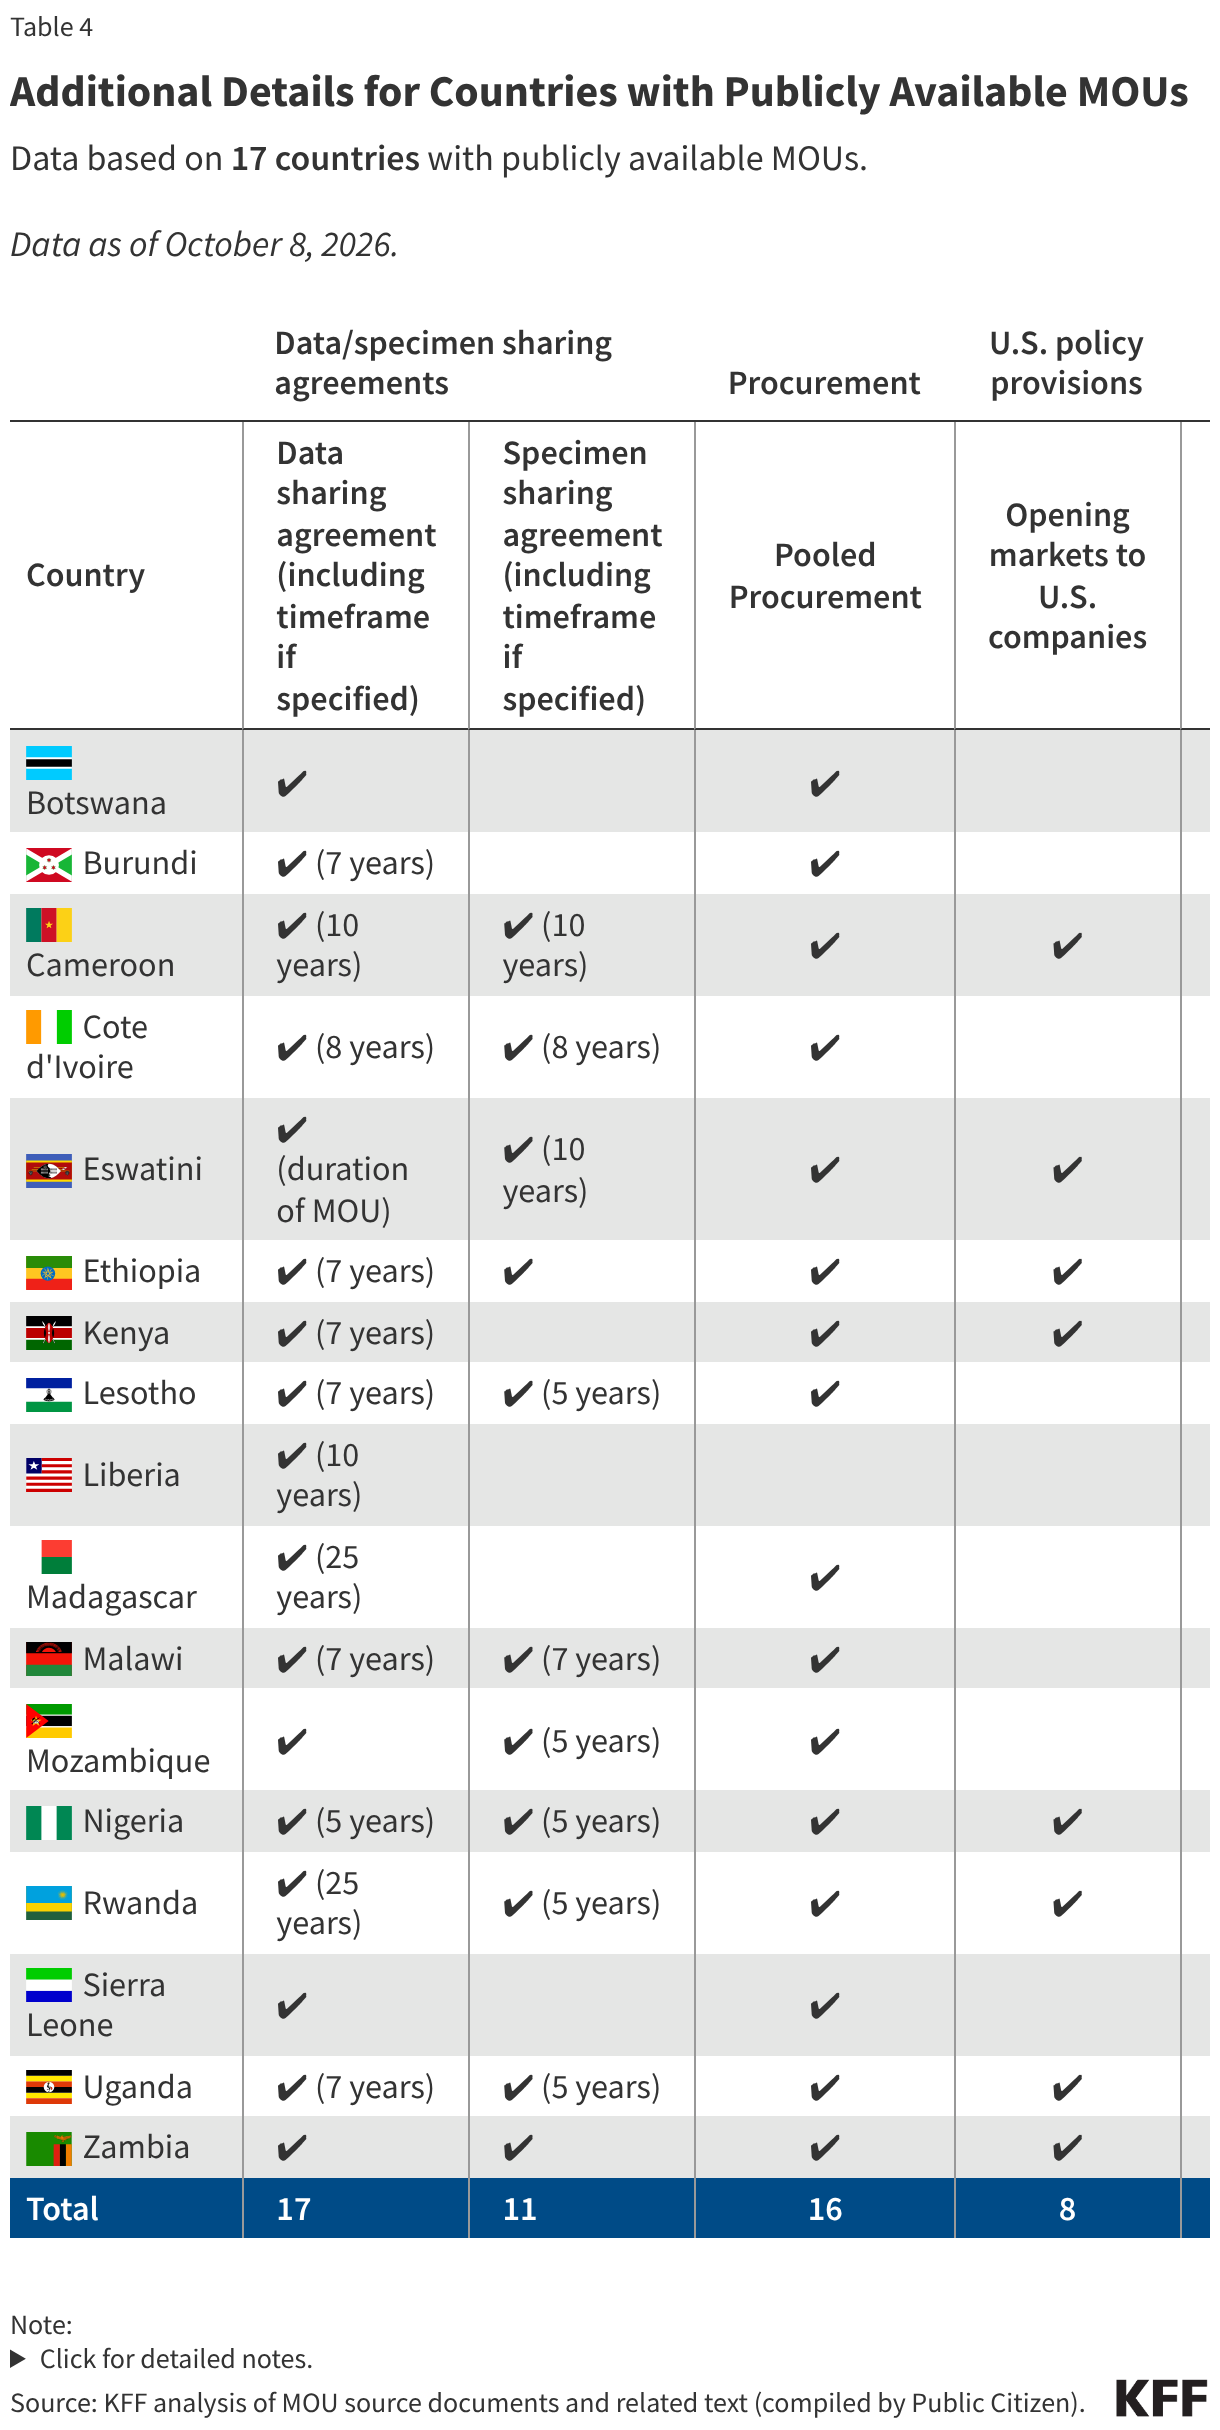
Additional Details for Countries with Publicly Available MOUs (Table)

This tracker provides information on U.S. MOU bilateral global health agreements to date. Information is sourced from publicly available U.S. Department of State, U.S. embassy, and partner country Ministries of Health press release statements and MOU texts and will be updated as more information becomes available and when additional agreements are signed. Currently, MOU text, which contains the most detailed information of these sources, is publicly available for only a limited number of countries; for these countries, data were sourced directly from these MOU documents (with the exceptions of Malawi and Zambia, which rely on press release statement information for overall, U.S., and country totals). For countries with available MOU documents, overall totals are based on the sum of annual amounts presented in the text, specifically the Appendix tables.

Program areas are captured using keyword searches; for global health security (GHS) specifically, country agreements were categorized as targeting GHS if they specifically mentioned GHS, or if they included descriptions of outbreak preparedness and response activities and containing health threats. Due to the limited nature of press release statements, this tracker may not comprehensively capture the global health program areas targeted in each country’s agreement.

For country co-financing amounts, it is not always clear whether these amounts represent new country funding (increases above 2025 baseline levels) or total country funding (i.e. existing + new) during the MOU period.

For MOU countries with publicly available MOU texts, the six areas of cooperation refer to the six main areas of cooperation found in the MOUs: Surveillance & Outbreak Response, Laboratory Systems, Commodities, Health Workforce (also referred to as “Frontline Healthcare Workers”), Data Systems, and Strategic Investments (also referred to as “Strategic Assistance,” “Strategic Interventions,” and “Technical Assistance”). “Laboratory Systems” is comprised of funding for lab commodities and lab workers. “Commodities” is comprised of funding for other commodities (lab commodities are included under “Laboratory Systems”). “Health Workforce” is comprised of funding for frontline healthcare workers and does not include funding for lab workers (lab workers are included under “Laboratory Systems”). Funding for activities outside of these six areas of cooperation has been categorized as “Other”. “Other” includes funding for U.S. program management, “surveillance malaria” (Rwanda), health workforce funding that could not be disaggregated between lab and frontline healthcare workers (Mozambique and Uganda), and any other funding that could not be identified according to an area of cooperation. For some countries, U.S. totals include funding for an outcomes survey, while in other cases, U.S. totals do not. Data represent amounts and information as presented within the MOU documents (specifically the Appendix tables), which may contain inconsistencies and limitations (for example, amounts may differ between Appendix tables and other tables within the MOU document). Where possible, these inconsistencies and limitations have been noted.

9 Things to Watch for the 2027 ACA Open Enrollment Period 

Published: Nov 6, 2026

Correction

Table 1 was corrected on November 6, 2026. See note for details.

The Affordable Care Act (ACA) Marketplace 2027 Open Enrollment period starts November 1, 2026, in most states. In 2026, the enhanced premium tax credits expired, provisions of the 2025 budget reconciliation law (the “One Big Beautiful Bill Act”) began to take effect, and Trump administration regulations began to change Marketplace coverage, with effects expected to carry into 2027 enrollment. Further changes in the ACA Marketplaces are again expected in 2027.

Here are the nine things to know for the 2027 Open Enrollment period:

1. Premiums are going up by double-digits, but most people get a subsidy.

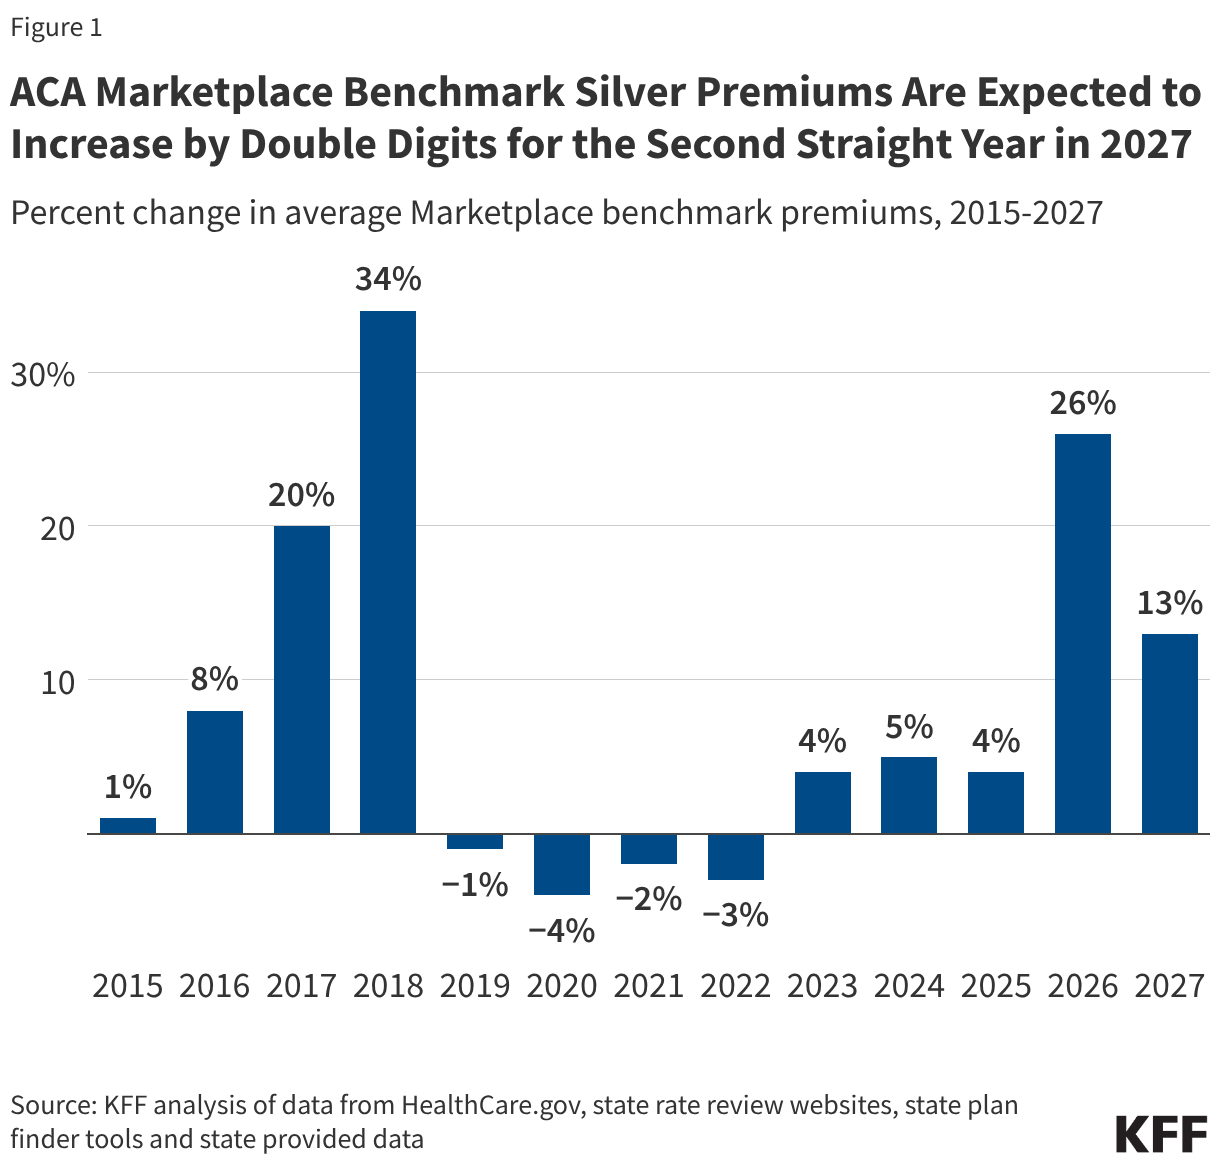
While insurers proposed a median premium increase of 15%, the average increase in finalized benchmark silver premiums for 2027 is 13%, marking a second consecutive year of double-digit proposed increases (these premiums rose by 26% from 2025 to 2026). In states that use the Healthcare.gov platform, benchmark silver premiums are increasing 11%, whereas states that run their own enrollment platforms are seeing premium increases of 16%. From 2025 to 2026, HealthCare.gov states saw a 30% increase, whereas state-based Marketplaces saw a roughly 17% increase in benchmark premiums.

ACA Marketplace Benchmark Silver Premiums Are Expected to Increase by Double Digits for the Second Straight Year in 2027 (Column Chart)

In their rate filings, insurers point to a higher-than-usual increase in the underlying cost of care, which is not unique to the ACA Marketplaces; some employer plans have also seen steep cost increases.

ACA Marketplace insurers also cite the expiration of the enhanced premium tax credits and the resulting changes in the risk pool as factors contributing to higher premiums. KFF’s analysis of insurer filings found that insurers estimated risk pool changes added about four percentage points on average to premiums in 2026 and expect a similar, additional effect in 2027.

Most enrollees get a subsidy that will cushion the impact of these increases in 2027. However, people with incomes above 400% of the federal poverty level (FPL) will be particularly hard hit because they no longer qualify for premium tax credits and must pay the full cost of coverage. Sharp premium increases in 2027 follow even steeper increases going into 2026. These higher costs may lead additional healthier enrollees to drop coverage, further worsening the risk pool and putting additional upward pressure on premiums.

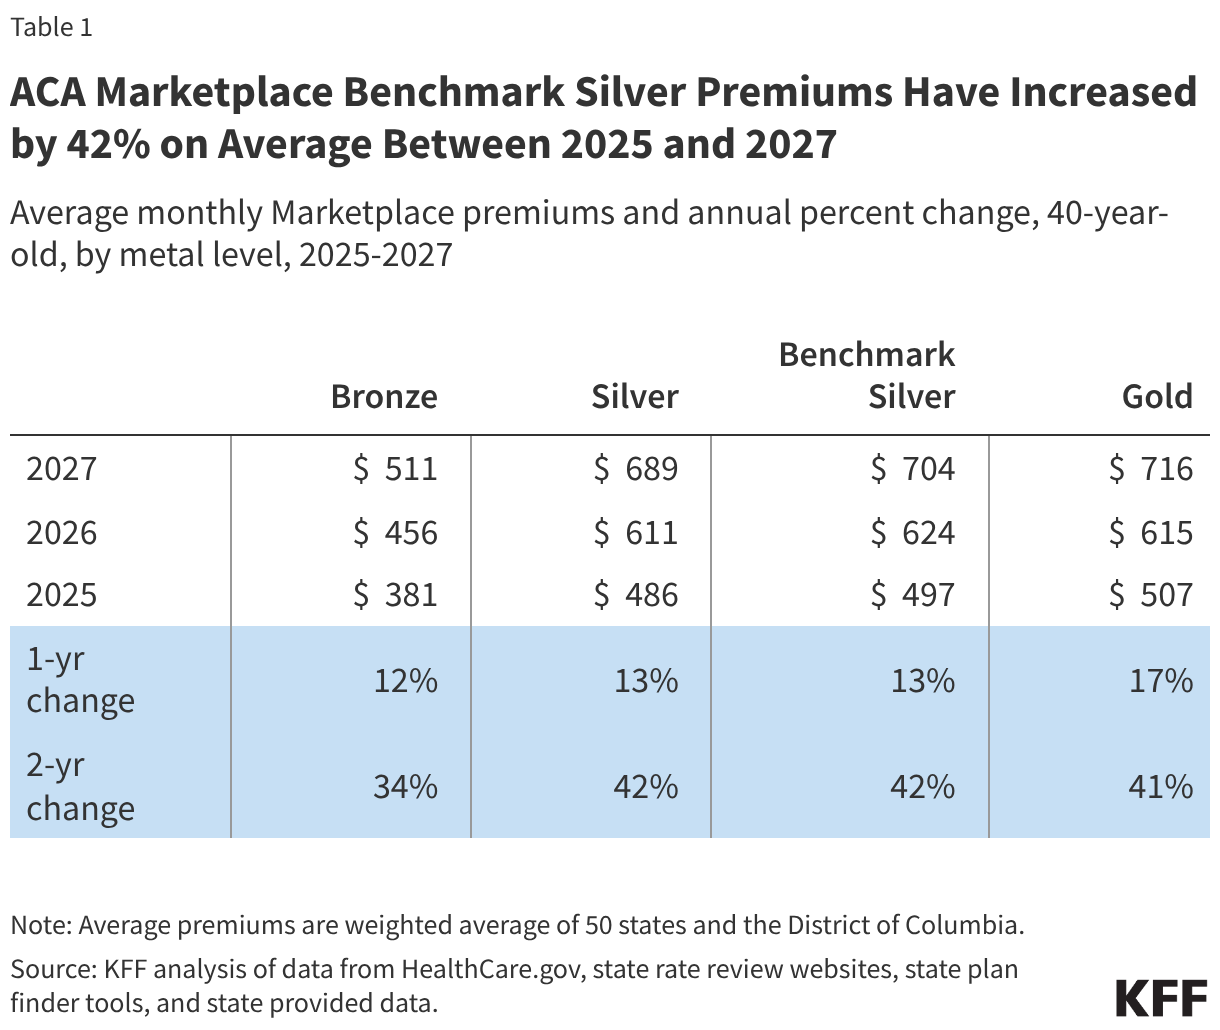
ACA Marketplace Benchmark Silver Premiums Have Increased by 42% on Average Between 2025 and 2027 (Table)

2. Marketplace enrollment is declining following the expiration of enhanced premium tax credits, and may continue to fall for other reasons.

Enrollment in the ACA Marketplaces declined following the expiration of the enhanced premium tax credits. During the 2026 Open Enrollment Period, Marketplace plan selections fell by 1.2 million from 2025. By February 2026, effectuated Marketplace enrollment (i.e., people who pay their premiums and remain enrolled) was down 12% (or 2.6 million people) from the previous year to 19.2 million people. More recent Marketplace-specific enrollment data are not yet available, but enrollment data for the individual market suggest the decline may have continued through the first half of 2026. Data for the broader individual market, which includes both Marketplace coverage and plans purchased directly from insurers or brokers, show a continued decline. Individual market enrollment fell 18% by June 2026, from 25.2 million to 20.5 million people—a loss of more than 4.6 million.

Looking ahead to 2027, several insurers have said they expect the market to continue to deteriorate in 2027 as a continued result of the enhanced premium tax credits ending. Some enrollees who were able to keep coverage in 2026 may no longer be able to make ends meet.

As discussed more below, anti-fraud efforts and changes to eligibility for tax credits affecting certain immigrants will also have a downward effect on Marketplace enrollment. In its latest projections, the Congressional Budget Office (CBO) estimated ACA Marketplace enrollment would fall from a peak of 22.4 million in 2025 to 13.1 million in 2027.

3. Insurer exits outnumber new entrants.

The number of insurers participating in the ACA Marketplaces is expected to decrease again in 2027, with more insurers announcing plans to exit the Marketplace than to enter. As of October 29, 2026, 11 carriers had announced plans to exit at least one state for 2027, while seven carriers had announced plans to enter a new state. Shrinking Marketplace enrollment after the expiration of the enhanced premium tax credits has reduced the potential market for insurers and raised concerns about the future of the risk pool. The changes will vary across states, but in some areas, consumers will have fewer insurers to choose from in 2027. Cigna, for example, is leaving the individual market in all 11 states where it currently participates.

Insurer exits can reduce competition and leave consumers with fewer choices of plans and provider networks and disrupt coverage for some enrollees.

4. Some state-based Exchanges have backfilled lost enhanced federal tax credits.

Some states that operate their own Exchanges are using state-funded subsidies to help offset the expiration of the enhanced premium tax credits, with several continuing or expanding assistance in 2027. New Mexico went furthest in 2026, fully backfilling the lost federal assistance for Marketplace enrollees. While enrollment declined nationally, New Mexico saw Marketplace enrollment grow during the 2026 Open Enrollment Period. The state is continuing its assistance in 2027.

Other states provided more limited assistance in 2026 and may expand eligibility in 2027. California, for example, is continuing state-funded premium subsidies but is expanding its program to partially backfill lost enhanced tax credits for households with incomes between 165% and 200% FPL. Previously, only households with incomes between 138% and 165% FPL were eligible for state assistance to replace any portion of the expired enhanced tax credits. Several other states have also maintained subsidy programs such as New Jersey, while Rhode Island and Virginia moved to create new state-specific subsidies for the 2027 plan year. These state efforts may help some consumers afford coverage despite the loss of federal assistance, but the amount of support available varies by state and income.

5. Recent federal actions to address fraud may affect enrollment counts and make it more difficult for enrollees needing brokers' services in 2027.

Recent initiatives to combat Marketplace broker fraud could impact counts of the number of enrollees this Open Enrollment cycle, the availability of enrollment assistance, and certain agent and broker practices in 2027. Some provisions that attempt to address fraud by placing new requirements on consumers have been temporarily paused due to court action (discussed more below).

In September 2026, HHS reported they cancelled coverage for approximately 760,000 individuals who CMS says were "phantom” enrollees, meaning a broker or agent may have signed them up without their knowledge. HHS sent a list of about 1.2 million people to insurers to review. These individuals had been signed up by an agent or broker, had no premium payment and were missing a Social Security number or immigration document that could be verified in real time. If insurers were unable to make contact with these individuals or verify they had incurred claims, CMS cancelled the coverage. There are reports that some enrollees have had their coverage reinstated suggesting that the criteria CMS used to identify potential fraud may have also flagged legitimate enrollees. Others who lost coverage through these efforts may not have their coverage restored.

Additionally, HHS is implementing new safeguards on certain agents, brokers, and web-broker practices that put consumers at risk of inappropriate or fraudulent enrollments. This follows investigations of brokers and other related entities moving enrollees to different plans or enrolling them in Marketplace coverage without their knowledge. For instance, the HHS Notice of Benefit and Payment Parameters for 2027 updates standards of conduct for agents, brokers, and web-brokers regarding prohibited marketing tactics, including but not limited to providing cash, monetary rebates, or cash equivalents to persuade consumers to enroll in coverage; falsely claiming that consumers will always qualify for zero-dollar insurance or zero-dollar premiums; and providing false information on enrollment timelines and deadlines. Agents, brokers, and web-brokers must submit marketing materials to HHS upon request in response to monitoring, auditing, or enforcement activities. Agents, brokers, and web-brokers that contract with a third party or other entity to produce marketing materials must ensure that those entities follow the requirements that apply to agents, brokers, and web-brokers.

In September 2026, HHS announced an even more stringent restriction that temporarily pauses the registration of new agents and brokers in the federally facilitated Marketplace and for Marketplaces that operate on the federal platform until February 2027. CMS estimates that approximately 19,000 new agents and brokers would have registered absent the temporary restriction. Combined with the reductions in Navigator funding for 2026 announced in February 2025, consumers may have less access to enrollment assistance in 2027.

6. Some lawfully present immigrants will no longer qualify for subsidized Marketplace coverage in 2027.

Currently, subsidized ACA Marketplace coverage is available to lawfully present immigrants. Lawfully present immigrants include lawful permanent residents (LPRs or green card holders), people on work visas, and humanitarian immigrants such as refugees, victims of human trafficking, asylees, among others. Undocumented immigrants are not eligible to purchase ACA Marketplace coverage, even at full cost. While immigration statuses eligible to purchase ACA Marketplace coverage have not changed for 2027, the 2025 budget reconciliation law limits eligibility for tax credits in the Marketplace to only certain groups of lawfully present immigrants including:

  • Lawful permanent residents
  • Cuban and Haitian entrants, as defined in section 501(e) of the Refugee Education Assistance Act of 1980
  • Any lawful residents living in the U.S. under the Compact of Free Association

Other lawfully present immigrants such as refugees, victims of human trafficking, and asylees, can still purchase Marketplace coverage but will no longer be eligible for premium tax credits. Without subsidies, many may be unable to afford their premiums and could drop coverage. CBO estimates that one million more individuals will be uninsured as a result of this provision by 2035.

7. Enrollees will face the elimination of repayment limits.

Beginning in the 2026 tax year, limits that previously capped how much some Marketplace enrollees had to repay in excess premium tax credits were eliminated as enacted through the budget reconciliation law (“The One Big Beautiful Bill Act”). Because the first tax filings under the new rules will not happen until early 2027, enrollees will choose 2027 plans without having seen how uncapped repayment works in practice. Those whose incomes end up higher than projected may face larger tax bills than they expect, and accurately estimating income and updating it when circumstances change will be especially important for people near income thresholds for premium tax credits or cost-sharing reductions.

Some enrollees may be able to lower their modified adjusted gross income (MAGI) through contributions to accounts such as health savings accounts (HSAs) or traditional individual retirement accounts (IRAs). These contributions could increase premium tax credits or help people near 250% FPL qualify for cost-sharing reductions (CSRs). However, HSA contributions are available only to people enrolled in HSA-eligible plans, and not everyone has the funds to contribute. Because Marketplace assistance is based on projected annual income, enrollees considering this approach may also need to update their income estimates during the year.

8. Consumers who are denied or removed from Medicaid coverage for not meeting work requirements will also be ineligible for premium tax credits.

Starting in 2027, in states required to implement Medicaid work requirements, consumers who lose or are denied Medicaid coverage solely for not meeting work requirements will also be ineligible for subsidized Marketplace plans in these states. Prior to the budget reconciliation law, a consumer who was denied Medicaid coverage or disenrolled from Medicaid could sign up for Marketplace coverage as long as they met Marketplace eligibility requirements. Because income eligibility for Medicaid references a monthly income whereas Marketplace premium tax credits are based on an estimated annual income, consumers may be concurrently eligible for both, especially in Medicaid expansion states. While this is likely a small group of people, it may include individuals who recently lost a job and who would likely not meet the Medicaid work requirements.

When the budget reconciliation law was signed, only Georgia had Medicaid work requirements in place; the law now requires 43 states and the District of Columbia to implement work requirements by the start of 2027. Exclusion from ACA tax credits based on failing Medicaid work requirements will apply to adults in Medicaid expansion states and those that are covered under Medicaid Section 1115 waiver programs to expand coverage. People who lose Medicaid coverage as a result of these requirements, including those who are working or qualify for an exemption but fail to navigate reporting rules, may face challenges finding affordable coverage because they will remain ineligible for premium tax credits until they are no longer eligible for Medicaid for reasons other than not meeting work requirements (such as a change in income).

9. Litigation has halted implementation of some Marketplace requirements for 2027.

Litigation challenging two final regulations that make substantial changes to Marketplace requirements – the 2025 program integrity rule and the HHS Notice of Benefit and Payment Parameters for 2027 – have halted implementation of many new rules for the time being. Four key cases are working their way through the courts: The 2025 program integrity rule was challenged in City of Columbus et al. v. Kennedy (Columbus I) and California et al. v. Kennedy (California I). Litigation over the 2027 Payment Notice is also ongoing in City of Columbus et al. v. Kennedy (Columbus II) and California et al. v. Kennedy (California II), with some provisions of the 2027 Payment Notice stayed as the litigation continues.

The state of play after several court decisions over the past year include the following:

  • Failure to reconcile requirement: For plan year 2027, consumers will not be disqualified from receiving premium tax credits if they fail to file and reconcile prior years' premium tax credits. So, for example, an enrollee who failed to file their tax return and reconcile for the 2025 tax year in 2026, will not lose subsidies for 2027 coverage.
  • Expansion of eligibility for catastrophic plans: A 2025 announcement expanded who can enroll in catastrophic plans, allowing individuals who were not eligible for premium tax credits or other cost-sharing help because their projected income was below the federal poverty level or above 250% FPL to sign up for catastrophic coverage. This expanded eligibility has been temporarily paused due to a June decision in Columbus II. This means only a narrow group of people including individuals under age 30, those whose Marketplace or employer coverage would cost more than 8.5% of their income, and those who qualify for a hardship exemption can enroll in these plans during open enrollment.
  • Other requirements are not in place for now or have been vacated. Due to litigation, CMS has stated that it will not implement a long list of final requirements. This includes certain income verification requirements, network adequacy requirements, and the elimination of standardized health plans. In addition, other requirements, including an Administration rule that would prohibit states from including gender-affirming care as an essential health benefit and a rule that would have shortened the Open Enrollment Period to nine weeks, have been vacated.

Note

Table 1 has been updated to accurately reflect data from Oregon and California. The national average lowest-cost silver premium in 2027 has been corrected from $689 to $681, the benchmark silver premium has been corrected from $704 to $703, and the lowest-cost gold premium has been corrected from $716 to $694. The percent change figures were corrected accordingly

The Movement to Remove Race From Clinical Decision-Making Tools: Assessing Progress and Impacts

Authors: Jameson Floyd, Drishti Pillai, and Samantha Artiga
Published: Nov 6, 2026

Introduction

In recent years, scientists, researchers, health care providers and various medical organizations have been evaluating the use of race in clinical decision-making tools to understand how its use may exacerbate or mitigate longstanding racial health disparities. This brief provides an update on how the use of race in clinical decision-making tools has changed in recent years, as a growing number of medical specialties and institutions have moved away from race-based tools, and the implications of this change for racial health disparities. Overall, it shows that clinical medicine is moving toward removing race and ethnicity from clinical calculators and guidelines, which has mitigated disparities and improved health outcomes. However, questions remain about the impact of this movement. Some continue to view using race to guide clinical decision-making as a way to mitigate health disparities because race and ethnicity capture patient aspects that influence health, even if not perfectly understood. Key takeaways include:

  • Although there are no biologic differences by race, race and ethnicity affect individuals’ health and health care experiences due to bias, discrimination, and differences in underlying structural factors that influence health. Medical research historically used race in many ways despite there being no biological or genetic basis for the concept. Similarly, false ideas about race have been embedded in clinical medicine in ways that may impact clinical care.
  • Research has established that the use of race in clinical decision-making tools and guidelines may contribute to racial health disparities. Despite the lack of consensus on the appropriate use of race in clinical medicine, dozens of clinical decision-making tools include race and/or ethnicity to inform decision making. In addition to clinical calculators and risk assessment scores, race plays a role in the clinical management guidelines for many diseases. These tools and guidelines can reinforce the disproven idea that biological differences between racial groups drive disparate health outcomes. They also can result in differential diagnostic and treatment decisions based on race, which may contribute to racial health disparities.
  • Amid growing attention to the implications of using race to inform clinical care, several clinical decision-making tools have removed race and/or ethnicity data in recent years, with research showing reductions in disparities and improvements in health outcomes. For example, research shows that the removal of a race-based correction from a formula used to measure kidney function resulted in earlier diagnosis and treatment for chronic kidney disease (CKD) and more access to kidney transplants for Black patients. The removal of race-based corrections from lung function equations resulted in more Black patients being reclassified with severe lung disease. The American Heart Associated and American College of Cardiology removed race from a risk calculator for heart disease and found that the calculator’s predictive accuracy was equal to or better than the previously used race-based version.

Researchers and clinicians are still investigating what information race captures, as race and racism may be related to structural inequalities that disparately impact the health and health care experiences of some groups more than others. Continued research on health outcomes following the shift towards removing race from clinical decision-making tools is important to understand their impact on racial health disparities and health outcomes. However, information will likely become more limited amid federal cutbacks to funding for disparities-related research.

Race and Ethnicity in Medical Research and Clinical Medicine

Medical research historically used race in many ways despite there being no biological or genetic basis for the concept. Race is a socio-political system of human categorization that has been used to justify social hierarchy based upon false notions of “biological differences” between racial groups. Historically, medical research has used race to explain differences in health outcomes among people, including by conflating race with genetic variation in disease risk despite well-evidenced consensus disproving the idea. This history can be traced back to early American medical research, where pseudoscientific fields of phrenology and eugenics were put forth as evidence of biological differences between races. In recent years, some of the most influential medical journals and medical societies have recognized that race is a poor proxy for biological differences between populations and the role scientific racism in medical research has played in contributing to racial health disparities. Calls have grown for medical researchers to explore how racism impacts health and to provide clear rationale for when and why race is used in research studies.

Similarly, false ideas about race have been embedded in clinical medicine that may impact clinical care. A 2021 KFF analysis detailed the influence of race in clinical medicine and provided multiple examples of the discriminatory treatment of people of color in health care. Researchers have identified medical education, disease naming, and provider bias as some of the areas in which racism is embedded in clinical medicine. A key example is beliefs about differences in pain between Black and White patients. Multiple studies have demonstrated that medical students and physicians may hold false beliefs about biological differences between Black and White people, including that Black people have less sensitive nerve endings. Decades of research have demonstrated Black patients’ pain is not recognized and consistently undertreated compared with White patients. Scholars suggest that these false beliefs about pain and Black patients’ experiences navigating pain in health care are closely related.

Over the past several years, there has been growing attention to the potential implications of using race in clinical care and to inform clinical decision-making.In the wake of the COVID-19 pandemic and the striking structural inequities revealed, research investigating how the use of race in medicine contributes to health disparities became a priority for the medical community. Clinicians and researchers have been analyzing and reconsidering how race has impacted clinical care, most notably as it relates to clinical decision-making tools and algorithms. As clinicians have learned more about the impacts of using race in clinical decision-making, there has been a push to explore new approaches that are more conscious of how race and racism influence clinical care and racial health disparities.

Although there are no biologic differences by race, race and ethnicity affect individuals’ experiences in the health care system and their health due to bias, discrimination, and differences in underlying structural factors that influence health. KFF survey data from 2023 showed that health care experiences vary by race and ethnicity, which can influence patient trust in health care settings, treatment decisions, and ultimately health outcomes. The survey showed that Black, American Indian or Alaska Native (AIAN), Hispanic, and Asian adults who recently received health care were more likely than White adults to report being treated unfairly or with disrespect by a health care provider because of their racial or ethnic background. AIAN, Black, Hispanic, and Asian adults also were more likely than White adults to say they had at least one of several negative experiences with a health care provider due to their race and ethnicity, including a provider assuming something about them without asking, suggesting they were personally to blame for a health problem, ignoring a direct request or question, or refusing to prescribe pain medication they thought they needed. The survey also showed that Black, Hispanic, and Asian adults who had at least half of their visits with providers who share their racial or ethnic background reported having more frequent positive and respectful interactions with providers. A separate experimental study showed that racial concordance between patient and provider significantly increased uptake of preventative and invasive services among Black men, which could decrease the cardiovascular mortality gap between Black and White males.In addition to differential experiences, there are racial and ethnic differences across key social and economic factors that influence health, many of which reflect underlying structural inequities.

Use of Race in Clinical Decision-Making Tools and Guidelines

Despite the lack of consensus on the appropriate use of race in clinical medicine, dozens of clinical decision-making tools include race and/or ethnicity to inform decision making. In 2025, researchers identified 42 risk calculators, five laboratory tests, 15 medications, and one therapy that accounts for race in some way. These tools use clinical and demographic information to estimate disease risk, organ function, and other important health metrics that aid clinicians’ decision-making. Most clinical decision-making tools that use racial and ethnic data do not provide clear rationale for using race as a variable nor explain the mechanism for how race influences disease risk. Those that do generally indicate that they use race based on previous studies using race, epidemiological data, or patterns that vary by race (which likely represent underlying structural factors). For example, the National Cancer Institute’s Breast Cancer Risk Assessment Tool estimates five-year and lifetime risk of developing breast cancer in people without a personal history of the disease and includes race and ethnicity as an input variable. The calculator’s creators note that race and ethnicity are used in the model because “incidence of breast cancer and some risk factor associations differ by race and ethnicity within the U.S. population.” Similarly, a colon cancer survival calculator from a major U.S. health care system includes race as an input variable, stating that it is a clinically relevant predictor of survival but does not include any additional rationale for its inclusion.

In addition to clinical calculators and risk assessment scores, race is used in clinical management guidelines for many diseases. In contrast to clinical calculators and risk assessment tools which may use race as a variable in an equation that outputs a number, race-based clinical management guidelines may guide clinicians’ thinking, disease screening or drug prescribing. In these cases, the use of race may have mixed impacts. For example, the American Diabetes Association 2026 diabetes management guidelines use a lower body mass index (BMI) threshold for Asian people compared to other groups to recommend diabetes screening. The guidelines also prompt clinicians to consider screening in patients with overweight and obesity from “high-risk” racial and ethnic groups including African American, Latino, Native American, Asian American populations. Using race and ethnicity in this way may help diagnose diabetes earlier in these populations, but it also could result in over-screening and increased health care costs. Similarly, the American College of Rheumatologists has differential screening recommendations for Asian and African American adults taking allopurinol for gout due to an increased risk of adverse skin reactions in these groups. Screening for the gene variant associated with the adverse skin reactions has significantly reduced the incidence of these reactions and health care costs, however one of the main alternative gout medications carries notable cardiovascular risks. BiDil, a drug designed to treat heart failure that was initially rejected by the FDA, was recommended for use specifically in self-identified Black patients based on a clinical trial of 1,050 Black patients. The trial showed promise for treating Black adults with heart failure, but it failed to assess the drug response in adults of other racial backgrounds, social determinants of health contributing to disease, and only had a 12-month follow up period. Most notably, the FDA’s approval of BiDil was met with overwhelming concern over the implications of race-specific prescribing guidelines from clinicians, researchers, and patients. Using race in clinical management guidelines in this manner may be intended to provide care in a way that is beneficial to specific racial and ethnic groups but may also lead to a number of unintended downstream effects.

Research has established that the use of race in clinical decision-making tools and guidelines may contribute to racial health disparities. These tools can reinforce the disproven idea that biological differences between racial groups drive disparate health outcomes. They also can result in differential diagnostic and treatment decisions based on race, which may contribute to racial health disparities. One study found that The American Heart Association’s Get With The Guidelines Heart Failure Risk Score Calculator adds three points to the risk score for non-Black patients without providing a rationale as to why, consistently categorizing all Black patients as lower risk of death during a hospitalization for heart failure. The same study also found that the original STONE score, a clinical prediction tool for kidney stones, consistently assigned lower risk scores for Black patients with symptoms of kidney stones compared to patients with different racial or ethnic backgrounds. The lower risk scores for certain groups can lead clinicians to make differential decisions about care, such as whether patients are admitted for specialty versus general care in the hospital or whether patients get the appropriate clinical care in a timely manner.

Debate continues about what information race captures and the relative benefits and harms of using it to inform clinical practice. Some view using race to guide certain clinical decisions, like screenings and medication prescribing, as a way to mitigate health disparities. Proponents of using race in clinical decision-making tools argue that race and ethnicity capture patient aspects that influence health, even if not perfectly understood, and that they should continue to be used until better alternatives are identified. While race does not represent genetic or biological differences, some argue that it is appropriate to use as a variable because it reflects underlying differences in socioeconomic factors or exposures that can influence health. Others argue that race-based medicine, in whatever form it may take, always implicitly promotes racial stereotyping, reinforces the false notion that there are clinically significant biological differences between racial groups, and undermines research efforts to identify more precise markers of disease. The lack of standardized racial and ethnic groups in the U.S. poses significant challenges to determining the true significance of race and ethnicity in clinical medicine. Many researchers note that it is still important to collect data and fund studies that research disparate health outcomes by racial groups alongside the goal to address the appropriate role of race in health care. However, recent changes to federal funding for research on racial health disparities and loss of public data stratified by race and ethnicity may lead to more limited data and research going forward.

Impacts of Removing Race from Clinical Decision-Making Tools and Guidelines

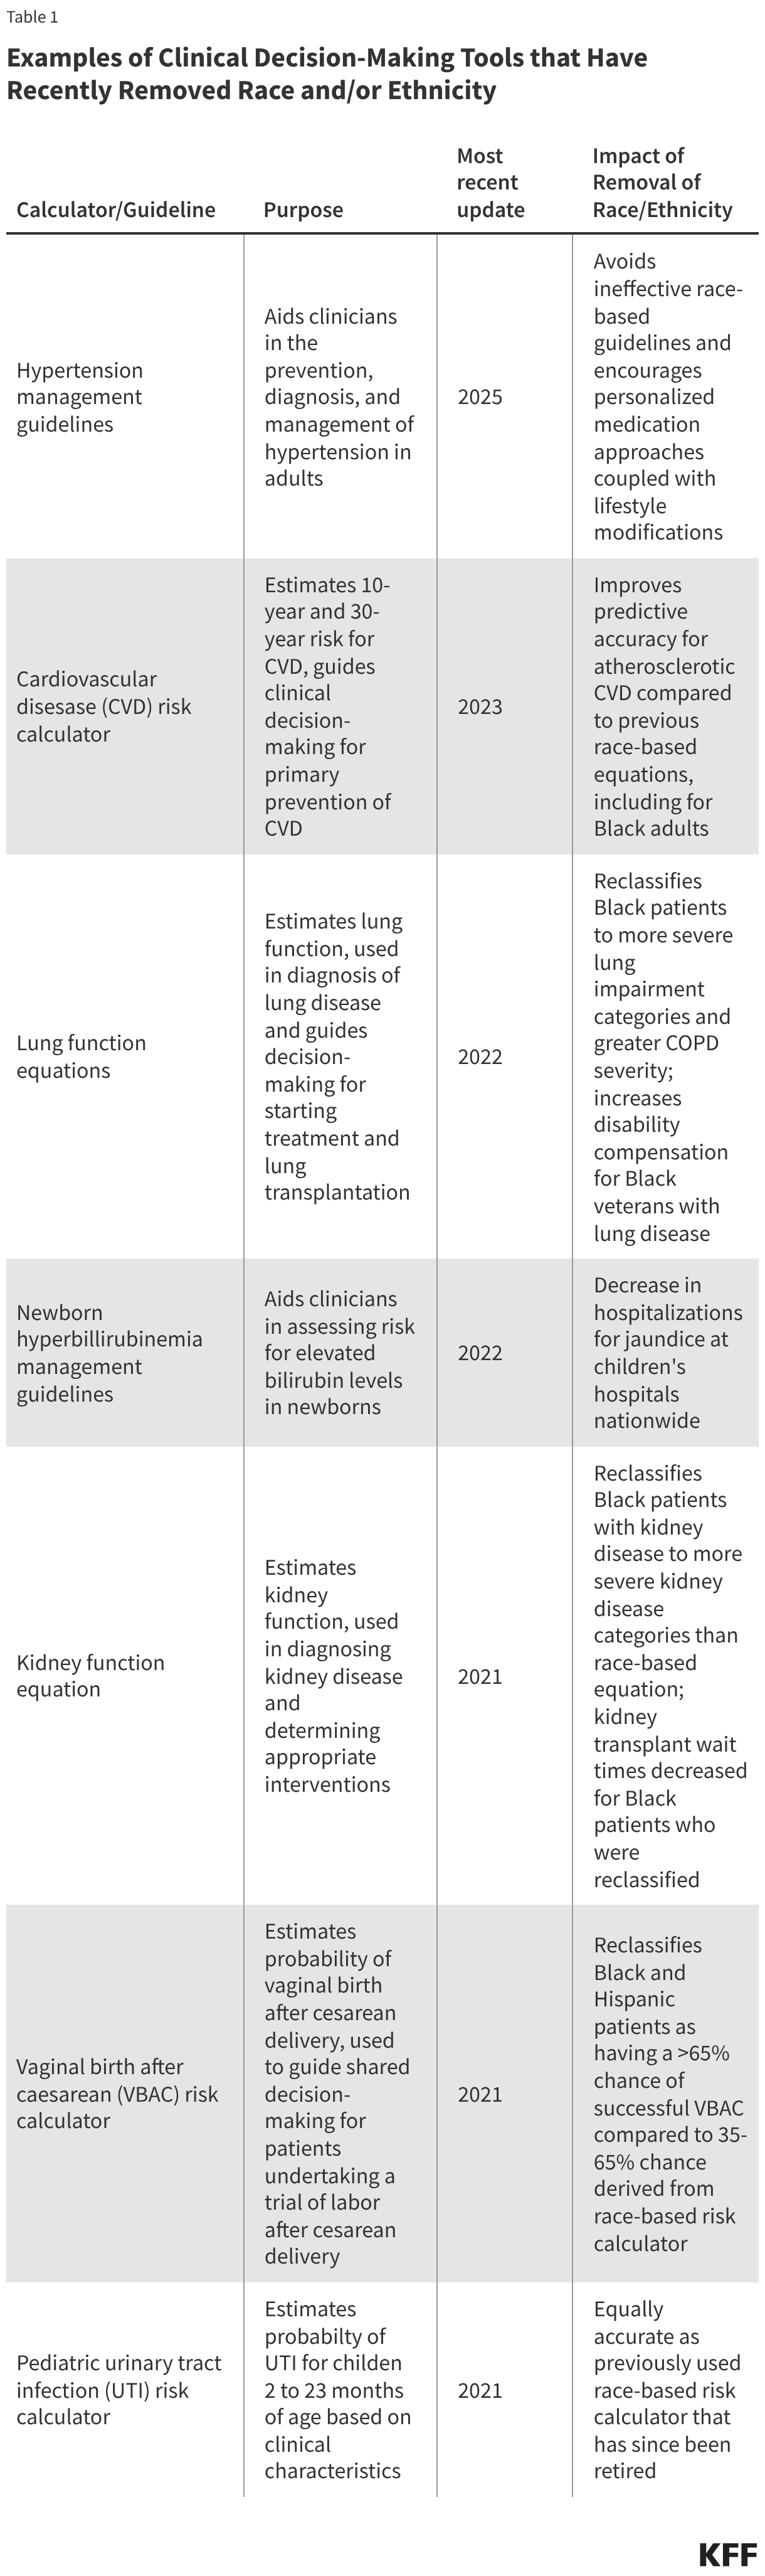
Several clinical decision-making tools and guidelines have removed race and/or ethnicity information in recent years (Table 1). Following these changes, research has emerged about the impact of removing race and ethnicity information from these tools, particularly for three widely used clinical decision-making tools that removed race and/or ethnicity as input variables.

  • Research shows that the removal of a race-based correction from a formula used to measure kidney function resulted in earlier diagnosis and treatment for chronic kidney disease (CKD) and more kidney transplants for Black patients. In 2021, the National Kidney Foundation and other research groups revised the estimated glomerular filtration rate (eGFR) equation, which estimates kidney function, to remove a race-based correction that overestimated kidney function for Black people. This race-based correction resulted in Black people having higher kidney function values, which may have impacted time to CKD diagnosis, treatment decisions, and eligibility for kidney transplantation compared to non-Black individuals. After revising the eGFR equation to remove race and applying it to patients, researchers found that Black patients were consistently reclassified to have more severe kidney disease than they would have under the race-based equation, potentially enabling earlier diagnosis of CKD, earlier treatment planning, and increased access to kidney transplantation for Black patients.
  • The removal of race-based corrections from lung function equations resulted in more Black patients being reclassified with severe lung disease, which also had impacts on disability reimbursements and occupational eligibility. In 2023, the Global Lung Function Initiative (GLI) published updated equations that no longer included race and ethnicity as input variables in lung function equations to address concerns about the use of race and its contribution to health inequities.Lung function is measured using spirometry data, which since inception, supported racist notions about biological deficiencies among enslaved people. Lung function equations previously included a race-correction that predicted lower normal reference values for Black individuals, which researchers argued may have contributed to historical underdiagnosis and treatment of lung impairment. Research has shown that the revised equations that do not use race and ethnicity reclassified more African American patients as having abnormal lung function and identified additional African American adults with evidence of chronic obstructive pulmonary disease (COPD). Notably, a study on the implications of race adjustments in lung function equations found that the equations that do not use race and ethnicity would increase disability compensation for Black veterans with lung disease by 17% but also would lead to occupational disqualifications for firefighting jobs for Black adults doubling.
  • The American Heart Associated and American College of Cardiology removed race from a risk calculator for heart disease and found that the calculator’s predictive accuracy was better than the previously used race-based version. In 2023, the PREVENT calculator, a cardiovascular disease (CVD) risk calculator, was developed to predict heart disease and did not include race as an input variable.Before 2023, the American College of Cardiology and the American Heart Association CVD prevention guidelines recommended equations that applied different weights for the same risk factor (e.g. smoking status) depending on if the patient was White or Black. This could result in two individuals with the same risk factors receiving different CVD risk scores based solely on race. Research has found the PREVENT calculator to perform as well or better at predicting CVD risk than the previous race-based equations, a finding that has been observed in studies among racially diverse populations.
Examples of Clinical Decision-Making Tools that Have Recently Removed Race and/or Ethnicity (Table)

In addition to these tools, the vaginal birth after caesarean (VBAC) risk calculator and pediatric urinary tract infection (UTI) risk calculator also removed race and ethnicity from their respective risk equations. Since race and ethnicity were removed from the VBAC risk calculator in 2021, Black and Hispanic patients were reclassified from having 35-65% chances of successful VBAC to greater than 65% chances of success. Similarly, the pediatric UTI risk calculator removed race in 2021 and has been found to be equally accurate to the race-based version that was retired in the same year.

In addition to clinical risk calculators, clinical medicine has shifted away from using race to guide drug prescribing and screening for many diseases in recent years. For nearly four decades, the American Heart Association and American College of Cardiology recommended that Black adults with hypertension be preferentially prescribed calcium channel blockers or thiazide-type diuretics instead of renin-angiotensin system inhibitors based on clinical trial data showing Black patients have greater blood pressure reduction when taking either of those two medications compared to other options. However, after decades of this practice, Black adults continue to have lower self-reported rates of blood pressure control even when preferentially prescribed calcium channel blockers or thiazide-type diuretics. In 2025, the guidelines for treating hypertension did away with race-based prescribing for the first time since 1988, due to insufficient evidence showing any benefit to the practice and a concerted effort to move away from race-based prescribing. Research suggests that culturally competent prescribing practices can be more effective at improving blood pressure control among Black adults with hypertension than race-based prescribing. Similarly, screening for hyperbilirubinemia, elevated bilirubin levels in newborns that can cause serious neurological consequences if left untreated, has moved away from race-based practices. Previously, East Asian newborns were classified as increased risk while Black newborns were classified as decreased risk, despite research suggesting Black newborns are overrepresented in cases of severe hyperbilirubinemia leading to neurological disease. The American Academy of Pediatrics removed race as a risk factor in 2022. One study found a significant decrease in hospitalizations for jaundice in newborns immediately after these guidelines changed.

Looking Ahead

Moving forward, there are continued efforts within medicine to remove race from clinical decision-making tools and guidelines. In 2022, the American Academy of Pediatrics issued a policy statement on the elimination of race-based medicine in the field. Similarly, in 2023, the American Medical Association, the nation’s largest association of physicians, committed to redressing the harms of misusing race in medicine. A 2024 survey of medical societies found that 50% of respondents were working on eliminating harmful race-based clinical algorithms. The National Kidney Foundation is also leading a coalition that is urging pharmacy organizations across the nation to transition to the eGFR equation that does not use race for medication decision-making. Research shows that many clinical labs across the country quickly adopted the new eGFR equations after they were published in 2021. Funders, medical societies, researchers, and other collaborators are engaged in ongoing efforts to evaluate how race is used in clinical decision-making tools and the development of more equitable tools in the future.

More studies analyzing the effects of removing race and/or ethnicity from clinical decision-making tools on health outcomes will be key to understanding how they impact all individuals. Some researchers are calling for the responsible removal of race from clinical medicine, as prior work has demonstrated that removing race from clinical decision-making tools can have unintended effects that worsen health disparities. Continued research will be important for informing efforts to eliminate race from clinical practice, including increasing understanding of patient preferences, effective implementation processes, and the role of structural inequalities that impact health. However, health disparities research is facing funding challenges due to the federal government’s sweeping cuts to disparities research. These cuts will likely hinder the ability of clinicians and researchers to understand how the shift away from race-based medicine is impacting racial health disparities.

Removing race from clinical decision-making tools may help mitigate harms of race-based medicine, but additional efforts are important for addressing racial health disparities. Despite more accurate estimations of kidney function and policies that provided transplant wait time corrections for Black patients based on the equation that does not use race, racial health disparities in access to kidney transplants persist. A March 2026 study found that the transplant rate for Black patients that did not get transplant wait time corrections significantly declined, which may be related to racial disparities in access to kidney-specific medical care to be eligible for transplantation.

There is growing interest in how artificial intelligence (AI) may mitigate or worsen racial health disparities as AI is increasingly integrated into clinical decision-making. Large language models and other AI technologies are trained using enormous amounts of data, which include data rooted in race-based medicine. Early research suggests that racially biased training data is one pathway through which AI may perpetuate or worsen racial health disparities. Alternatively, AI models may help mitigate disparities if carefully designed with inclusive data. For example, recruiting diverse research cohorts may result in more accurate data for both clinicians and AI models to use that does not exacerbate existing health disparities. AI could also address disparities through correcting clinician bias in real-time, reducing administrative workload for clinicians in safety-net hospitals, and revealing previously unknown underlying disparities in health outcomes.

Medicaid Payment Transparency Rules: State Reporting Requirements and Limitations

Published: Nov 6, 2026

States have substantial flexibility in setting Medicaid payment rates, which can affect provider participation in Medicaid and enrollee access to care. Previous research found that Medicaid fees for selected physician services were about 75% of Medicare fees and that physicians were much less likely to accept new patients insured by Medicaid than those with other coverage. However, information about Medicaid payment rates has been limited. Greater transparency could make it easier to compare Medicaid rates across states and payers and help inform payment decisions aimed at supporting provider participation and enrollee access to care. These goals differ somewhat from broader federal policy debates that aim to make health care prices more visible to consumers, researchers, and policymakers in an effort to reduce overall costs to consumers. Medicaid already has significant out-of-pocket protections for enrollees given their low incomes.

In 2024, the Centers for Medicare & Medicaid Services (CMS) finalized new transparency provisions for Medicaid fee-for-service (FFS) and separate requirements for managed care. The requirements differ because under FFS, states directly pay providers for services rendered, whereas under managed care, states pay a health plan or managed care organization (MCO) to deliver services and the MCO establishes payment rates for providers. In fiscal year (FY) 2024, 42% of Medicaid spending was paid through FFS and 53% was paid through managed care. As some provisions of the FFS rule go into effect, CMS has provided additional guidance to states on implementing FFS requirements, including specifications for conducting the comparative rate analysis. The FFS reporting requirements took effect in July 2026, meaning that data are now available online.

This brief describes the transparency requirements that took effect in July 2026, uses T-MSIS data to assess the share of FFS spending and claims captured by certain reporting requirements, and discusses limitations of the new transparency requirements. This brief lays the groundwork for future KFF analyses of Medicaid provider payment rates and how those rates may compare to Medicare. Key takeaways include:

  • To help states implement the new payment transparency requirements, CMS specified 68 billing codes that states must use to compare Medicaid FFS rates to Medicare; however, those codes account for a small share of spending (2% of noninstitutional FFS spending) and number of services delivered (5% of noninstitutional FFS claims or services delivered). In addition to capturing a narrow set of services, it may be challenging to compare Medicaid rates to Medicare for certain services and populations, and the value of the information will vary by state based on which delivery systems they use and the extent to which FFS payment rates govern the rates paid by MCOs.
  • States also report more comprehensive lists of payment rates. Differences in reporting practices and variation in rates by population and geographic area can make it difficult to compare comprehensive payment rates across states, including for the narrower set of services covered by the Medicaid-to-Medicare comparative analyses.

What are the new payment transparency rules for Medicaid?

States have substantial flexibility to set Medicaid provider payment methods and rates, particularly under FFS, where state Medicaid agencies pay providers directly. The 2024 Access rule established new FFS payment transparency requirements. The rule also included payment transparency requirements for certain long-term care services, while a separate 2024 rule established managed care payment transparency requirements. The long-term care and managed care provisions are outside the scope of this analysis.

Box 1. Key Medicaid Payment Transparency Requirements.

The Ensuring Access to Medicaid Services final rule (Access rule) and the Medicaid and CHIP Managed Care Access, Finance, and Quality final rule (Managed care rule) made substantial changes to the regulations governing Medicaid, including new requirements for states to provide information about Medicaid payment rates. Key requirements include:

Conduct comparative rate analyses. Under the fee-for-service (FFS) Access rule, states must use select codes to compare their FFS payment rates for primary care, obstetrical and gynecological care, and outpatient mental health and substance use disorder services to Medicare rates, and publish the analysis every two years, with the first analysis published by July 1, 2026.

Publish fee schedules. Under the FFS Access rule, states must publish all FFS rates on a publicly available and accessible website and make updates within one month of a payment rate change. This provision went into effect July 1, 2026. This includes applicable FFS rates for inpatient hospital services, outpatient services, and nursing facility services.

Disclose payment rates for home care. Under the FFS Access rule, states must publish the average hourly rate paid for personal care, home health aide, homemaker, and habilitation services, starting on July 1, 2026, and publish the disclosure every two years.

Require states to submit annual payment analysis. Under the managed care rule, states submit an annual analysis comparing managed care plans’ payments for certain services to Medicare rates and comparing certain home care rates to state FFS payment rates using paid claims data from the plans. The requirement applies to managed care rating periods beginning on or after July 9, 2026, with states submitting the analyses six months after the applicable rating period ends in their Network Adequacy and Access Assurances Reports. Reports submitted on or after January 1, 2028 must include the new analyses.

CMS specified 68 evaluation and management (E/M) billing codes that states must use for the FFS comparative rate analysis. The E/M codes cover office visits and other services involving the evaluation and management of patients and may be used for primary care, obstetrical and gynecological care, and outpatient mental health and substance use disorder services. Starting in July 2026, and every two years thereafter, states must report FFS rates for each code and show rates that vary by provider type, geographic area, or population. States must compare each Medicaid rate with the corresponding Medicare rate and report the Medicaid-to-Medicare payment ratio. All E/M codes required by CMS have a Medicare established payment rate, but some may have limited or no Medicare coverage. This may be particularly common for codes that are seldom used in Medicare, such as services for children.

The fee schedule requirement applies broadly to FFS payment rates, but CMS does not prescribe a standard format for posting the information. States were required to post most FFS payment rates on publicly accessible state websites by July 1, 2026. CMS does not prescribe a standard format, which may result in variation in the presentation and organization of those rates.

What share of Medicaid FFS spending and claims will be affected by the rules?

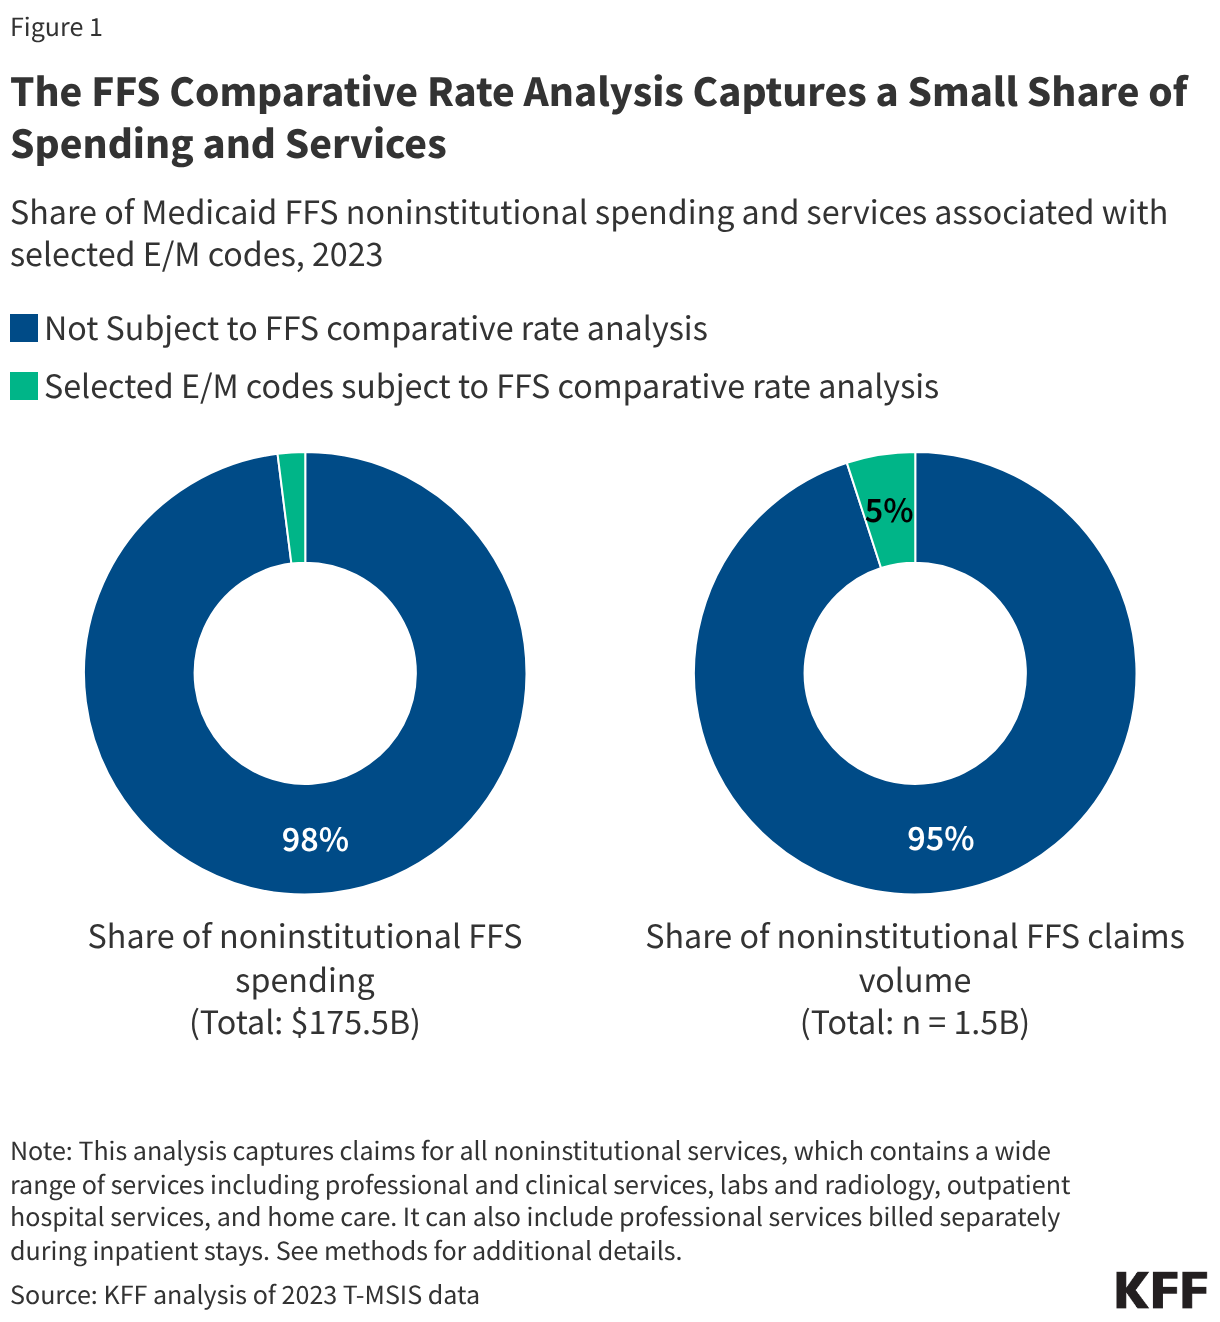
The FFS comparative rate analysis captures a small share of spending and claims: 2% of noninstitutional FFS spending and 5% of noninstitutional claims (Figure 1). The estimates included in this analysis use Medicaid claims from noninstitutional services, which encompasses a wide range of services including professional and clinical services, labs and radiology, outpatient hospital services, and home care. It can also include professional services billed separately during inpatient stays.

The FFS Comparative Rate Analysis Captures a Small Share of Spending and Services (Small multiple donut chart)

Which Medicaid enrollees are most likely to use services subject to the transparency requirements?

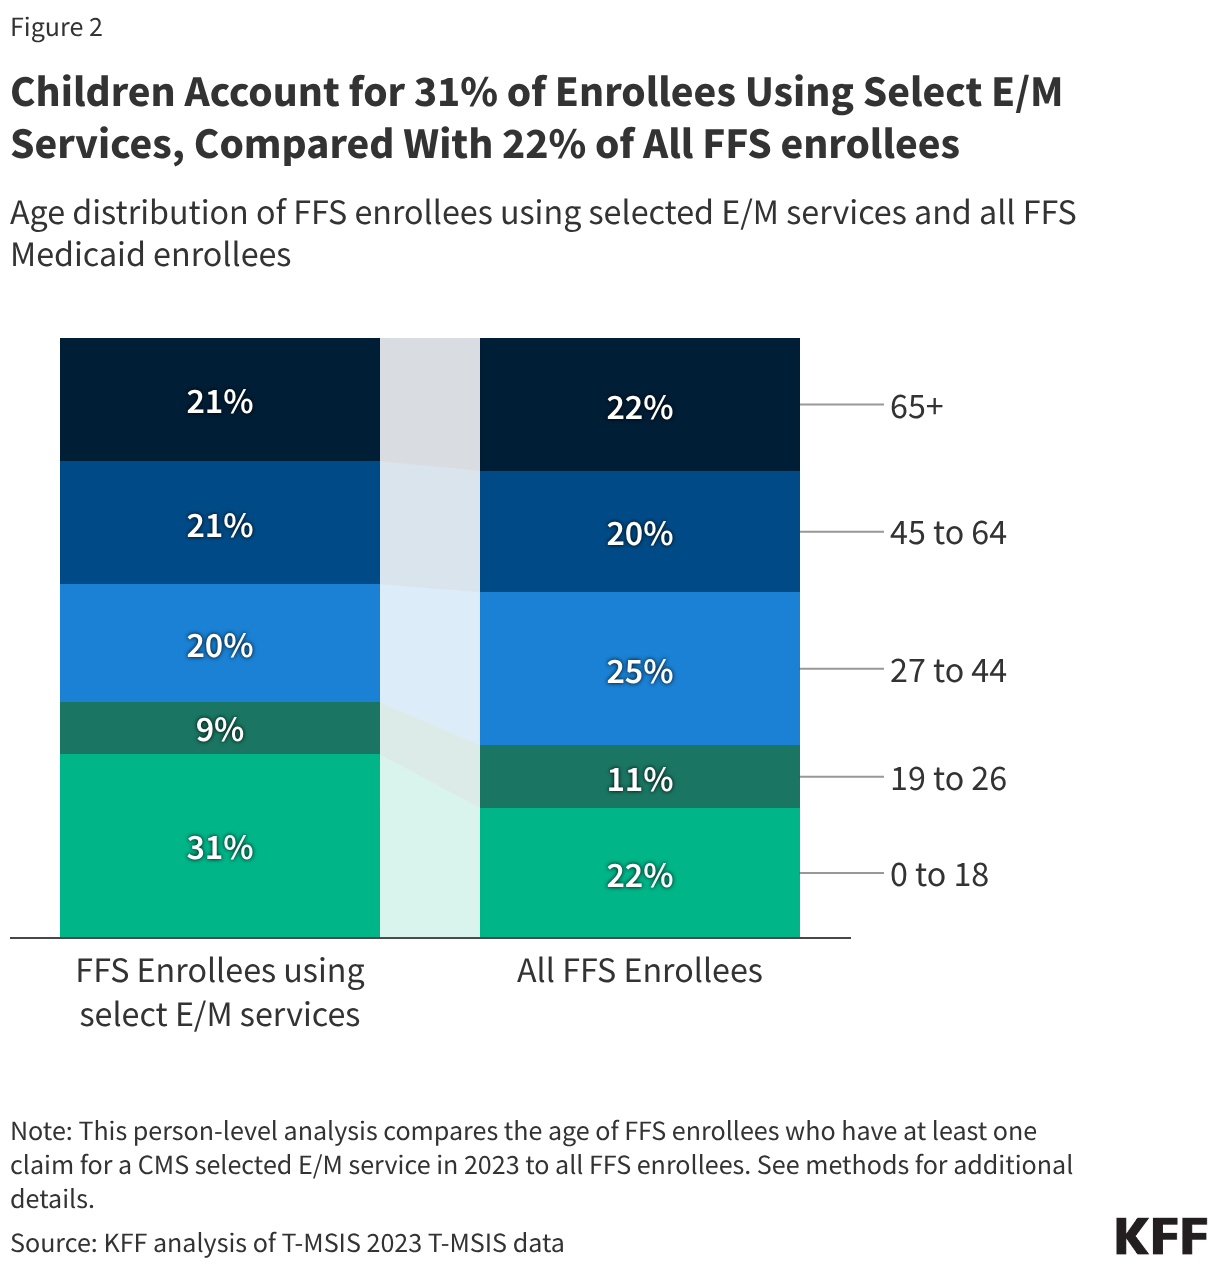
Children account for 31% of enrollees using selected E/M services, compared with 22% of all FFS enrollees (Figure 2). This difference may partly reflect that the analysis includes E/M codes that are commonly used for pediatric well-child and sick visits. Enrollees with chronic conditions are also overrepresented. Approximately 66% of those using the selected services had at least one chronic condition, compared with about 35% of the overall FFS population, likely reflecting their greater use of health care services (data not shown).

Children Account for 31% of Enrollees Using Select E/M Services, Compared With 22% of All FFS enrollees (Stacked column chart)

What are the limitations?

The comparative rate analysis provides a more consistent basis for comparing rates across states, but it captures a narrow set of services and has some limitations. By requiring states to report rates for the same services and characteristics relative to Medicare, it allows for more consistent comparisons across states. However, the selected E/M service codes account for only 5% of FFS noninstitutional claims, leaving 95% outside the standardized comparisons with Medicare. Comparisons may also be complicated by differences in how states set payment rates, including variation by population or geographic area. In addition, in some states, certain provider types may not bill with E/M codes, such as psychologists, social workers, and counselors.

It may be challenging to compare Medicaid rates to Medicare for certain services and populations. The intent of the comparative rate analysis was to provide transparency into how FFS rates for primary care, obstetrical and gynecological care, and outpatient mental health and substance use disorder services compare to Medicare rates. However, Medicare may be a less meaningful benchmark for populations and services with limited Medicare coverage, such as children and well-child visits.

The fee schedule requirement is broader, but the published information is not standardized, making comparisons more challenging. Requiring states to post all FFS rates may improve access to payment information. However, differences in how states organize fee schedules and structure their payments may make comparisons with Medicare or other states difficult and time-consuming. For example, Rhode Island and Virginia provide searchable databases, while some other states, such as Nebraska, Washington, and Kentucky, post downloadable fee schedules, which can be in different formats–PDF, excel, or both. States also differ in how they show rates across provider type and geography, and in whether they centralize fee schedules on one page or provide links to multiple web pages.

The usefulness of the FFS payment transparency information will vary by state based on which delivery systems they use and the extent to which FFS payment rates govern the rates paid by MCOs. In states that rely primarily on FFS or use a mix of FFS and managed care, the disclosed rates apply to a larger share of Medicaid services. In states that rely primarily on managed care, FFS rates may apply to relatively few services and provide a less complete picture of provider payment levels overall. The information will also be useful in states that rely heavily on managed care if the FFS payment rates serve as benchmarks for MCO payments.

Methods

Medicaid Claims Data: This analysis used the 2023 T-MSIS Research Identifiable Files, including the other services (OT) line and header files and the demographic and eligibility (DE) files. The OT file captures claims for all noninstitutional services, which encompasses a wide range of services including professional and clinical services, labs and radiology, outpatient hospital services, and home care. It also includes professional services billed separately during inpatient stays. The analysis includes Medicaid and Medicaid-CHIP (M-CHIP) enrollees and excludes Separate CHIP (S-CHIP), which was identified using CHIP_CD_01-CHIP_CD_12 = 2, 3, 4, or missing and ELGBLTY_GRP_CD_01-ELGBLTY_GRP_CD_12 = 61-68.

State Exclusion Criteria: Illinois was excluded due to a known issue with duplicate lines in the OT line file. In addition, the DQ Atlas also reported unusable procedure codes for the “OT institutional files” for this state.

Defining Fee-for-Service (FFS) Medicaid: The analysis defines claims as FFS if the T-MSIS claim type code of 1 (CLM_TYPE_CD=1). The analysis identifies FFS enrollees as people with zero months of comprehensive managed care enrollment. To determine enrollment in comprehensive MCOs, enrollment was limited to plans from the list MC_PLAN_ID_01_MM-MC_PLAN_ID_16_MM from the Managed Care Participation segment of the T-MSIS eligibility file which also has a positive capitated payment to a plan on behalf of the enrollee in the month (MM) in the T-MSIS Other Services (OT) file. This analysis calculated positive capitated payment to a plan on behalf of the enrollee in a month by summing the MDCD_PD_AMT for claims with CLM_TYPE_CD = 2 (Medicaid or Medicaid-expansion Capitated Payment) having a SRVC_END_DT in the month in 2023. Capitated payments were attributed to a specific plan using the MC_PLAN_ID from the OT file.

Share of Spending and Service Volume Associated with Selected E/M Codes: To estimate the share of FFS spending associated with CMS selected evaluation and management (E/M) codes for the FFS comparative rate analysis, the analysis sums Medicaid payment amounts at the line (LINE_MDCD_PD_AMT) for FFS lines with a selected E/M code and divides this amount by payments for all FFS lines in the OT file. To estimate the share of FFS service use associated with CMS selected evaluation and management codes (E/M) codes for the FFS comparative rate analysis, the analysis sums the number of FFS service lines with a selected E/M code and divides it by the total number of FFS OT service lines .

KFF Election Poll Analysis

Health Care in the 2026 Midterm Election

This dashboard focuses on KFF’s analysis of the role health care costs and other health policy issues played in voters’ decisions in the 2026 midterm elections, including in key Senate races. For this analysis, KFF added supplemental questions to The Voter Poll by SSRS, a survey of the 2026 midterm electorate nationally and in all 50 states. It examines the role of rising health costs on voters’ decisions, views on the Trump administration’s health care policies, party preferences on health issues, and opinions on the government’s role in health care amid discussions of Medicare-for-All by candidates in key Senate races in Michigan and Maine. This dashboard also includes analysis of select questions from the NORC Civic Health and Elections Project, a separate survey of midterm voters.  

For KFF’s analysis of the role of abortion in the 2026 midterms, focusing on states with abortion ballot measures, see: Abortion on the Ballot in 2026: Polling Insights from Voters in Four States 

Last Updated: November 4, 2026, data as of 5:00pm ET

(MAHA Voters data updated Nov 5, 2026, 1:00pm PT)

Table of Contents

Key Takeaways

Copy link to Key Takeaways
  • The economy was voters’ top issue in the 2026 midterms, and the cost of living – including the cost of health care – was a key driver of their decisions, as voters pointed to health care costs among their most pressing affordability concerns. Overall, about six in ten voters said they were “very concerned” about the cost of health care, on par with concerns over affording gas and groceries. About two-thirds of voters in key battleground states who were “very concerned” about health care costs said they voted for the Democratic Senate candidate, while about three in ten of this group said they voted for the Republican. This is a shift from 2024, when President Trump had a 10-point advantage over Vice President Harris among voters who were most worried about health care costs (54% vs. 44%). 
  • Midterm voters said the Democratic Party was better equipped than the Republican Party to handle a range of issues, with the Democrats’ biggest advantage appearing on the issue of health care. Half of midterm voters said the Democratic Party is better able to handle health care, a 20-percentage point advantage over the Republican Party (30%). Voters also favored the Democrats over the Republicans on the economy (44% vs. 37%), a reversal from 2024, when President Trump had a 10-point advantage over Vice President Harris. 
  • In Michigan and Maine, where Democratic Senate candidates Abdul El-Sayed and Troy Jackson campaigned on Medicare-for-All, voters preferred the Democratic Party on health care by wide margins, and both candidates appeared able to capitalize on these voters’ desire for a larger government role in health care. In each of these elections, voters gave the Democratic Party about a twenty-percentage point advantage over the Republican Party on whom they trust to handle health care – a wider margin than in other Senate toss-up states. About six in ten midterm voters said they want the federal government to play a larger role in providing health care, including majorities of voters in Maine (65%) and Michigan (57%). In these two states, voters who wanted a larger government role in providing health care made up the overwhelming majority of those who voted for El-Sayed and Jackson.  
  • In a rebuke of the Trump administration’s health care policies, majorities of midterm voters said these policies have worsened their own health care costs (55%) and the ability of Americans to get the health care they need (56%) – at least four times the share who said the administration made these “better.” Voters also expressed more negative than positive views on the administration’s impact on fraud in government health programs (45% worse vs. 30% better) and the health of Americans (58% worse vs. 21% better), two areas that were key policy focuses of the second Trump administration.  
  • Blame aimed at the Trump administration over rising health care costs was tied to support for Democratic candidates overall, and among independent voters – a key voting group. Among those who said the administration’s policies worsened their health care costs, eight in ten (83%) overall voted for Democratic House candidates. This pattern was not only true among voters who identify as Democrats; among voters who blame the Trump administration for their own rising health costs, seven in ten (72%) independents and one in five (22%) Republicans report voting for the Democratic House candidate.  

The Role of Health Care Costs As a Voting Issue

Copy link to The Role of Health Care Costs As a Voting Issue

The cost of living was a top issue on voters’ minds this election, and health care costs played a key role in voters’ cost of living concerns alongside concerns over affording other essentials like gas and groceries. Among voters overall, about half said the cost of living was “crucial” to their vote for Congress, rising to about six in ten among those who voted for Democratic House candidates compared to fewer than four in ten who voted for Republican House candidates. Among voters overall, about six in ten said that when it comes to their personal financial situation, they were “very concerned” about gas and diesel, health care, food and groceries, while slightly fewer said the same about utilities. Among those who voted for Democratic House candidates, about two-thirds or more said they were concerned about the costs of these essentials, while fewer, about four in ten voters for Republican House candidates, said the same.   

Health Care Costs Were a Top Affordability Concern for Midterm Voters (Split Bars)

Compared to those who voted in the 2024 presidential election, voters’ concerns about the cost of gas and diesel were eleven percentage points higher in this election, and concerns about health care costs rose by five percentage points. At the same time, the share of voters who were “very concerned” about food and grocery costs declined by eight percentage points.

Range plot showing percent of voters who said they are very concerned about various expenses. Results shown among voters in 2024 and 2026.

Democratic Senate candidates had a strong advantage among voters who were concerned about the cost of health care in key battleground states. About two-thirds of voters who were “very concerned” about health care costs said they voted for the Democratic Senate candidate across 7 states, while about three in ten of this group said they voted for the Republican Senate candidate. This reflects a reversal of dynamics from the 2024 presidential election, when voters who expressed similar cost concerns about health care favored President Trump over Vice President Harris by a ten-point margin.  

Stacked bar chart showing percent of voters from various battleground states who voted for either the Democratic or the Republican candidate. Results shown among voters who are very concerned about the cost of health care.

As with most previous elections, the economy was the number one issue in the 2026 midterms, with about six in ten voters overall saying “the economy and jobs” was the most important issue facing the country. While many polls ask voters to choose only one issue, NORC’s Civic Health and Elections Project poll allowed voters to choose up to three issues from a list, and health care was the second most selected issue among voters overall, with about four in ten saying it was an important issue. Health care was the second highest ranked issue for voters who said they voted for a Democratic House candidate, whereas more voters who chose Republican House candidates chose immigration as a top issue.  

Split bar chart showing the most important issue for voters. Results shown among total voters and voters by which political party's candidate they voted for in the House election.

Party Preferences on Health Care

Copy link to Party Preferences on Health Care

Midterm voters chose the Democratic Party over the Republican Party as better able to handle a range of issues, including on their top issue, the economy (44% vs. 37%), despite Republicans’ historical advantage on the issue. Health care was the biggest area of strength for the Democratic Party, as half of voters said they thought the Democratic Party could better handle the issue, compared to three in ten voters who chose the Republican Party, and one in five voters who said they thought “neither” party could better handle health care. Only on immigration, which was the second biggest issue facing the country for Republican voters, did voters overall give the Republican Party a slim advantage over Democrats. 

Health Care Was the Democratic Party’s Strongest Issue Over the Republican Party (Stacked Bars)

While partisans largely picked their own party to do a better job handling health care, independent voters favored Democrats over Republicans by roughly a 3-to-1 margin, though notably more than four in ten independent voters said they think neither party can better handle the issue. The Democratic party was seen as more capable on health care than the Republican party across age groups, though the margin between the two parties was narrower among voters age 65 and older.  

Across Age, Voters Preferred the Democratic Party Over the Republican Party on Health Care (Stacked Bars)

The Democratic Party’s advantage over the Republican Party on health care held across all key battleground Senate states, especially in Michigan and Maine, where voters favored the Democratic Party by about twenty percentage points. In both Michigan and Maine, Democratic Senate candidates El-Sayed and Jackson campaigned on Medicare-for-All and made health care a central focus of their campaigns. About half of Michigan and Maine voters said they thought the Democratic Party was better able to handle health care compared to about three in ten who favored the Republican Party. Voters also said they trusted the Democratic Party over the Republican Party by double-digit margins in Ohio, Texas, and Iowa, while voters gave the Democratic Party a smaller advantage over the Republican Party in Kansas and Alaska on handling health care.   

Figure 7

Views on the Trump Administration’s Health Care Policies

Copy link to Views on the Trump Administration’s Health Care Policies

2026 midterm voters harbored largely negative views of the Trump administration’s health policies, including the impact of these policies on their own health costs, access to care, the health of Americans, fraud in government health programs, and vaccine access.  

Majorities of voters said the Trump administration’s policies have made their own health care costs and the ability of Americans to get the health care they need “worse” – at least four times the share who said the administration made these “better.” Larger shares of midterm voters also said the administration’s policies worsened rather than improved fraud in government health programs and the health and well-being of people in the U.S., both of which had been a key focus of the second Trump administration’s health policy priorities.  

Stacked bar chart showing the share of midterm voters who say the Trump administration’s policies have made each of five health care-related areas better, worse, or not made much difference.

Across most key Senate battleground states, voters said the Trump administration’s policies had made their own health care costs worse rather than better by at least a 5-to-1 margin, while roughly four in ten across each state said the administration had no impact on their costs. One in six or fewer voters across all of these states said the administration had made their health care costs “better.” 

Stacked bar chart showing the share of midterm voters across key Senate races who say the Trump administration’s policies have made health care-related areas better, worse, or not made much difference.

Blame aimed at the Trump administration over rising health care costs was tied to support for Democratic House candidates overall, including among both Democratic and independent voters. Notably, about one in five Republicans who said the administration’s policies worsened their own health costs voted for the Democratic House candidate in their district.  

Stacked bar chart showing percent of voters by party identification who voted for either the Democratic or Republican candidate for the House. Results shown among voters who said the Trump administration's policies made their health care costs worse.

Views on the Government's Role in Health Care

Copy link to Views on the Government's Role in Health Care

With large shares of voters expressing concerns over the cost of health care, most 2026 midterm voters said they want the government to play a “bigger role” in helping Americans get health care. This sentiment was even more common among those who voted for Democratic House candidates. Those who voted for Republicans were more divided on the question, though the largest shares said they wanted the government to play a smaller role.  

Stacked bar chart showing views on the federal government’s role in helping Americans get health care among midterm voters, overall and by House vote choice.

As with the overall electorate, most voters in Michigan where Democratic Senate candidate Abdul El-Sayed campaigned on Medicare-for-All said they want government more involved in providing health care. El-Sayed’s base of voters was largely made up of these voters who want a larger government role in providing health care. A plurality of those who voted for Republican Senate candidate Mike Rogers in Michigan said they want the government to play a smaller role in health care, while smaller shares either said they want no change or for the government to play a bigger role.  

Stacked bar chart showing percent of Michigan voters who said they think the federal government should play a bigger role, a smaller role, or about the same role as it does now in helping Americans get health care. Results shown among total Michigan voters and Michigan voters by which candidate they voted for in the Senate race.

Similar to dynamics in Michigan, most voters in Maine – where Democratic Senate candidate Troy Jackson campaigned on Medicare-for-All – said they want the government to play a bigger role in helping Americans get health care, and Jackson’s base was overwhelmingly made up of these voters. While a plurality of those who voted for Republican Senate candidate Susan Collins said they want a smaller government role in providing health care, a notable share of Collins voters said they want to see a bigger role.  

Stacked bar chart showing percent of Maine voters who said the government should play a bigger role, a smaller role, or about the same role as it does now in helping Americans get health care. Results shown among total Maine voters and Maine voters by which candidate they voted for in the Senate race.

The Role of MAHA

Copy link to The Role of MAHA

Roughly three in ten midterm voters said they support the Make America Healthy Again (MAHA) movement, including 21% who said they “strongly support” the movement. Among midterm voters, there is a large overlap between MAHA support and support for the Make America Great Again (MAGA) movement, with three-quarters of MAGA Republicans identifying as MAHA supporters. Despite this overlap, previous KFF polling has found that many of the MAHA movement’s concerns about issues like food safety and corporate influence on health resonate with a broader group of voters than those who call themselves supporters of the movement.

Among Midterm Voters, Support for the Make America Healthy Again Movement Was Strongly Linked With MAGA Support (Stacked Bars)

Most midterm voters appear to reject the idea that the Trump administration’s policies have made America healthier. About six in ten voters overall said the Trump administration’s policies have made the health and well-being of people in the U.S. worse, while about one in five each say these policies have made things better or made no difference. MAHA-supporting voters took a much more positive view of this question, with about half of MAHA supporters, including almost six in ten strong supporters, saying the administration’s policies have improved the health and well-being of people in the U.S. At the same time, notable shares of MAHA’s strongest supporters said the administration’s policies have had no impact on Americans’ health (28%) or have made things worse (15%).

Most Midterm Voters Said the Trump Administration's Policies Made Health in the U.S. Worse, But MAHA Supporters Were More Positive (Stacked Bars)

Reflecting their strong overlap with MAGA-supporting Republicans, midterm voters who support MAHA largely voted for Republican candidates in House races across the country. Partisanship, however, still played a large role in MAHA voters’ choices: the small share of Democratic voters who support MAHA overwhelmingly voted for Democratic candidates, while independents who support MAHA favored Republican candidates over Democratic candidates by about a 2:1 margin.

Among MAHA-Supporting Voters, Partisans Largely Voted For Their Own Party’s Candidates (Stacked Bars)

Methodology and Additional Resources

Copy link to Methodology and Additional Resources

The Voter Poll by SSRS is a survey of roughly 80,000 registered voters that includes representative samples of 2026 midterm voters nationally and in all 50 states. Interviews were conducted from Oct. 19 - Nov. 3 in Alaska and Oct. 22 - Nov. 3 in all other states. The Voter Poll conducts interviews with a random sample of registered voters drawn from state voter files combined with interviews from registered voters selected using nonprobability approaches. It also includes interviews conducted in-person on Election Day with voters in 15 states and at select early-voting centers in Alaska.   

Find more details about the full methodology for the Voter Poll by SSRS, at https://ssrs.com/ssrs-solutions/voter-poll/.   

The Civic Health and Elections Project (CH&EP) is a survey of about 95,000 registered voters conducted nationally and in all 50 states by NORC at the University of Chicago, beginning on Oct. 28 and concluding as polls closed on Nov. 3, 2026. CH&EP conducts interviews with a random sample of registered voters drawn from state voter files and combines them with interviews from self-identified registered voters selected using nonprobability approaches. It also includes interviews with self-identified registered voters conducted using NORC’s probability-based AmeriSpeak panel, which is designed to be representative of the U.S. population. Interviews are conducted in English and Spanish. The study is funded by a group of sponsors including KFF; NORC made all final decisions on questionnaire content. 

Find more details about CH&EP’s methodology, including weighting, sample sizes, and question wording, at https://civichealth.norc.org/.  

Note: Throughout this report, partisans include independents who lean toward either party. 

For media inquiries contact KFFMedia@kff.org 

Medicare Advantage Plan Availability Varies Widely by County for 2027

One in five (20%) Medicare beneficiaries have more than 40 Medicare Advantage drug plan options, while 1% of beneficiaries have none.

Published: Nov 5, 2026

Editorial Note: This analysis, originally published on October 9, 2026, has been updated with additional data, including which firms have entered and exited the Medicare Advantage market overall, the number of firms the average beneficiary can choose from, and the distribution of beneficiaries by the number of firms offering plans across counties.

The Medicare Advantage market, the private plan alternative to traditional Medicare, is dynamic, and plan offerings can change from year to year. With 28 Medicare Advantage prescription drug (MA-PD) plans available to the average beneficiary in 2027, most people with Medicare have a robust set of MA-PD options. However, Medicare Advantage plans are offered at the county level, and variation in plan availability across the country has long been a feature of the Medicare Advantage market. This analysis uses Medicare plan landscape data from the Centers for Medicare & Medicaid Services to examine county-level variation in MA-PD plan availability in 2027 and changes from 2026. This analysis does not examine changes in costs, benefits, or other plan characteristics. The analysis shows that plan level availability varies widely across the country in 2027, with a modest reduction in the share of enrollees having more than 40 MA-PDs to choose from compared to 2026, some major insurers exiting a much larger number of counties than they are entering, and a larger number of firms exiting the market than the number of new entrants.

Findings

One in five Medicare beneficiaries (20%) can choose from more than 40 MA-PDs for coverage in 2027.

The 20% of Medicare beneficiaries who have more than 40 MA-PD options are concentrated in 4% of counties (Figure 1). This is a decrease from 2026 when 27% of beneficiaries, who resided in 6% of counties, had more than 40 options.Similar to 2026, the counties with the most plan options are predominantly in Pennsylvania, Ohio, and Michigan, as well as Los Angeles County, California. Beneficiaries in Lancaster, Pennsylvania can choose from 66 MA-PDs – the most offerings of any county in the U.S.

One in Five Medicare Beneficiaries (20%) Have More Than 40 Medicare Advantage Plans with Prescription Drug Coverage Available Where They Live in 2027 (Choropleth map)

Nearly 13 million people have a choice of more than 40 Medicare Advantage plans with drug coverage for 2027, down from 16.6 million for the 2026 plan year. Another 12.8 million beneficiaries have a choice of 31 to 40 plans for 2027, down slightly from 13.2 million for 2026. In contrast, nearly 7 million people have 1 to 10 Medicare Advantage plans with drug coverage available for 2027, up from 4.8 million people for the 2026 plan year.

In 2027, Nearly 13 Million Medicare Beneficiaries Have a Choice of More Than 40 Plans in 137 Counties (Split Bars)

For 2027, Medicare beneficiaries residing in 193 counties will have no MA-PDs available for general enrollment, an increase from 123 counties in 2026.

Beneficiaries in the 193 counties without any MA-PD option for general enrollment for 2027 comprise 1% of all Medicare beneficiaries, or 638,000 people. This is an increase from 2026, when 399,000 beneficiaries did not have a MA-PD option (an increase of 239,000 beneficiaries).

The counties with no MA-PD options are located in 16 states (Alaska, California, Colorado, Idaho, Kansas, Minnesota, Montana, Nebraska, Nevada, New Hampshire, North Dakota, Oklahoma, Oregon, South Dakota, Utah, and Vermont) and U.S. territories other than Puerto Rico. These are the same states as 2026, with the addition of New Hampshire, North Dakota, and Oklahoma. Similar to 2026, there are no MA-PDs for general enrollment being offered in any county in Alaska in 2027, which includes about 110,000 beneficiaries.

In six counties (Boyd, Nebraska; Aurora, Beadle, Bon Homme, Brown, and Charles Mix, South Dakota) there is a Medicare Advantage plan option without prescription drug coverage, but in the other 187 counties, no Medicare Advantage plans with or without prescription drug coverage for general enrollment are available. In some counties where Medicare Advantage plans for general enrollment are not available, there are other private plan options, including cost plans as well as special needs plans, which restrict enrollment to Medicare beneficiaries who meet specific criteria.

The average Medicare beneficiary can choose from among MA-PDs offered by seven firms for 2027.

The average Medicare beneficiary can choose from Medicare Advantage prescription drug plans offered by seven firms for 2027, a decline of one firm from the 2026 plan year. Despite most beneficiaries having access to plans operated by several different firms, enrollment is concentrated in plans operated by UnitedHealthcare and Humana, which together account for nearly half (46%) of Medicare Advantage enrollment in 2026.

For 2027, two in ten beneficiaries (20%), in 68 counties, are able to choose from MA-PDs offered by 10 or more firms (a decline from 29% of beneficiaries in 131 counties for the 2026 plan year; Figure 3).

Two in Ten (20%) Medicare Beneficiaries Can Choose Among Medicare Advantage Plans Offered by 10 or More Firms in 2027 (Split Bars)

In contrast, about 9% of beneficiaries, in 679 counties, can choose from MA-PDs offered by two or three firms (an increase from 572 counties and 7% of beneficiaries for the 2026 plan year). Further, in 259 counties, only one firm will offer an MA-PD for 2027, an increase from 180 counties for the 2026 plan year. These are mostly rural counties with relatively few Medicare beneficiaries (about 2% of the Medicare population for 2027, a slight increase from 1% of the population for the 2026 plan year).

The two largest Medicare Advantage insurers – UnitedHealth Group and Humana – are exiting more counties, meaning they are no longer offering any MA-PDs in those counties, than they are entering in 2027.

UnitedHealth Group is exiting 228 counties and entering 9 new counties, and Humana is exiting 62 counties and entering 4 new counties (Figure 4). Humana is offering MA-PDs in the largest number of counties relative to other insurers – about 80% of all U.S. counties, similar to 2026 – while UnitedHealth Group is offering plans in about 70% of counties, a decline from 2026, when the insurer offered plans in nearly 80% of counties.

In 2027, 10 Medicare Advantage Insurers are Making Changes to Plan Offerings that Affect at Least 50 Counties (Table)

Among insurers offering MA-PD plans, Health Care Service Corporation is making the largest reduction in its county footprint, exiting the greatest number of counties in 2027 (498 counties) while entering no new counties. Centene has the second largest reduction, exiting 359 counties and entering 15 new counties for 2027. Blue Cross Blue Shield of Michigan Mutual Ins. Co., which had offered MA-PDs in Iowa, Michigan, North Dakota, South Dakota, and Wyoming in 2026, is exiting 177 counties and entering one new county, and will only offer MA-PDs in Michigan and Wyoming for 2027. Elevance Health is exiting 66 counties and entering 10 new counties in 2027.

Two insurers - Group 1001 (marketed as Clear Spring Health), which offered plans in Colorado, Georgia and Illinois, and Molina Healthcare – are completely exiting the MA-PD market, though Molina is still offering SNPs in many counties in 2027.

In contrast, Devoted Health is expanding its MA-PD footprint, entering 342 counties and exiting none in 2027. Second to Devoted Health, CVS Health is entering a larger number of new counties in 2027 than other insurers (63 new counties), but is also exiting 186 counties.

Kaiser Foundation Health Plans, a high enrollment insurer, is maintaining its footprint, exiting three counties while entering three new ones in 2027 (data not shown).

The characteristics of markets that insurers are leaving vary. In some cases, multiple insurers are exiting more rural areas with relatively small Medicare populations, such as four counties in Minnesota (Brown, Lake of the Woods, Morrison, and Renville), in each of which three insurers who offered MA-PDs in 2026 are no longer offering MA-PDs for 2027. In other cases, individual insurers are exiting counties in more urban areas with higher Medicare Advantage penetration, such Miami-Dade County, FL where Health Care Service Corporation is no longer offering MA-PDs in 2027 and Monroe County, New York (Rochester) where Humana left the market. The different decisions of insurers to exit certain counties suggest a combination of factors are at play, including local market characteristics, cost pressures, shifts in firm-level strategies, and ultimately the insurers’ assessment of profitability.

In 2027, more firms are exiting the Medicare Advantage market than entering it.

In 2027, four firms are entering the Medicare Advantage market for the first time, ten firms are exiting the market, and four have had contracts taken over by other insurers (Figure 10). Three of the four firms entering the market are offering only HMO plans, while one firm is offering both HMOs and C-SNP plans.

Entrants and Exiting Firms in Medicare Advantage Markets, by Plan Type and Plan Locations, 2027 (Table)

In recent years, some firms have introduced plans that are either co-branded or are in partnership with another company. For example, Alignment Health is offering plans co-branded with Instacart in California and Nevada in 2027, as they did in 2026 and 2025. These plans will offer groceries to qualifying beneficiaries with chronic conditions. Alignment Health also continues to partner with Walgreens, and Humana continues to partner with USAA. New for 2027, SCAN Group is offering co-branded plans with Costco in California and Nevada as well as plans with Walmart in Arizona and Texas.

Ten firms that participated in the Medicare Advantage market in 2026 are not offering plans in 2027. Some of the firms, such as Memorial Hermann Health Plan and Central Mass Health (Mass Advantage) cited specific reasons for exiting the market, such as the changing Medicare landscape, cost pressures, and regulatory uncertainty, but others often do not specify why they are leaving the market.

Another four firms left the market but had their contracts taken over by other insurers, typically through a merger or affiliation. Three of the firms that are no longer in the Medicare Advantage market had contracts taken over by other parent organizations that were already offering plans in the Medicare Advantage market (Community Care, Inc., Marshfield Clinic Health System, Inc., and Renown Health). Summa Health plans are now part of General Catalyst Group Management Holdings LP, which is new to the Medicare Advantage market.

While they are not exiting the Medicare Advantage market completely, an additional four firms that had previously offered Medicare Advantage prescription drug plans available for general enrollment will only be offering SNPs in 2027 (Elderplan, Inc., Horizon Mutual Holdings, Inc, Molina Healthcare, Inc, and Presbyterian Healthcare Services).