The Role of Language in Health Care Access and Utilization for Insured Hispanic Adults
Executive Summary
Language can play an important role in individuals’ access to and use of health care and impact their understanding of their health coverage and communications with their provider. The Affordable Care Act (ACA) coverage expansions may help mitigate barriers people with limited English proficiency (LEP) face in accessing coverage and care. However, individuals with LEP may still face increased challenges after gaining coverage. To better understand how health care experiences vary by language, this analysis examines differences between English- and Spanish-speaking Hispanic adults with insurance using data from the 2014 Kaiser Survey of Low-Income Americans and the ACA. The findings show that among insured Hispanic adults:
Demographics. Spanish-speakers are as likely as English-speakers to have a worker in the family but are lower income, older, and more likely to report an ongoing health condition than English-speakers.
Heath Plan Experiences. There are few differences between Spanish- and English-speakers in experiences choosing a plan, the likelihood of having problems with their plan paying for services, or experiencing difficulties interacting with their plan. However, Spanish-speakers give lower ratings to their plan, have more limited understanding of their coverage, and are more likely to have gaps in coverage for needed services than English-speakers.
Access and Utilization. There are no significant differences between Spanish- and English-speakers in their access to and use of care, although clinics play a significantly larger role as a source of care for Spanish-speakers. The majority of both groups report good communications with their provider.
Affordability. Reflecting their more limited incomes, Spanish-speakers are more likely than English-speakers to be concerned about their ability to afford health care. Further, although Spanish-speakers are less likely to have a premium, those who do are nearly twice as likely as English speakers to report difficulty paying it.
The findings show that, among insured Hispanic adults, Spanish-speakers face some increased challenges compared to English-speakers. They have greater gaps in their understanding of their coverage, and, as such, may benefit from targeted education efforts. Moreover, given their more limited incomes, affordability of coverage and care is particularly important for Spanish-speakers. Despite these challenges, Spanish-speakers are as likely as those who speak English to receive care and communicate well with their provider. These findings suggest that clinics, which most Spanish-speakers rely on as their usual source of care and have a longstanding role serving a diverse population, are likely effective in connecting them to care and ensuring good communication with patients.
Issue Brief
As of 2013, and estimated 25.1 million individuals living in the United States had Limited English Proficiency (LEP), meaning that they reported being unable to speak English “very well.”1 Hispanic, Spanish-speaking adults account for the majority individuals with LEP in the United States.2 Individuals with LEP may face increased barriers to accessing health coverage and care compared to English-speakers.3 While gains in health coverage under the Affordable Care Act (ACA) may help reduce some of these barriers, individuals with LEP may still face increased challenges to accessing and utilizing care, understanding their health coverage, and communicating with their health care providers.
To better understand how health care experiences vary by language spoken, this analysis examines differences between English- and Spanish-speaking Hispanic adults with insurance. It is based on data from the 2014 Kaiser Survey of Low-Income Americans and the ACA. The survey of 10,502 nonelderly adults was fielded between September 2 and December 15, 2014. Data were analyzed for Hispanics with insurance. The total sample of 1,950 people included individuals who completed the survey in Spanish and reported not speaking English well,4 referred to as Spanish-speakers (n=628), and those who completed the survey in English (n=1,322), referred to as English-speakers. Individuals who completed the survey in Spanish and reported speaking English well were excluded from the analysis (n=111).
Findings
Demographic Characteristics, Health Needs, and Health Coverage
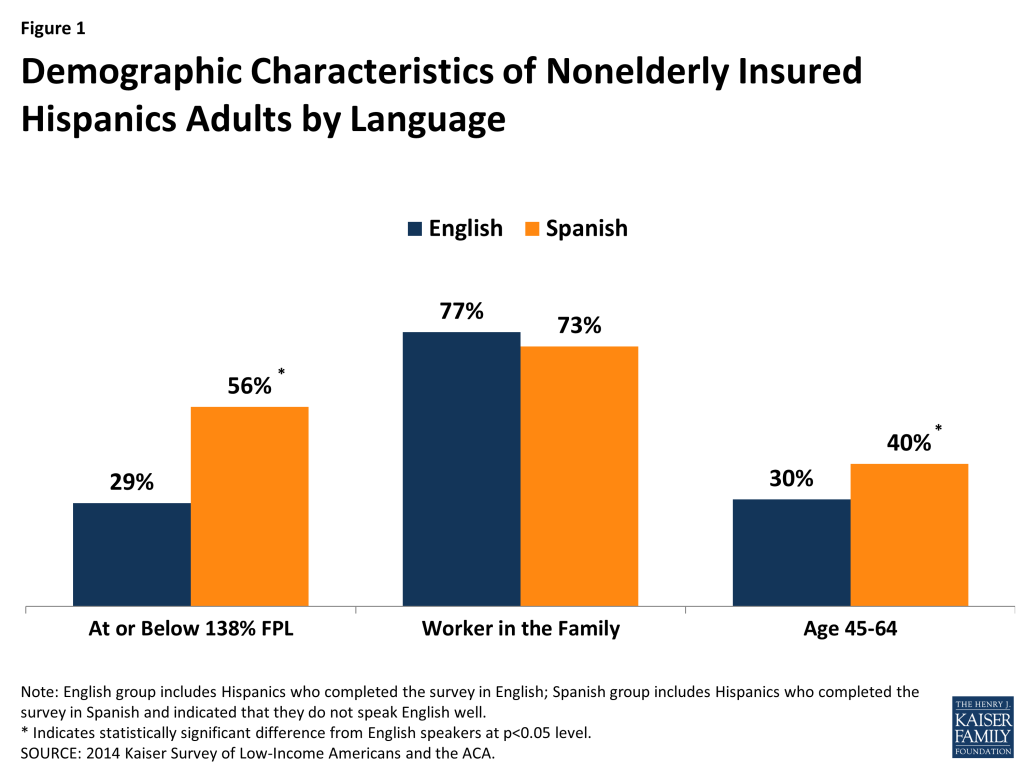
Spanish-speaking insured Hispanic adults are as likely as their English-speaking counterparts to have a worker in the family, but are lower income and older. About one in five (18%) of insured Hispanic adults are Spanish-speakers. Although Spanish-speakers are as likely as those who speak English to have a worker in the family, over half (56%) of Spanish-speakers have incomes below 138% of the Federal Poverty Level (FPL) compared to 29% of those who speak English (Figure 1). With regard to age, four in ten Spanish-speakers are between ages 45-64, compared to three in ten English-speakers.
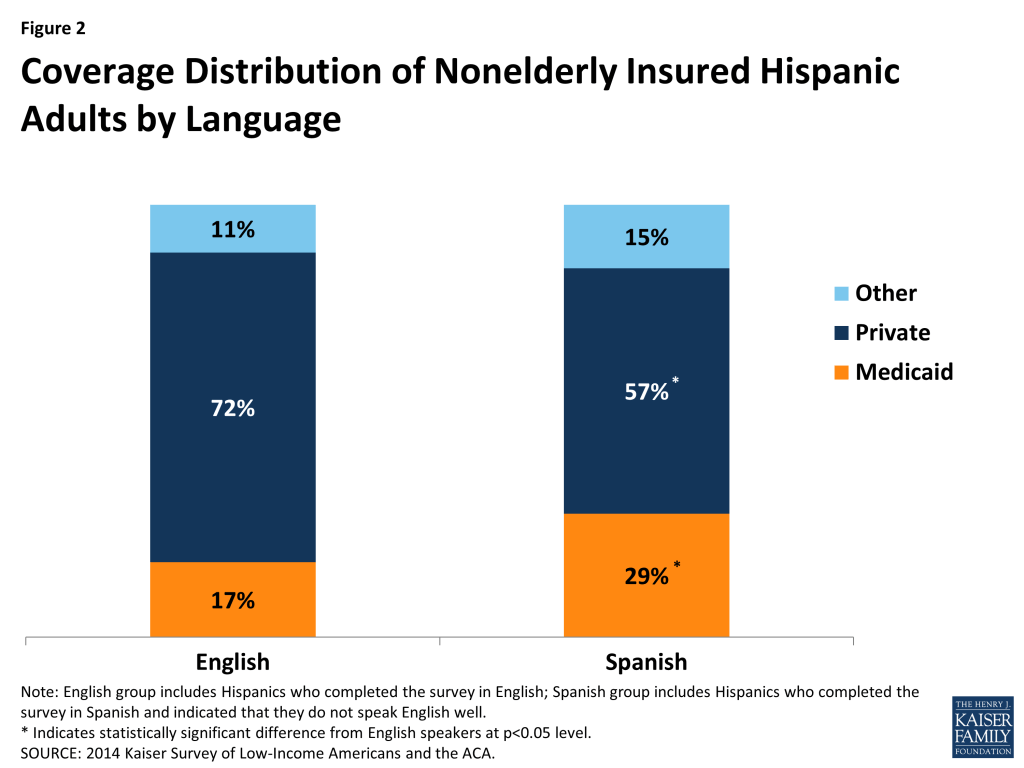
Reflecting their lower incomes, Spanish-speaking insured Hispanic adults are more likely to be covered by Medicaid and less likely to have private coverage compared to English-speakers. Among insured Hispanic adults, 29% of Spanish-speakers are covered by Medicaid compared to 17% of English-speakers (Figure 2). Further, nearly three-quarters (72%) of English-speakers have private coverage versus 57% of Spanish-speakers.
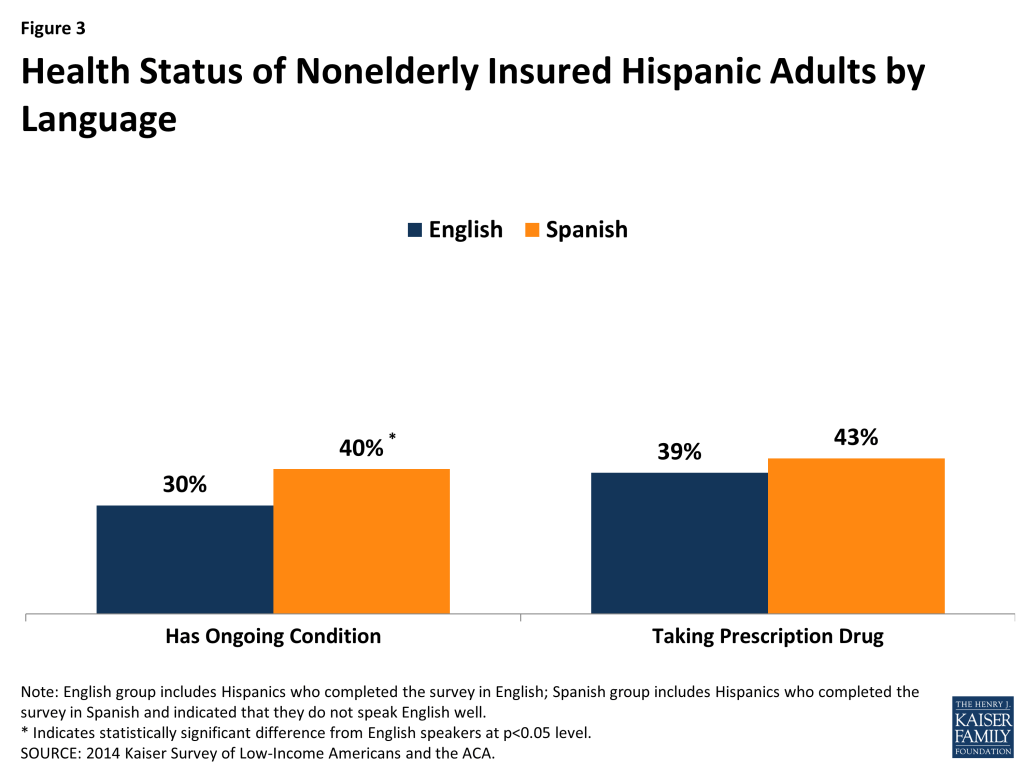
Among insured Hispanic adults, Spanish-speakers are more likely to report an ongoing condition compared to English-speakers. Four in ten Spanish-speakers report an ongoing condition compared to three in ten English-speakers (40% vs. 30%) (Figure 3). However, there are no significant differences in the shares of Spanish- and English-speakers who report taking a prescription drug.
Health Plan Experiences and Understanding of Health Coverage
Among insured Hispanic adults, language plays a limited role in whether individuals experience difficulties choosing a plan. There are no significant differences in the shares of English- and Spanish-speakers who found it somewhat or very difficult to compare services or costs when choosing a plan, with roughly a quarter of adults reporting these challenges (Figure 4). Spanish-speakers are significantly less likely than English-speakers to say it is somewhat or very difficult to compare providers when choosing a plan (13% vs. 22%), but still only a minority of both groups report this problem.

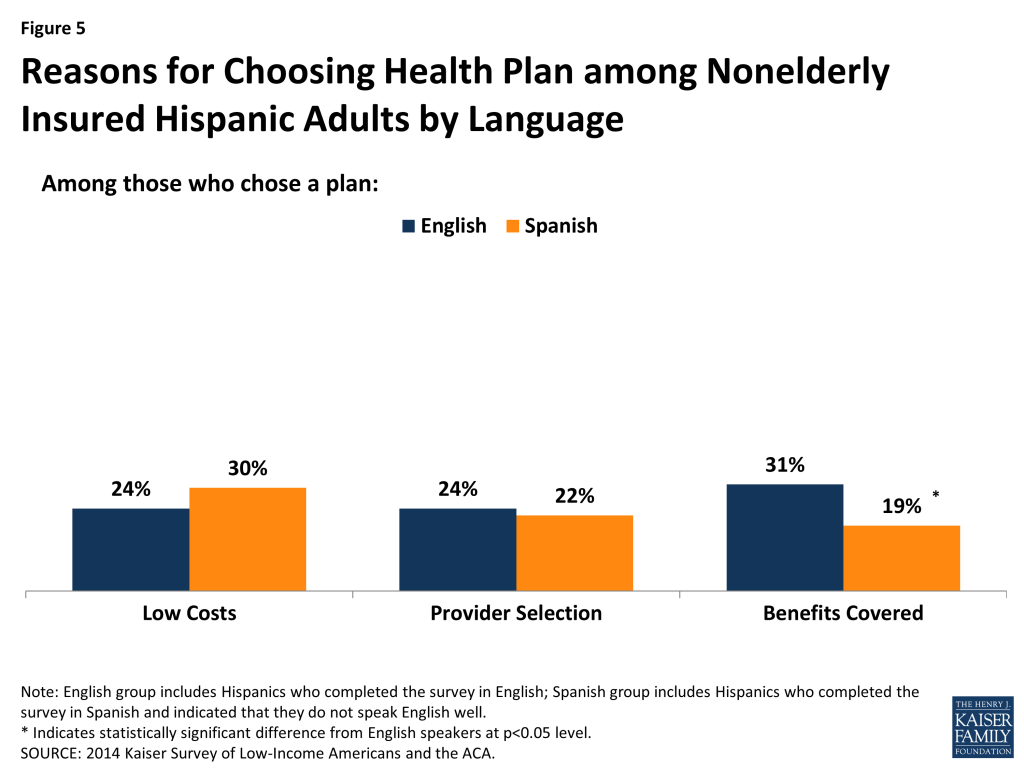
Similarly, there are few differences between Spanish- and English-speakers in reasons for choosing a health plan among insured Hispanic adults. Although Spanish-speakers are lower income than English-speakers, they are not more likely to cite low costs as a reason why they chose their plan (Figure 5). This finding may reflect that fewer Spanish-speakers are subject to costs since they are more likely to be covered by Medicaid, which generally does not charge premiums and limits out-of-pocket charges. Similarly, English- and Spanish-speakers are equally likely to cite provider selection as a reason for choosing their plan, with about a quarter of both groups reporting this as a reason. However, Spanish-speakers are less likely than English-speakers to say the benefit package was a reason why they chose their health plan (19% vs. 31%). This finding may be related to their more limited understanding of their coverage, as discussed below.
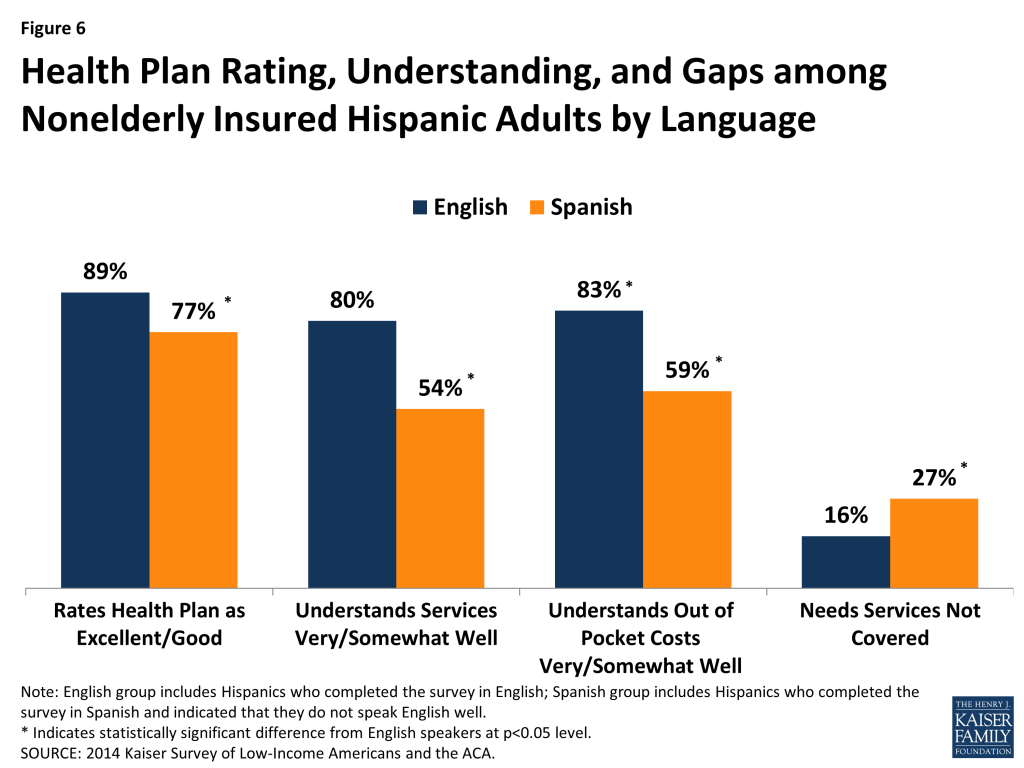
Although language appears to play a limited role in experiences choosing a plan, Spanish-speaking insured Hispanic adults face some increased challenges with their health plan compared to English-speakers. Specifically, Spanish-speakers are less likely than those who speak English to give their health plan a high rating (Figure 6). They also are less likely than English-speakers to say they understand the services covered by their plan and their out-of-pocket costs well. Moreover, they are more likely to experience gaps in their coverage, with over a quarter (27%) of Spanish-speakers reporting they need services that are not covered by their plan compared to 16% of English-speakers.
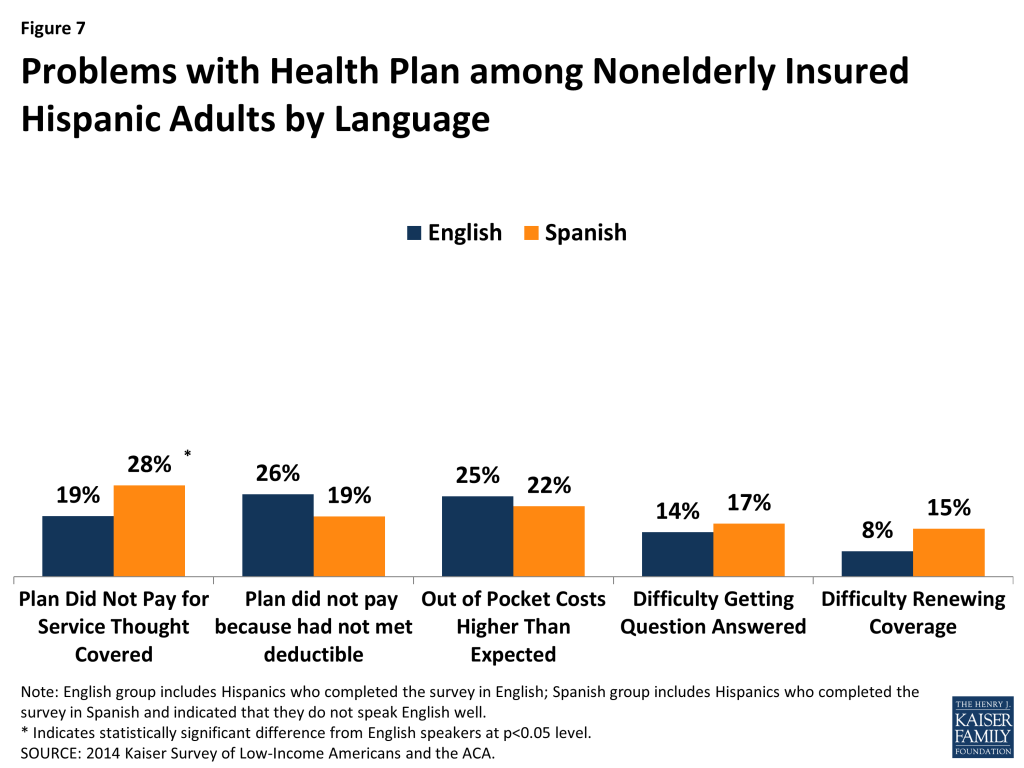
Although Spanish-speakers face some increased challenges with their plan compared to English-speakers, there are few differences between the groups with regard to problems with their plan paying for services or difficulties interacting with their plan. For example, there are no significant differences between Spanish- and English-speaking insured Hispanic adults in the likelihood of the plan not paying because the deductible was not met, facing higher than expected out-of-pocket costs, having difficulty getting questions answered, or experiencing difficulty renewing coverage (Figure 7). However, consistent with the findings above showing that Spanish-speakers were more likely than English-speakers to need services not covered by their plan and to have limited understanding of their covered services, they are more likely to report that the plan did not pay for services they thought would be covered.
Access to and Utilization of Care
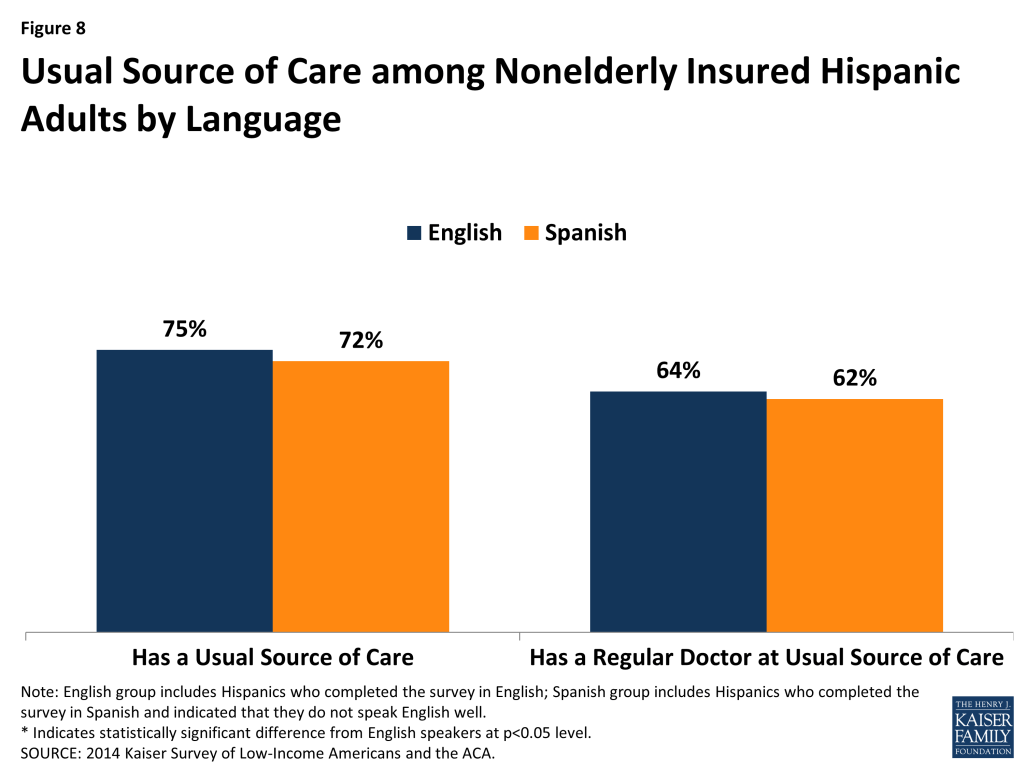
Among insured Hispanic adults, there are no significant differences between Spanish- and English-speakers in the likelihood of having a usual source of care or a regular doctor. About three-quarters of both English- and Spanish-speakers have a usual source of care other than the emergency room and over six in ten of both groups have a regular doctor at a usual source of care (Figure 8).
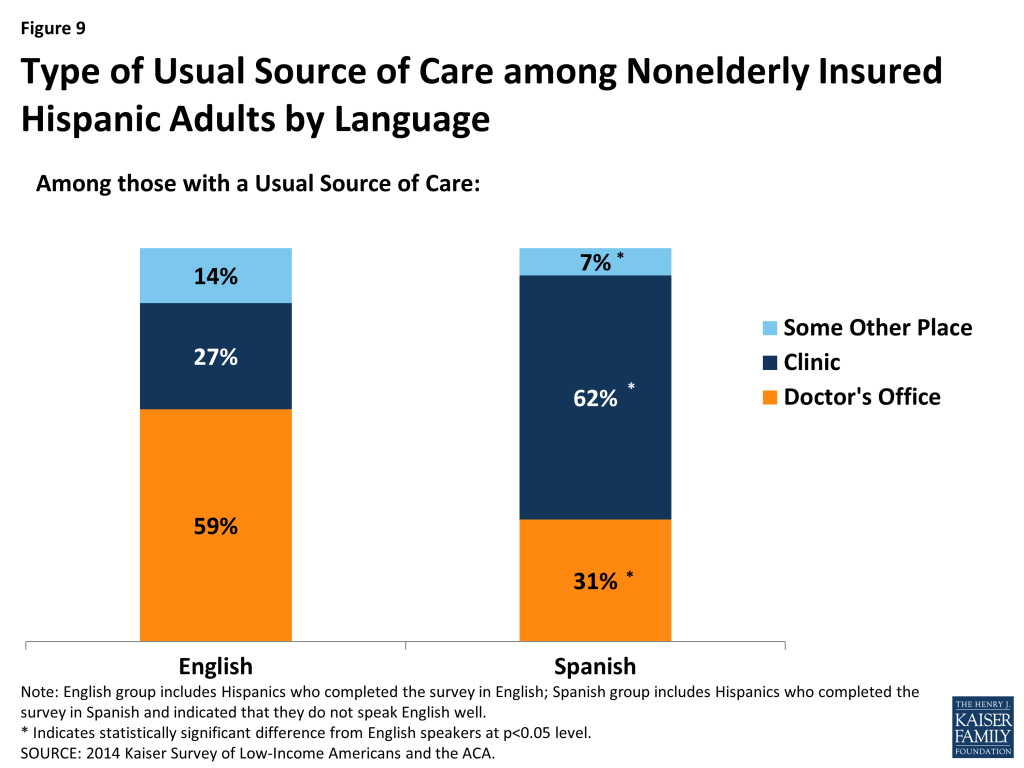
However, Spanish-speaking Hispanic insured adults are significantly more likely than those who speak English to rely on a clinic as their usual source of care. Spanish-speakers are about half as likely as English-speakers to rely on a doctor’s office as their usual source of care (31% vs. 59%) and over twice as likely as to rely on a clinic (62% vs. 27%) (Figure 9).
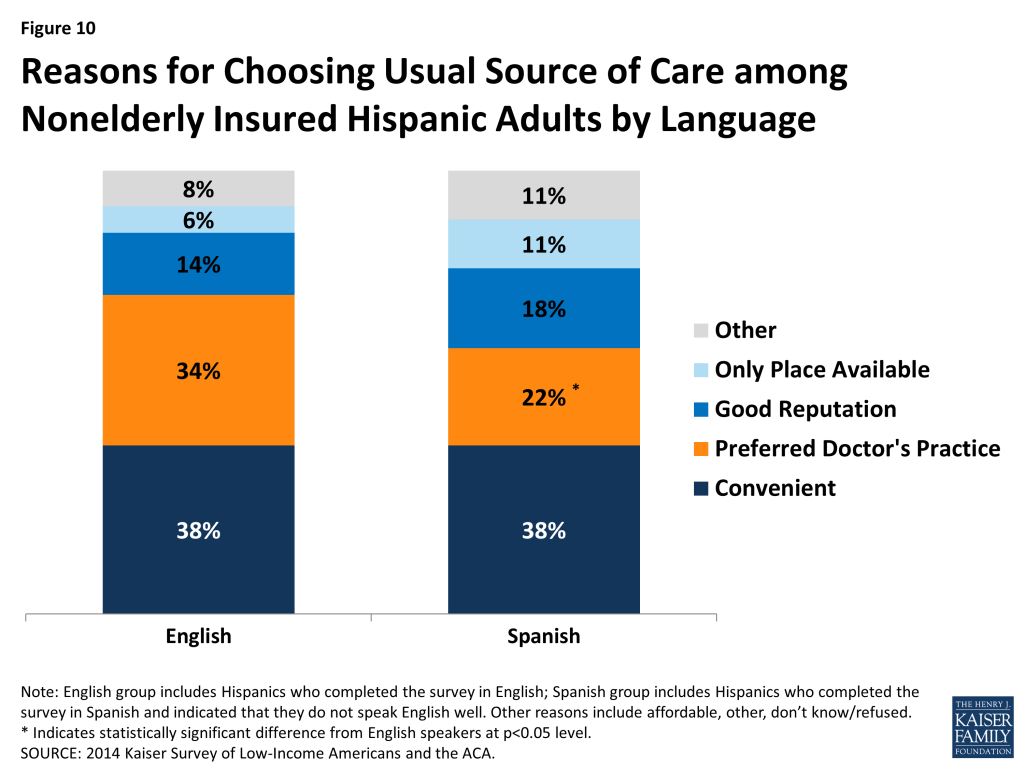
There are limited differences between Spanish- and English-speaking insured Hispanic adults with regard to why they chose their usual source of care. For example, about four in ten (38%) of both groups said convenience was a reason why they chose their usual source of care, while smaller shares said that the place having a good reputation and the place being the only one available were reasons (Figure 10). About a third (34%) of English-speakers said that the place having their preferred doctor was a reason why they chose their source of care, which was higher than the 22% of Spanish-speakers who said this was a reason. It is unclear if this finding reflects that the place having their preferred doctor is a less important factor for Spanish-speakers or if they are less likely to have a preferred doctor prior to choosing a usual source of care.
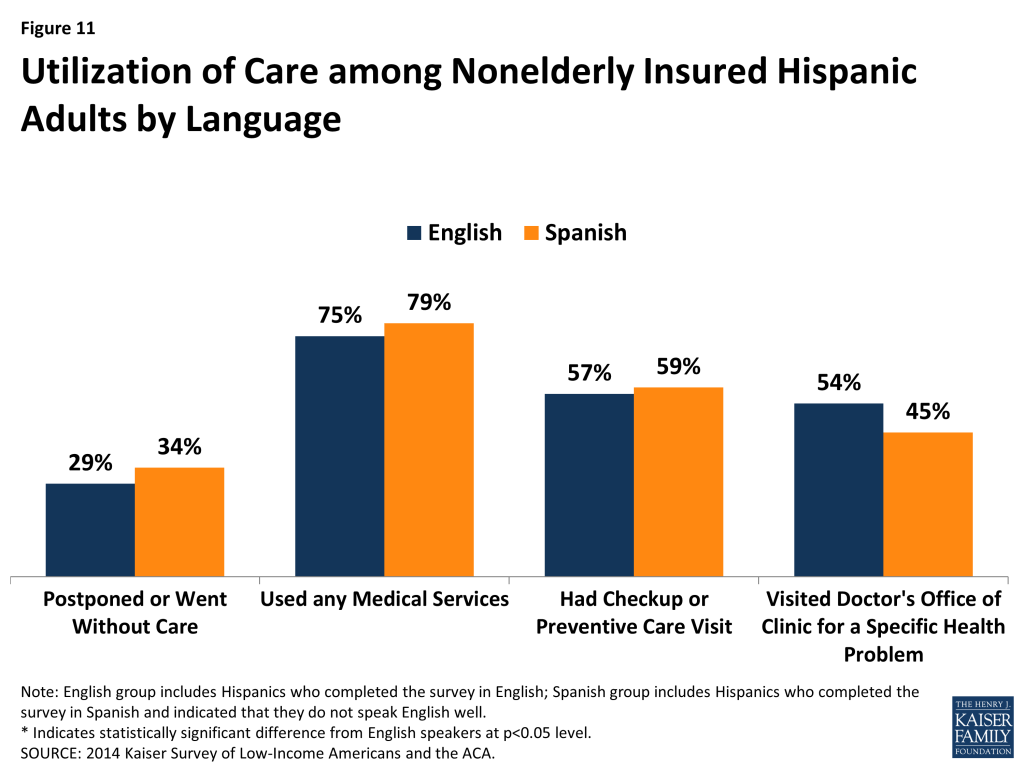
Among insured Hispanic adults, there are no significant differences between Spanish- and English-speakers in the likelihood of postponing or going without care and receiving certain types of care. About three in ten of both Spanish- and English-speakers said they postponed or went without needed care (Figure 11). Over three-quarters of both groups used medical services and nearly six in ten received a check-up or preventive care visit. Although Spanish-speakers are significantly more likely than English-speakers to report having an ongoing condition, there is no significant difference between Spanish- and English-speakers in the share that visited a doctor’s office for a specific health problem.
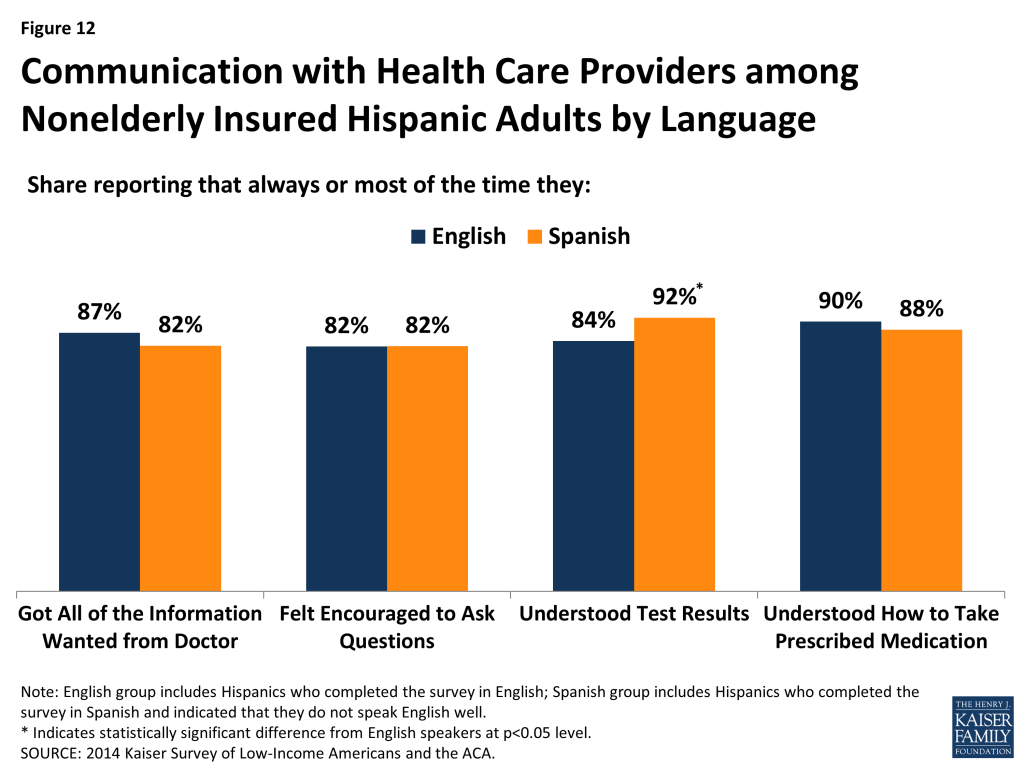
High shares of insured Hispanic adults report good communication with their providers regardless of language. Among both Spanish- and English-speaking insured Hispanic adults, over eight in ten report that they got all the information they wanted from their doctor, felt encouraged to ask questions, understood test results, and understood how to take prescribed medication (Figure 12).
Affordability of Health Care Costs and Financial Security
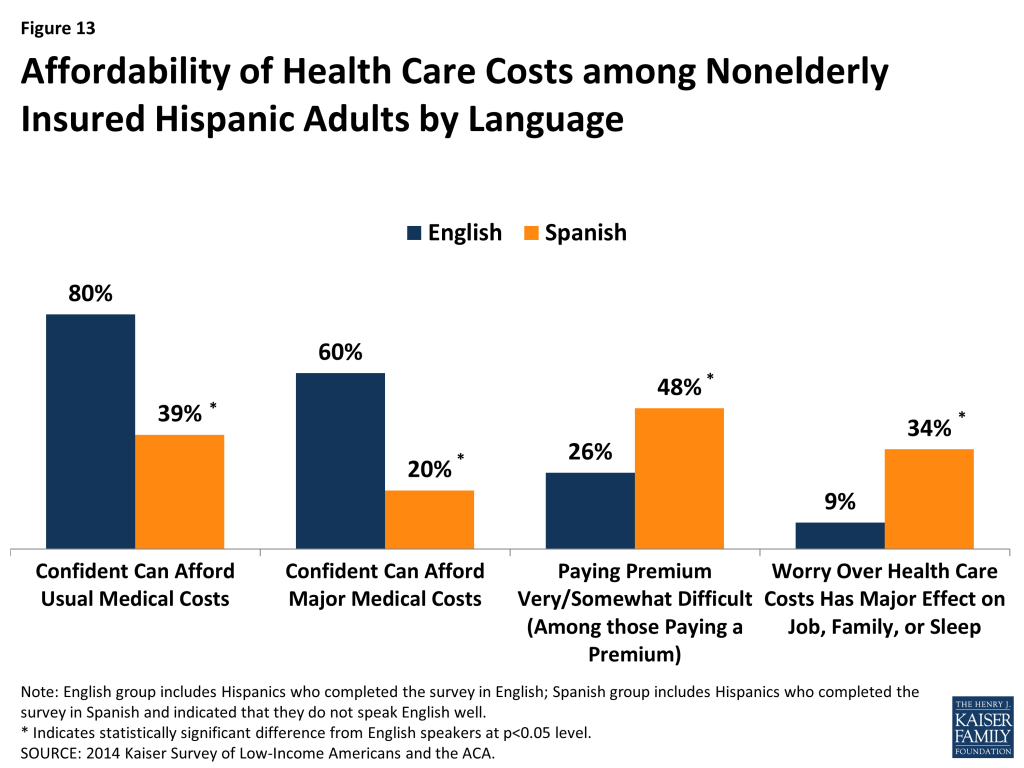
Reflecting their more limited incomes, Spanish-speaking insured Hispanic adults report greater concerns about and difficulty affording health care costs than English-speakers. English-speakers are twice as likely as Spanish-speakers to report confidence in their ability to afford usual medical costs (80% vs. 39%), and three times as likely to report confidence in their ability to afford major medical costs (60% vs. 20%) (Figure 13). In addition, among those who have a premium, Spanish-speakers are almost twice as likely as English speakers to say paying the premium is very or somewhat difficult (48% vs. 26%). However, overall, Spanish-speakers are less likely than English-speakers to have a premium since a larger share is covered by Medicaid, which generally does not charge premiums. Spanish-speakers also are more than three times as likely as English-speakers to say that worries over health care costs have a major effect on their job, family, or sleep (34% vs. 9%).
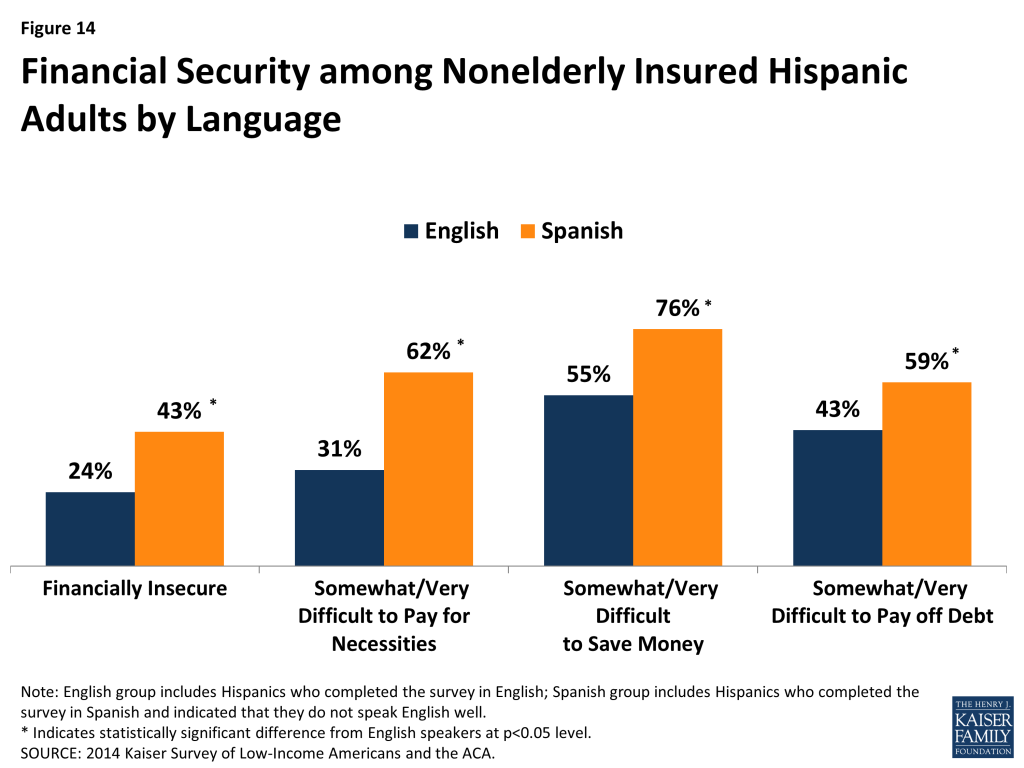
Spanish-speaking insured Hispanic adults also face larger overall financial challenges compared to those who speak English. Spanish-speakers are more likely than English-speakers to say they are financially insecure (43% vs. 24%) and that they find it somewhat or very difficult to pay for necessities (62% vs. 31%), save money (76% vs. 55%), or pay off debt (59% vs. 43%) (Figure 14).
Conclusion
The findings show that, among insured Hispanic adults, Spanish-speakers face some increased challenges compared to English-speakers. They have greater gaps in their understanding of their coverage, and, as such, may benefit from targeted education efforts. Moreover, given their more limited incomes and broader financial challenges, Spanish-speakers are significantly more likely than English-speakers to have concerns about their ability to afford health care and to have difficulty affording premiums. As such, affordability of coverage and care is particularly important for Spanish-speakers. Despite these challenges, Spanish-speaking insured Hispanic adults are as likely as their English-speaking counterparts to receive care and communicate well with their provider. These findings suggest that clinics, which most Spanish-speakers rely on as their usual source of care and have a longstanding role serving a diverse population, are likely effective in connecting them to care and ensuring good communication with patients.
Appendix
| Appendix Table A: Demographic Characteristics, Health Needs, and Health Coverage Among Nonelderly Insured Hispanic Adults by Language | ||
| English | Spanish | |
| Income | ||
| ≤138% FPL | 29% | 56%* |
| 138% – 400% FPL | 45% | 42% |
| >400% FPL | 26% | — |
| Work Status | ||
| Worker in the Family | 77% | 73% |
| Full Time Worker in the Family | 68% | 64% |
| Part Time Worker in the Family | 9% | 9% |
| No Worker in the Family | 23% | 27% |
| Gender | ||
| Female | 53% | 60% |
| Male | 47% | 40% |
| Age | ||
| 19 – 25 | 25% | — |
| 26 – 34 | 20% | 17% |
| 35 – 44 | 25% | 35%* |
| 45 – 64 | 30% | 40%* |
| Family Status | ||
| Married with Dependent Children | 32% | 34% |
| Married without Dependent Children | 17% | 16% |
| Not Married with Dependent Children | 17% | 19% |
| Not Married without Dependent Children | 33% | 31% |
| Health Needs | ||
| Has Ongoing Health Condition | 30% | 40%* |
| Taking Prescription Drugs | 39% | 43% |
| Type of Health Coverage | ||
| Private | 72% | 57%* |
| Medicaid | 17% | 29%* |
| Other | 11% | 15% |
| NOTE: English group includes Hispanics who completed the survey in English; Spanish group includes Hispanics who completed the survey in Spanish and indicated that they do not speak English well. * Indicates statistically significant difference from English-speakers at p<0.05 level. SOURCE: 2014 Kaiser Survey of Low-Income Americans and the ACA. | ||
| Appendix Table B: Experiences with and Understanding of Health Plans Among Nonelderly Insured Hispanic Adults by Language | ||
| English | Spanish | |
| Choosing a Health Plan | ||
| Somewhat/Very Difficult to Compare Services | 24% | 20% |
| Somewhat/Very Difficult to Compare Costs | 20% | 28% |
| Somewhat/Very Difficult to Compare Providers | 22% | 13%* |
| Any Problem | 36% | 37% |
| Reasons for Choosing Health Plan | ||
| Low Costs | 24% | 30% |
| Provider Selection | 24% | 22% |
| Benefits Covered | 31% | 19%* |
| Family or Friends Recommended | — | — |
| Other Family Also Covered | 7% | — |
| Rating Health Plans | ||
| Excellent/Good Rating | 89% | 77%* |
| Not so good/Poor | 9% | 19%* |
| Understanding Health Plans | ||
| Understood Services Very/Somewhat Well | 80% | 54%* |
| Understood Out of Pocket Costs Very/Somewhat Well | 83% | 59%* |
| Gaps In Plan | ||
| Needs Services Not Covered | 16% | 27%* |
| Problems with Health Plan | ||
| Plan Did Not Pay for Services Thought Covered | 19% | 28%* |
| Plan Did Not Pay because Had Not Met Deductible | 26% | 19% |
| Out of Pocket Costs Higher than Expected | 25% | 22% |
| Difficulty Getting Question Answered | 14% | 17% |
| Difficulty Renewing Coverage | 8% | 15% |
| NOTE: English group includes Hispanics who completed the survey in English; Spanish group includes Hispanics who completed the survey in Spanish and indicated that they do not speak English well. * Indicates statistically significant difference from English-speakers at p<0.05 level. SOURCE: 2014 Kaiser Survey of Low-Income Americans and the ACA. | ||
| Appendix Table C: Access to Care, Utilization of Care, and Communication with Health Care Providers Among Nonelderly Insured Hispanic Nonelderly Adults by Language | ||
| English | Spanish | |
| Usual Source of Care (USOC) | ||
| Has a USOC that is not the Emergency Department | 75% | 72% |
| USOC is a: | ||
| Clinic | 27% | 62%* |
| Doctor’s Office | 59% | 31%* |
| Some Other Place | 14% | 7%* |
| Reasons for Choosing USOC: | ||
| Convenient | 38% | 38% |
| Only Place Available | 6% | 11% |
| Preferred Doctor’s Practice | 34% | 22%* |
| Good Reputation | 14% | 18% |
| Other (Affordable, Don’t Know, and Refused) | 8% | 11% |
| Has Regular Doctor at USOC | 64% | 62% |
| Utilization of Care | ||
| Postponed or Went Without Care | 29% | 34% |
| Never Ended Up Getting Needed Care | 16% | 10% |
| Used any Medical Services | 75% | 79% |
| Had Checkup or Preventive Care Visit | 57% | 59% |
| Visited Doctor’s Office or Clinic for a Specific Health Problem | 54% | 45% |
| Communication with Health Care Providers | ||
| Always/Most of the Time Got All of the Information Wanted From Doctor | 87% | 82% |
| Always/Most of the Time Felt Encouraged to Ask Questions | 82% | 82% |
| Always/Most of the Time Understood Test Results | 84% | 92%* |
| Always/Most of the Time Understood How to Take Prescribed Medication | 90% | 88% |
| NOTE: English group includes Hispanics who completed the survey in English; Spanish group includes Hispanics who completed the survey in Spanish and indicated that they do not speak English well. * Indicates statistically significant difference from English-speakers at p<0.05 level. SOURCE: 2014 Kaiser Survey of Low-Income Americans and the ACA. | ||
| Appendix Table D: Affordability of Health Care Costs and Financial Security Among Nonelderly Insured Hispanic Adults by Language | ||
| English | Spanish | |
| Affordability of Health Care Costs | ||
| Confident can Afford Usual Medical Costs | 80% | 39%* |
| Not Confident can Afford Usual Medical Costs | 19% | 60%* |
| Confident can Afford Major Medical Costs | 60% | 20%* |
| Not Confident can Afford Major Medical Costs | 38% | 79% |
| Worry Over Health Care Costs has Major Effect on Job, Family, or Sleep | 9% | 34%* |
| Paying Premium Very/Somewhat Difficult (Among those Paying a Premium) | 26 | 48%* |
| Did Not Have Premium | 35% | 52%* |
| Medical Bill Outcomes | ||
| Has Outstanding Medical Bills | 18% | 17% |
| Any Problem Paying Medical Bills | 11% | 17% |
| Problem with Medical Bills Led to Using Up Savings | 6% | 9% |
| Problem with Medical Bills Led to Difficulty Paying for Basic Necessities | 5% | 8% |
| Problem with Medical Bills Led Borrowing Money | 3% | — |
| Problem with Medical Bills Led to Being Sent to Collections | 5% | — |
| Medical Bills Caused Financial Strain | 8% | 15% |
| Financial Security | ||
| Financially Insecure | 24% | 43% * |
| Somewhat/Very Difficult to Pay for Necessities | 31% | 62% * |
| Somewhat/Very Difficult to Save Money | 55% | 76% * |
| Somewhat/Very Difficult to Pay off Debt | 43% | 59% * |
| NOTE: English group includes Hispanics who completed the survey in English; Spanish group includes Hispanics who completed the survey in Spanish and indicated that they do not speak English well. * Indicates statistically significant difference from English-speakers at p<0.05 level. SOURCE: 2014 Kaiser Survey of Low-Income Americans and the ACA. | ||
Endnotes
- “Jie Zong and Jeanne Batalova, The Limited English Proficient Population in the United States (Migration Policy Institute, July 2015), http://www.migrationpolicy.org/article/limited-english-proficient-population-united-states/. ↩︎
- Kaiser Commission on Medicaid and the Uninsured, Overview of Health Coverage for Individuals with Limited English Proficiency (Washington, DC: Kaiser Commission on Medicaid and the Uninsured, June 2012), https://modern.kff.org/disparities-policy/fact-sheet/overview-of-health-coverage-for-individuals-with/ ↩︎
- Ibid. ↩︎
- People who opted to take the survey in Spanish were asked “Would you say you can carry on a conversation in English (both understanding and speaking)—very well, pretty well, just a little, or not at all?” Those who responded saying “just a little” or “not at all” are classified as not speaking English well. ↩︎