No Limit: Medicare Part D Enrollees Exposed to High Out-of-Pocket Drug Costs Without a Hard Cap on Spending
Key Findings
Note: A newer version of this analysis with 2017 data is available here.
Since 2006, the Medicare Part D prescription drug benefit has helped improve the affordability of medications for people with Medicare. Yet even with Part D, enrollees can face relatively high out-of-pocket costs because there is no hard cap on out-of-pocket spending under Part D. Enrollees are required to pay up to 5 percent of their drug costs above the catastrophic coverage threshold, unless they receive low-income subsidies that help pay Part D premiums and cost sharing. For high-priced medications, this relatively small coinsurance rate can translate into significant out-of-pocket costs. This analysis examines out-of-pocket prescription drug spending among Medicare Part D enrollees with costs above the catastrophic coverage threshold.
1 million #Medicare #PartD enrollees had high out-of-pocket #prescriptiondrug costs in 2015.
Key Findings
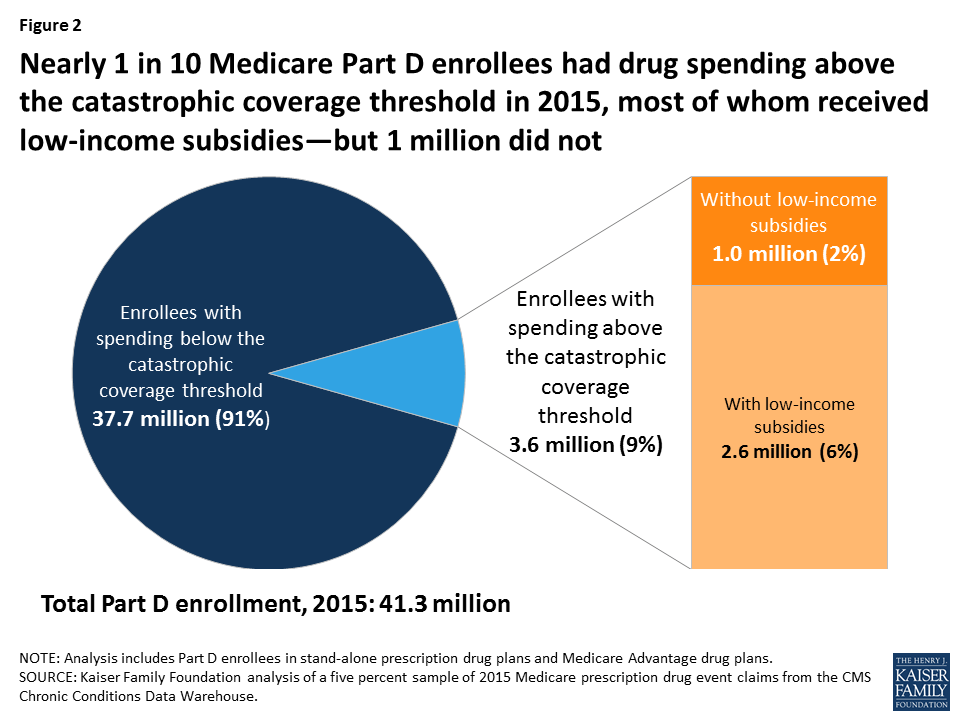
- In 2015, 3.6 million Medicare Part D enrollees had total drug spending above the catastrophic coverage threshold. Of this total, 2.6 million enrollees received low-income subsidies, but 1 million enrollees did not, and incurred out-of-pocket drug spending above the catastrophic threshold.
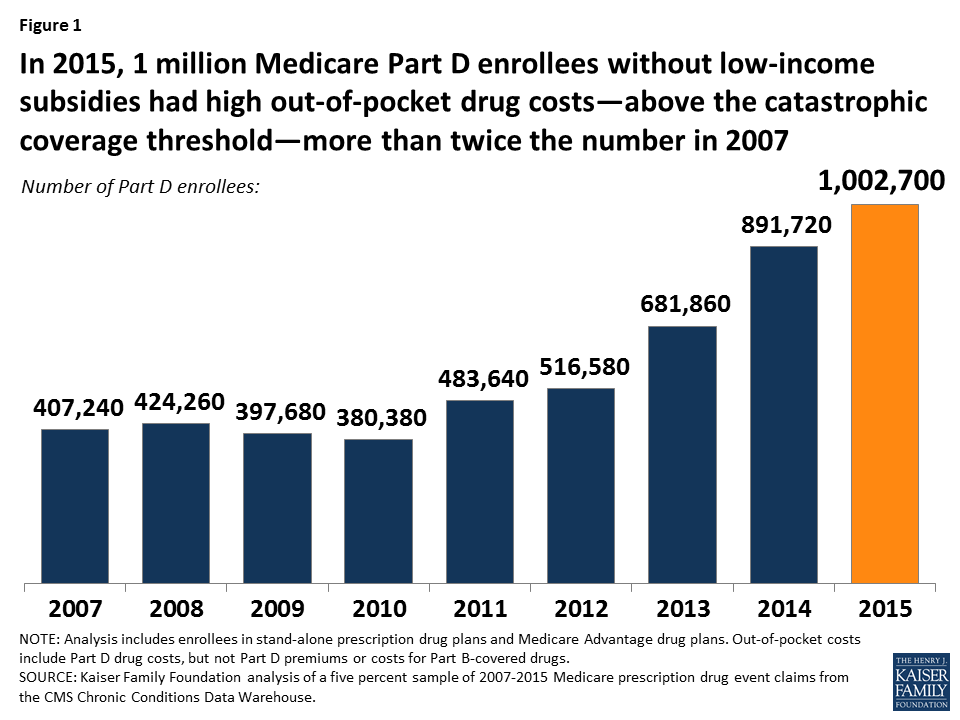
- Between 2007 and 2015, the number of Part D enrollees without low-income subsidies who had spending above the catastrophic threshold more than doubled (Figure 1).
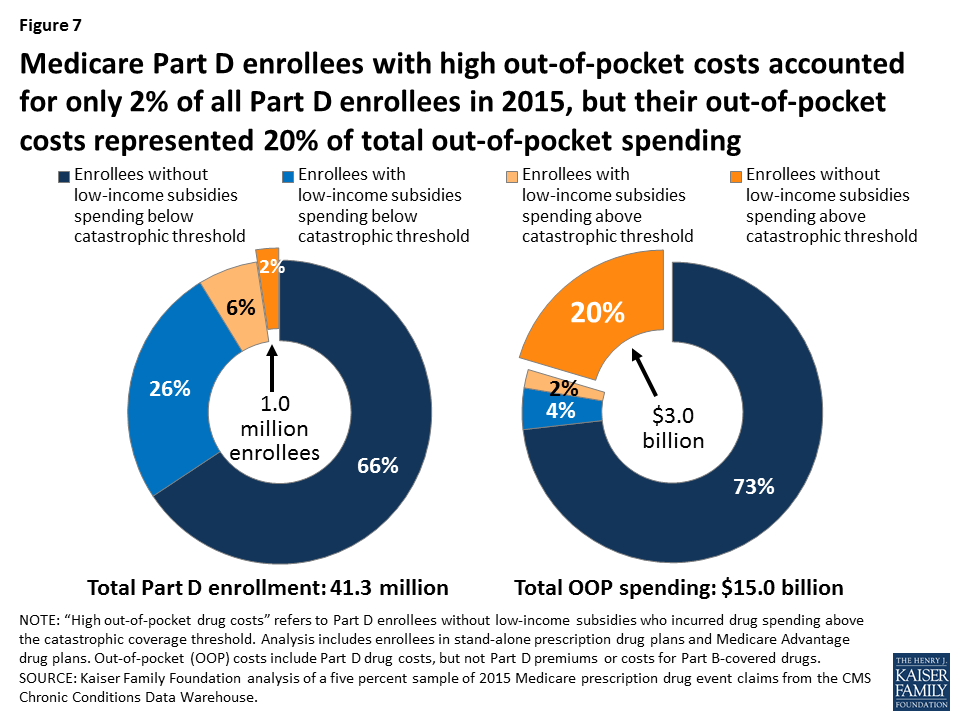
- Part D enrollees with out-of-pocket costs above the catastrophic threshold comprised just 2 percent of all enrollees but 20 percent ($3 billion) of enrollees’ total out-of-pocket drug spending ($15 billion) in 2015.
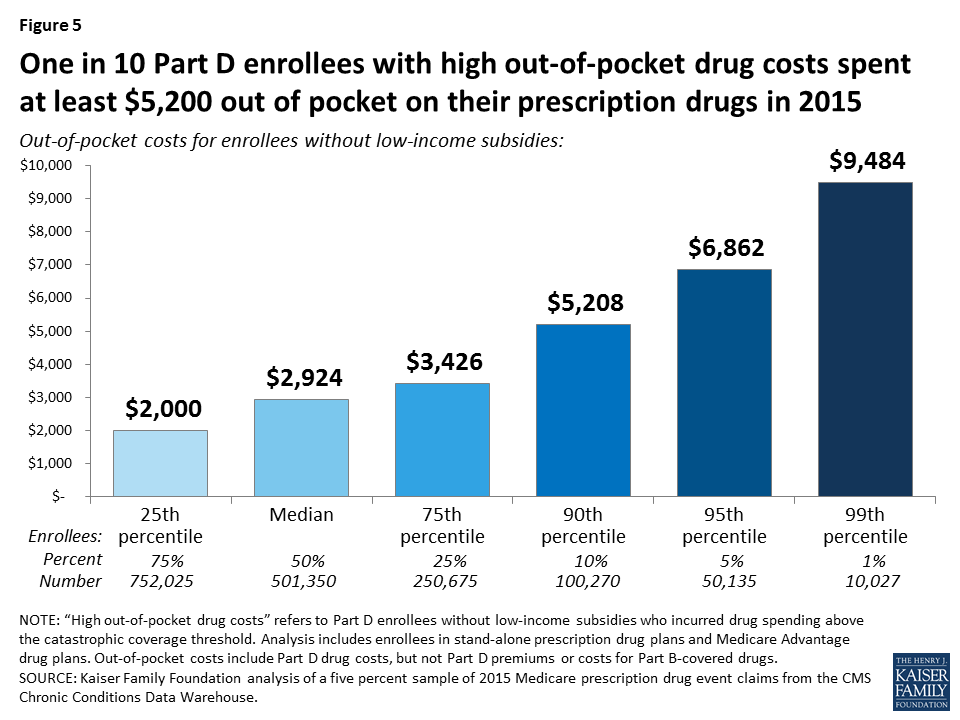
- The one million Part D enrollees with out-of-pocket costs above the catastrophic threshold spent more than $3,000 out of pocket on their prescriptions in 2015, on average; 1 in 10 of them spent at least $5,200. In total, they spent $1.2 billion out of pocket above the catastrophic threshold, or $1,215 per person.
- Harvoni and Sovaldi, treatments for hepatitis C, topped the list of the 10 most costly drugs used by Part D enrollees with high out-of-pocket drug costs in 2015.
- Among Part D enrollees in stand-alone Medicare drug plans without low-income subsidies, those with HIV/AIDS, multiple sclerosis, viral hepatitis, leukemia/lymphoma, and schizophrenia were more likely than those with other conditions to have out-of-pocket spending above the catastrophic threshold in 2015.
- Average out-of-pocket costs by Part D enrollees with spending above the catastrophic threshold declined substantially between 2010 and 2011, due to the Affordable Care Act provisions that took effect in 2011 to close the coverage gap and provide a 50 percent manufacturer discount for brand drugs, the value of which counts as out-of-pocket spending. Since 2013, however, average out-of-pocket spending among this group has increased due in part to the growing availability and use of high-priced drugs.
Issue Brief
Introduction
Prescription drugs play an important role in medical care for 59 million seniors and people with disabilities. Medicare beneficiaries have access to outpatient prescription drug coverage through the Part D prescription drug benefit, which is administered by private stand-alone prescription drug plans (PDPs) and Medicare Advantage drug plans (MA-PDs). Since the start of the Medicare Part D program in 2006, the drug benefit has helped to lower out-of-pocket drug spending for all enrollees. Beneficiaries in Part D plans with low incomes and modest assets are eligible for additional assistance with plan premiums and cost sharing through the Low-Income Subsidy (LIS) program, reducing out-of-pocket costs even further for this population.
The Centers for Medicare & Medicaid Services (CMS) establishes guidelines that all Part D plans must follow for the design of the drug benefit and the value of coverage that must be offered. Plans are allowed to vary, however, along dimensions that affect beneficiaries’ access to and costs for medications, including which drugs are covered and cost-sharing requirements. The standard Part D benefit in 2017 includes a deductible ($400), followed by 25 percent coinsurance for prescriptions up to an initial coverage limit ($3,700 in total costs), and then a coverage gap where enrollees without low-income subsidies pay a larger share of their drug costs until their out-of-pocket drug spending exceeds a catastrophic coverage threshold ($4,950). The Affordable Care Act (ACA) included a provision to phase out the Part D coverage gap by requiring plans to cover a growing share of total drug costs and providing a manufacturer price discount of 50 percent for brand-name drugs filled in the gap, with the amount of the manufacturer discount counting towards the out-of-pocket threshold that triggers catastrophic coverage. Once enrollees’ drug spending reaches the catastrophic threshold, those without the LIS pay up to 5 percent of their total drug costs; those who qualify for the full low-income subsidy pay nothing for their drugs in this phase of the benefit. Plans typically place drugs that cost over $670 per month on a specialty drug tier, with coinsurance that ranges from 25 percent to 33 percent.
Concern has been rising in recent years about the growing cost burden on Medicare and beneficiaries posed by new, unique, and expensive specialty drugs used to treat a range of diseases. The Medicare Boards of Trustees and the Medicare Payment Advisory Commission have documented this rising cost burden on the Medicare program, which is reflected in higher Part D program spending overall, as well as higher spending for reinsurance of high-cost Part D enrollees who reach the catastrophic coverage phase of the benefit, where Medicare pays for 80 percent of drug costs. Although Part D provides coverage of catastrophic drug expenses, enrollees who do not receive the LIS are still responsible for up to 5 percent of their drug costs in this phase of the benefit. For very high-priced medications, this relatively small coinsurance rate can translate to a significant amount of out-of-pocket costs for beneficiaries who do not receive low-income subsidies.
This analysis examines the out-of-pocket prescription drug cost burden for Medicare beneficiaries in Part D plans who do not receive low-income subsidies, focusing on those enrollees who have drug costs that exceed the catastrophic coverage threshold. We refer to this group as Part D enrollees with high out-of-pocket drug costs. Although these enrollees do not comprise the entire group of enrollees who have high total drug spending that exceeds the catastrophic coverage threshold, they are exposed to a potentially large cost burden because they do not receive the financial protection of the low-income subsidies. We analyze Medicare prescription drug event claims data for 2015, the most recent year of publicly available Medicare claims data, and trends since 2007, the first full year of the Part D drug benefit. For detail on the data and methods, see the Methodology.
Findings
Who Are Medicare Part D Enrollees with High Out-of-Pocket Drug Costs?
- In 2015, 3.6 million Medicare Part D enrollees had total drug spending above the catastrophic coverage threshold, which equaled $7,062 in total drug costs that year. This equals 9 percent of the 41.3 million Medicare beneficiaries enrolled in Part D plans in 2015. Of this total, 2.6 million enrollees (72 percent) received low-income subsidies (LIS) to help pay their Part D plan premiums and cost sharing, but 1 million enrollees (28 percent) did not receive these additional subsidies and were therefore not protected against having high out-of-pocket drug costs (Figure 2).
- The characteristics of Medicare Part D enrollees with high out-of-pocket drug costs—defined here as enrollees without low-income subsidies who had out-of-pocket drug spending above the catastrophic coverage threshold—are somewhat similar to the overall population of Part D enrollees: predominantly white non-Hispanic, and age 65 and older (Table 1). (Although not a focus of this analysis, the characteristics of Part D enrollees with low-income subsidies who had spending above the catastrophic threshold vary from those of beneficiaries without the LIS.)
Out-of-Pocket Spending by Medicare Part D Enrollees with High Out-of-Pocket Drug Costs
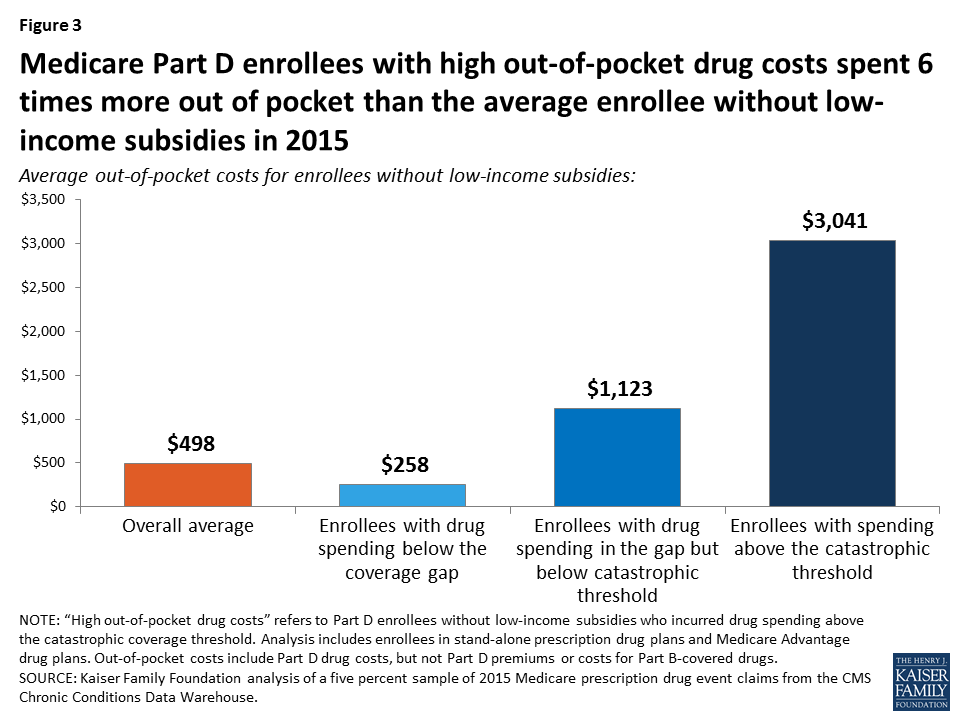
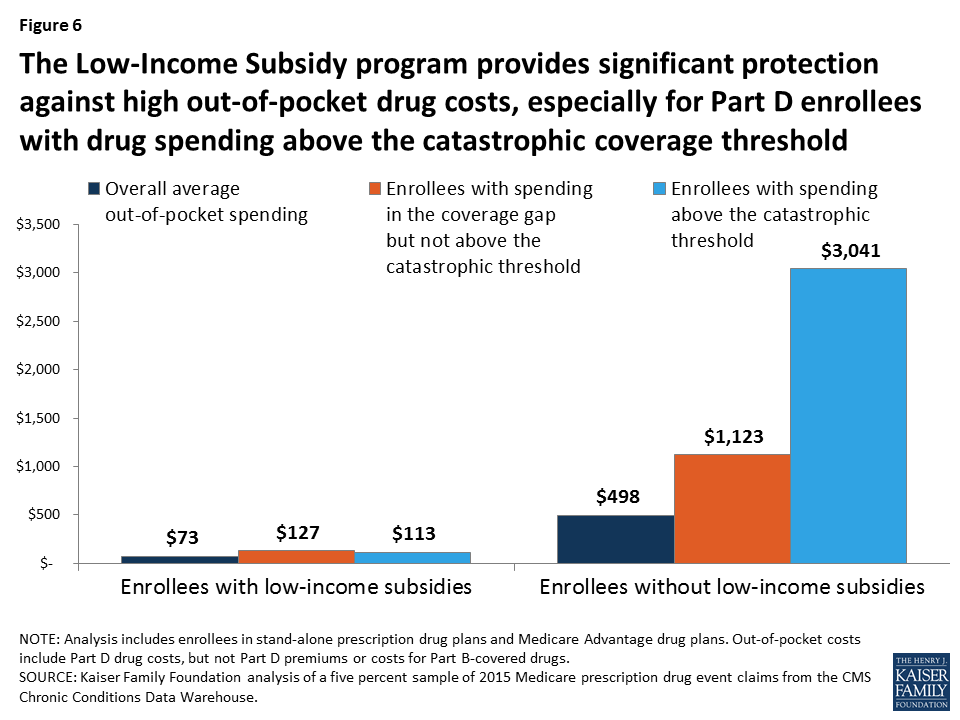
- On average, Part D enrollees with high out-of-pocket drug costs spent $3,041 for prescriptions in 2015 (Figure 3). This is six times more than average out-of-pocket spending by enrollees without the LIS overall ($498) and nearly three times more than out-of-pocket spending by enrollees without the LIS who had spending in the coverage gap but not above the catastrophic threshold ($1,123). Enrollees without the LIS who did not have spending high enough to reach the coverage gap in 2015 spent $258 out of pocket.
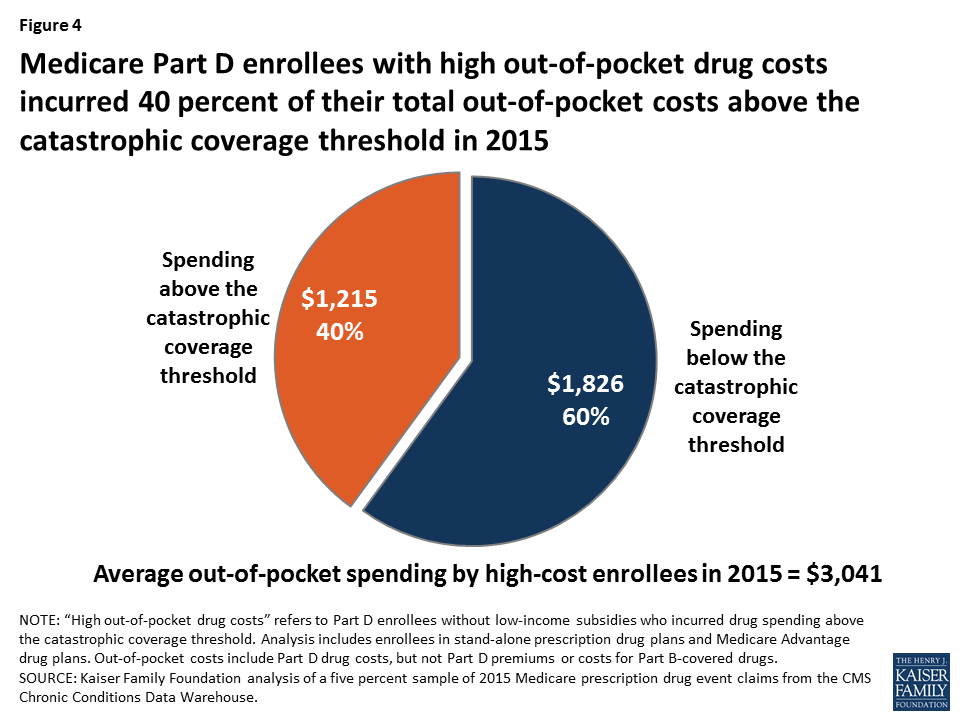
- Of their total out-of-pocket costs, Part D enrollees with high out-of-pocket costs spent $1,826, on average, below the catastrophic coverage threshold (60 percent) and $1,215 (40 percent) above the catastrophic coverage threshold in 2015 (Figure 4). In the aggregate, Part D enrollees with high out-of-pocket costs spent $1.2 billion on their prescription drug costs above the catastrophic coverage threshold in 2015.
- Some Part D enrollees with high out-of-pocket drug costs spent significantly more than the average. One in 10 of these beneficiaries spent at least $5,200 out of pocket on their prescription drugs in 2015 (Figure 5).
- Part D enrollees who received low-income subsidies in 2015 spent significantly less out of pocket than those without the subsidies. Those with the LIS who reached the catastrophic coverage threshold (incurring total drug spending above $7,062 in 2015) spent $113 out of pocket in 2015, while average out-of-pocket drug spending was $73 among low-income subsidy enrollees overall (Figure 6).
- A disproportionate share of aggregate out-of-pocket drug spending by all Medicare beneficiaries enrolled in Part D is accounted for by enrollees without low-income subsidies who face high out-of-pocket costs (above the catastrophic coverage threshold). In 2015, beneficiaries in Part D plans spent a total of $15 billion out of pocket on prescription drugs. Part D enrollees with high out-of-pocket drug costs accounted for 20 percent of aggregate out-of-pocket drug spending by all enrollees ($3 billion), even though they comprised just 2 percent of all Part D enrollees (Figure 7).
Chronic Conditions among Medicare Part D PDP Enrollees with High Out-of-pocket Drug Costs
- The chronic conditions that were most prevalent among stand-alone PDP enrollees with high out-of-pocket drug costs in 2015 were similar to the conditions most prevalent among PDP enrollees without low-income subsidies overall, although the prevalence rates were higher among those with high out-of-pocket costs. In 2015, the top 3 most common chronic conditions among PDP enrollees with high out-of-pocket drug costs (and PDP enrollees overall without the LIS) were hypertension, hyperlipidemia, and diabetes. The prevalence of these conditions among PDP enrollees with high out-of-pocket drug costs was 70 percent, 60 percent, and 48 percent, respectively (Table 2).
- PDP enrollees without low-income subsidies who had certain conditions were more likely than others to have high out-of-pocket drug costs in 2015, including 79 percent of those with HIV/AIDS, 35 percent of those with multiple sclerosis, 24 percent of those with viral hepatitis, 11 percent of those with leukemia and lymphoma, and 11 percent of those with schizophrenia (Table 3). For PDP enrollees with other conditions, the share of those with high out-of-pocket drug costs was 10 percent or less.
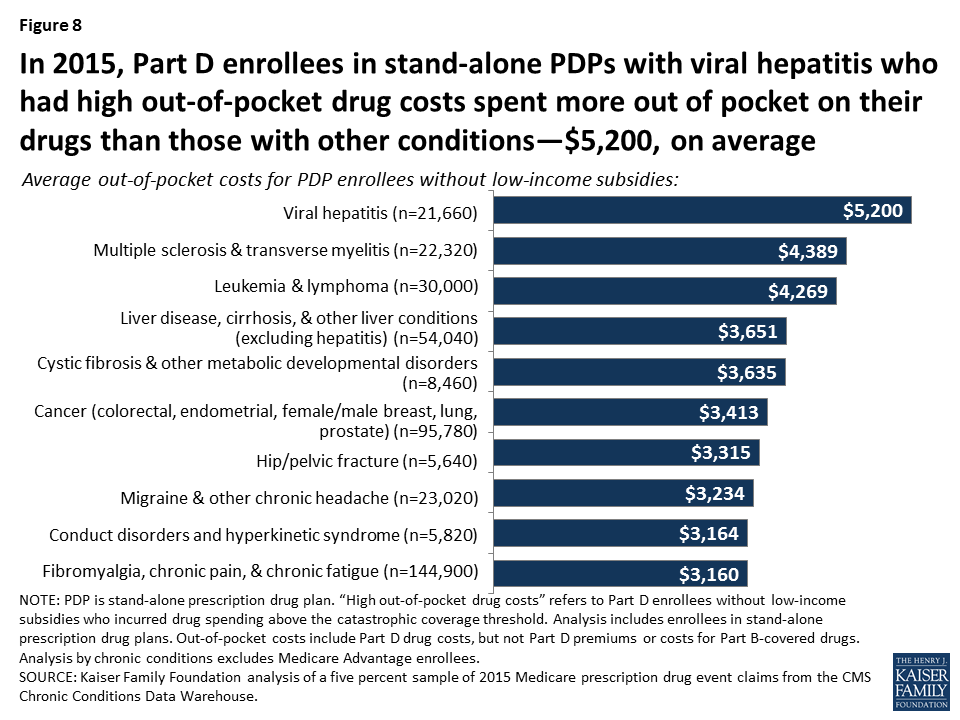
- Among PDP enrollees with high out-of-pocket drug costs, those with viral hepatitis incurred the highest average out-of-pocket drug spending in 2015 ($5,200), followed by those with multiple sclerosis ($4,389), and those with leukemia and lymphoma ($4,269) (Figure 8).
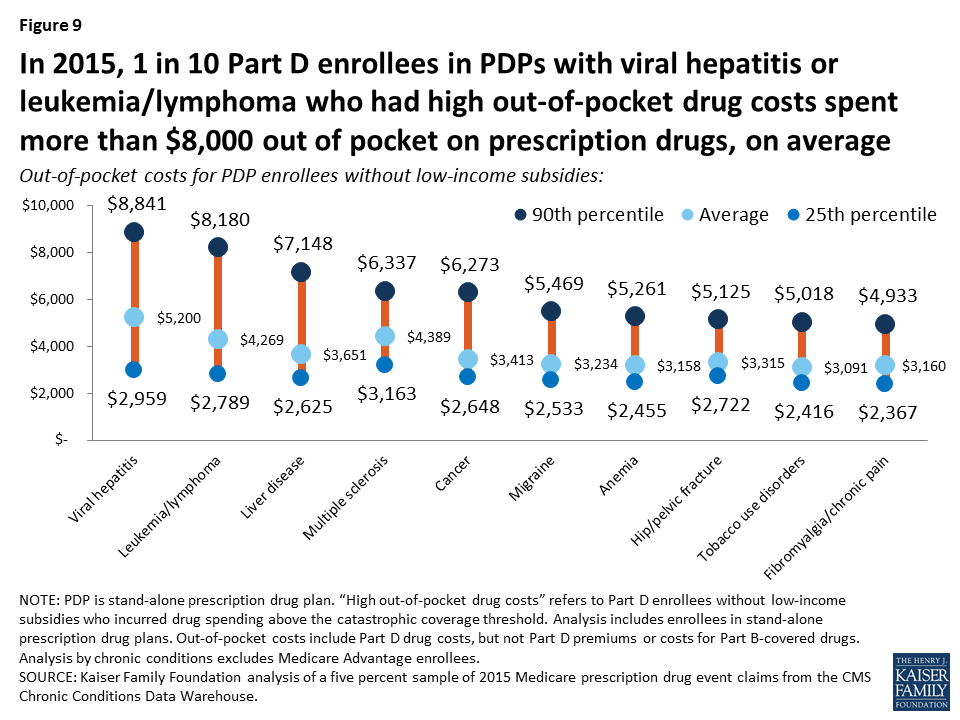
- One in 10 PDP enrollees with high out-of-pocket drug costs who had viral hepatitis or leukemia and lymphoma spent more than $8,000 out of pocket on prescription drugs in 2015, while 10 percent of those with liver disease spent more than $7,000, and 10 percent of those with multiple sclerosis or cancer spent more than $6,000 out of pocket, on average (Figure 9).
Use of Specific Expensive Drugs by Medicare Part D Enrollees with High Out-of-pocket Drug costs
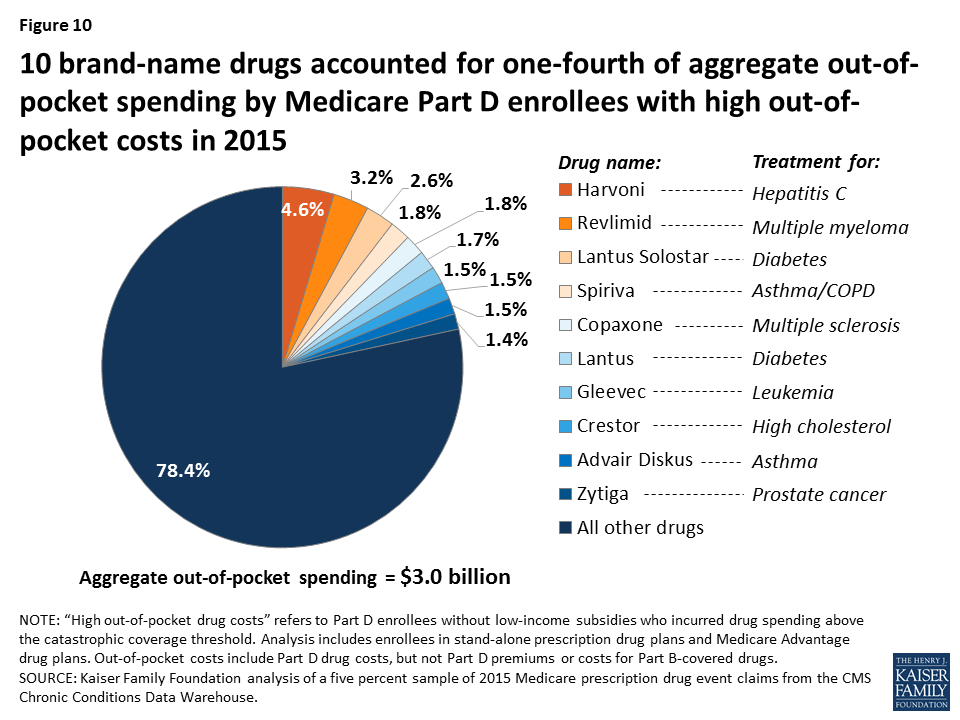
- Ten brand-name drugs accounted for more than 20 percent of the $3 billion in aggregate out-of-pocket spending by Part D enrollees with high out-of-pocket drug costs in 2015 (Figure 10). One drug alone—Harvoni, a treatment for hepatitis C—accounted for nearly 5 percent of total costs among the high-spending population without the LIS in 2015, while the top three drugs—Harvoni, Revlimid (a treatment for multiple sclerosis), and Lantus Solostar (a diabetes drug)—accounted for 10 percent.
- Sovaldi and Harvoni, breakthrough hepatitis C treatments first available in 2013 and 2014, respectively, were the two most expensive drugs, in terms of average per capita out-of-pocket spending, for Part D enrollees with high out-of-pocket costs, and those who used one or the other drug also incurred the highest total out-of-pocket drug costs in 2015, including their out-of-pocket costs for the hepatitis C drug plus their out-of-pocket costs for all the other drugs they used in 2015.
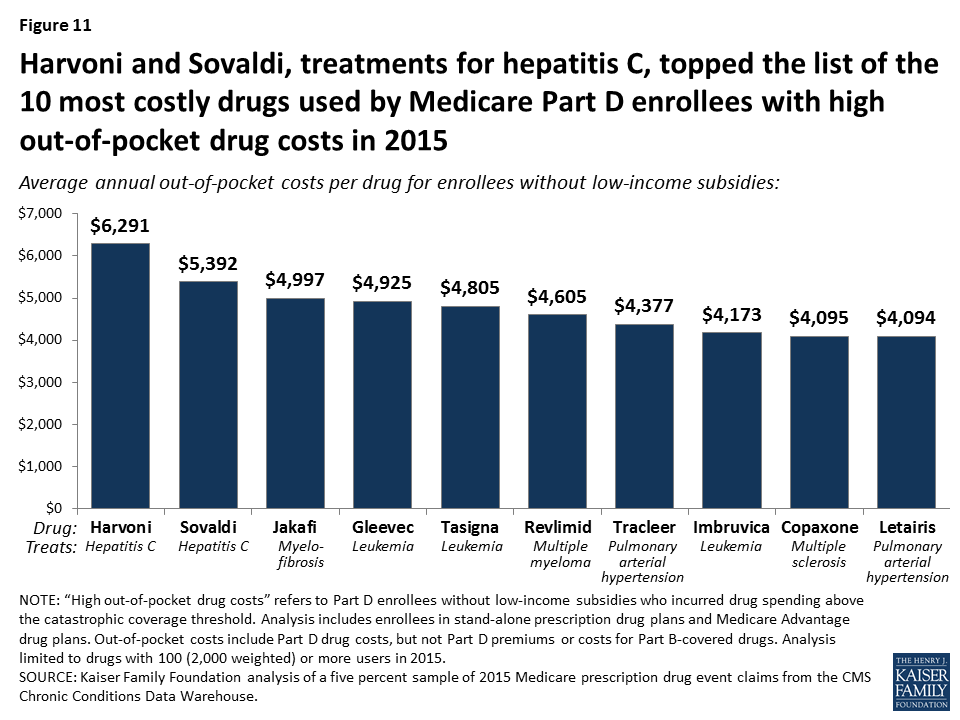
- For the individual drugs taken by Part D enrollees with high out-of-pocket costs in 2015, the highest average per capita out-of-pocket costs were for Harvoni and Sovaldi, (Figure 11). On average, enrollees who faced high out-of-pocket drug costs in 2015 spent $6,291 for Harvoni and $5,392 for Sovaldi. Rounding out the top five were three drugs to treat different types of cancer: Jakavi ($4,997), Gleevec ($4,925), and Tasigna ($4,805).
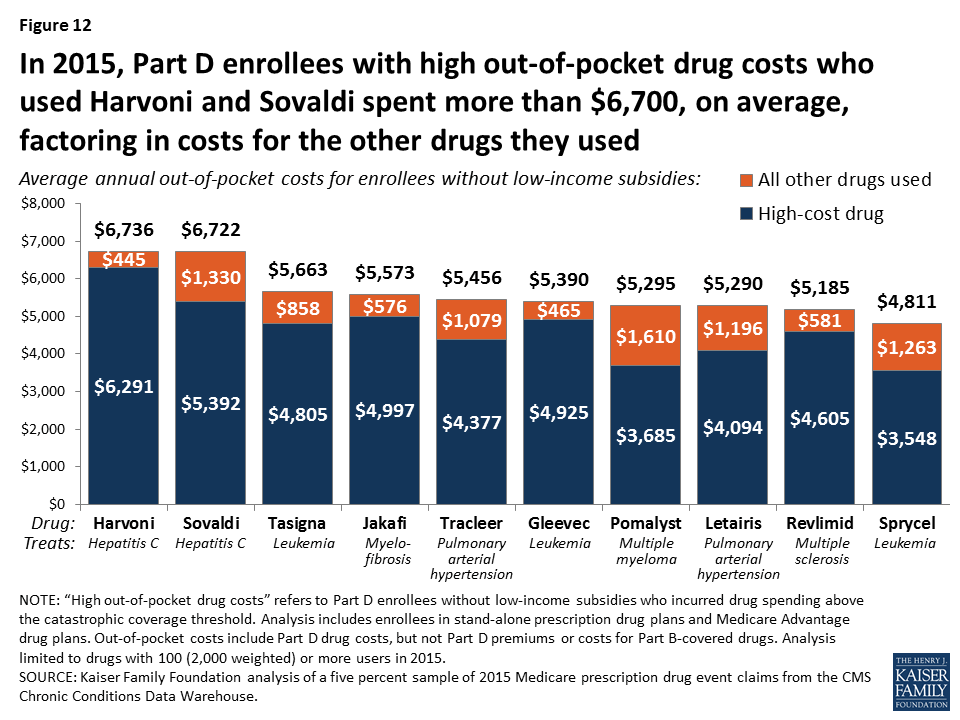
- Including their out-of-pocket costs for all of the drugs they used in 2015, Part D enrollees with high out-of-pocket costs who used Harvoni spent a total of $6,736 out of pocket, on average, including $6,291 for Harvoni alone plus an additional $445 on other drugs they used in 2015 (Figure 12). Those who used Sovaldi spent a total of $6,722 on average, including $5,392 for Sovaldi plus $1,330 for other drugs they used.
Trends Related to Medicare Part D Enrollees with High Out-of-Pocket Drug Costs
- The number of Part D enrollees who face high out-of-pocket drug costs more than doubled between 2007 and 2015, from 0.4 million to 1.0 million; their share of all non-LIS enrollees increased somewhat from 2.7 percent in 2007 (0.4 million out of 15.3 million) to 3.6 percent in 2015 (1.0 million out of 28.1 million) (Figure 13). This increase is due in part to the ACA coverage gap changes that took effect in 2011, including counting the value of the manufacturer discount as out-of-pocket spending, as well as to the increased availability and use of higher-priced drugs.

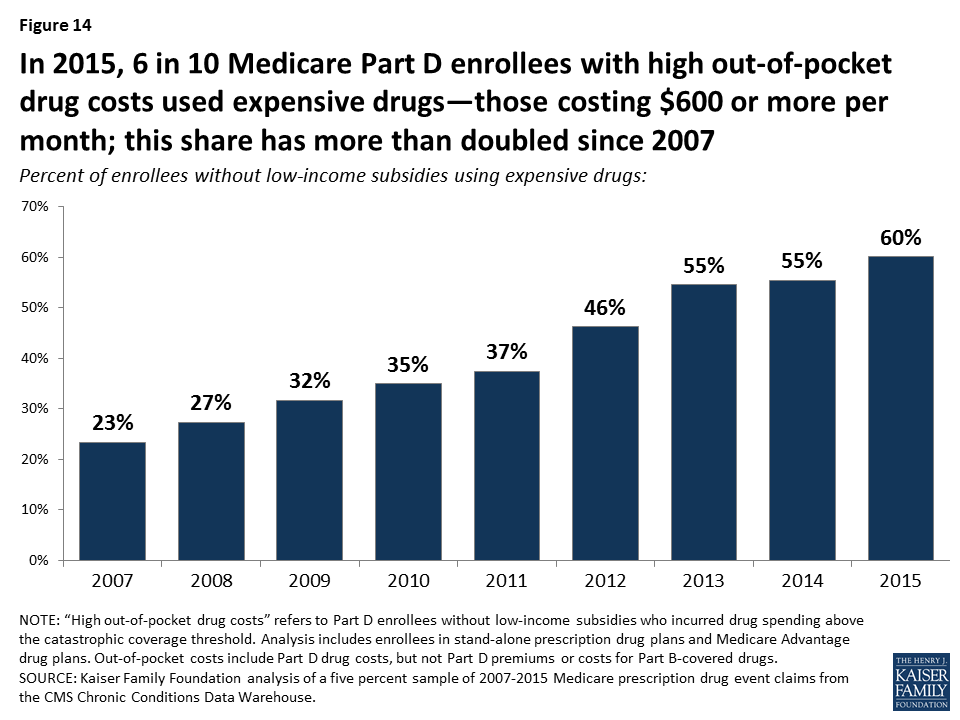
- The share of Part D enrollees with high out-of-pocket drug costs who used expensive drugs—those costing $600 or more per month—more than doubled between 2007 and 2015, from 23 percent to 60 percent (Figure 14).
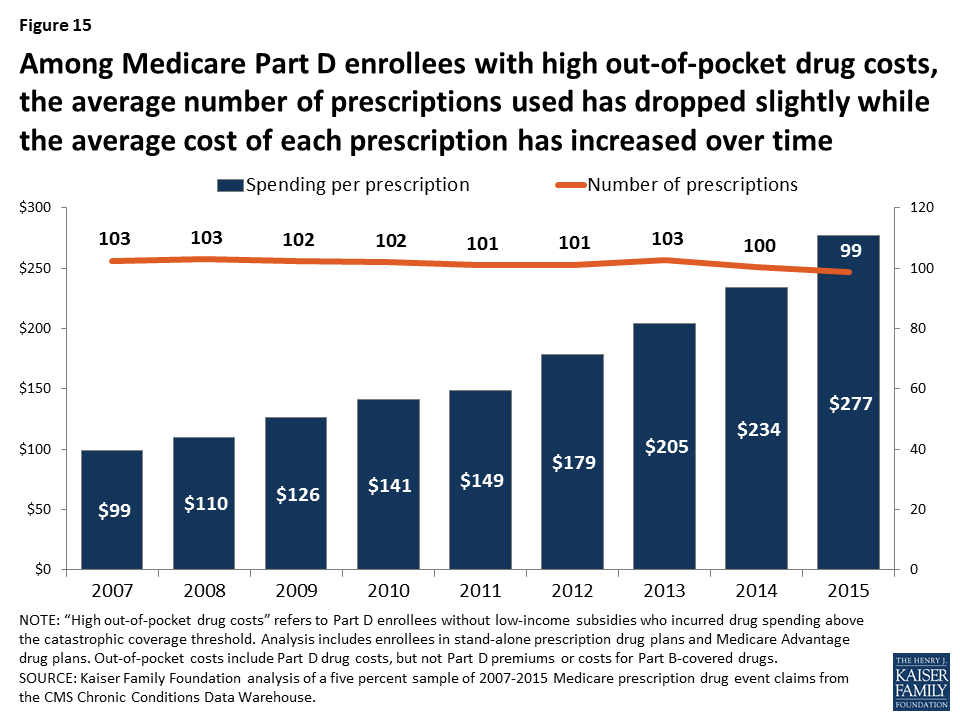
- The trend of greater use of more expensive drugs is reflected in an increase in the average total cost per prescription for Part D enrollees with high out-of-pocket drug costs, which increased from $99 per prescription in 2007 to $277 in 2015 (Figure 15). Between 2007 and 2015, the average annual per capita number of prescriptions filled by this group decreased slightly from 103 to 99.
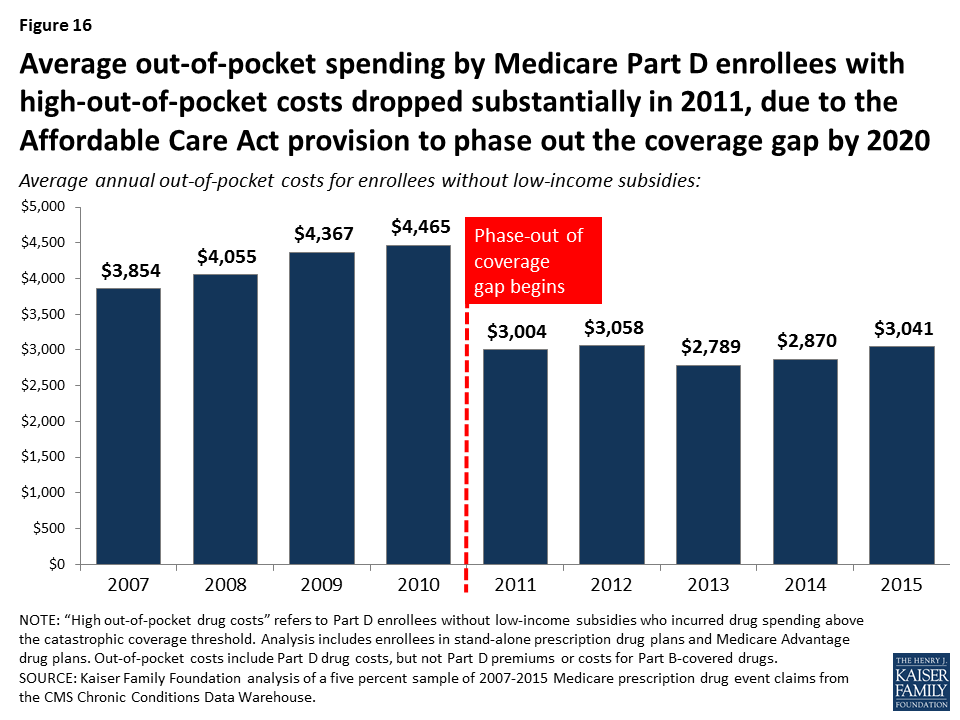
- With the ACA provisions to phase out the coverage gap taking effect in 2011, average out-of-pocket spending by Part D enrollees who incur high out-of-pocket costs is lower in 2015 than it was in 2010, before the gap coverage phase-out began (Figure 16). The first-year effect of the ACA changes was a substantial reduction in spending by Part D enrollees who incurred high out-of-pocket drug costs, after increasing every year between 2007 and 2010. But this trend has reversed in recent years.
- Between 2007 and 2010, average spending by Part D enrollees with high out-of-pocket drug costs increased each year, in keeping with the annual increases in the out-of-pocket threshold that triggered catastrophic coverage. Enrollees who incurred high out-of-pocket costs spent 16 percent more out of pocket, on average, in 2010 ($4,465) than in 2007 ($3,854). But between 2010 and 2011, the average declined 33 percent to $3,004 as the ACA coverage gap phase-out began.
- Between 2013 and 2015, average out-of-pocket spending by Part D enrollees with high out-of-pocket drug costs increased by 9 percent, from $2,789 to $3,041, in conjunction with the introduction of new high-costs drugs, including breakthrough treatments for hepatitis C.
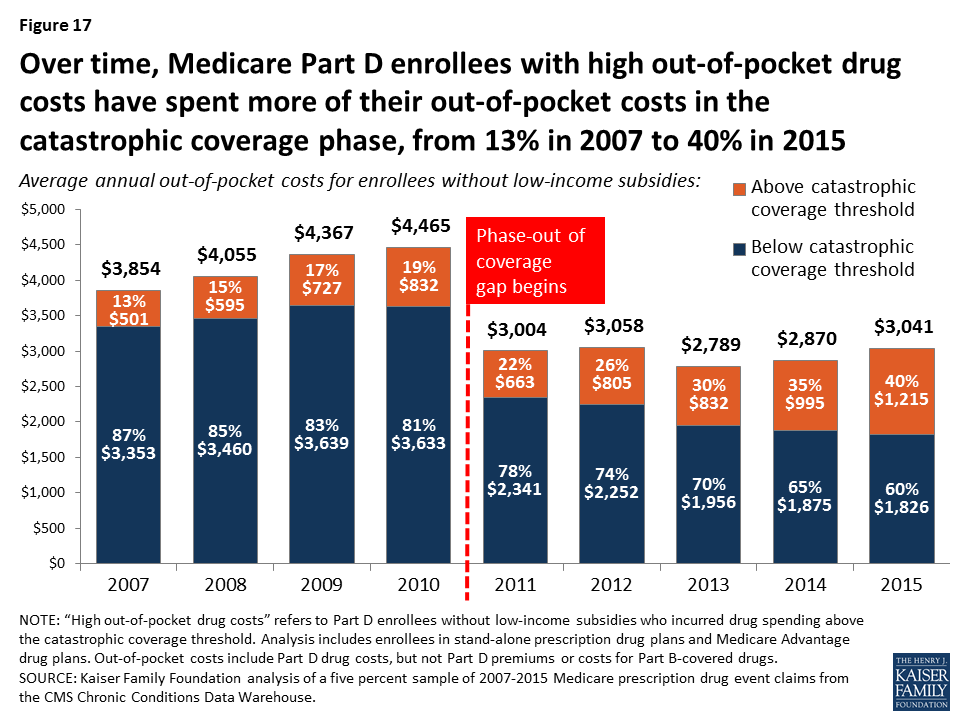
- Over time, the share of out-of-pocket spending in the catastrophic coverage phase among Part D enrollees facing high out-of-pocket costs has increased: it was 13 percent in 2007, 30 percent in 2013, and 40 percent in 2015 (Figure 17).
Discussion
In recent years, the high and rising cost of prescription drugs has emerged as a pressing issue for consumers, public programs, and private insurers. As our analysis shows, Medicare beneficiaries who do not receive the additional financial protection provided by low-income subsidies are not insulated from this cost burden and can incur substantial out-of-pocket costs for their medications. We find that one million Medicare beneficiaries in Part D plans who were not receiving low-income subsidies had high out-of-pocket costs in 2015—that is, drug spending above the catastrophic coverage threshold—and their annual out-of-pocket spending averaged over $3,000 in 2015.
Our analysis indicates that out-of-pocket costs above the catastrophic threshold represent a growing concern for people with Medicare, and both MedPAC and Medicare’s actuaries have shown that rising spending for catastrophic coverage has placed greater fiscal pressure on Medicare. Our analysis also shows that the number of Part D enrollees who did not receive low-income subsidies and had out-of-pocket spending above the catastrophic threshold has increased over time. Looking to the future, we would expect to see continued increases in the number of enrollees reaching the catastrophic coverage threshold in 2016 and later years, due in part to the ACA changes to the coverage gap as well as the greater availability and use of high-priced drugs. These trends have cost implications both for beneficiaries and, as the Medicare actuaries have projected, for Medicare.
Part D enrollees with high out-of-pocket costs in 2015 spent an average of $1,215 out of pocket on their prescriptions filled above the catastrophic threshold, or $1.2 billion in the aggregate. In other words, Part D enrollees would have collectively saved $1.2 billion if Part D had a hard cap on out-of-pocket spending, rather than requiring enrollees to pay up to 5 percent coinsurance in the catastrophic coverage phase. Placing a hard cap on out-of-pocket spending under Part D would save money for enrollees, but would increase costs to Medicare and would not address underlying concerns related to high-priced drugs.
While Part D has helped make drugs more affordable for people with Medicare, and the ACA has provided additional relief to enrollees with high drug costs by gradually closing the coverage gap, the absence of an annual out-of-pocket spending limit under Part D exposes enrollees to significant costs—unless their incomes and assets are low enough to qualify for low-income subsidies. Various proposals to reduce drug costs—including allowing the federal government to negotiate prices for Medicare beneficiaries, and allowing Americans to import drugs from Canada and other countries—enjoy broad, bipartisan public support. With a growing number of people on Medicare facing high out-of-pocket drug costs, alleviating this burden remains an issue for federal policymakers to address.
Juliette Cubanski, Tricia Neuman, and Kendal Orgera are with the Kaiser Family Foundation. Anthony Damico is an independent consultant.This work was funded in part by the Retirement Research Foundation.
Tables
| Table 1: Characteristics of Medicare Part D Enrollees with Spending Above the Catastrophic Coverage Threshold, by Low-Income Subsidy Enrollment, 2015 | ||||||||
| All Part D enrollees | Enrollees with spending above the catastrophic coverage threshold | |||||||
| Total | Enrollees with the low-income subsidy | Enrollees without the low-income subsidy | ||||||
| Number | Percent of total | Number | Percent of total | Number | Percent of total | Number | Percent of total | |
| Total | 41,278,580 | 100% | 3,619,640 | 100% | 2,616,940 | 100% | 1,002,700 | 100% |
| Gender | ||||||||
| Female | 23,652,440 | 57% | 2,109,320 | 58% | 1,596,300 | 61% | 513,020 | 51% |
| Male | 17,626,140 | 43% | 1,510,320 | 42% | 1,020,640 | 39% | 489,680 | 49% |
| Age | ||||||||
| <65 | 7,090,980 | 17% | 1,463,680 | 40% | 1,331,620 | 51% | 132,060 | 13% |
| 65-69 | 10,162,920 | 25% | 606,880 | 17% | 365,340 | 14% | 241,540 | 24% |
| 70-74 | 8,461,240 | 20% | 545,880 | 15% | 304,440 | 12% | 241,440 | 24% |
| 75-79 | 6,192,700 | 15% | 415,120 | 11% | 242,460 | 9% | 172,660 | 17% |
| 80-84 | 4,393,760 | 11% | 295,000 | 8% | 181,040 | 7% | 113,960 | 11% |
| 85+ | 4,976,980 | 12% | 293,080 | 8% | 192,040 | 7% | 101,040 | 10% |
| Race/ethnicity | ||||||||
| White non-Hispanic | 30,932,840 | 75% | 2,450,240 | 68% | 1,581,740 | 60% | 868,500 | 87% |
| Black non-Hispanic | 4,593,300 | 11% | 558,440 | 15% | 495,860 | 19% | 62,580 | 6% |
| Hispanic | 3,463,640 | 8% | 385,820 | 11% | 353,040 | 13% | 32,780 | 3% |
| Asian/Pacific Islander | 1,362,340 | 3% | 146,840 | 4% | 131,380 | 5% | 15,460 | 2% |
| Other/unknown | 926,460 | 2% | 78,300 | 2% | 54,920 | 2% | 23,380 | 2% |
| Residence | ||||||||
| Nursing home/ facility resident | 2,567,880 | 6% | 578,420 | 16% | 516,940 | 20% | 61,480 | 6% |
| Non-facility resident | 38,710,700 | 94% | 3,041,220 | 84% | 2,100,000 | 80% | 941,220 | 94% |
| NOTE: Analysis includes enrollees in stand-alone prescription drug plans and Medicare Advantage drug plans. Out-of-pocket costs include Part D drug costs, but not Part D premiums or costs for Part B-covered drugs. Numbers may not sum to totals due to rounding.SOURCE: Kaiser Family Foundation analysis of a five percent sample of 2015 Medicare prescription drug event claims from the CMS Chronic Conditions Data Warehouse. | ||||||||
| Table 2: Top 20 Most Prevalent Chronic Conditions among Medicare Part D Enrollees in Stand-alone Prescription Drug Plans with High Out-of-Pocket Drug Costs, 2015 | ||||||
| All Medicare Part D enrollees in PDPs without the low-income subsidy | Part D enrollees in PDPs with high out-of-pocket drug costs | |||||
| Number | Percent of total | Number | Among PDP enrollees with high out-of-pocket drug costs, % with this disease | Among PDP enrollees with this disease, % with high out-of-pocket drug costs | Average out-of-pocket spending | |
| Total PDP enrollees | 16,710,620 | 100.0% | 708,680 | 100.0% | 4.2% | $2,995 |
| Hypertension | 9,163,440 | 54.8% | 498,120 | 70.3% | 5.4% | $2,991 |
| Hyperlipidemia | 7,900,800 | 47.3% | 428,660 | 60.5% | 5.4% | $2,925 |
| Diabetes | 4,014,700 | 24.0% | 341,700 | 48.2% | 8.5% | $2,827 |
| Ischemic heart disease | 4,364,120 | 26.1% | 298,080 | 42.1% | 6.8% | $2,940 |
| Rheumatoid arthritis/osteoarthritis | 4,979,740 | 29.8% | 286,580 | 40.4% | 5.8% | $3,017 |
| Anemia | 3,281,360 | 19.6% | 255,800 | 36.1% | 7.8% | $3,158 |
| Chronic kidney disease | 2,714,380 | 16.2% | 244,500 | 34.5% | 9.0% | $2,989 |
| Alzheimer’s disease, related disorders, or senile dementia & depression | 3,012,980 | 18.0% | 216,480 | 30.5% | 7.2% | $3,067 |
| Heart failure | 1,963,400 | 11.7% | 171,220 | 24.2% | 8.7% | $2,971 |
| Depression | 2,218,100 | 13.3% | 168,500 | 23.8% | 7.6% | $3,127 |
| Depressive disorders | 2,077,900 | 12.4% | 164,900 | 23.3% | 7.9% | $3,116 |
| Acquired hypothyroidism | 2,540,920 | 15.2% | 156,580 | 22.1% | 6.2% | $3,036 |
| Obesity | 1,742,780 | 10.4% | 152,580 | 21.5% | 8.8% | $2,849 |
| Fibromyalgia, chronic pain & chronic fatigue | 1,727,700 | 10.3% | 144,900 | 20.4% | 8.4% | $3,160 |
| Chronic obstructive pulmonary disease & bronchiectasis | 1,560,860 | 9.3% | 144,400 | 20.4% | 9.3% | $2,935 |
| Cataract | 3,305,420 | 19.8% | 143,140 | 20.2% | 4.3% | $3,100 |
| Peripheral vascular disease | 1,647,880 | 9.9% | 130,080 | 18.4% | 7.9% | $2,887 |
| Anxiety disorders | 1,831,880 | 11.0% | 127,540 | 18.0% | 7.0% | $3,108 |
| Asthma | 1,139,820 | 6.8% | 115,140 | 16.2% | 10.1% | $2,933 |
| Cancer: Colorectal; endometrial; female or male breast; lung; prostate | 1,485,380 | 8.9% | 95,780 | 13.5% | 6.4% | $3,413 |
| NOTE: PDP is stand-alone prescription drug plan. Analysis by chronic conditions excludes Medicare Advantage enrollees. Analysis includes the top 20 conditions among those chronic conditions included in the Chronic Conditions and Other Chronic or Potentially Disabling Conditions segments of the Medicare Master Beneficiary Summary file. “High out-of-pocket drug costs” refers to Part D enrollees without low-income subsidies who incurred drug spending above the catastrophic coverage threshold. Analysis includes enrollees in stand-alone prescription drug plans. Out-of-pocket costs include Part D drug costs, but not Part D premiums or costs for Part B-covered drugs. Numbers may not sum to totals due to rounding.SOURCE: Kaiser Family Foundation analysis of a five percent sample of 2015 Medicare prescription drug event claims from the CMS Chronic Conditions Data Warehouse. | ||||||
| Table 3: Top 20 Chronic Conditions with the Largest Percent of Medicare Part D Enrollees in Stand-alone Prescription Drug Plans (PDPs) with High Out-of-Pocket Drug Costs, 2015 | ||||||
| All Medicare Part D enrollees in PDPs without the low-income subsidy | Part D enrollees in PDPs with high out-of-pocket drug costs | |||||
| Number | Percent of total | Number | Among PDP enrollees with high out-of-pocket drug costs, % with this disease | Among PDP enrollees with this disease, % with high out-of-pocket drug costs | Average out-of-pocket spending | |
| Total PDP enrollees | 16,710,620 | 100.0% | 708,680 | 100.0% | 4.2% | $2,995 |
| HIV/AIDS | 20,580 | 0.1% | 16,240 | 2.3% | 78.9% | $2,354 |
| Multiple sclerosis & transverse myelitis | 64,480 | 0.4% | 22,320 | 3.1% | 34.6% | $4,389 |
| Viral hepatitis | 90,620 | 0.5% | 21,660 | 3.1% | 23.9% | $5,200 |
| Leukemia & lymphoma | 269,440 | 1.6% | 30,000 | 4.2% | 11.1% | $4,269 |
| Schizophrenia | 55,980 | 0.3% | 5,980 | 0.8% | 10.7% | $2,827 |
| Liver disease, cirrhosis, & other liver conditions (excluding hepatitis) | 516,100 | 3.1% | 54,040 | 7.6% | 10.5% | $3,651 |
| Pressure ulcers & chronic ulcer | 596,680 | 3.6% | 61,400 | 8.7% | 10.3% | $2,991 |
| Asthma | 1,139,820 | 6.8% | 115,140 | 16.2% | 10.1% | $2,933 |
| Cystic fibrosis & other metabolic developmental disorders | 88,980 | 0.5% | 8,460 | 1.2% | 9.5% | $3,635 |
| Bipolar disorder | 248,740 | 1.5% | 23,480 | 3.3% | 9.4% | $3,020 |
| Epilepsy | 219,560 | 1.3% | 20,480 | 2.9% | 9.3% | $3,152 |
| Traumatic brain injury & nonpsychotic mental disorders due to brain damage | 51,080 | 0.3% | 4,760 | 0.7% | 9.3% | $3,125 |
| Chronic obstructive pulmonary disease & bronchiectasis | 1,560,860 | 9.3% | 144,400 | 20.4% | 9.3% | $2,935 |
| Conduct disorders & hyperkinetic syndrome | 63,620 | 0.4% | 5,820 | 0.8% | 9.1% | $3,164 |
| Chronic kidney disease | 2,714,380 | 16.2% | 244,500 | 34.5% | 9.0% | $2,989 |
| Schizophrenia & other psychotic disorders | 277,880 | 1.7% | 24,440 | 3.4% | 8.8% | $3,078 |
| Obesity | 1,742,780 | 10.4% | 152,580 | 21.5% | 8.8% | $2,849 |
| Heart failure | 1,963,400 | 11.7% | 171,220 | 24.2% | 8.7% | $2,971 |
| Spinal cord injury | 43,920 | 0.3% | 3,820 | 0.5% | 8.7% | $3,134 |
| Personality disorders | 58,620 | 0.4% | 5,000 | 0.7% | 8.5% | $3,088 |
| NOTE: PDP is stand-alone prescription drug plan. Analysis by chronic conditions excludes Medicare Advantage enrollees. Analysis includes the top 20 conditions among those chronic conditions included in the Chronic Conditions and Other Chronic or Potentially Disabling Conditions segments of the Medicare Master Beneficiary Summary file. “High out-of-pocket drug costs” refers to Part D enrollees without low-income subsidies who incurred drug spending above the catastrophic coverage threshold. Analysis includes enrollees in stand-alone prescription drug plans. Out-of-pocket costs include Part D drug costs, but not Part D premiums or costs for Part B-covered drugs. Numbers may not sum to totals due to rounding. SOURCE: Kaiser Family Foundation analysis of a five percent sample of 2015 Medicare prescription drug event claims from the CMS Chronic Conditions Data Warehouse. | ||||||
Methodology
This analysis uses data from a five percent sample of Medicare Part D prescription drug event (PDE) claims from the Centers for Medicare & Medicaid Services (CMS) Chronic Conditions Data Warehouse (CCW) for Part D enrollees between 2007 and 2015. The PDE claims data includes all prescription drug events reported by Part D plans for their enrollees in a given calendar year, and includes detailed data on spending for each event, corresponding to a single prescription drug fill, including how much was paid by plans, low-income subsidy amounts, and beneficiary out-of-pocket payments. The claims data includes spending for Part D covered drugs, but does not include spending on Part D plan premiums, Part B covered drugs (which are typically administered in providers’ offices or hospital outpatient settings), or the cost of drugs purchased outside the Part D plan. The CCW data also includes a limited number of demographic variables (gender, age, race/ethnicity) and flags for several chronic conditions (27 common chronic conditions and 35 other chronic or potentially disabling conditions).
We calculated average out-of-pocket spending and percentiles for enrollees overall and by three benefit phases: enrollees with total drug spending below the coverage gap, those with spending in the coverage gap but not above the catastrophic coverage threshold, and those with spending above the catastrophic coverage threshold. Our analysis focuses on beneficiaries enrolled in both stand-alone prescription drug plans (PDPs) and Medicare Advantage prescription drug plans who have high out-of-pocket drug costs, which we define as enrollees who have drug spending that exceeds the catastrophic coverage threshold in a given year who do not receive low-income subsidies (LIS). The catastrophic threshold is updated annually by the annual percentage increase in average expenditures for Part D drugs per eligible beneficiary; in 2015, the threshold amount was $7,062. The 2015 PDE sample includes 2.1 million Part D enrollees (41.3 million weighted), of whom 180,982 (3.6 million weighted) had spending above the catastrophic coverage threshold, including 50,135 (1.0 million weighted) who had high out-of-pocket drug costs and did not receive the LIS. Our analysis of spending by chronic condition includes only those Part D enrollees in stand-alone PDPs because the CCW variables that identify chronic conditions are derived from information in medical claims, which are not reported by Medicare Advantage plans for their enrollees.
Our analysis of specific drugs associated with high out-of-pocket spending was limited to drugs with 100 (2,000 weighted) or more users in 2015 to avoid reporting estimates based on small sample size. There are a small number of drugs that had higher average out-of-pocket costs among Part D enrollees with high out-of-pocket spending than the top drug we report (Harvoni), but the number of users of each of those drugs in the CCW PDE for 2015 was less than 100. Because we cannot report data for these drugs, our analysis of the most expensive drugs among those with high out-of-pocket costs is conservative to the extent that it does not include those drugs with higher out-of-pocket costs but smaller (unreliable) sample sizes. For example, based on the publicly-available CMS 2015 Medicare drug spending data, the drug with the highest out-of-pocket costs among non-LIS enrollees was Cinryze, a C1 esterase inhibitor, with 104 non-LIS users and average out-of-pocket spending of $24,274 in 2015, followed by Berinert, also a C1 esterase inhibitor, with 43 non-LIS users and average out-of-pocket costs of $14,258.