Medicare Part D: A First Look at Plan Offerings in 2016
Part D Plan Availability
In 2016, beneficiaries across the country continue to have a substantial number of Part D plan choices.
- The average beneficiary will have a choice of 26 PDPs in 2016, down from 30 in 2015 and 55 at the peak in 2007 (Figure 1).1 Beneficiaries will also have access to 16 Medicare Advantage prescription drug plans, on average.2
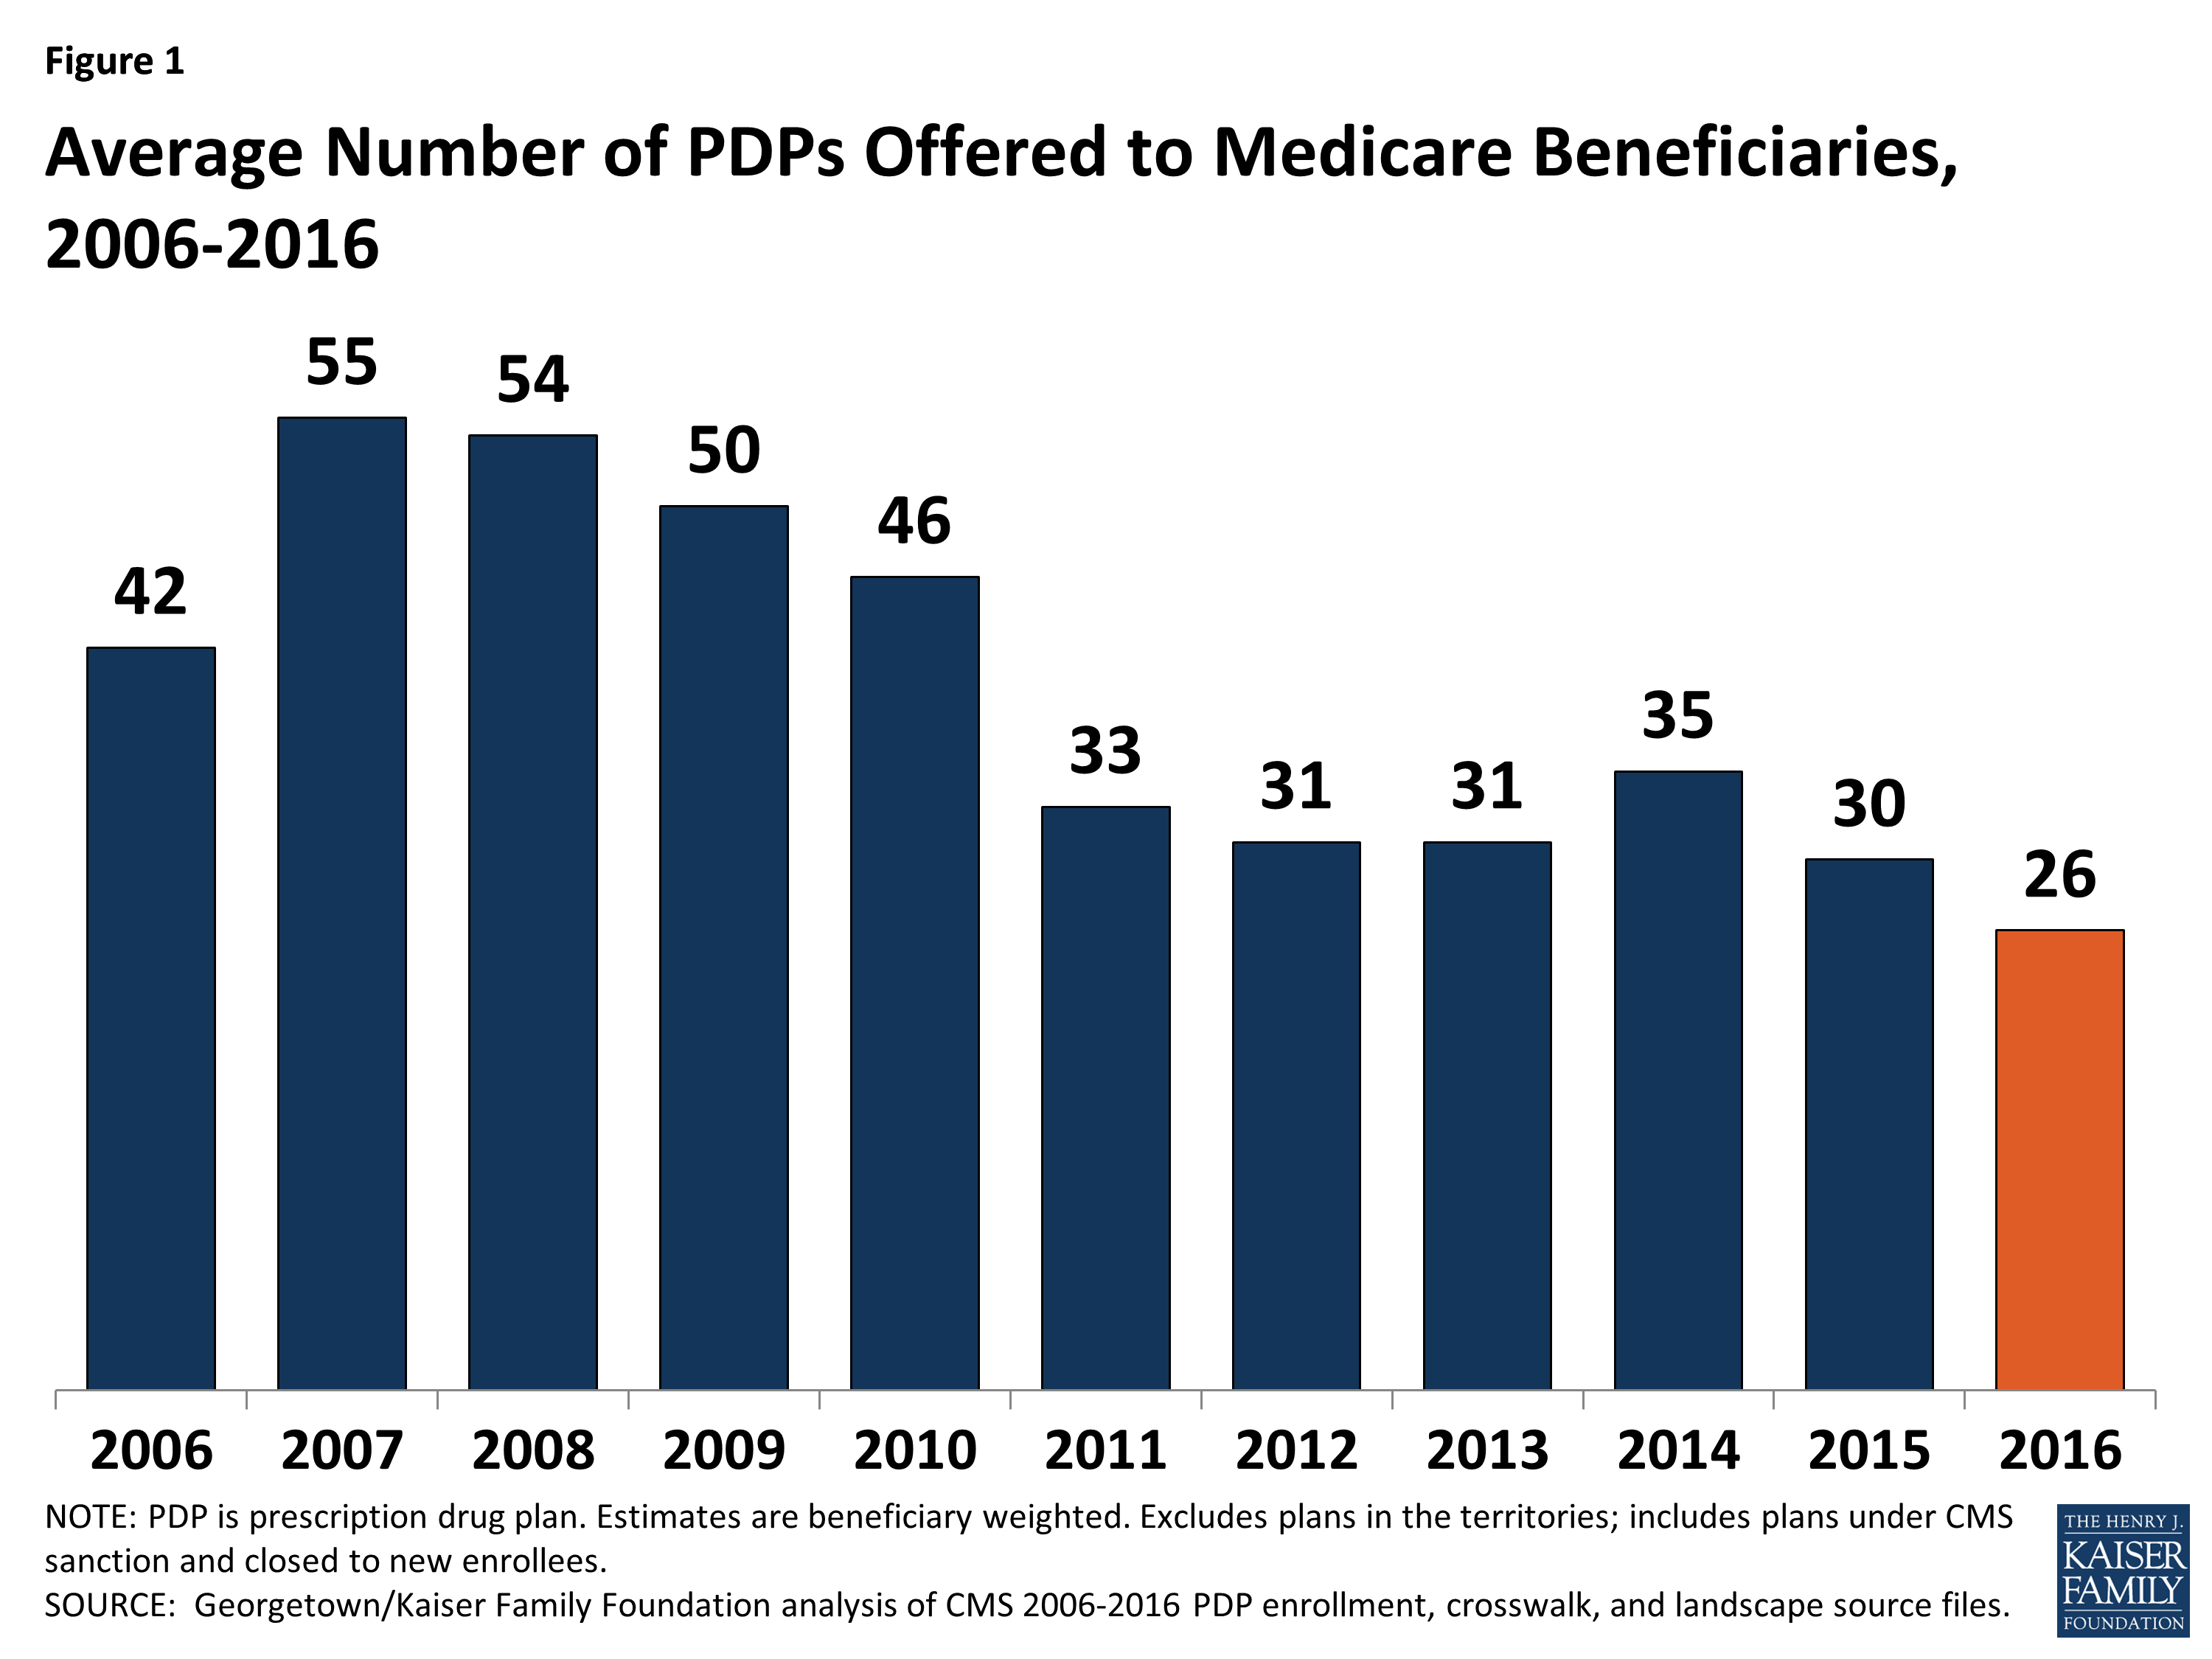
Figure 1: Average Number of PDPs Offered to Medicare Beneficiaries, 2006-2016
- The number of PDPs per region in 2016 will range from a low of 19 PDPs in the Alaska region to a high of 29 PDPs in the Pennsylvania/West Virginia region (Figure 2; Appendix 1, Table A1). The number of plans is lower in all but one region (Pennsylvania/West Virginia) compared to 2015; there are five fewer PDPs in Alaska, Florida, and Illinois in 2016.
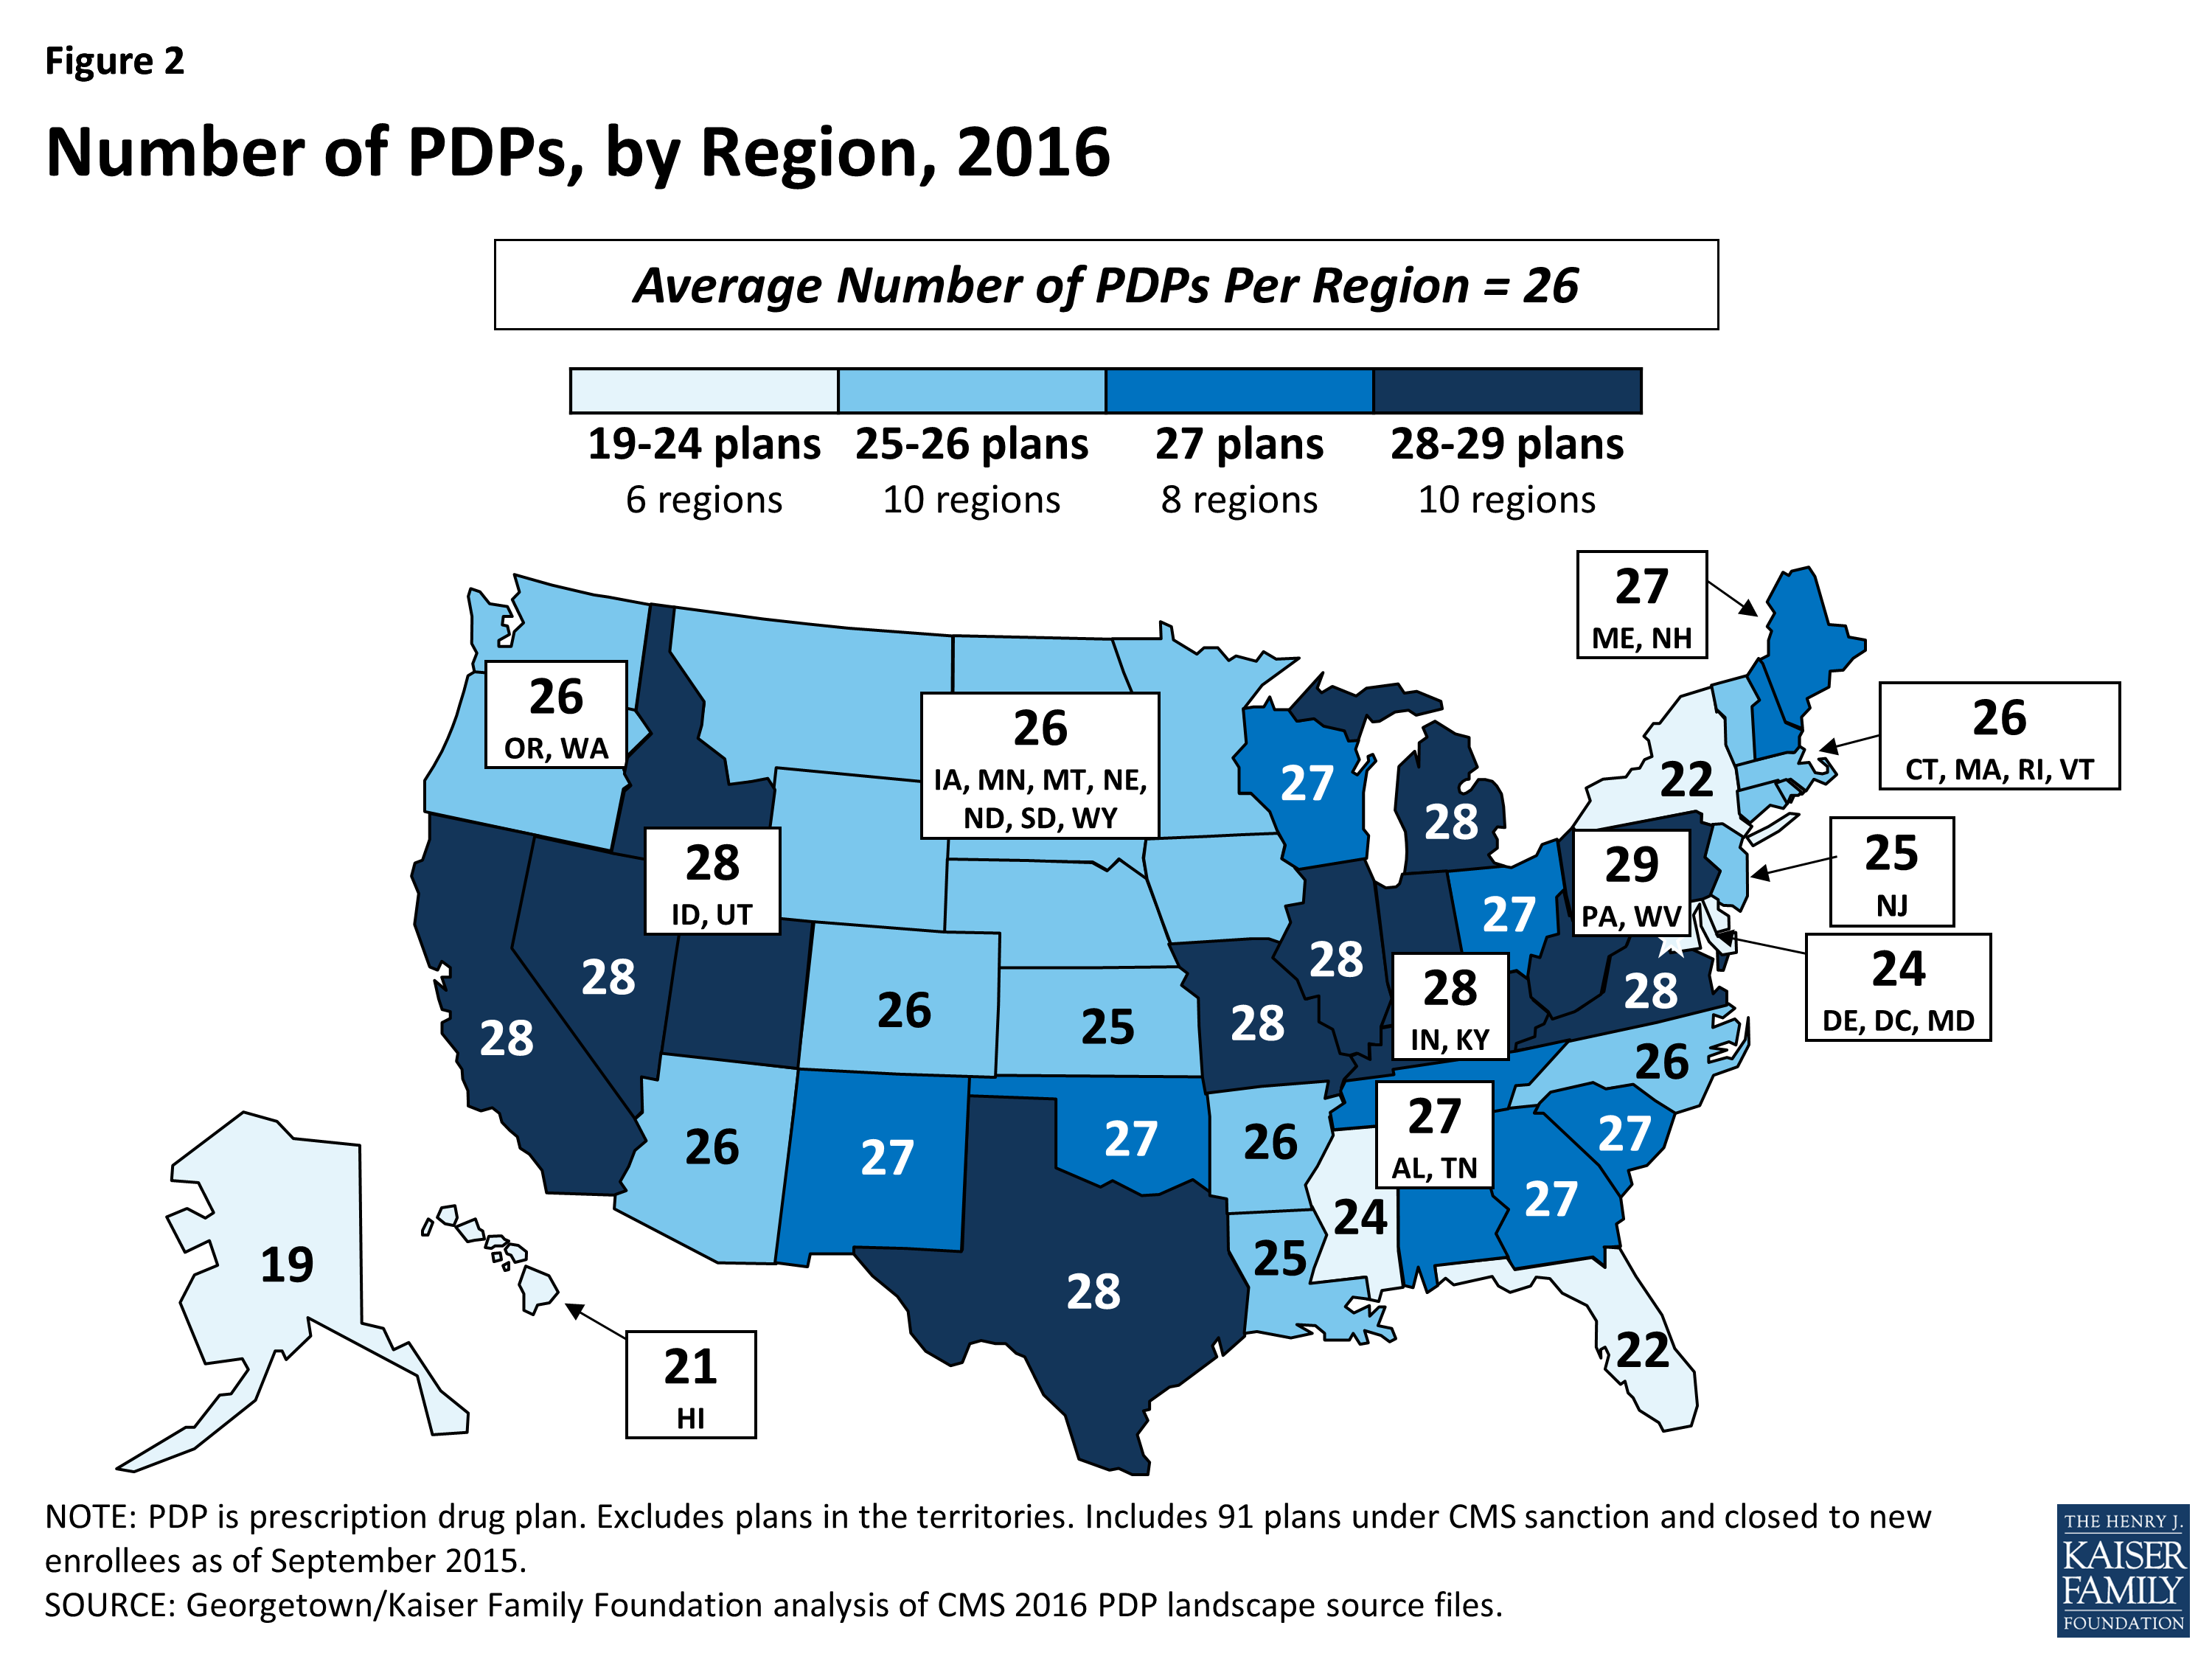
Figure 2: Number of PDPs, by Region, 2016
- A total of 886 PDPs will be offered nationwide in 2016, down by 11 percent from the 1,001 PDPs offered in 2015 and the lowest number of PDPs in the program’s history (Figure 3). The total number of PDPs in 2016 represents less than half the number offered at the peak level in 2007 of 1,875 plans. The lower number of plans reflects both the cumulative effect of mergers among plan sponsors and the response to CMS policies that encourage plan sponsors to eliminate low-enrollment plans and to drop multiple PDPs that are not meaningfully different from each other.

Figure 3: Number of PDPs, 2006-2016
- In 2016, there are 11 plan sponsors offering 23 PDPs on a national or near-national basis. The number of national or near-national plan sponsors is down from 18 in 2009, as a result of corporate acquisitions and some firms exiting the market after not achieving a substantial market share. In addition, more sponsors are offering two PDPs, whereas it was more common to offer three in the program’s early years.
- In July 2015, the PDP sponsor Torchmark Corporation was placed under a sanction that banned marketing activities and new enrollments. Its PDPs, marketed under the United American name, have 208,000 enrollees in 91 PDPs across all regions in September 2015.
For 2016, 31 new PDPs are entering the market, and 146 PDPs are exiting the program.3 (See Appendix 2 for more detail on market dynamics.)
- Two new sponsors are entering the PDP market in 2016: Magellan Rx America, offering PDPs in 20 regions, and QualChoice Advantage, offering a PDP only in Arkansas.
- Among the 146 exiting plans, 143 are offered by sponsors that offer other PDPs, and enrollees in most of them (137 of 143) will be automatically assigned to another PDP offered by that sponsor. This process should ensure a seamless transition and minimize disruption that would otherwise result from plan terminations. The other 3 exiting PDPs are offered by sponsors (each operating in a single region) leaving the market entirely
Premiums
National Premium Trends
The national average monthly PDP premium is expected to increase for 2016, marking a significant departure from recent years when premiums were essentially flat. Even if a number of beneficiaries switch or are reassigned to lower-premium plans, effective in January 2016, the average premium increase for 2016 is likely to be the largest amount in any year since 2009.
- The projected average monthly PDP premium for 2016 will be $41.46 (weighted by September 2015 enrollment, assuming beneficiaries remain in their current plan) (Figure 4).4 This is a 13 percent projected increase ($4.66) from the weighted average monthly premium of $36.68 in 2015, and a 60 percent increase from $25.93 in 2006, the first year of the Medicare Part D drug benefit. As a point of comparison, since 2006, the medical care consumer price index (CPI) has increased 34 percent and the CPI for all items has increased 18 percent.

Figure 4: Weighted Average Monthly Premiums for PDPs, 2006-2016
- In prior years, the average premium after the end of the open enrollment period has been 4 percent to 5 percent lower than the projection made during the open enrollment period, due to existing enrollees switching to a lower premium plan, new enrollees choosing low-premium plans, and reassignments of some LIS beneficiaries to cheaper plans. For example, the average premium in February 2015 was $37.20,which is about 4 percent ($1.63) below the projected premium of $38.83 calculated prior to enrollment changes.5 Applying a similar adjustment to our projected premium for 2016 suggests that the premium increase, after open enrollment, is likely to be lower, but still larger than in any year since 2009.
- For PDPs offering only the basic benefit, the 2016 weighted average premium is projected to be 8 percent higher in 2016 than in 2015 (based on current enrollment patterns), whereas premiums for enhanced PDPs are projected to rise by about 17 percent.6
A growing share of PDP enrollees are paying premiums that are well above the national average.
- In 2016, over one-third of PDP enrollees not receiving the LIS (36 percent) are projected to have premiums of at least $60 per month if they stay in their plans—a substantial increase from the 10 percent of enrollees paying premiums at this level in 2015 (Figure 5). Among them, nearly 400,000 are projected to pay premiums of at least $100 per month. By contrast, 14 percent of these PDP enrollees are scheduled to pay premiums of less than $20 per month.
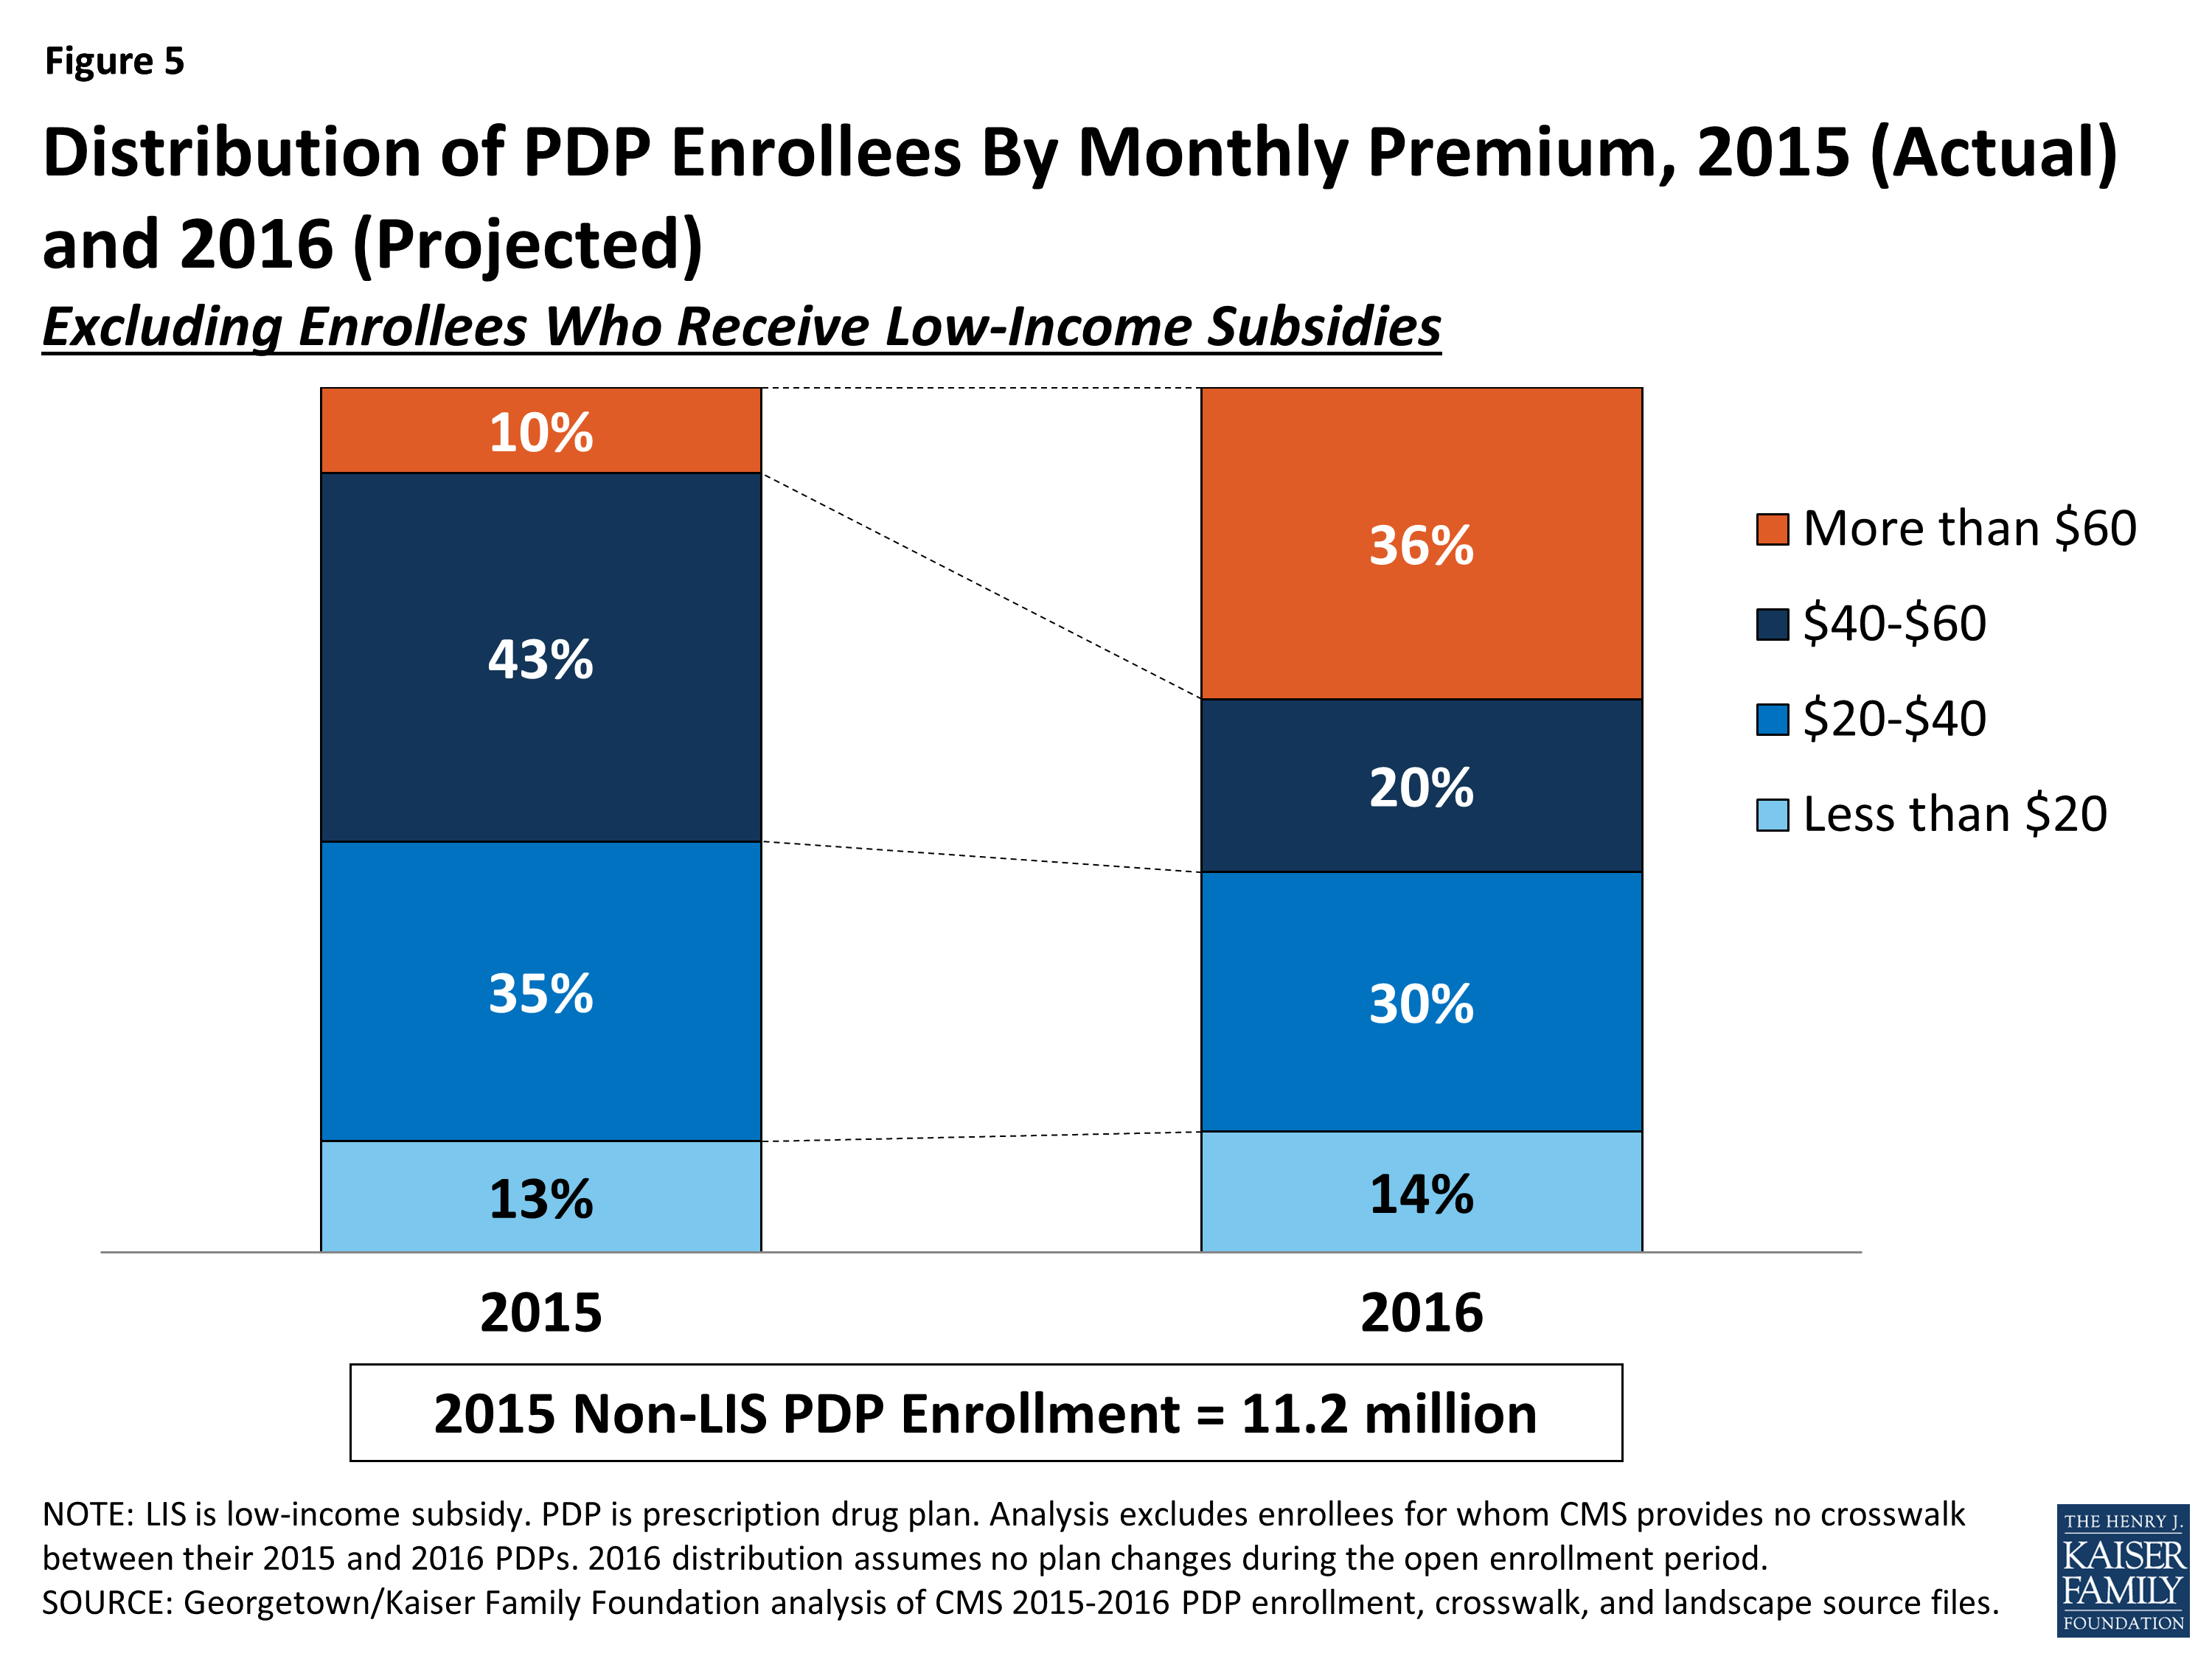
Figure 5: Distribution of PDP Enrollees By Monthly Premium, 2015 (Actual) and 2016 (Projected)
CMS reported that the average premium for standard Part D coverage offered by PDPs and Medicare Advantage drug plans will “remain stable” at an estimated $32.50 in 2016.7 The higher premium reported here is based on PDPs only, including PDPs offering both basic and enhanced coverage. Enhanced plans typically have higher premiums than basic PDPs. Our estimate does not assume any voluntary switches by beneficiaries and reassignments by CMS of Low-Income Subsidy enrollees to different plans, nor do we make any assumptions about plan choices made by new enrollees in 2016.
Monthly Premium Changes for Enrollees
Underneath these national trends, premium changes for individual PDPs from 2015 to 2016 vary widely (Figure 6).
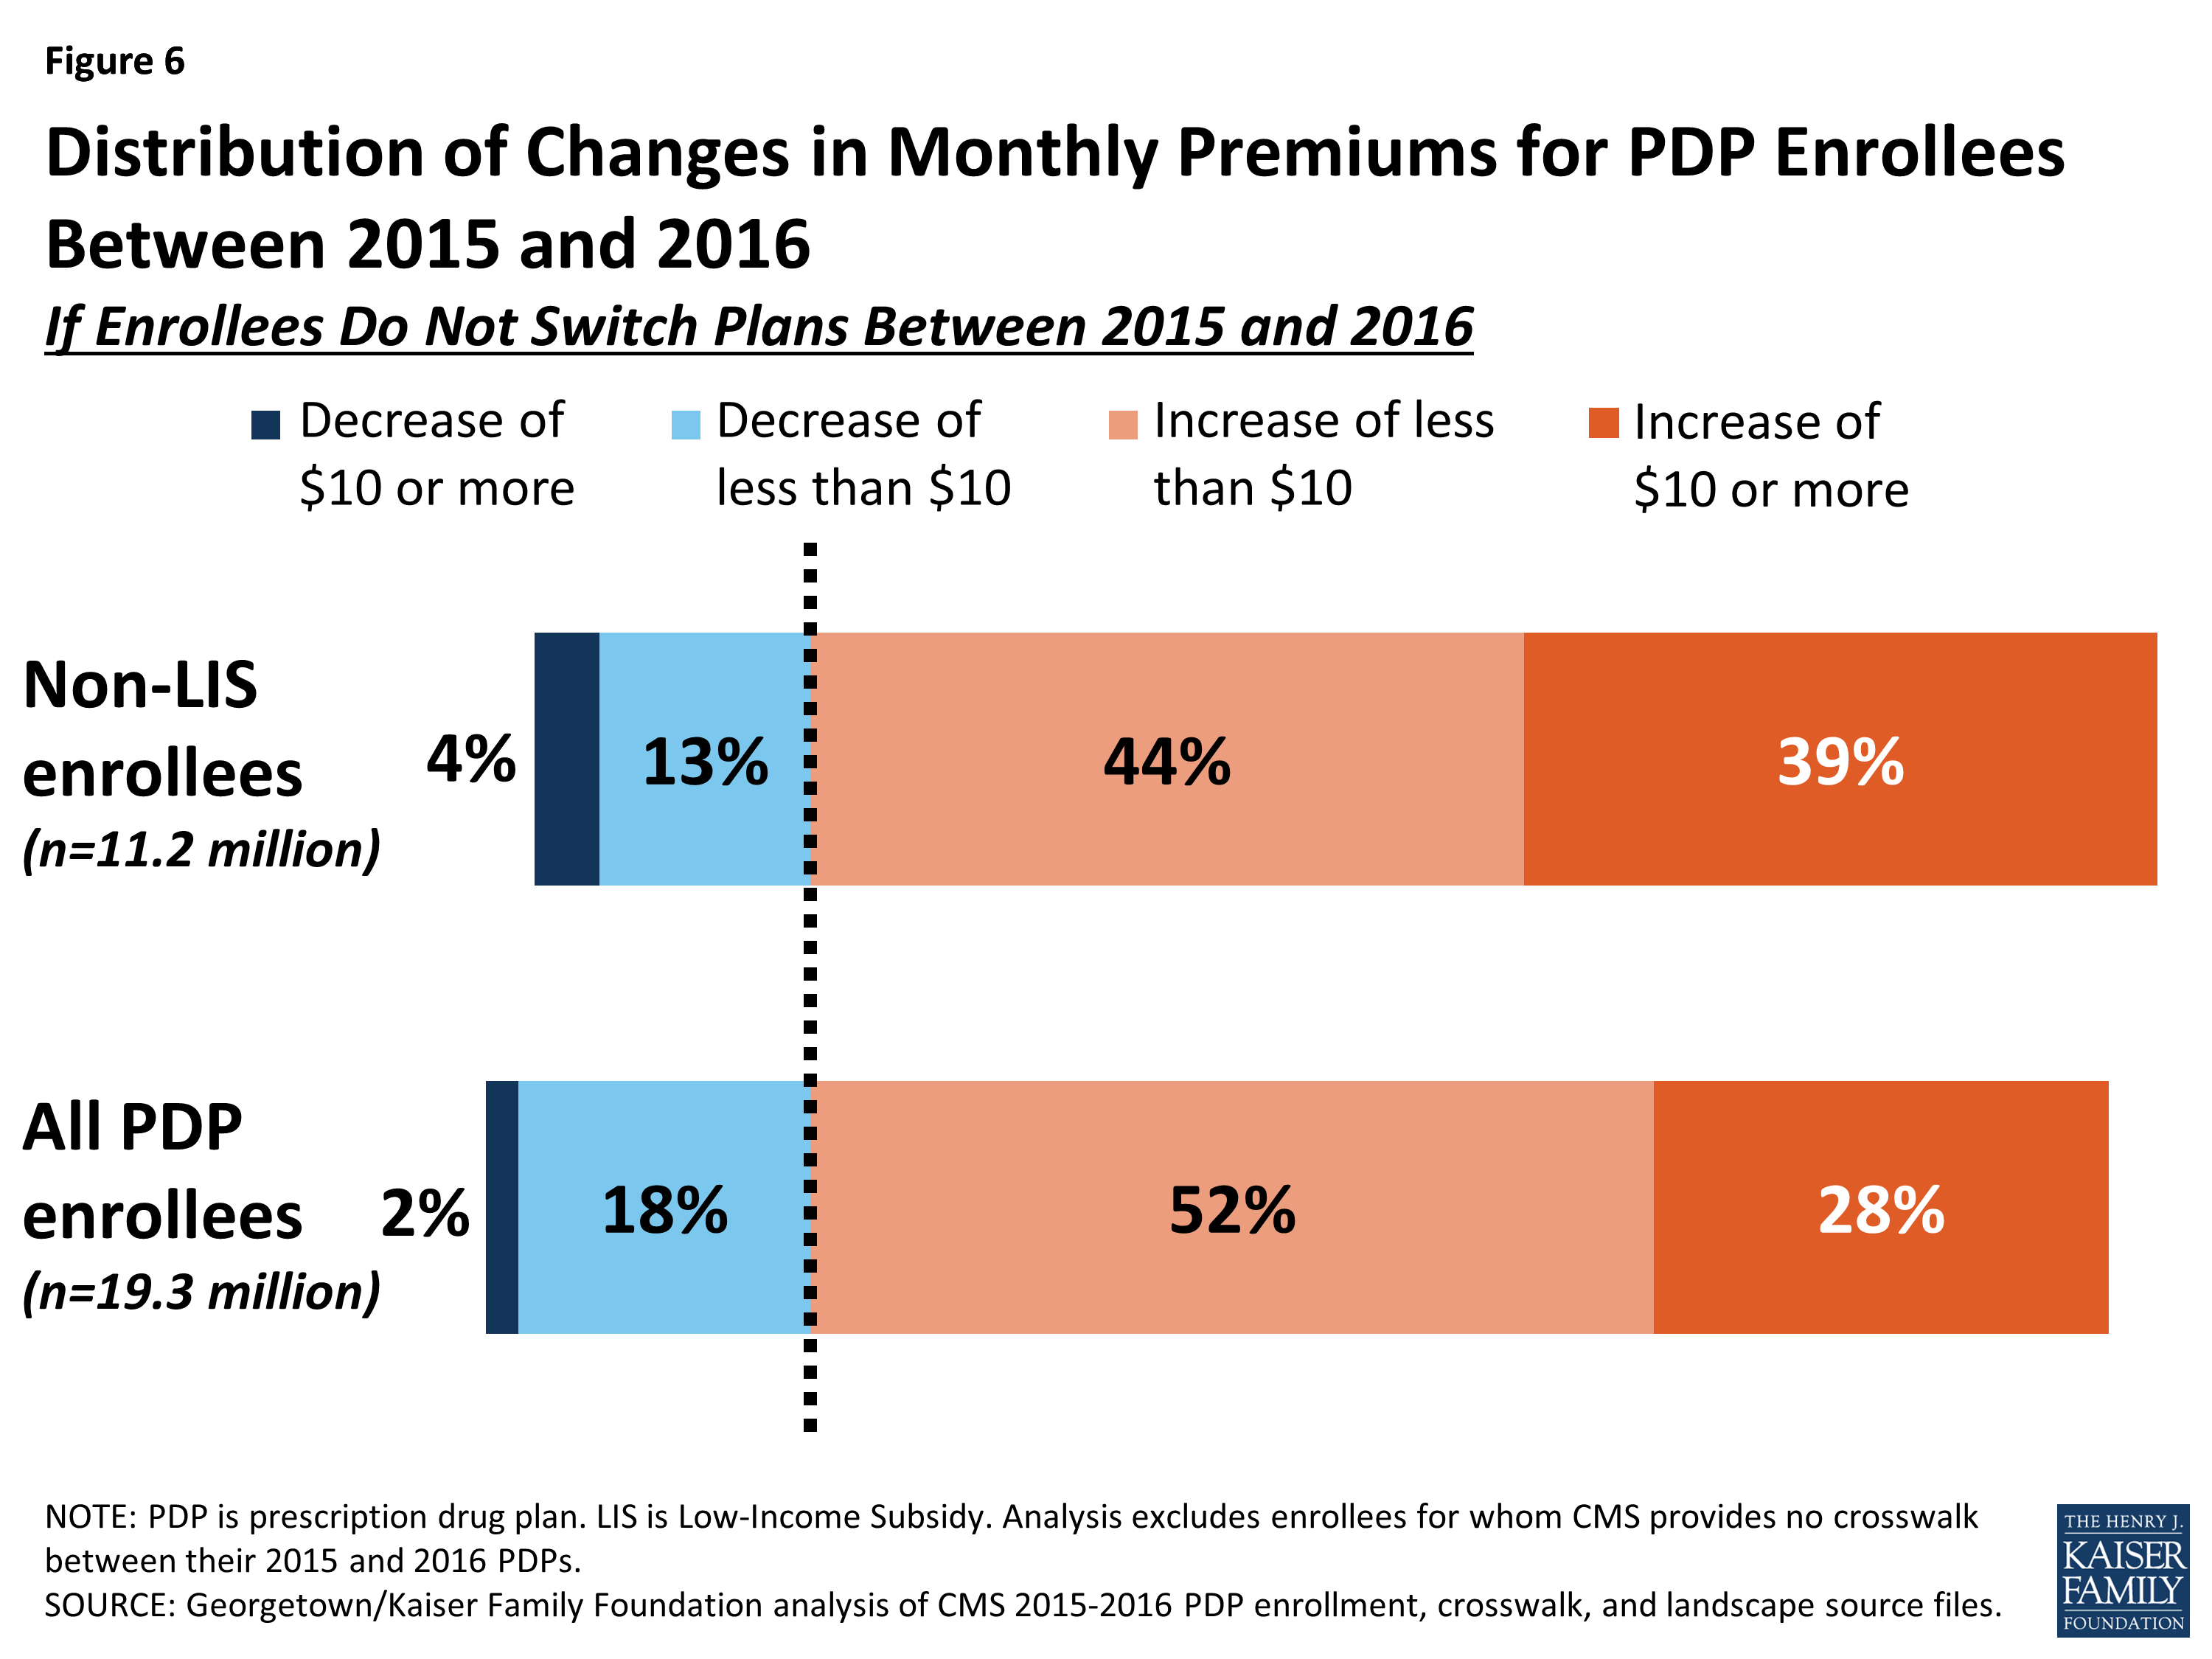
Figure 6: Distribution of Changes in Monthly Premiums for PDP Enrollees Between 2015 and 2016
- Among the 11.2 millionPart D PDP enrollees who are responsible for paying the entire premium (which excludes LIS recipients), most (83 percent) are projected to have a higher premium in 2016 if they stay in their current plans, including 4.4 million (39 percent) who are projected to have a premium increase of at least $10 per month. Conversely, nearly half a million (448,000) are projected to experience a premium decrease of $10 or more.
- Taking into account all PDP enrollees, including the LIS enrollees whose premiums are partially paid by the government, 80 percent are in plans in which premiums are projected to rise in 2016 if they stay in their current plans; this includes 28 percent in plans that will have an increase of $10 or more in their monthly premium in 2016 assuming no enrollment changes. By contrast, 2 percent of all PDP enrollees are in plans projected to have a premium decrease of $10 or more.
Premium Changes for PDPs with the Most Enrollees
Changes to premiums from 2015 to 2016, averaged across regions and weighted by 2015 enrollment, vary widely across some of the most popular PDPs (Figure 7). These variations reflect factors such as higher premiums in older plans and substantial geographic variations.8 Although variation in benefits is also a factor, premium variation persists even among PDPs that offer benefits actuarially equivalent to the basic benefit defined in law.
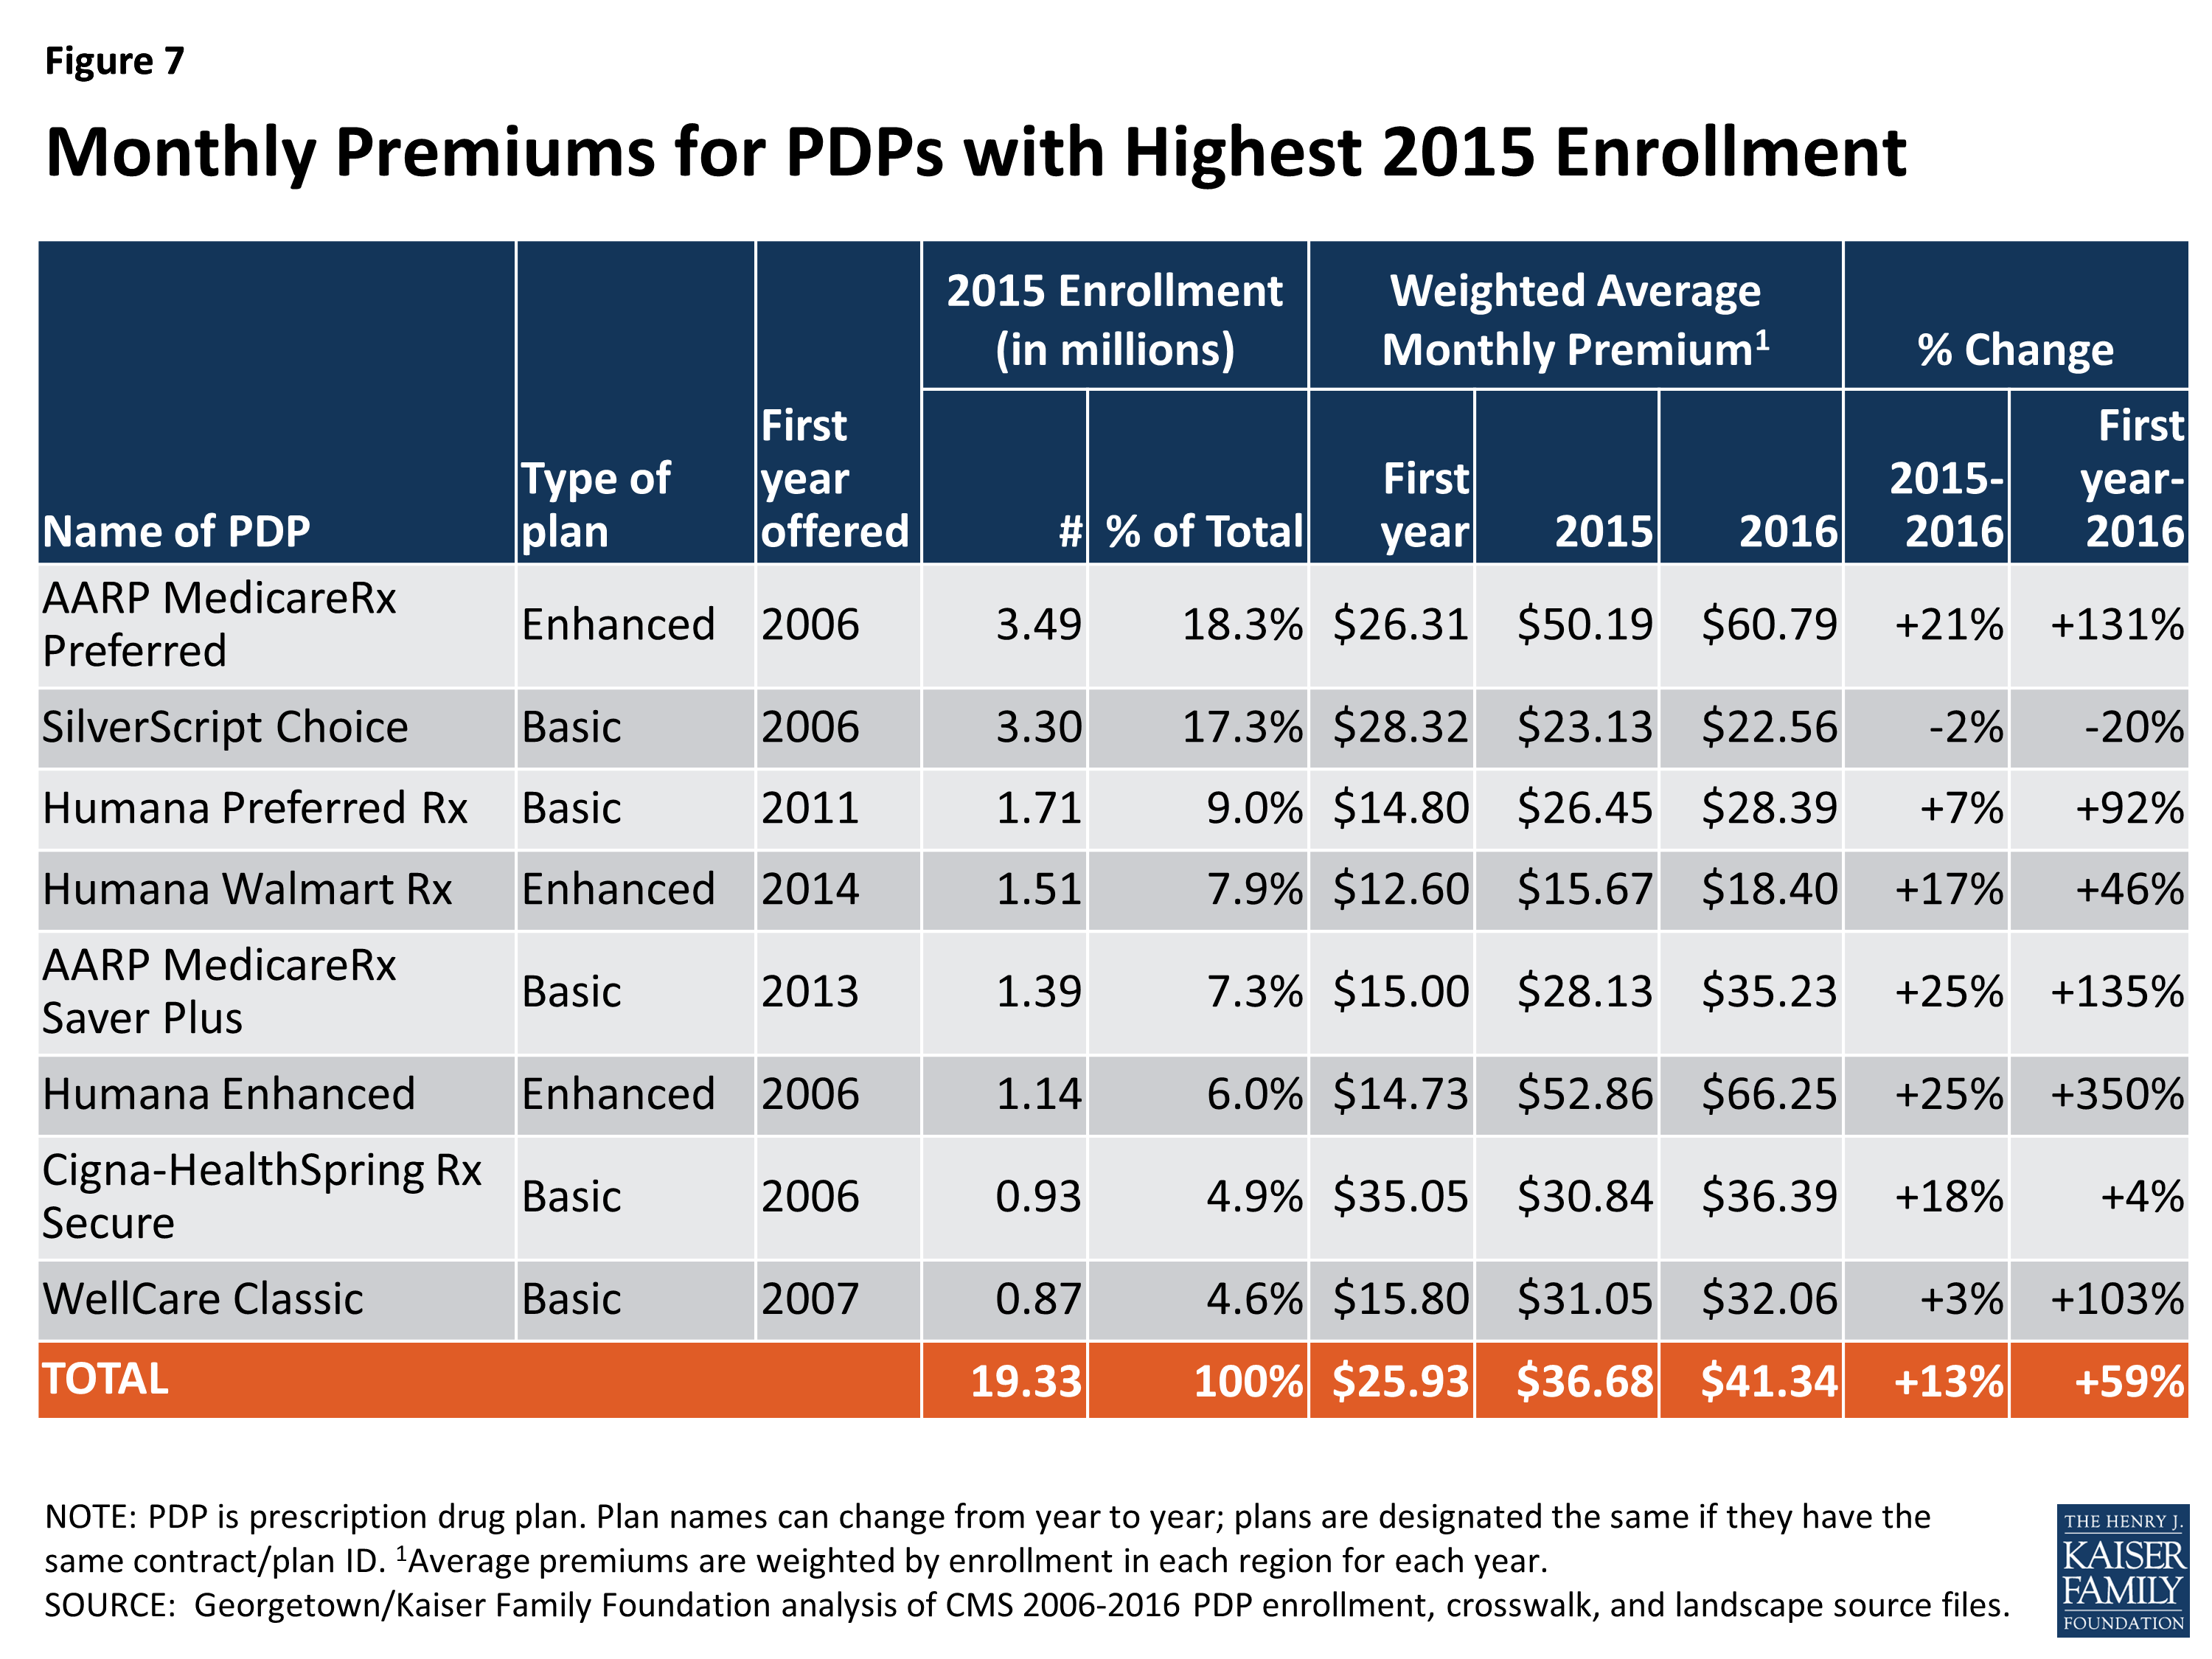
Figure 7: Monthly Premiums for PDPs with Highest 2015 Enrollment
- Average premiums for seven of the eight largest PDPs will increase for 2016. Five of these seven PDPs will have larger average percentage increases than the national average. Average premiums for three of these PDPs are projected to increase by at least 20 percent in 2016.
- The highest increases, in percentage terms, are for Humana Enhanced PDP, with 1.1 million enrollees in 2015, and AARP MedicareRx Saver Plus, with 1.4 million enrollees. On average, premiums for both PDPs will rise 25 percent (from $52.86 to $66.25 for Humana Enhanced and from $28.13 to $35.23 for AARP MedicareRx Saver Plus). The average monthly premium for the PDP with the most enrollees in 2015, AARP MedicareRx Preferred, with 3.5 million enrollees, will increase by 21 percent between 2015 and 2016, from $50.19 to $60.79.
- By contrast, enrollees in one of the largest PDPs will experience a modest decrease in their monthly premium if they stay in the same plan. The average monthly premium for SilverScript Choice will decrease by 2 percent ($22.56 in 2016 versus $23.13 in 2015).
Enrollees in some of the most popular PDPs could see bigger or smaller premium increases than the national average, depending on the region where they live.
- UnitedHealth’s AARP MedicareRx Preferred PDP is raising premiums by as little as 9 percent (in Oregon/Washington) but as high as 37 percent (in Alaska) (Figure 8). The range is even greater for CVS Health’s SilverScript Choice PDP, which is reducing premiums by as much as 36 percent (in Arkansas) and increasing premiums by as much as 24 percent (in Florida).
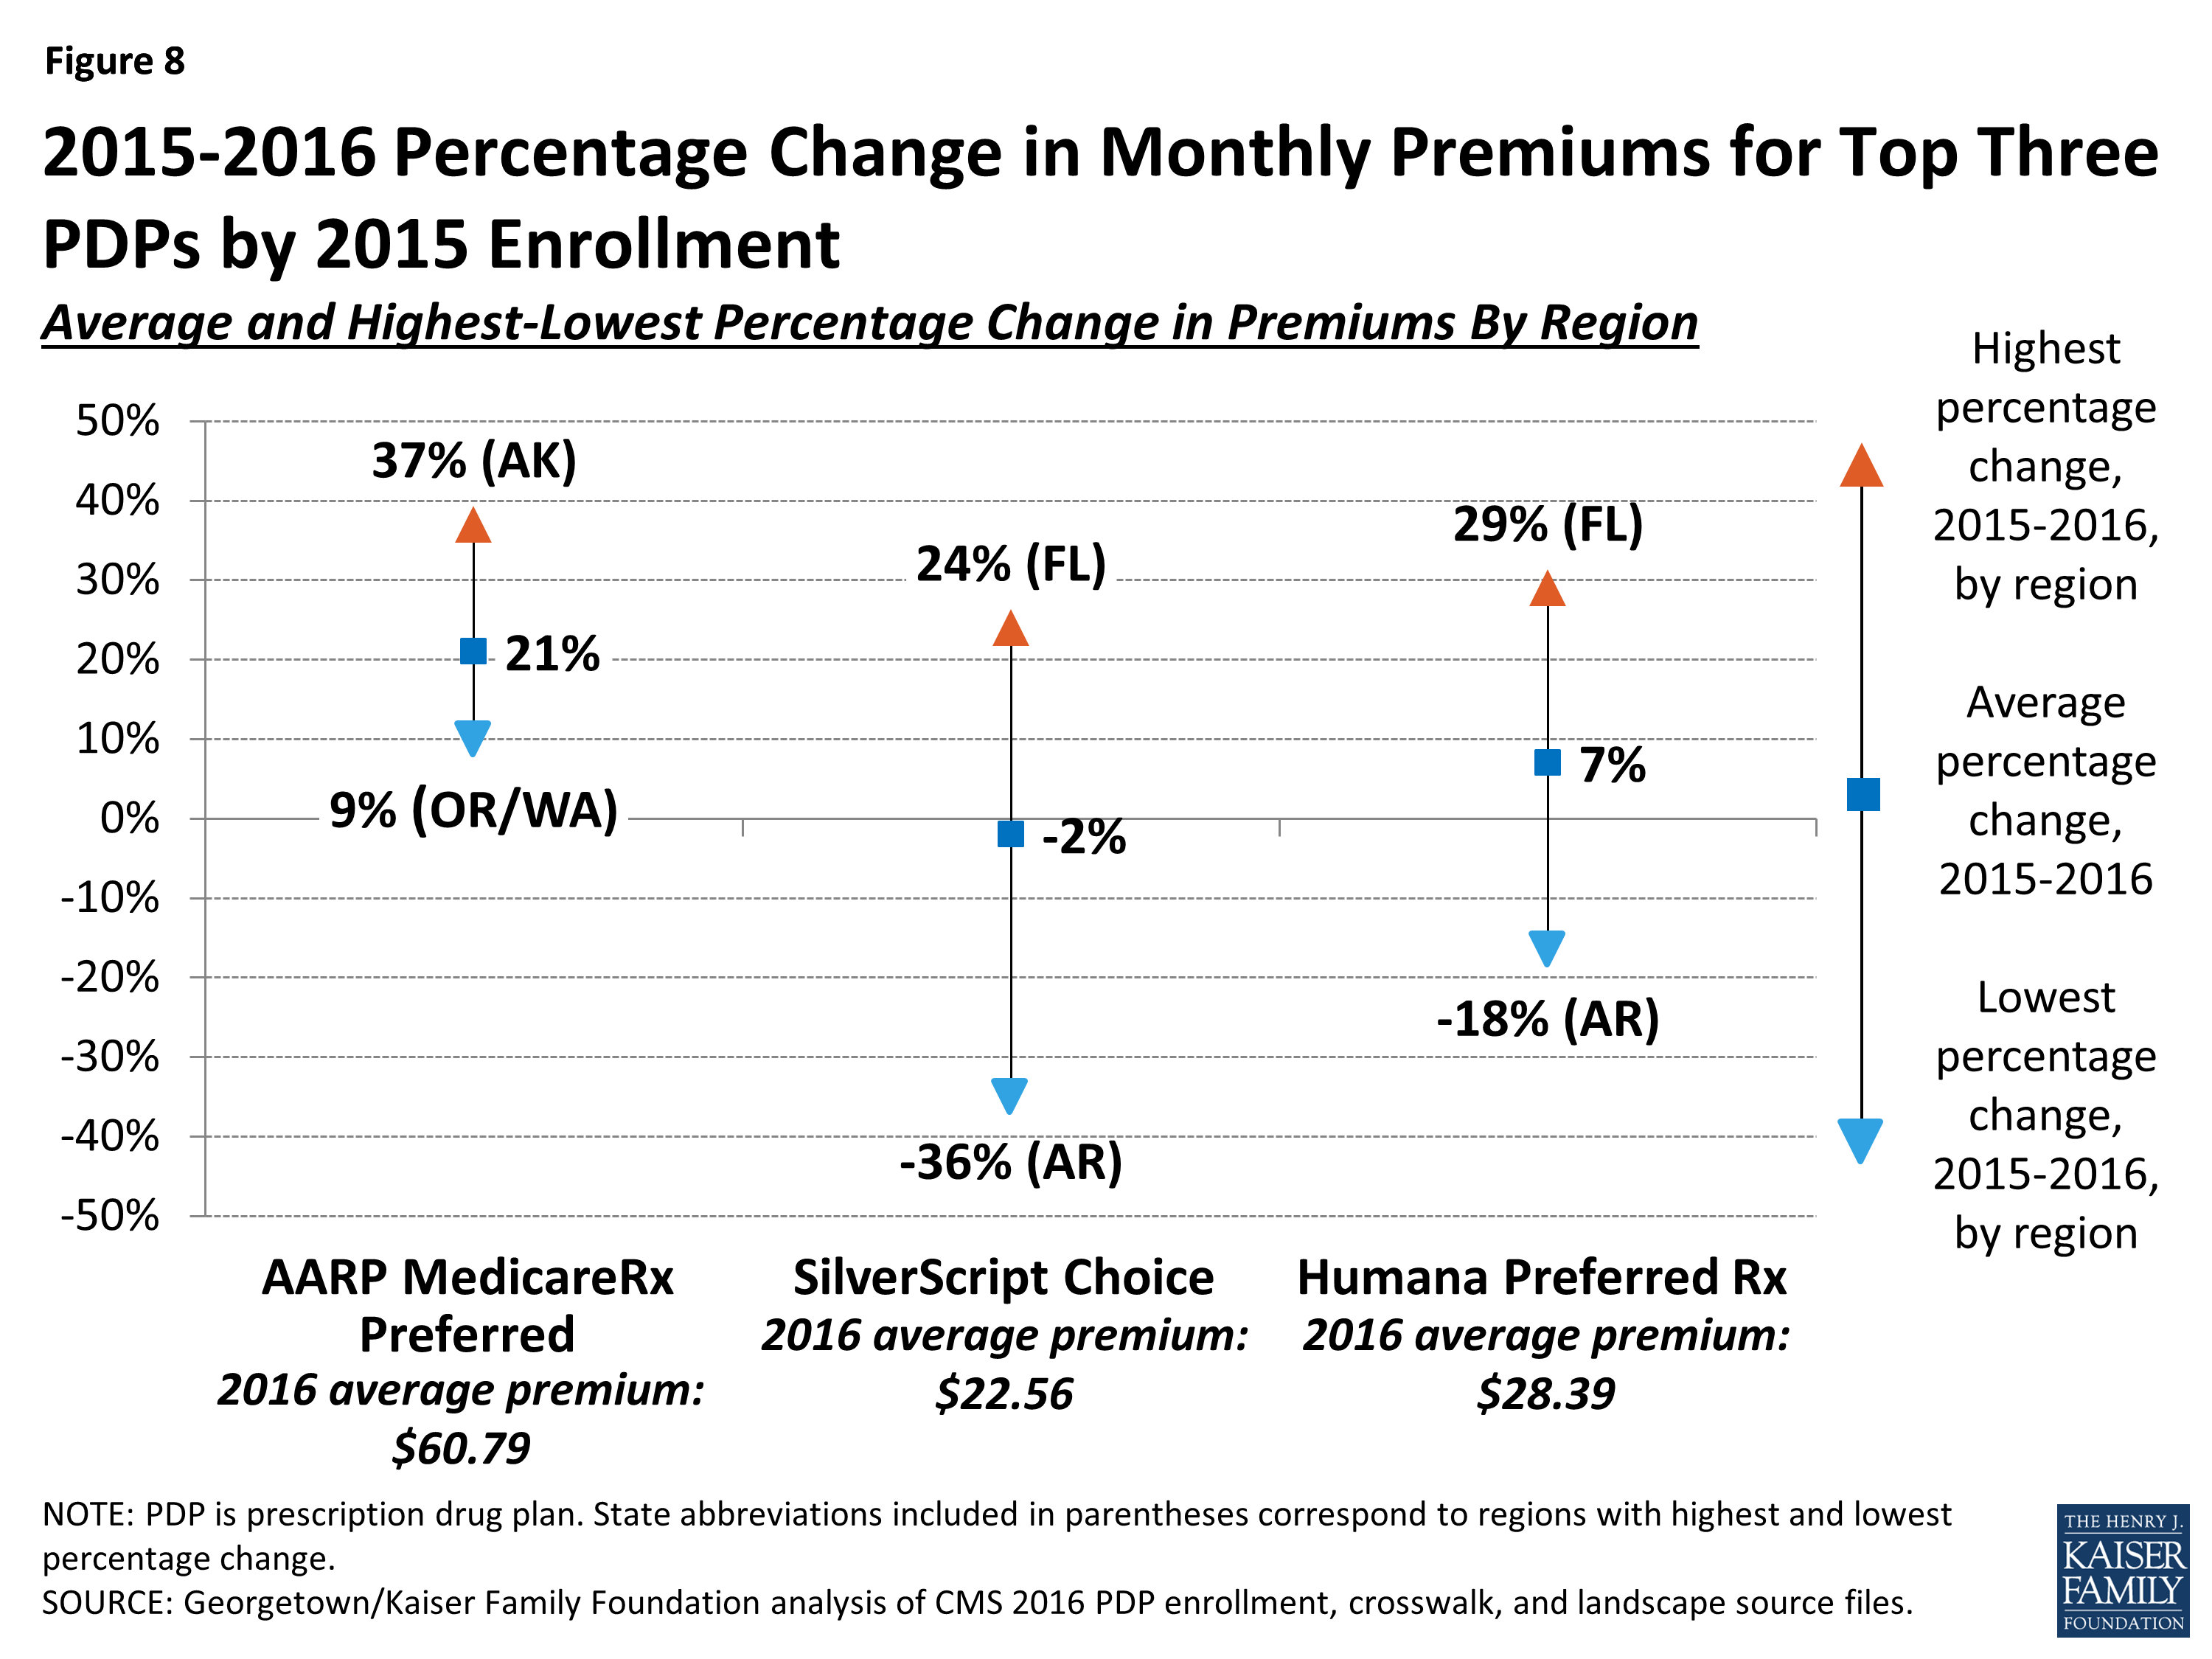
Figure 8: 2015-2016 Percentage Change in Monthly Premiums for Top Three PDPs by 2015 Enrollment
Monthly premiums for the most popular PDPs available since the start of the Part D program in 2006 have changed in different ways.
- The average premium for Humana PDP Enhanced, with 1.1 million enrollees in 2015, is more than four times higher than it was in 2006, having increased from $14.73 to $66.25. Of the eight most popular PDPs, this plan is projected to have the most expensive monthly premium in 2016.
- The average premium for UnitedHealth’s AARP Preferred MedicareRx PDP, the PDP with the most enrollees in 2015 (3.5 million), has more than doubled since 2006, from $26.31 to $60.79 in 2016.
- By contrast, the monthly premium for SilverScript Choice, operated by CVS Health, with 2.5 million enrollees in 2015, is 20 percent lower in 2016 ($22.56) than it was in 2006 ($28.32).
Premium Variation and Changes by Region
Average PDP monthly premiums, weighted by 2015 enrollment, will vary widely in 2016 across regions, along with the change in premiums from 2015 to 2016.
- Average PDP premiums will range from $29.70 per month in the New Mexico region (one of only three regions with an average under $35) to $49.61 per month in New Jersey and $45.31 in Florida (Appendix 1, Table A2).
- Premium changes from 2015 to 2016 vary considerably by region. For example, average premiums in Arkansas are projected to fall by about 1 percent, whereas average premiums will be at least 20 percent higher in Arizona and Florida (Figure 9).
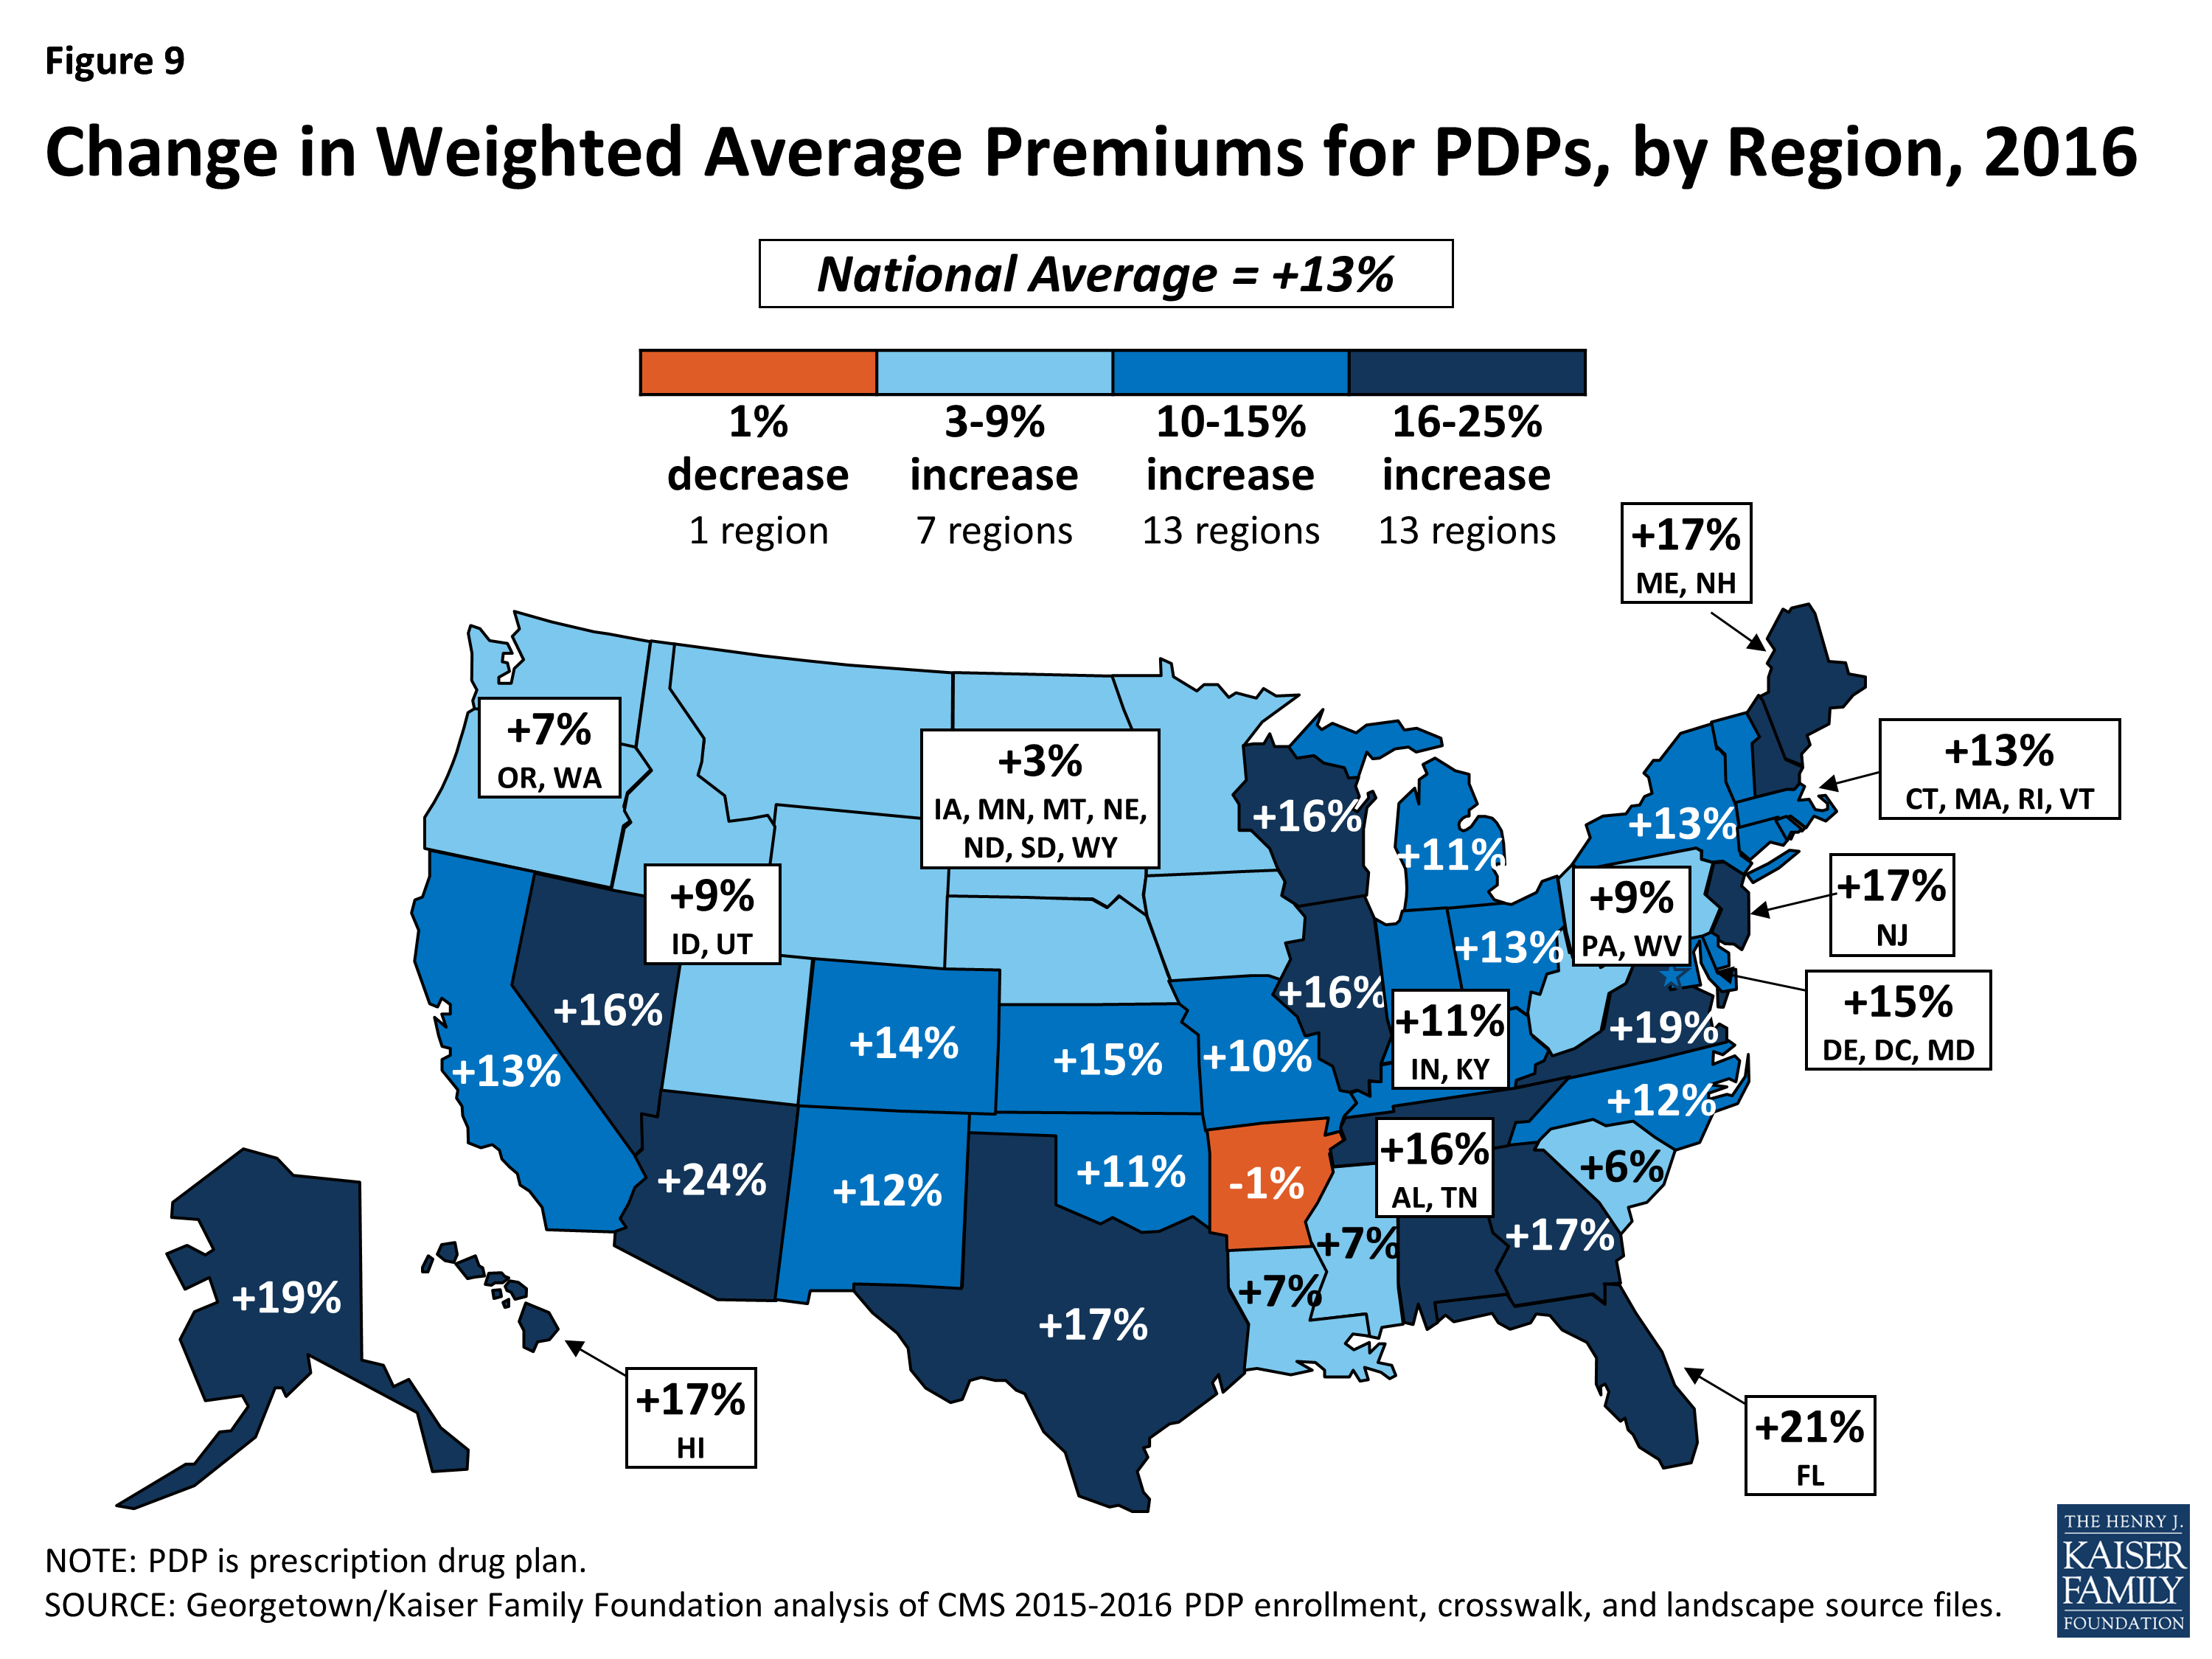
Figure 9: Change in Weighted Average Premiums for PDPs, by Region, 2016
Premiums for Higher-Income Enrollees
Average and plan-level premium amounts do not take into account the income-related Part D premium that took effect in 2011 for Part D enrollees with higher annual incomes ($85,000/individual and $170,000/couple). Established by the Affordable Care Act of 2010 (ACA), the income-related Part D premium requires higher-income enrollees to make an additional payment to the government for Part D coverage, regardless of the plan selected. In 2016, the monthly surcharge will range from $12.70 to $72.90, depending on income, in addition to the monthly premium payment for the specific Part D plan.9 Nearly 6 percent of Part D enrollees are expected to make these additional payments in 2016.10 Under current law, the income thresholds are not indexed to increase annually until 2020, meaning that by 2019, a projected 8 percent of Part D enrollees will pay income-related premiums.
Benefit Design
In 2016, for the second year in a row, all Part D PDPs will offer an alternative benefit design to the defined standard benefit, which has a $360 deductible in 2016 and 25 percent coinsurance for all covered drugs. Some plans modify or eliminate the deductible, and all PDPs use some type of varying cost-sharing tiers for covered generic and brand-name drugs.
Deductibles
The standard (maximum) Part D deductible is increasing by $40 in 2016, the largest one-year increase since the program began. It is adjusted each year by a statutory formula based on the annual percentage increase in average per capita aggregate expenditures for covered Part D drugs. Other amounts for the standard benefit design parameters are increasing as well (see Appendix 3 for the 2006-2016 standard benefit amounts).
- Two-thirds of PDPs (67 percent) will charge a deductible in 2016, up from 58 percent in 2015 (Figure 10). The share of PDPs with a deductible is the highest ever in the program. Most PDPs adding deductibles have relatively few enrollees, so the share of PDP enrollees facing a deductible is likely to change more modestly. Nearly two-thirds of all Part D enrollees are in plans that are increasing the deductible for 2016.
- Most PDPs with a deductible (53 percent) will charge the standard $360 amount, which is also the highest share in the program’s history. Another 14 percent of all PDPs have a deductible below the standard amount.
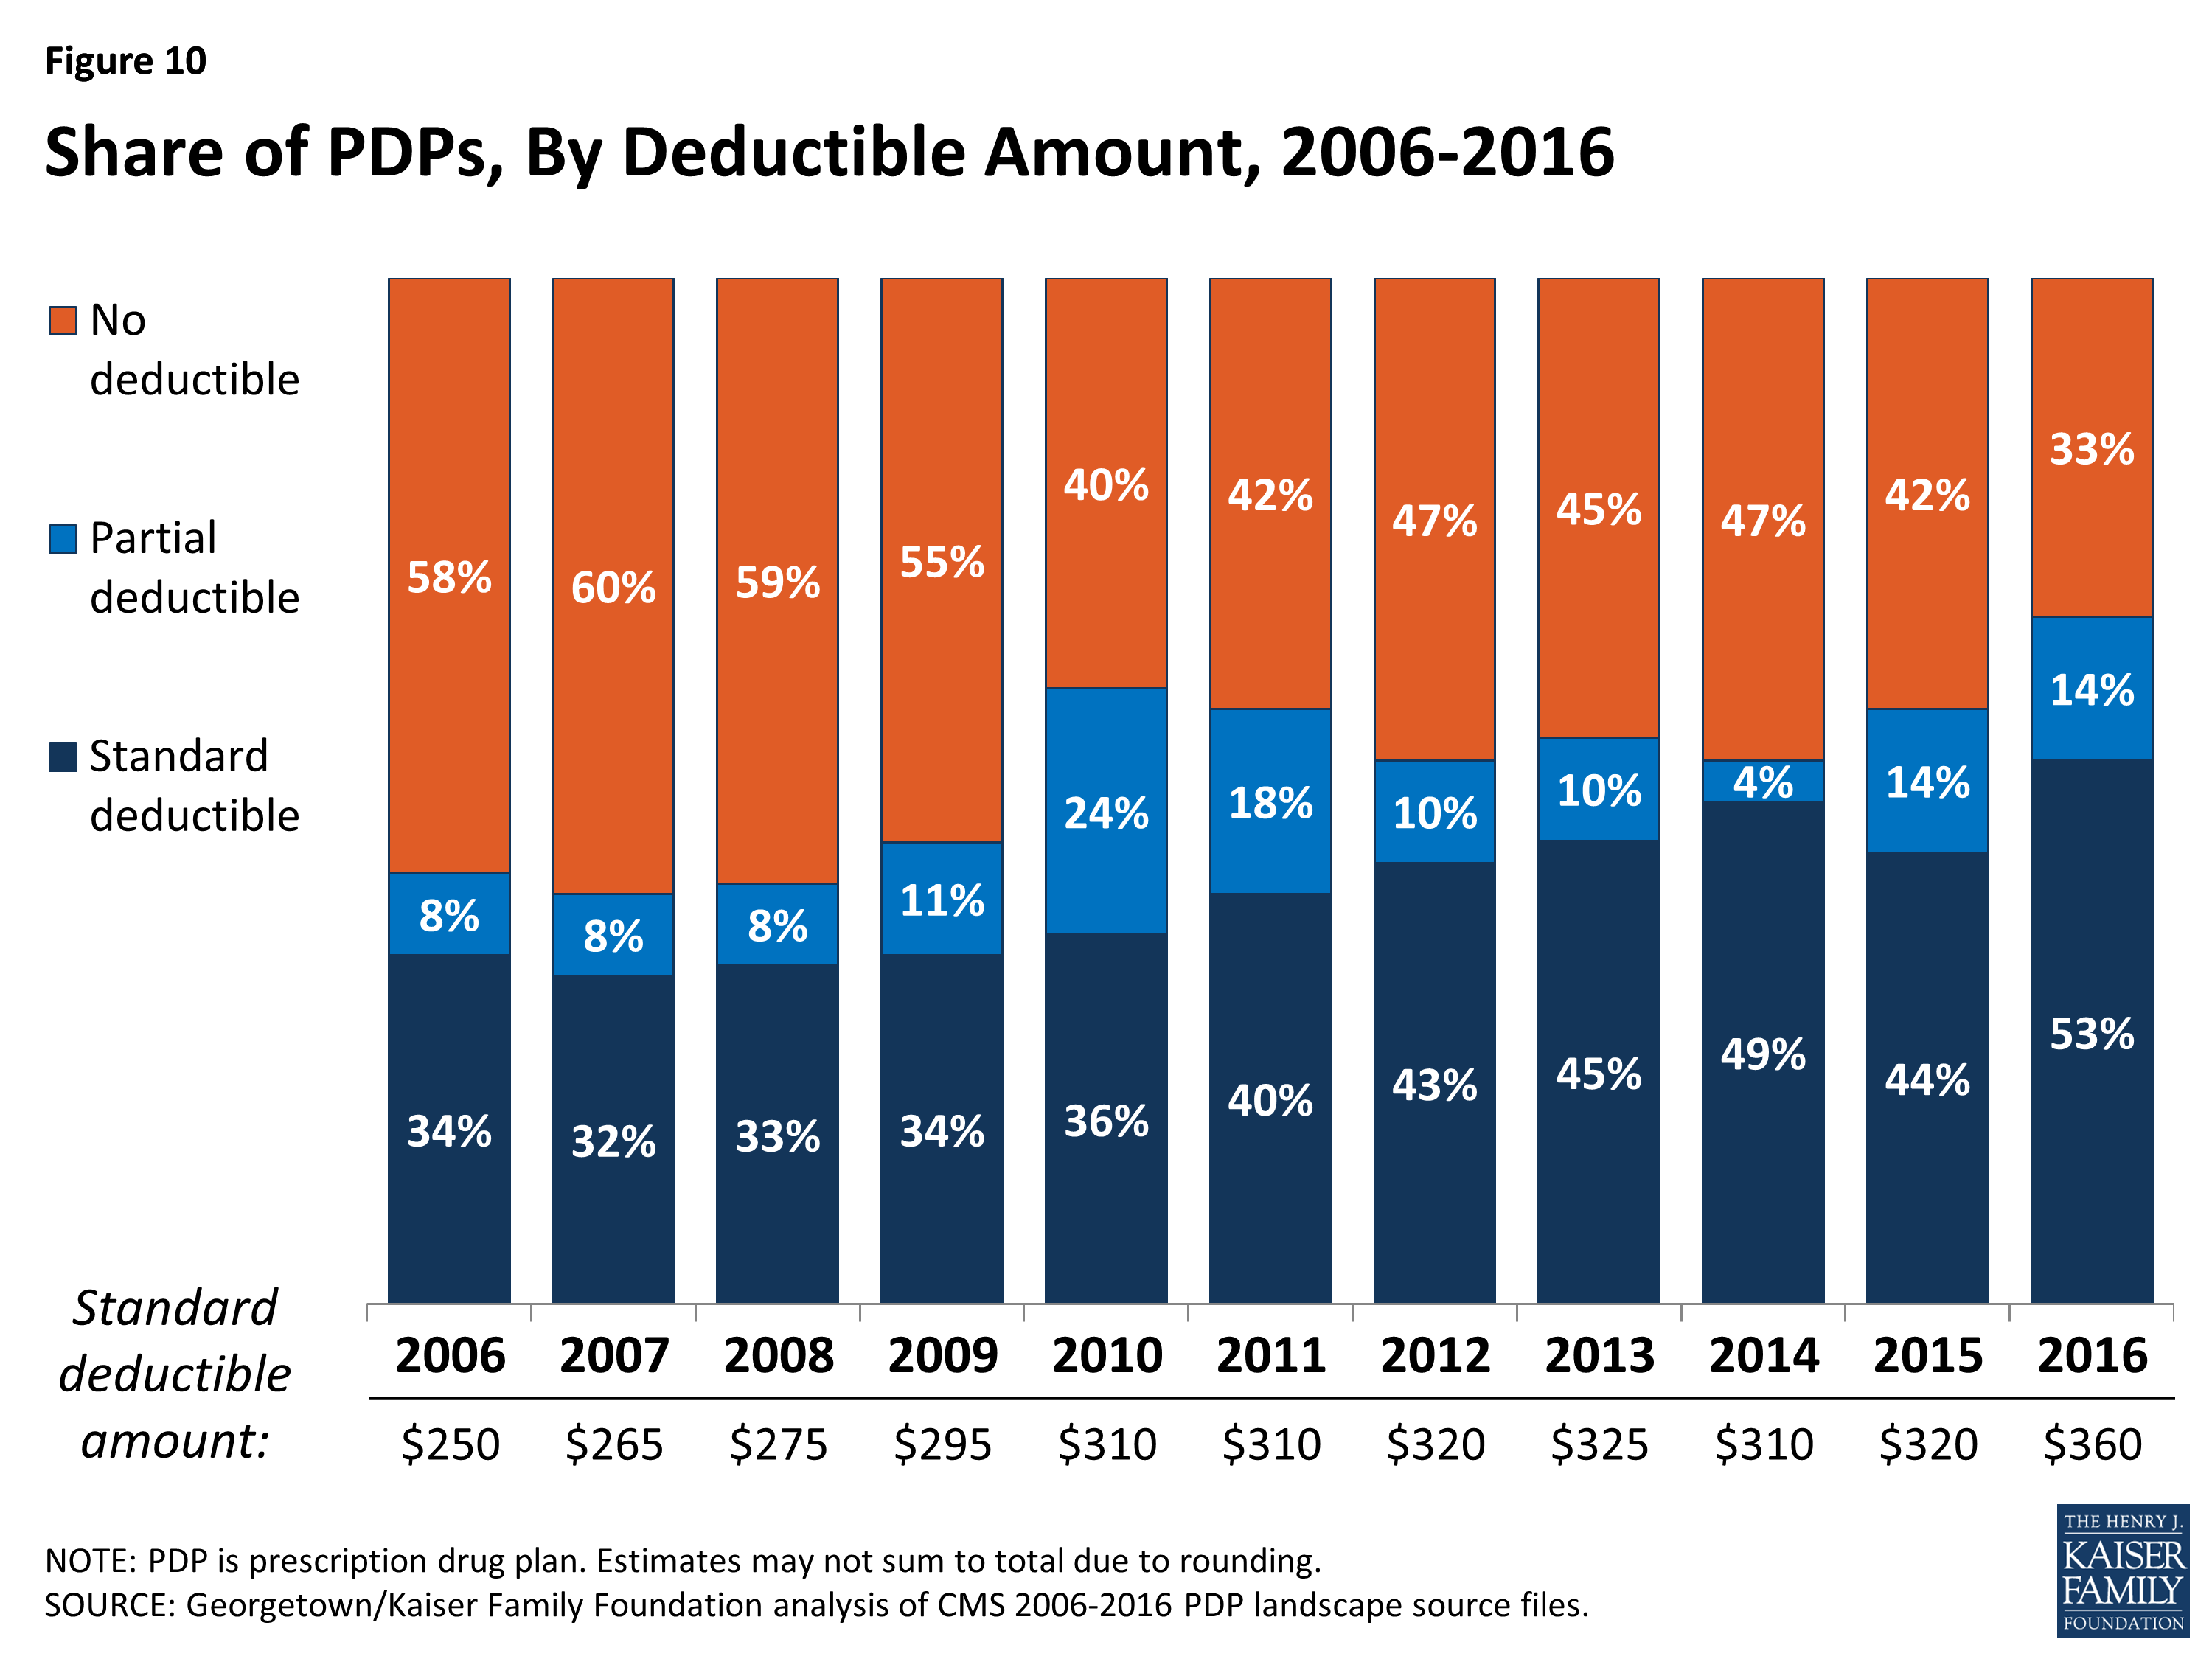
Figure 10: Share of PDPs, By Deductible Amount, 2006-2016
Tiered Cost Sharing
- The use of formulary tiers has been common since the program’s beginning in 2006, but for the second year in a row, all PDPs will use tiered cost sharing. Similar to 2015, most PDPs will use five tiers (two for generic drugs, two for brand-name drugs, and one for higher-cost specialty drugs).
- Over the years, there has been a trend toward the use of coinsurance in place of flat copayments for some formulary tiers. Coinsurance typically means higher out-of-pocket costs for more expensive drugs, such as those over $200 per month. Coinsurance has been used by nearly all plans for the specialty tier since 2006, and that coinsurance cannot exceed 33 percent. For all PDPs, the specialty tier coinsurance is set between 25 percent and 33 percent. In the program’s early years coinsurance was uncommon for other tiers, but in 2016, over 90 percent of PDPs are using coinsurance for their non-preferred brand tiers; about 40 percent do so for their preferred brand tiers.11
- For brand tiers, the typical coinsurance is 20 percent for preferred brands and 40 percent for non-preferred brands. CMS guidance allows coinsurance for these tiers to be set as high as 25 percent and 50 percent, respectively. Some PDPs have elected to set coinsurance at these maximum levels.
The Coverage Gap
The coverage gap, or “doughnut hole,” is gradually becoming a less salient feature of the Part D benefit design, as a result of changes made by the ACA. It will be fully eliminated as of 2020, when beneficiaries will only be responsible for 25 percent of their total drug costs in the gap. Since 2011, any beneficiary with drug costs high enough to reach the gap has paid less than the full cost of the price of their drugs. In 2016, manufacturer prices for brand-name drugs purchased in the gap will be discounted by 50 percent, with plans paying an additional 5 percent of the cost and enrollees paying the remaining 45 percent. Plans will pay 42 percent of the cost for generic drugs in the gap, with enrollees paying 58 percent. In 2016, the coverage gap begins after an enrollee incurs $2,960 in total drug spending and ends after an enrollee has spent a total of $4,850 out of pocket (or $7,515 in total drug costs under the standard benefit).12 At that point, catastrophic coverage begins, where enrollees generally pay only 5 percent of drug costs.
Most Part D plans will offer no gap coverage in 2016 beyond what is required by the ACA under the standard benefit. With all Part D enrollees now getting coverage for a share of their costs in the gap, the value of additional gap coverage offered by plans will become lower each year until 2020, when the gap is fully closed.
- In 2016, about 78 percent of all PDPs will offer no additional gap coverage. This is a small increase from 2015, when 74 percent of PDPs offered no additional gap coverage—meaning a slightly smaller share of plans will offer some gap coverage beyond what the ACA requires in 2016 than in 2015. One national PDP (First Health Part D Value Plus) added gap coverage, and one near-national plan (Symphonix PrimeSaver Rx) dropped gap coverage.
Tiered Pharmacy Networks
Nearly all PDPs (85 percent) use tiered pharmacy networks. In these networks, enrollees pay preferred (lower) cost sharing for their prescriptions when they use selected network pharmacies and higher cost sharing in other network pharmacies.
- The share of PDPs with tiered preferred pharmacy networks is down slightly from 87 percent in 2015, but still a significant increase from just a few years ago when only a small share of plans used this type of preferred pricing (7 percent in 2011).
The cost implications of tiered pharmacy networks for enrollees vary across PDPs.
- For example, among the national and near-national PDPs with tiered pharmacy networks, the AARP MedicareRx Saver Plus PDP charges a $20 copayment for a preferred brand drug in a pharmacy that offers preferred cost sharing and $33 in another network pharmacy that does not offer preferred cost sharing. The Humana Walmart Rx PDP charges a $1 copayment for preferred generic drugs and $4 for non-preferred generics at a pharmacy with preferred cost sharing, compared to $10 and $33, respectively, at other network pharmacies where preferred cost sharing is not offered. These differentials are somewhat smaller than in 2015.
Low-income Subsidy (Benchmark) Plans
In 2016, the total availability of premium-free (benchmark) plans—that is, PDPs available for no monthly premium to Low-Income Subsidy (LIS) enrollees—will be at its lowest level in the program’s ten years (Figure 11; Appendix 1, Table A3).
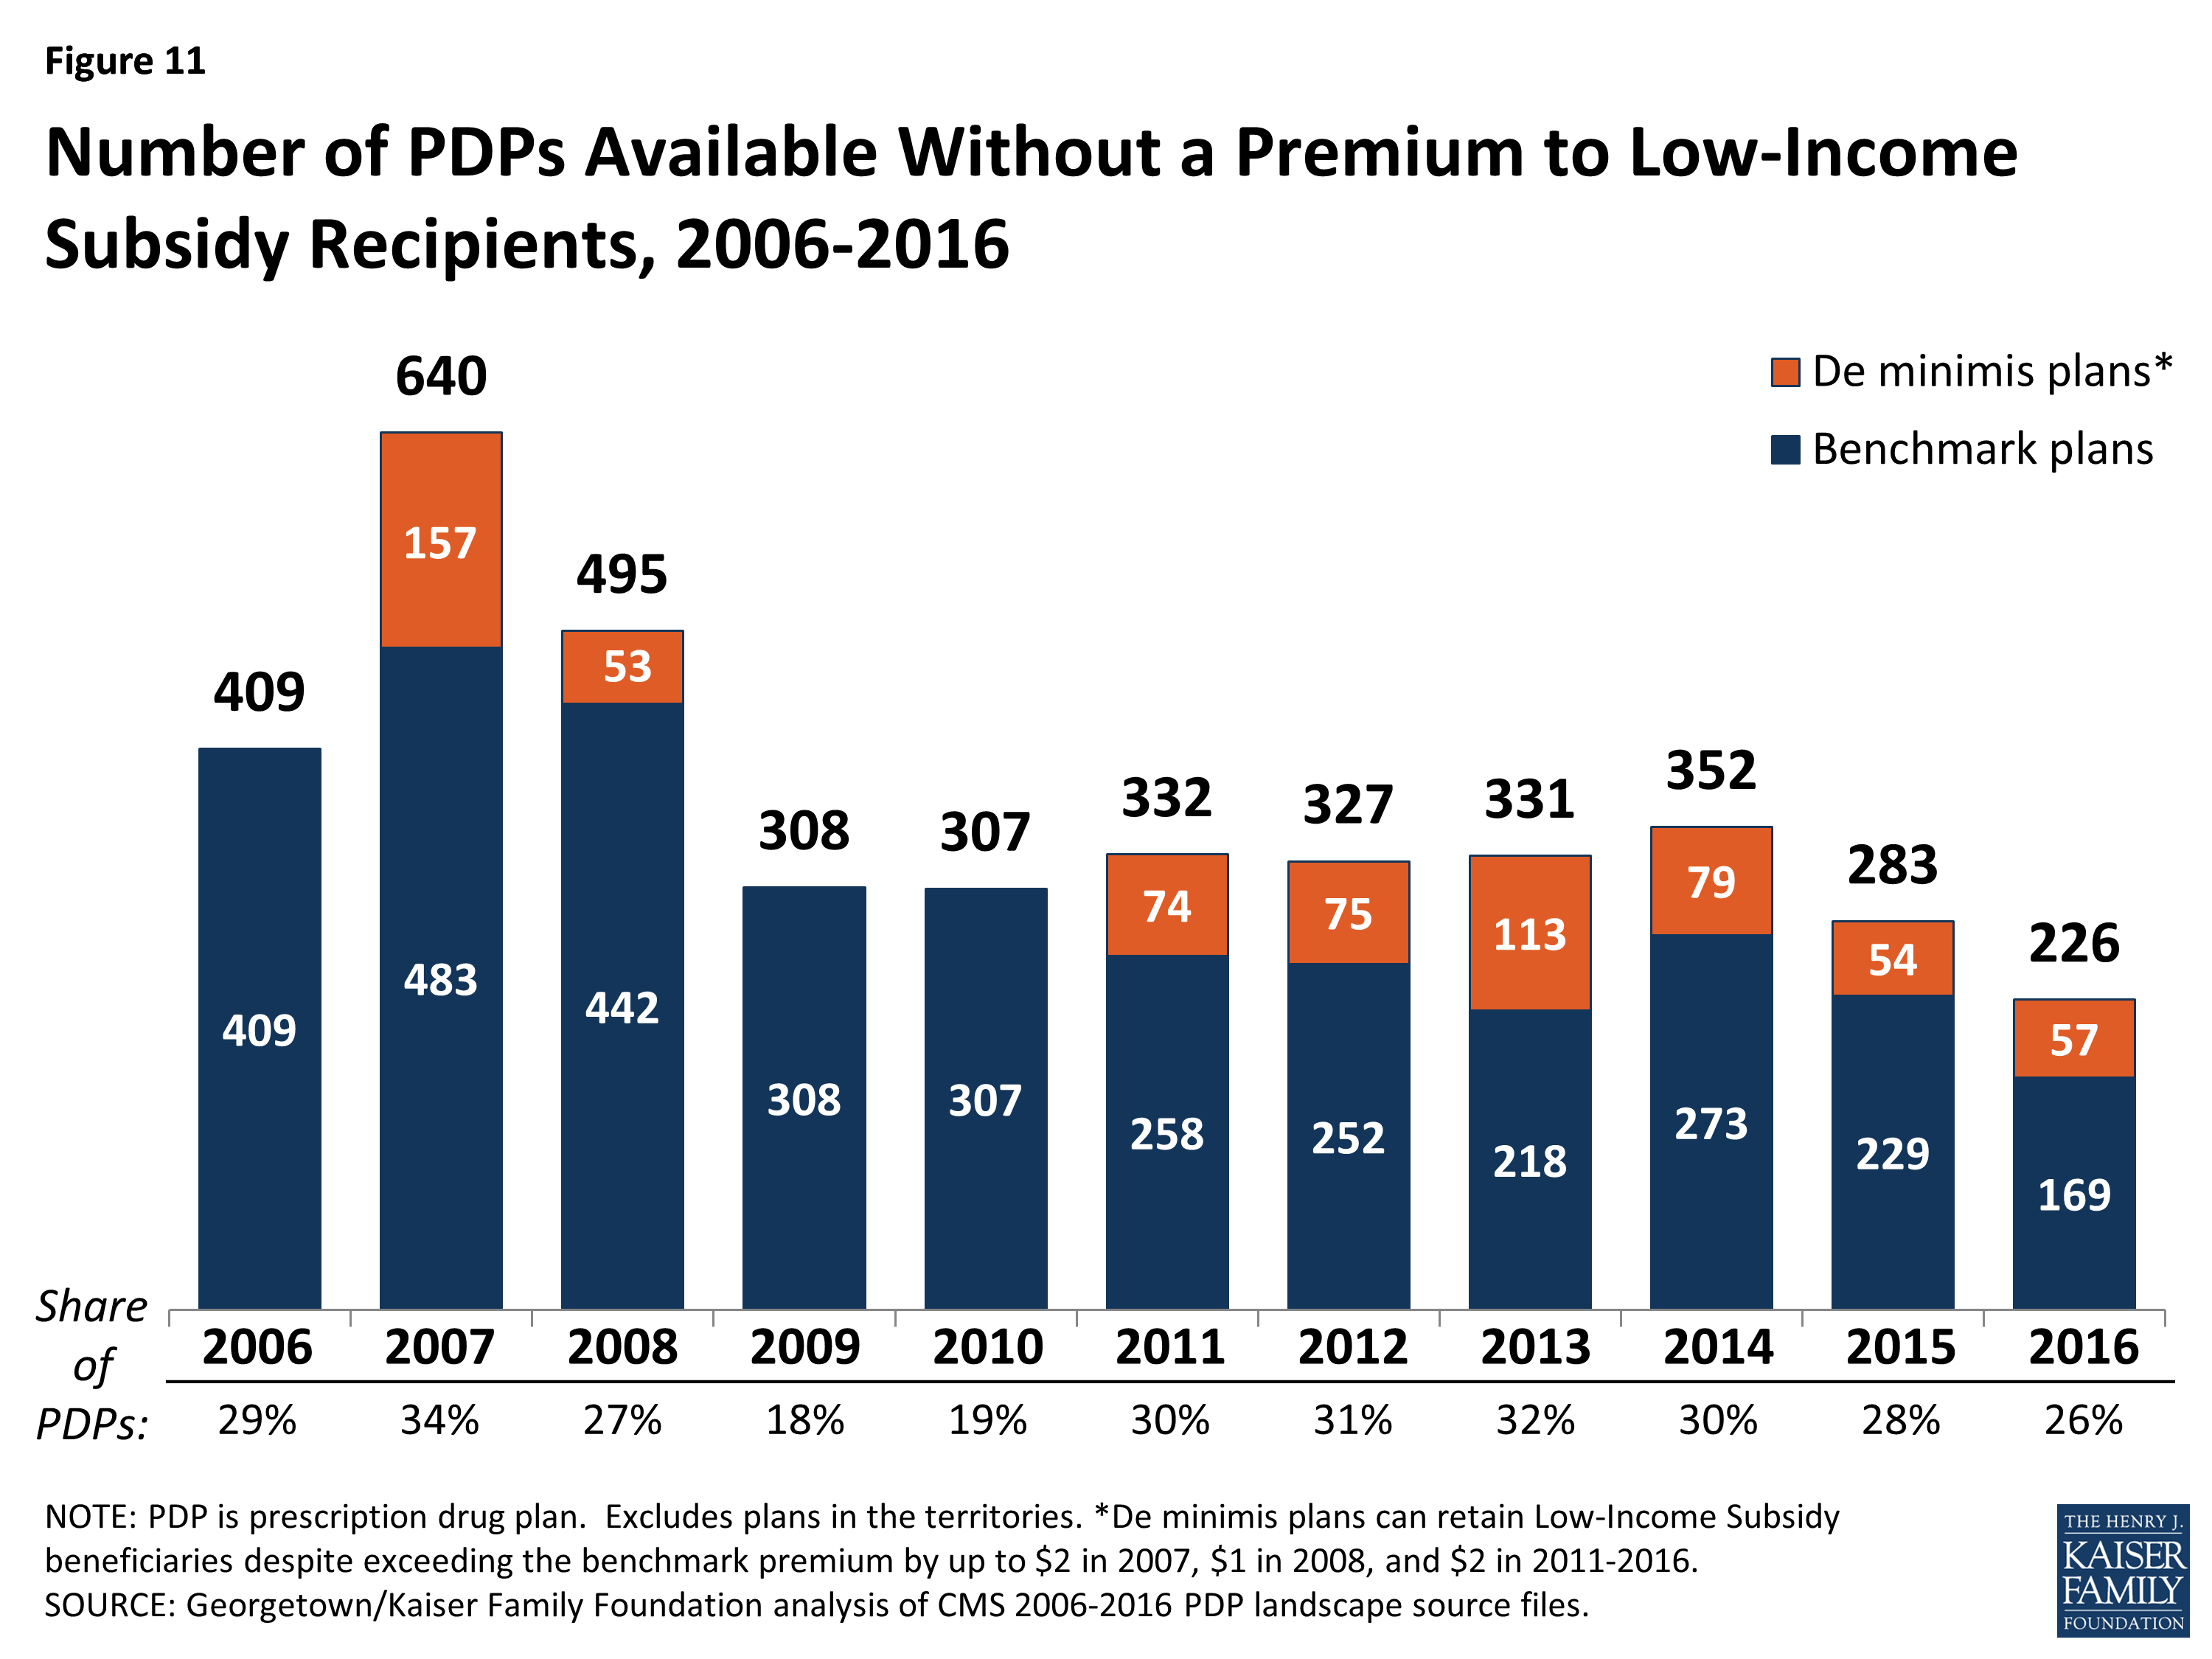
Figure 11: Number of PDPs Available Without a Premium to Low-Income Subsidy Recipients, 2006-2016
- In 2016, 226 plans will be available for enrollment of LIS recipients for zero premium. This represents a 20 percent decrease in plans for LIS recipients, or 57 fewer plans than in 2015 and 126 fewer plans than in 2014.
- On average (weighted by enrollment), LIS have 7 benchmark plans available to them for 2016, or about one-fourth the number of PDP choices available overall. All LIS enrollees retain the option to select other plans offered in their area, but if they enroll in a non-benchmark plan, they must pay a share of the monthly premium.
- Of the 226 benchmark plans in 2016, about one in four (57 plans) qualify through the “de minimis” policy—about the same number as the 54 “de minimis” plans in 2015. Policies adopted by CMS in previous years make it easier for PDPs to qualify as benchmark plans, including the “de minimis” policy that allows plans to waive a premium amount of up to $2 in order to retain their LIS enrollees.13
- Among the 2015 benchmark plans, 72 PDPs have lost their benchmark status due to either higher premiums in 2016 or to a lower regional benchmark in 2016 (one other exited the market completely). About 742,000 LIS beneficiaries (9 percent of LIS enrollment in PDPs in 2015) are enrolled in these 73 plans, meaning these beneficiaries may experience some disruption in their coverage for 2016. In 2016, 25 PDPs will newly qualify for benchmark status: 14 PDPs new to the program and 11 older PDPs (in nine other cases, two benchmark PDPs were consolidated by the plan sponsor).
Availability of Benchmark Plans by Region
The number of benchmark plans available in 2016 will vary by region, from 10 benchmark PDPs in the Arizona, Idaho/Utah, and Pennsylvania/West Virginia regions to just 2 benchmark PDPs in the Hawaii region (out of 21 PDPs overall) and 3 (of 22) in the Florida region (Figure 12).
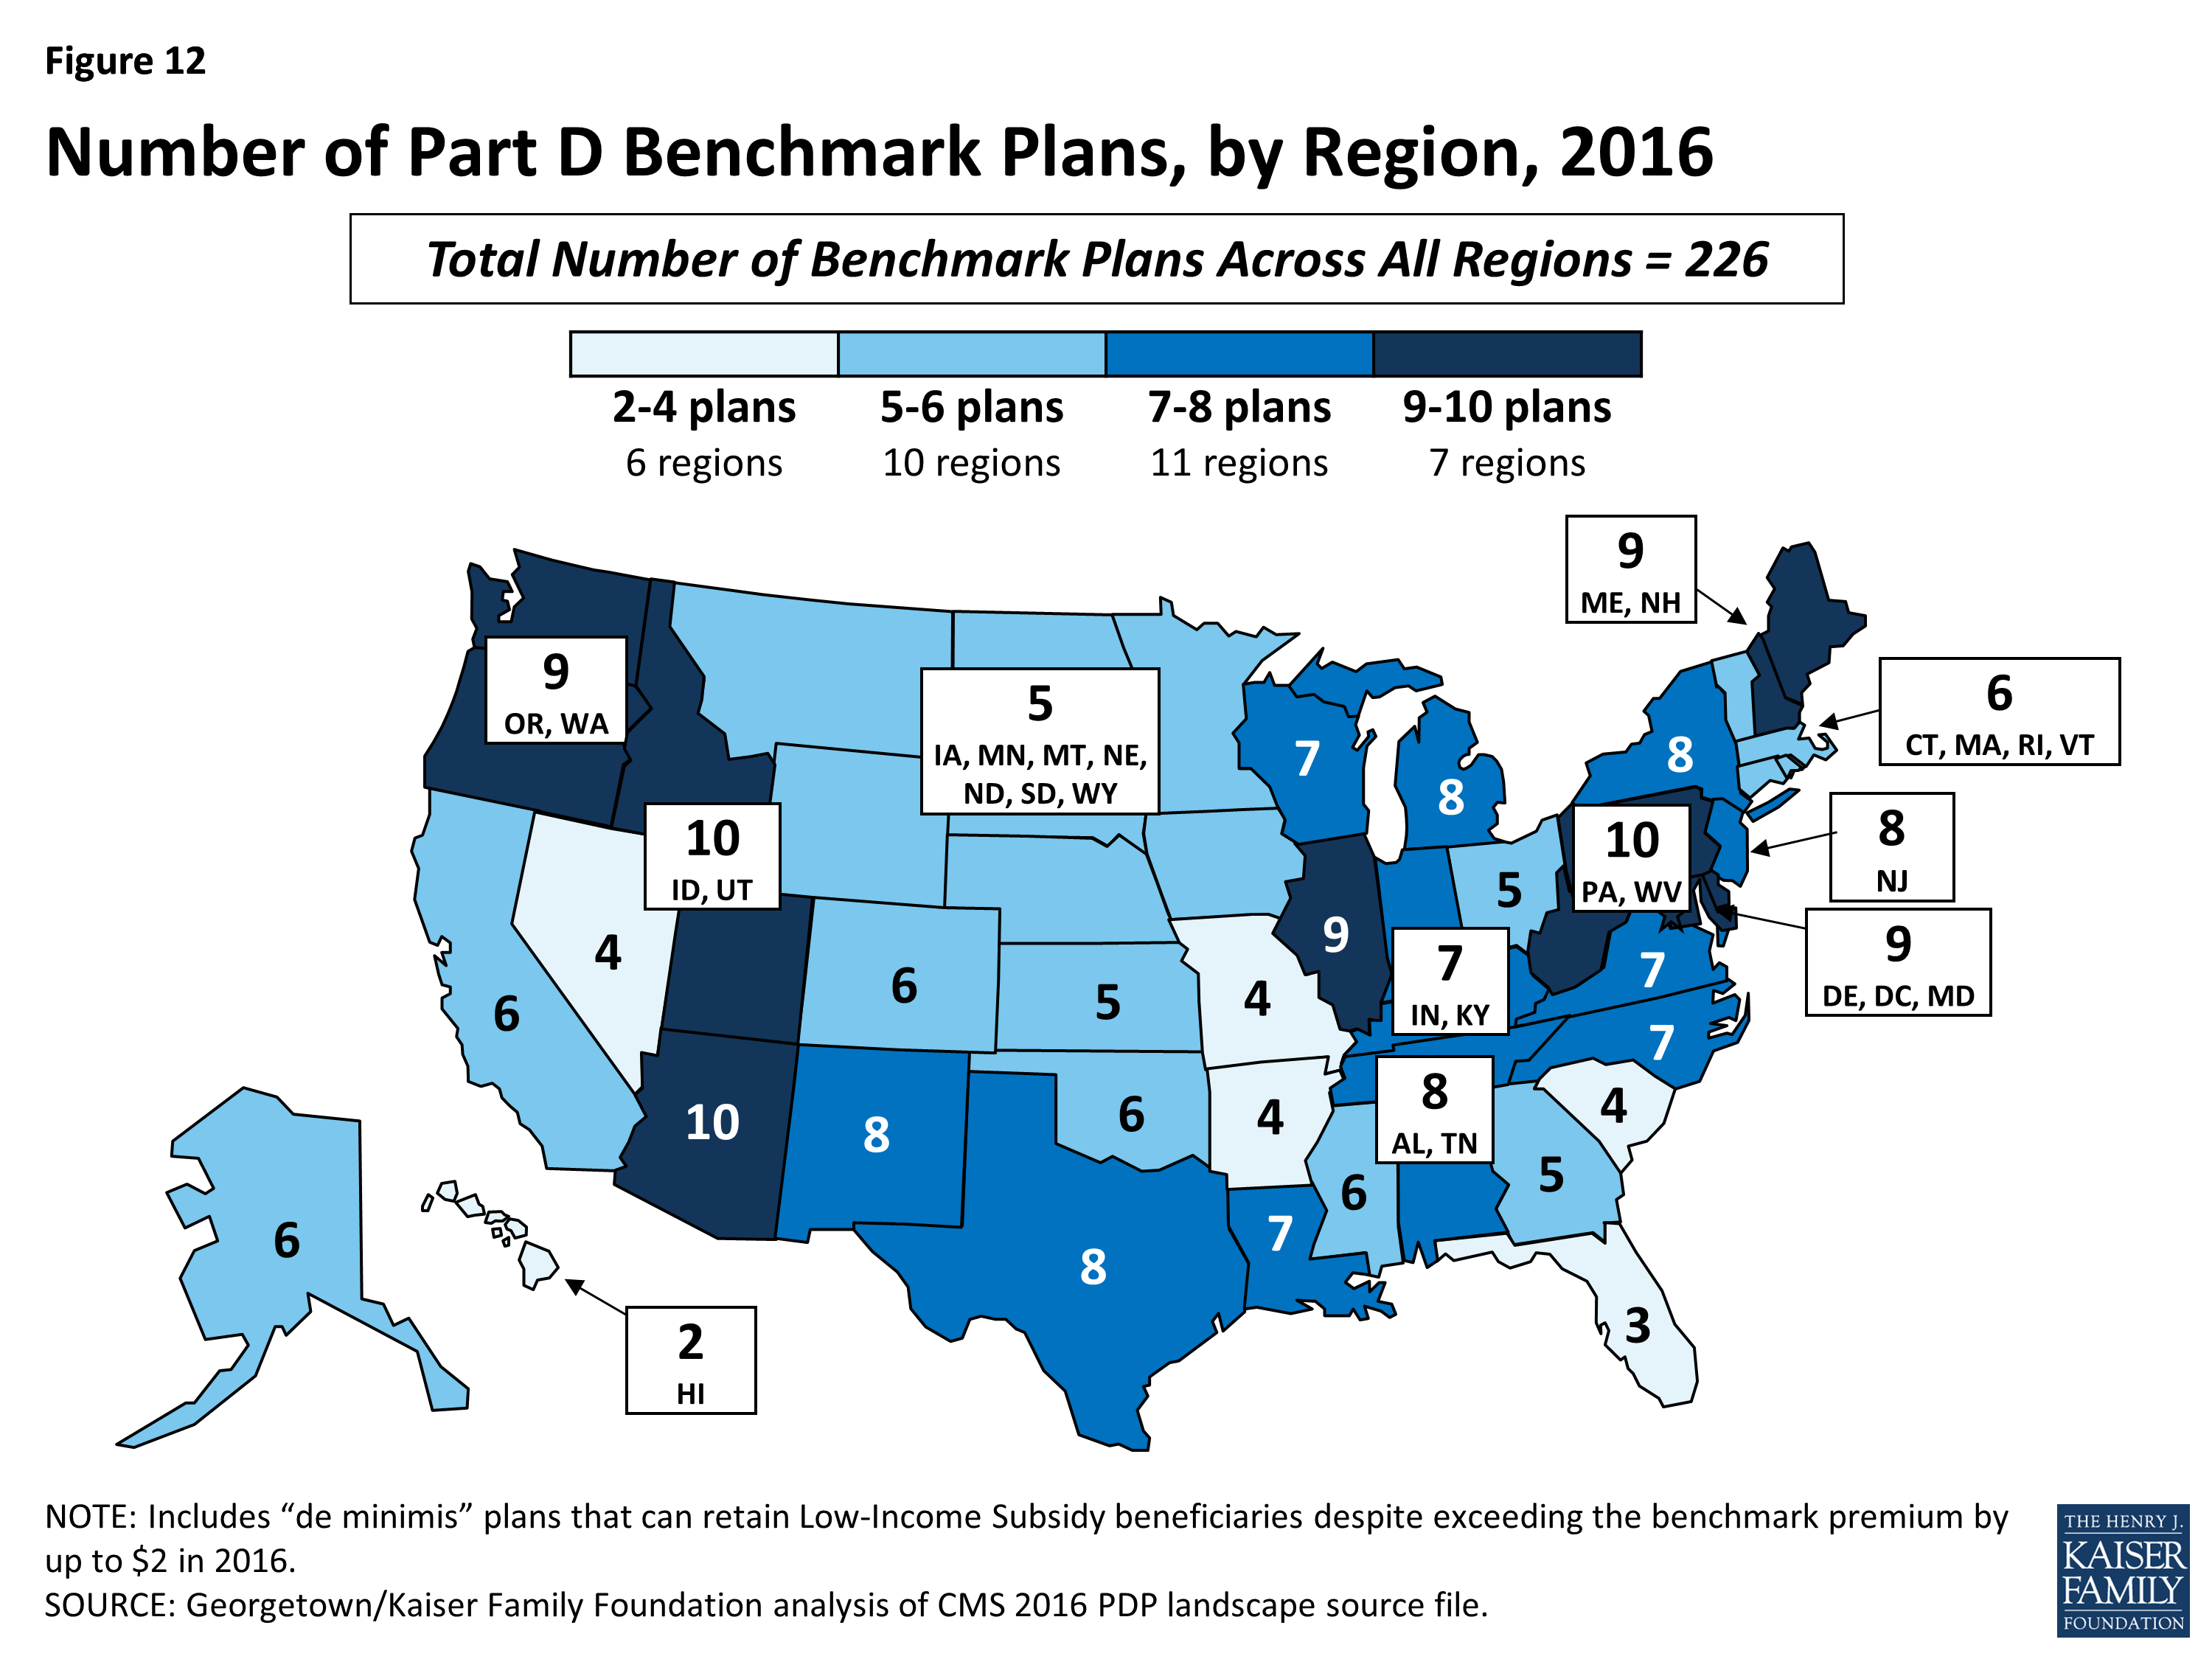
Figure 12: Number of Part D Benchmark Plans, by Region, 2016
- Benchmark plan availability will decline in 26 of 34 regions between 2015 and 2016, while one additional benchmark plan will be available in 3 regions (Figure 13).
- Year-to-year changes in most regions are relatively modest; the largest change is the loss of seven benchmark plans in the Hawaii region, after gaining five benchmark plans for 2015 and losing six for 2014. As a result of losing this many benchmark plans, 92 percent of Hawaii’s LIS beneficiaries are projected to pay a premium unless they are reassigned or switch plans. In five other regions, between 40 percent and 50 percent of LIS beneficiaries are in this same situation. In regions where the availability of benchmark plans is more stable, the share of affected LIS beneficiaries is much smaller.
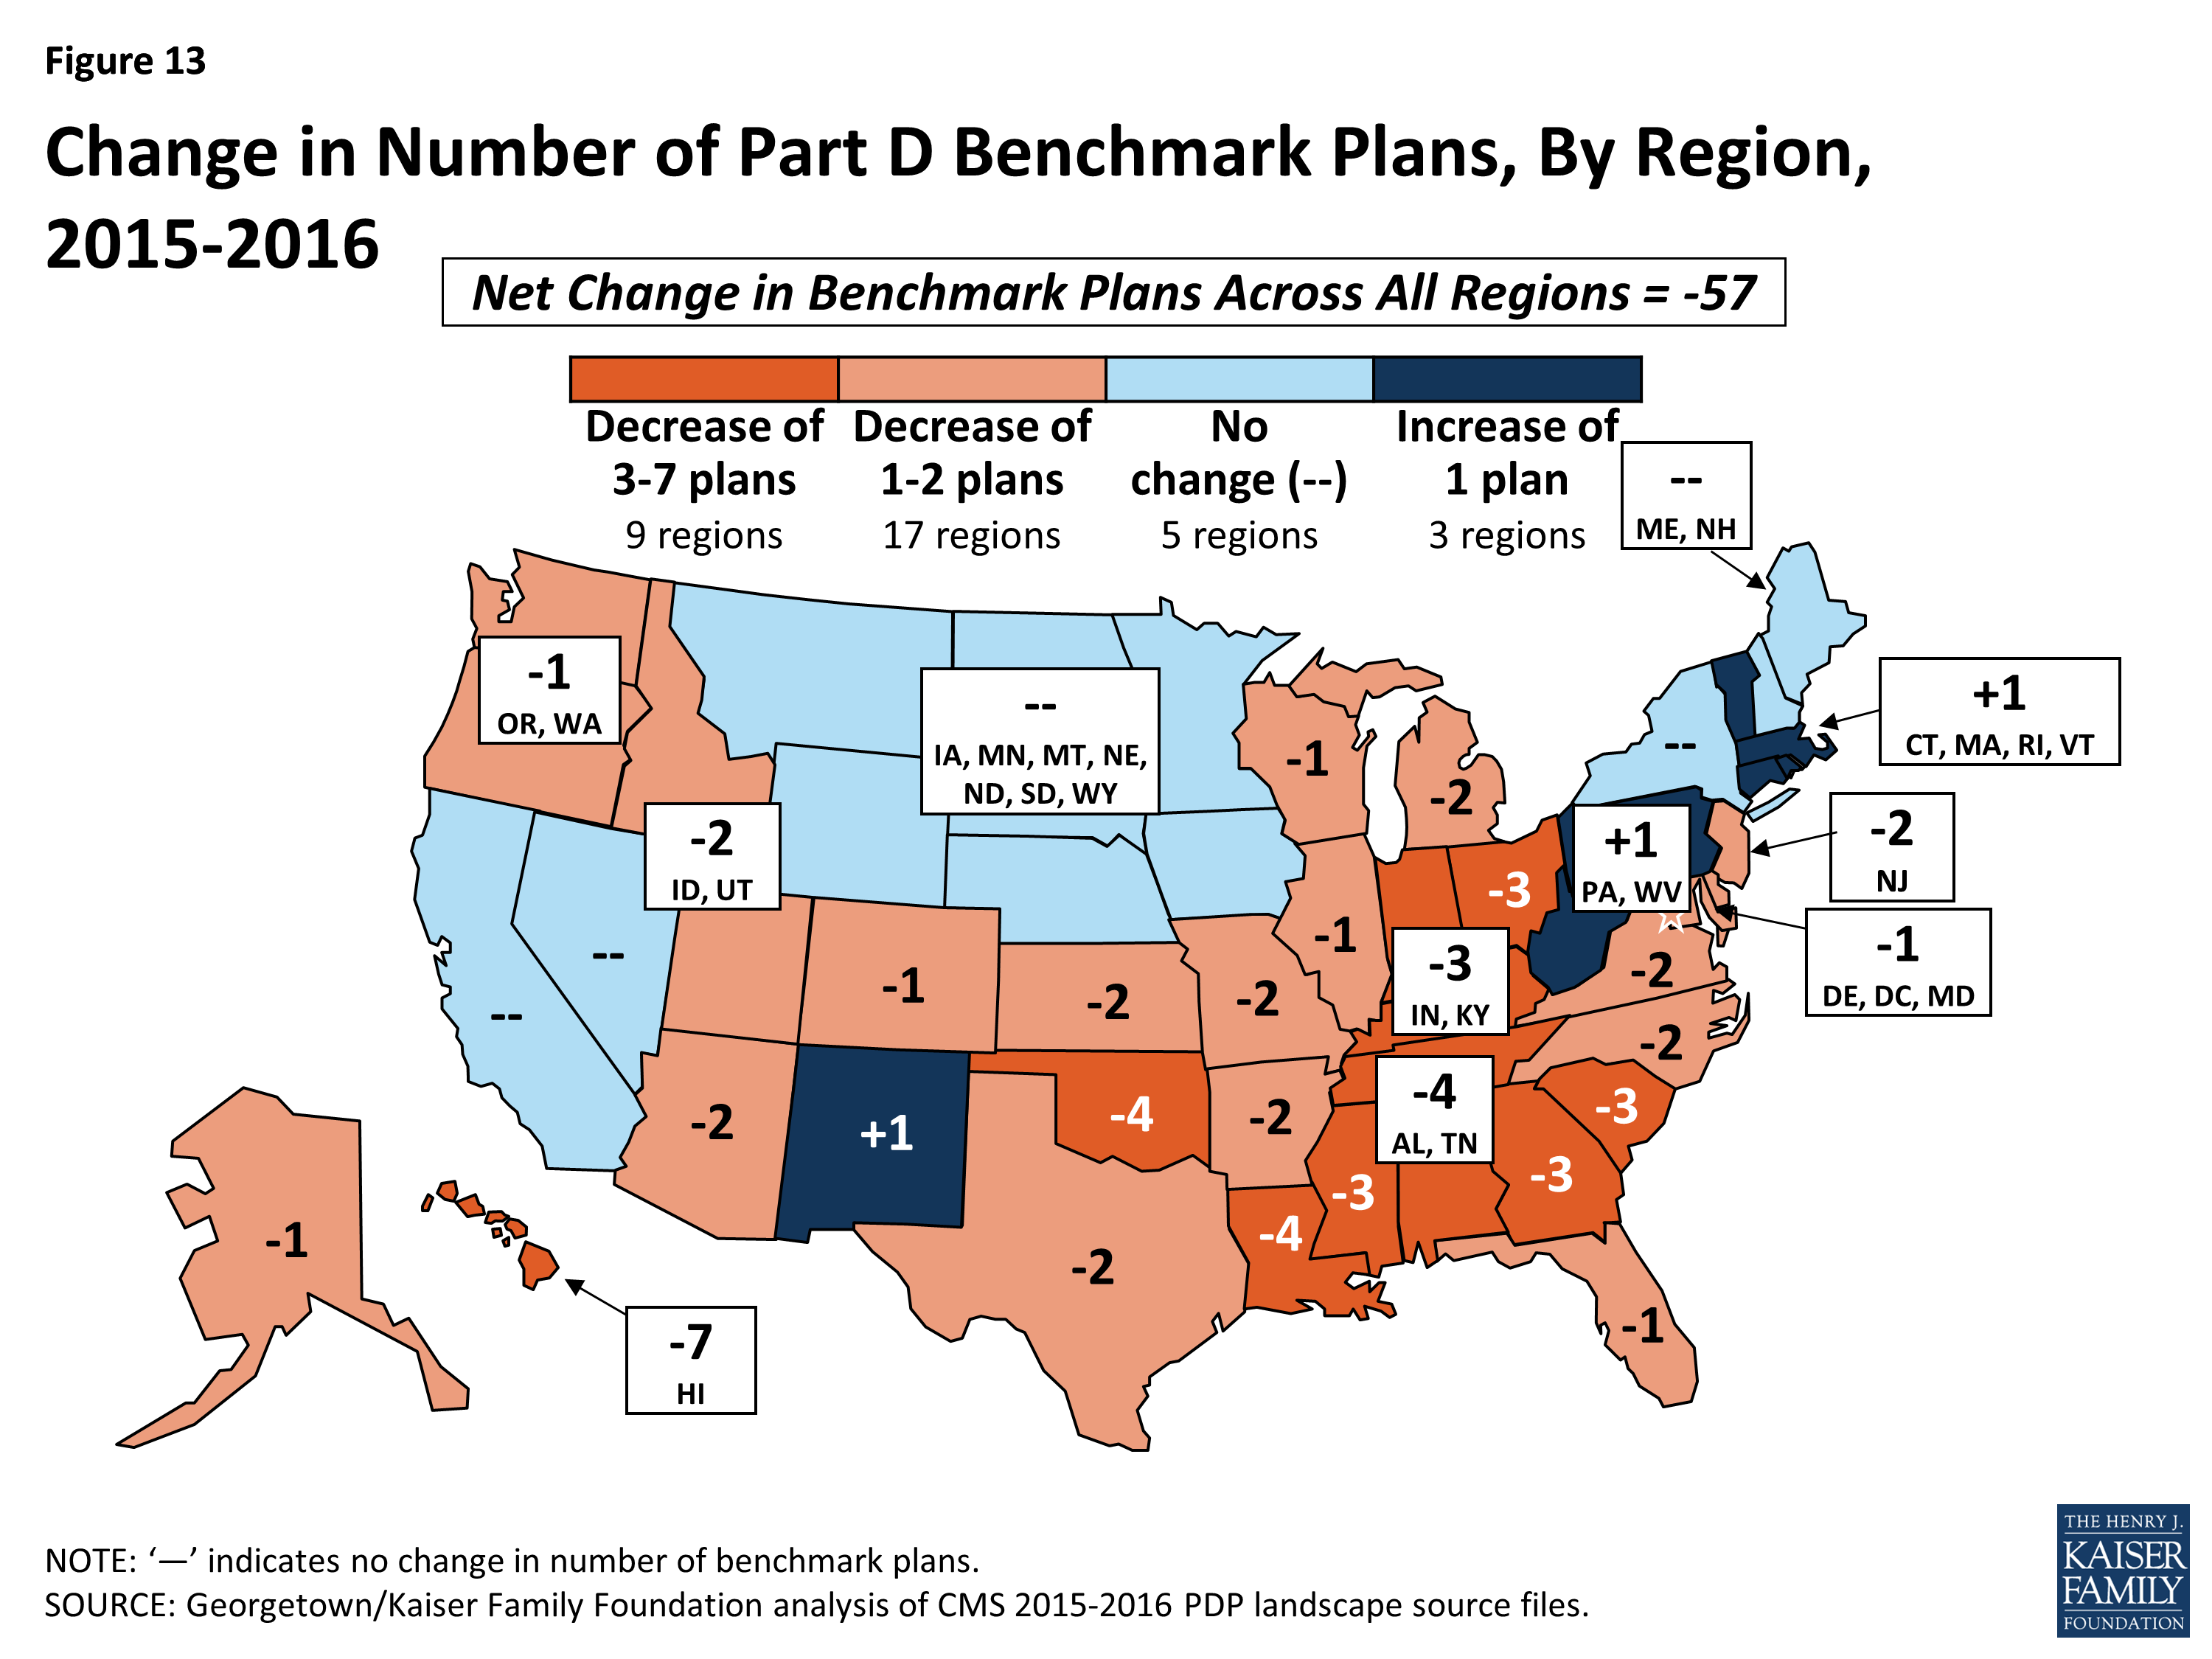
Figure 13: Change in Number of Part D Benchmark Plans, By Region, 2015-2016
Impact of Benchmark Plan Changes for Low-Income Subsidy Enrollees
About 1.9 million people—about one in four LIS beneficiaries (24 percent)—are enrolled in PDPs in 2015 that will not qualify as benchmark plans in 2016 (Figure 14).
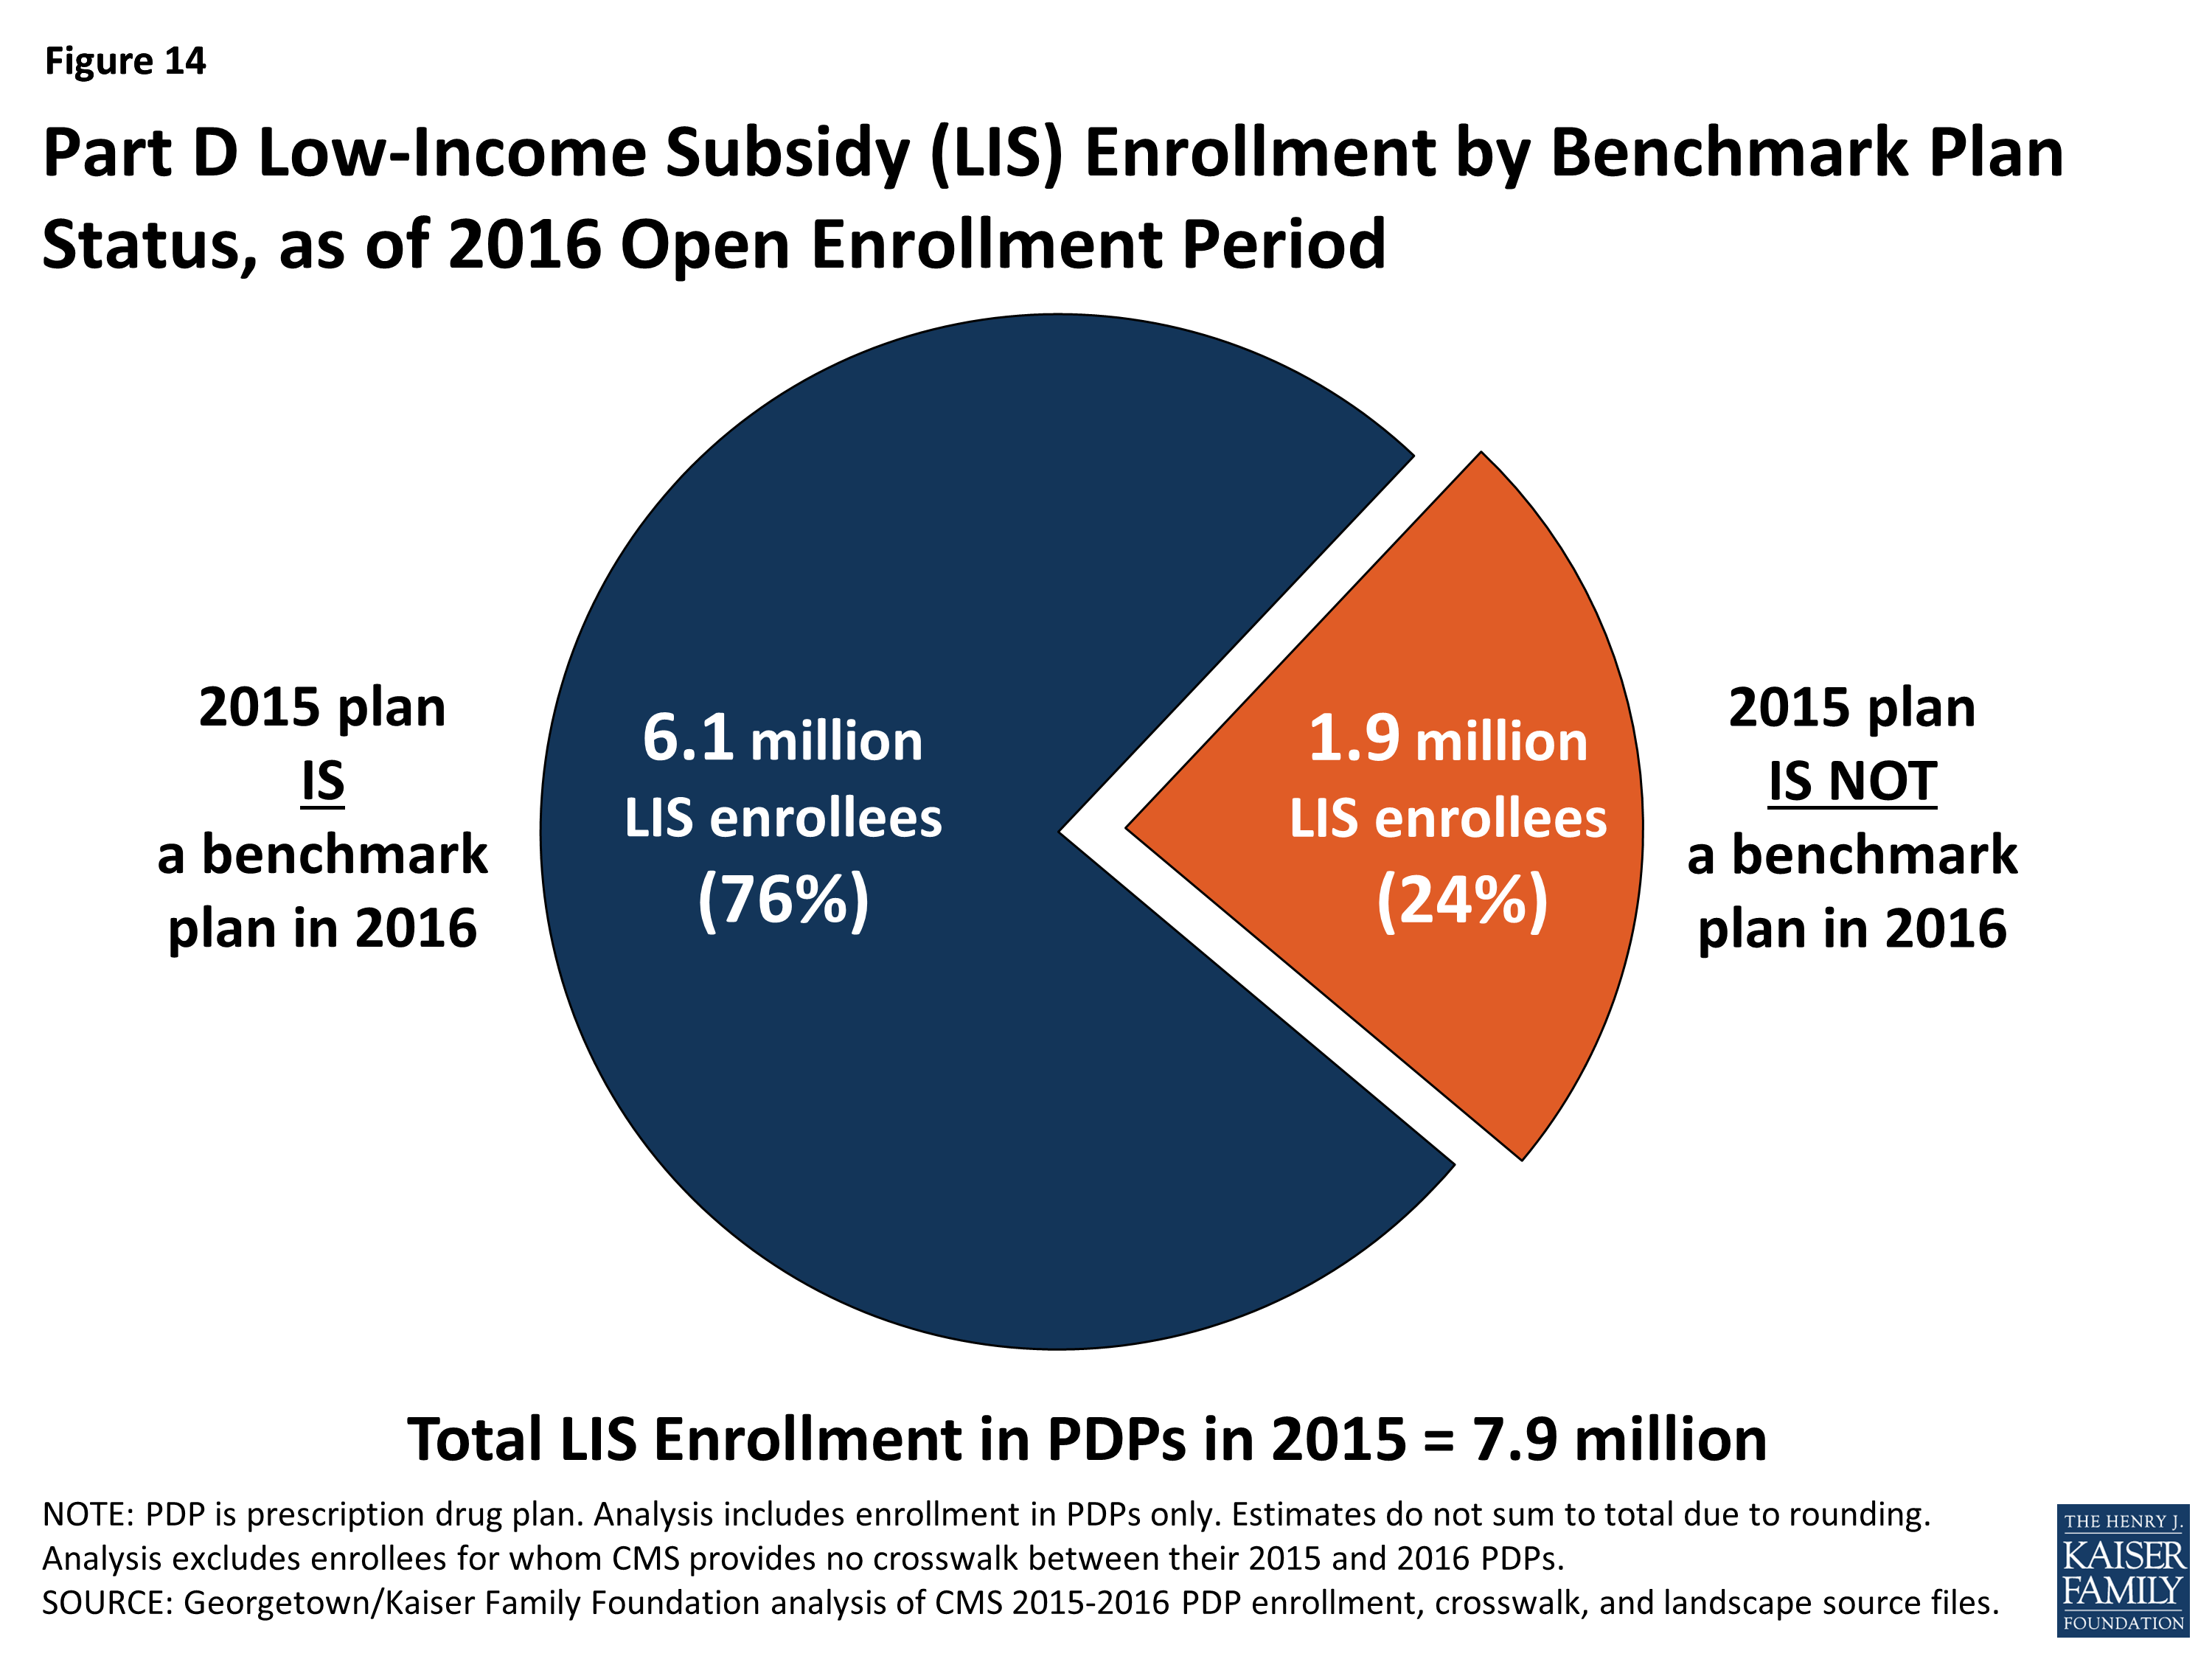
Figure 14: Part D Low-Income Subsidy (LIS) Enrollment by Benchmark Plan Status, as of 2016 Open Enrollment Period
- This group includes 742,000 beneficiaries who were in benchmark plans in 2015; the remaining three-fifths (60 percent) of these beneficiaries are currently enrolled in non-benchmark plans and thus paid a premium in 2015.
- About 764,000 LIS enrollees will pay premiums of at least $20 per month and about 53,000 LIS enrollees will pay premiums of at least $50 per month if they do not switch to other PDPs.
- The number of LIS beneficiaries who will potentially pay a premium in 2016 unless they enroll in (or are switched to) benchmark plans (1.9 million) is up slightly from the 1.8 million LIS beneficiaries who were in a similar situation at the time of the open enrollment period for 2015. CMS will reassign those LIS enrollees who were randomly assigned by CMS to their current plan, and several states will help reassign those enrolled in their state pharmacy assistance programs (SPAPs).14 Effective for January 2015, CMS reassigned about one-fifth of those scheduled to pay a premium. Many other LIS beneficiaries who are currently not enrolled in plans that will be premium-free in 2016 must switch plans on their own or pay a premium if they remain in their 2015 plan. Those in the latter group will not be automatically reassigned by CMS because in the past they or someone assisting them made a choice to switch plans. Most affected LIS beneficiaries will receive a letter from CMS or their SPAP either informing them of their reassignment or reminding them that they can choose a different plan and avoid paying a premium.
Benchmark Plans by Plan Sponsor
The number of premium-free plans for LIS enrollees offered by the major Part D organizations has fluctuated substantially over the years.
- For 2016, six PDP sponsors will offer benchmark plans in at least half of the 34 regions.15 No sponsor will offer benchmark plans in all 34 regions in 2016; three sponsors (Aetna, CVS Health, and Humana) offer benchmark plans in at least 33 regions.
- In 2015, about 70 percent of LIS enrollees in PDPs are in plans operated by just four plan sponsors (CVS Health, Humana, UnitedHealthcare, and Cigna) (Figure 15). The first two of these sponsors offer PDPs that qualify as benchmark plans in at least 32 of the 34 PDP regions in 2016. By contrast, UnitedHealth offers PDPs that qualify as premium-free in 15 regions in 2016, down from 33 in 2015. Cigna offers PDPs that qualify as premium-free in 12 regions in 2016, down from 23 in 2015. Over half of the LIS beneficiaries projected to pay premiums are currently enrolled in UnitedHealth or Cigna PDPs.
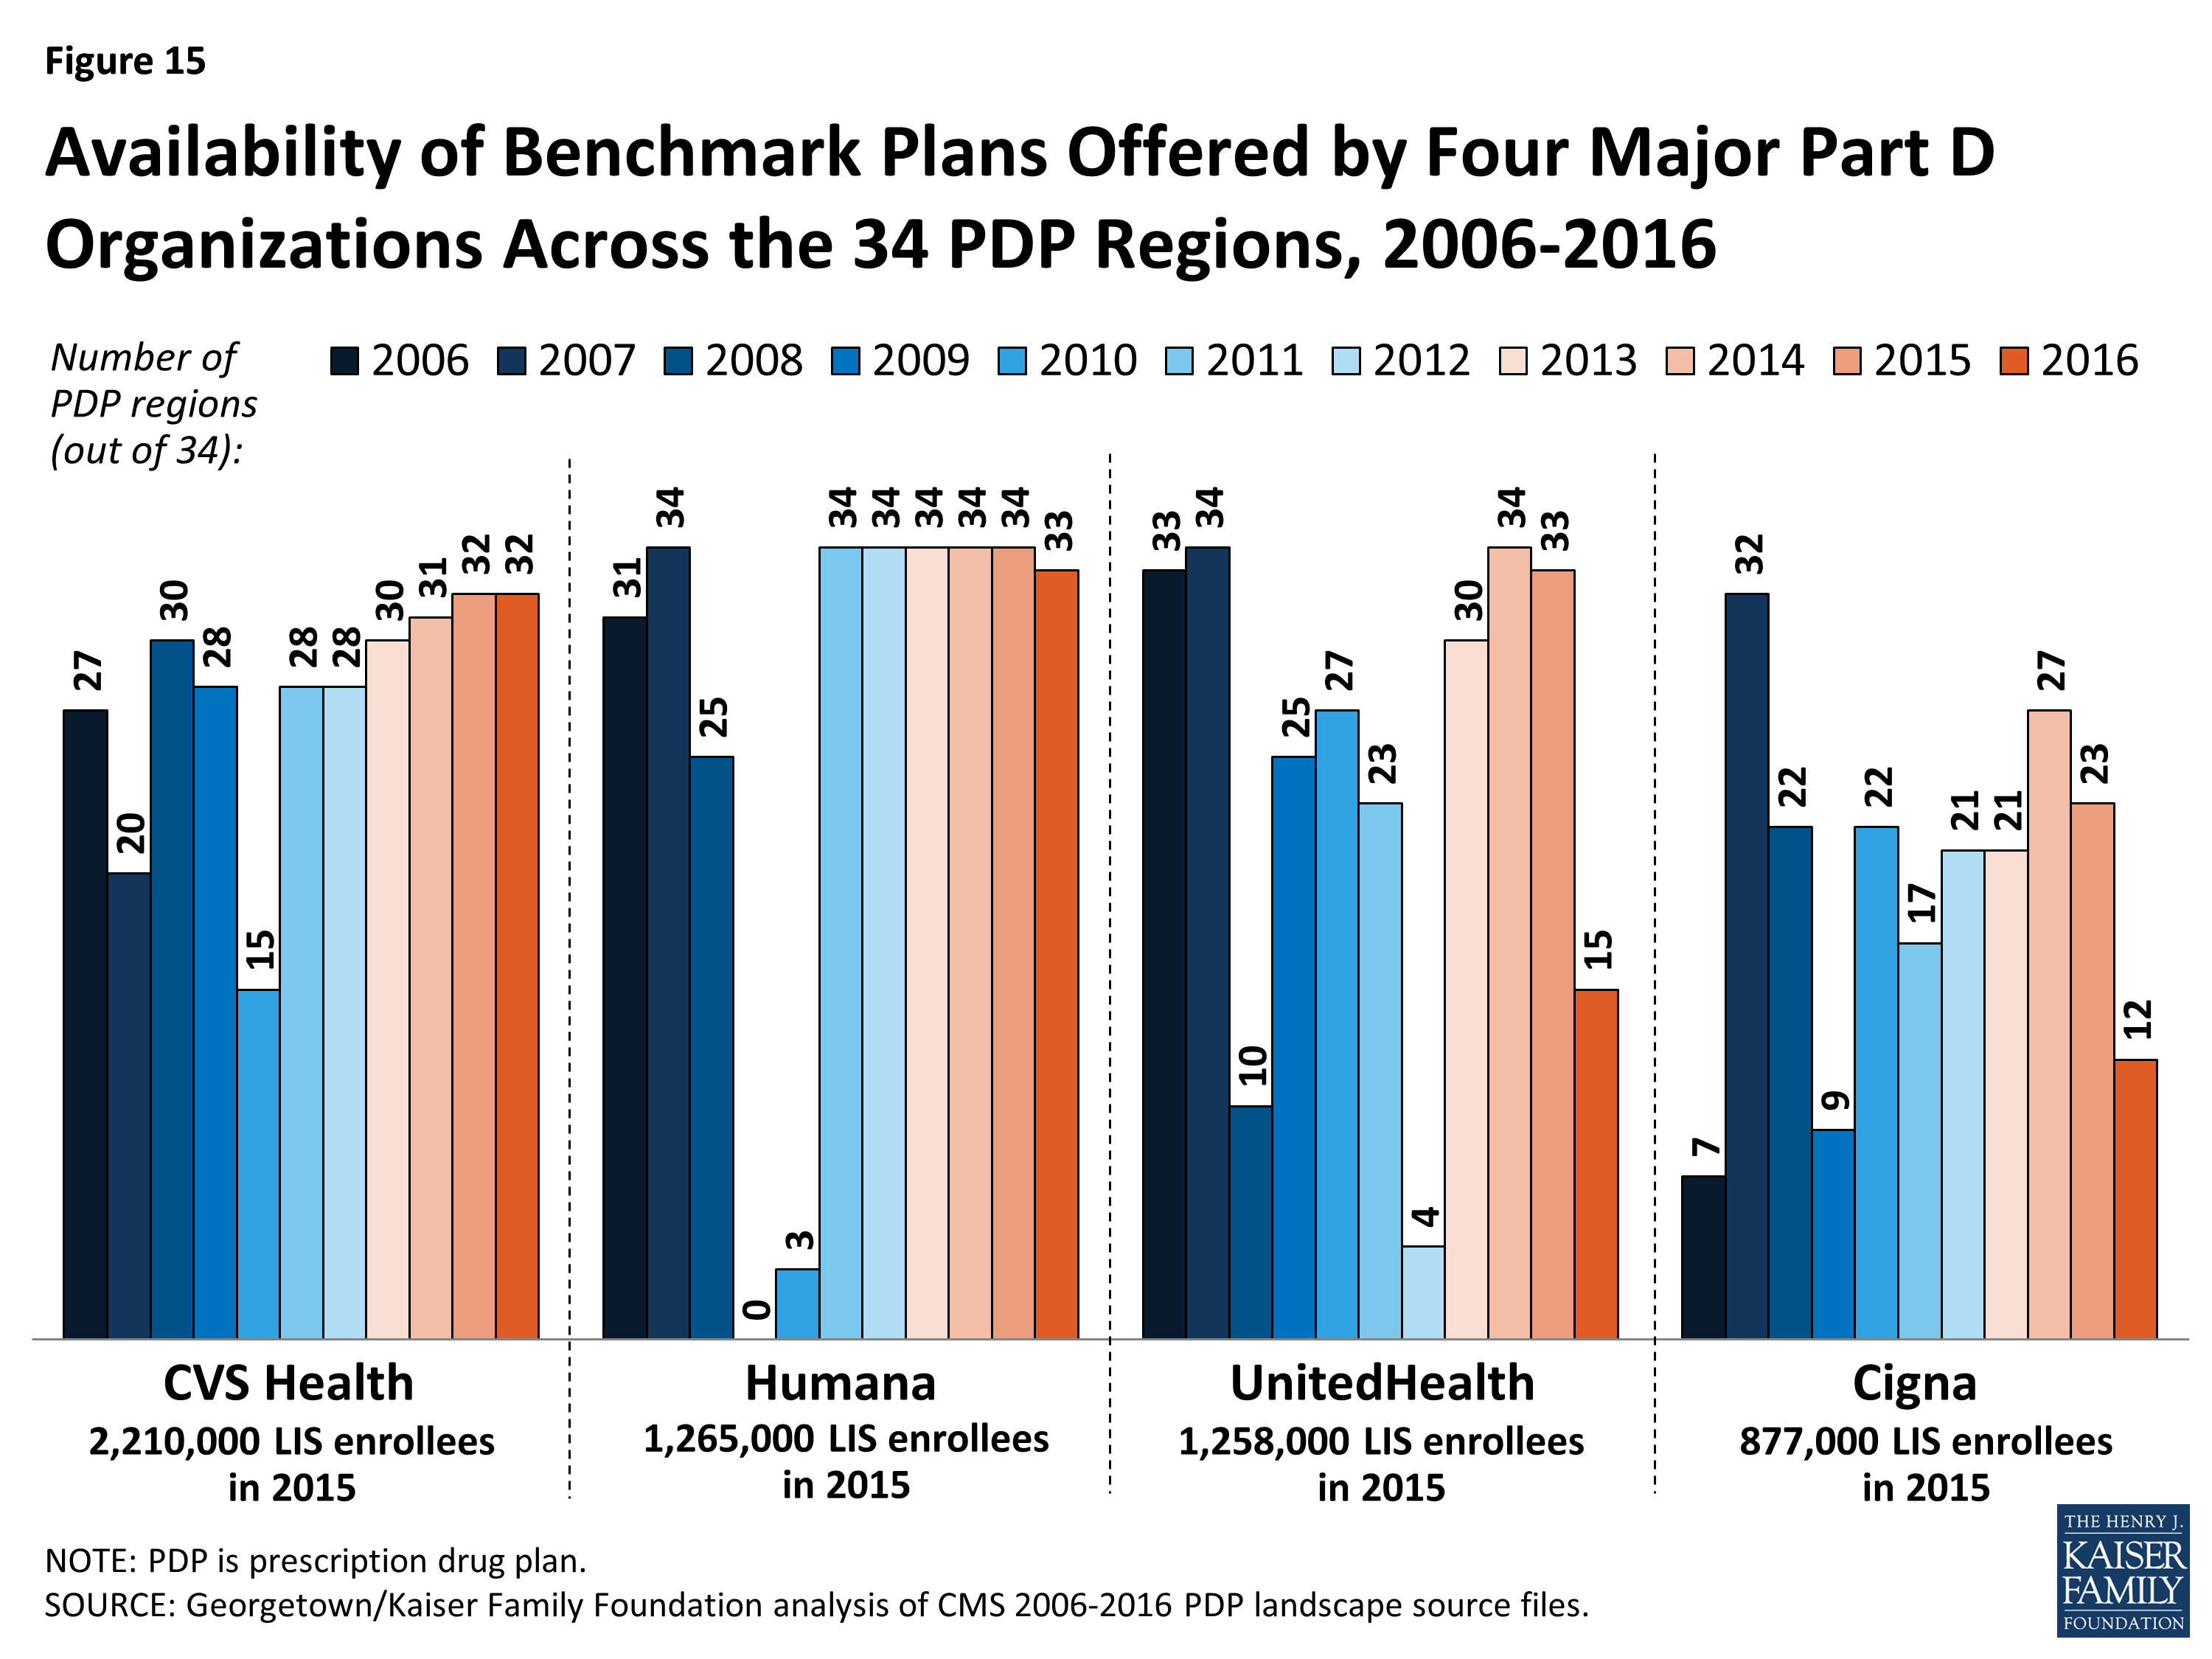
Figure 15: Availability of Benchmark Plans Offered by Four Major Part D Organizations Across the 34 PDP Regions, 2006-2016
- The LIS enrollees in PDPs offered by these sponsors are split between premium-free benchmark plans and other plans operated by these sponsors. For example, 64 percent of UnitedHealthcare’s LIS enrollees are in non-benchmark PDPs and thus pay premiums of $21.06 on average. Many of them are in the AARP MedicareRx Preferred PDP, which qualified as a benchmark PDP in the program’s earlier years.
Discussion
This review of the Part D plan landscape for 2016 and changes over time indicates that most PDP enrollees can expect to see some changes in their prescription drug coverage and costs in 2016. For most enrollees, premiums are projected to be higher in 2016 than in 2015, and many will also see higher deductibles and more cost-sharing tiers with coinsurance. LIS enrollees will have fewer PDP options available at a zero premium, and many be reassigned to different plans or will need to switch to a different plan to continue without a premium. Beneficiaries have options during open enrollment to select plans that better meet their needs, including plans with lower premiums. Although premiums tend to be the most visible feature when comparing plans, beneficiaries need to consider other factors, especially whether their drugs are on a plan’s formulary, whether their usual pharmacy offers preferred cost sharing, and the total out-of-pocket costs (including both premiums, deductibles, and cost sharing) for coverage of their prescription drug needs.
Changes in Part D plan costs and benefit design from one year to the next have been a defining featuring of the program since its beginning. The reduced number of PDPs for 2016 could make the process of comparing and reviewing plan options a little easier for beneficiaries to undertake during the open enrollment period, but the more than two dozen PDP options in each region may still discourage many from reevaluating their choices. While the annual enrollment period is the best opportunity for people on Medicare to evaluate their plan options and make changes, our analysis of plan switching by PDP enrollees not receiving the LIS showed that about 87 percent stayed in the same plan in annual enrollment periods between 2006 and 2010.16 Even when they were projected to face large premium increases, a majority of PDP enrollees stayed in the same plan from one year to the next. Among LIS enrollees, although many are reassigned each year to new plans by CMS, few (14 percent) of those not eligible for reassignment by CMS and projected to pay a premium switched to new plans in 2010.17 Finding ways to get more Part D enrollees engaged in comparing and reviewing plans and making changes that could save them money remains an ongoing challenge for CMS and policymakers.