Medicare Advantage Plans in 2017: Short-term Outlook is Stable
Introduction
With nearly one-third of all Medicare beneficiaries enrolled in Medicare Advantage plans in 2016,1 there is ongoing interest in the evolution of this marketplace and how well it is working for people on Medicare. For the past several years, the Medicare Advantage market has appeared to be relatively stable, based on the metrics available, with few changes in average premiums, plan offerings, and insurer participation. Less information is available about cost-sharing for Medicare-covered services, extra benefits, or Medicare Advantage provider networks, including how they may have changed over time.2
This spotlight analyzes publicly available data to review the Medicare Advantage plans offered in 2017, with information on including plan availability, premiums, out-of-pocket limits and other plan features:
- The average Medicare beneficiary will be able to choose from 19 plans in 2017, a number which has been relatively stable since 2012.
- The average beneficiary will be able to choose from plans offered by six firms; one-quarter of beneficiaries nationwide will have a choice of plans offered by three or fewer firms in 2017.
- If enrollees in Medicare Advantage prescription drug plans (MA-PDs) stay in the same plan between 2016 and 2017, their premiums will increase by 4 percent, on average.
- While premiums have been relatively flat, average limits on out-of-pocket costs for Part A and B benefits have increased by 25 percent, since 2011 from $4,281 in 2011 to $5,332 in 2017.
- About four in ten (41%) plans are rated as 4 stars or higher in 2017. Since 2012, Medicare has paid bonus payments to Medicare Advantage plans with four or more stars.
The design of Medicare Advantage plans is heavily influenced by the level of federal payments to plans and the requirements of plans. As of 2017, the payment reductions adopted in the Affordable Care Act (ACA) will be fully phased-in. The effects of these reductions have been partly blunted by quality-based bonus payments to plans and the way payment reductions were applied.3 In 2016, federal payments to plans are estimated to be 2 percent higher than traditional Medicare spending, on average, including the bonus payments.4
The Medicare Advantage market is highly consolidated nationwide and could become more so depending on the outcomes of the proposed Aetna-Humana and Anthem-Cigna mergers. Such market concentration can influence the competiveness and the stability of the market. More longer-term, some lawmakers are proposing to transform Medicare into a premium support system, building off of Medicare Advantage. A premium support system would likely look very different from current Medicare Advantage plans since it would change federal payments to plans and plans’ financial incentives, with uncertain effects for plans and beneficiaries.
Issue Brief
Plan Offerings in 2017
Number of Plans Offered
In total, 2,034 Medicare Advantage plans will be available nationwide for individual enrollment in 2017, a number that has been relatively stable since 2011 (Figure 1). Among the plans that were available in 2016, 238 will be exiting the Medicare Advantage market, and 271 plans will be offered for the first time (Table A1). While virtually every state will see some change in the number of plans, most of the plans exiting the market in 2017 attracted relatively few enrollees in 2016. Just under 3 percent of all Medicare Advantage enrollees in 2016, 414,710 beneficiaries, will need to choose a new plan in 2017 because their plan exited.
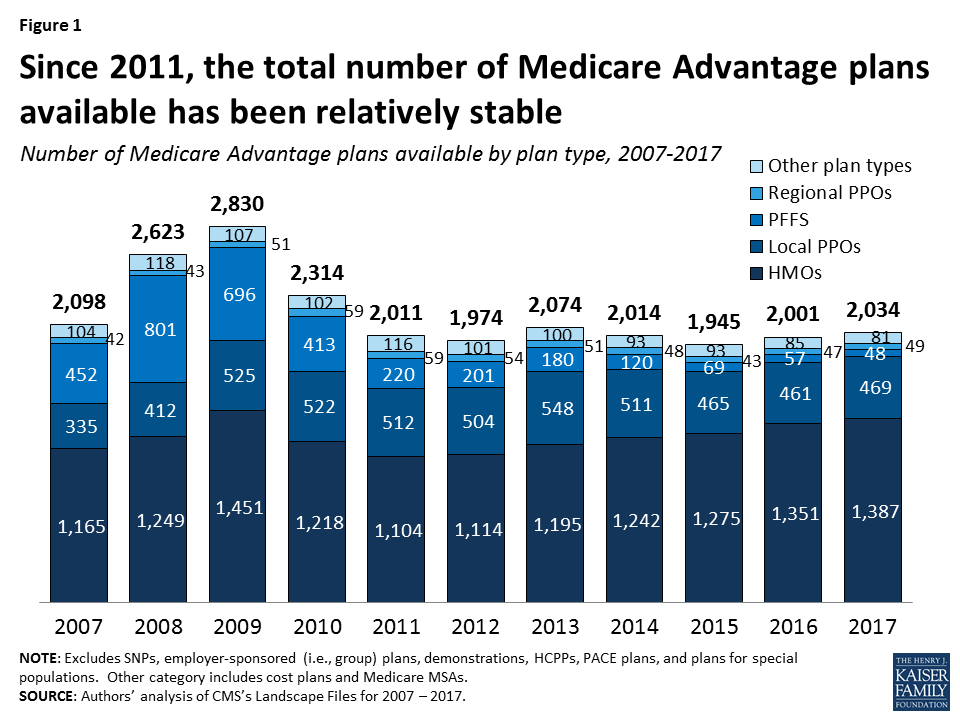
HMOs continue to account for the large majority of plans available, and will account for two-thirds of all plans offered in 2017 (Table A1). Since 2010, the number of HMOs has increased each year, with 36 more HMOs in 2017, while the availability of other plan types has either remained similar or decline.
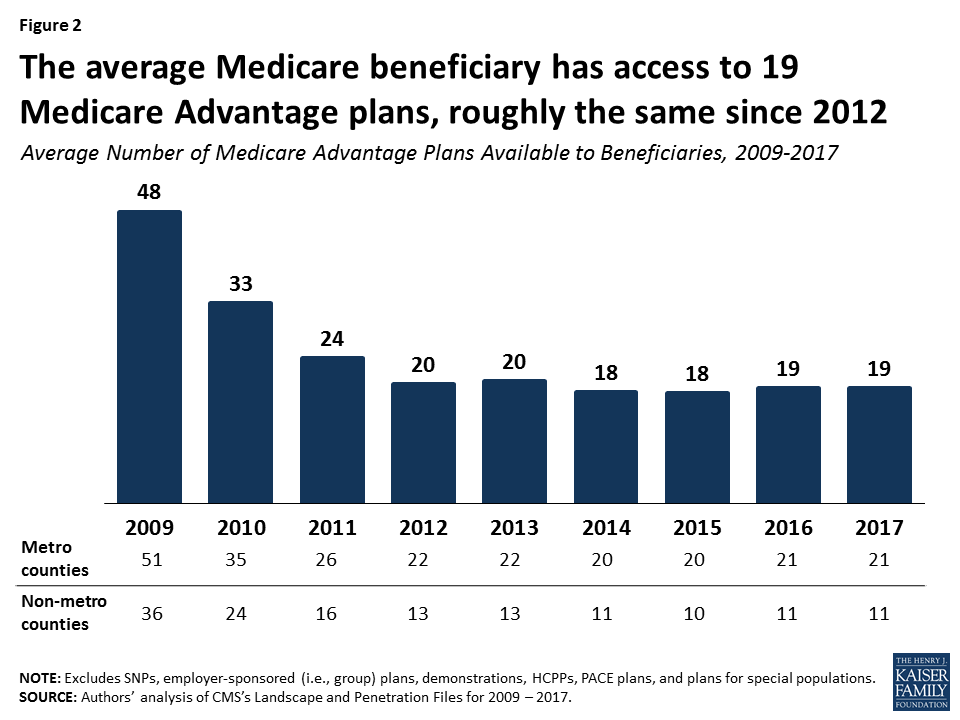
Since 2012, the number of plans available to Medicare beneficiaries has been relatively stable. The average beneficiary will be able to choose from among 19 plans, on average, in 2017, the same number as in 2016 (Figure 2). Beneficiaries in metropolitan areas will be able to choose from 21 plans, on average, and beneficiaries in non-metropolitan areas will be able to choose from 11 plans, on average, the same as in 2016. Similarly, the average number of plans available to beneficiaries in the lowest cost counties (i.e., lowest quartile of counties) and in other counties will remain the same in 2017 as it was in 2016, ranging from 15 plans available in the lowest cost counties to 23 plans available in the highest cost counties; Table A2).
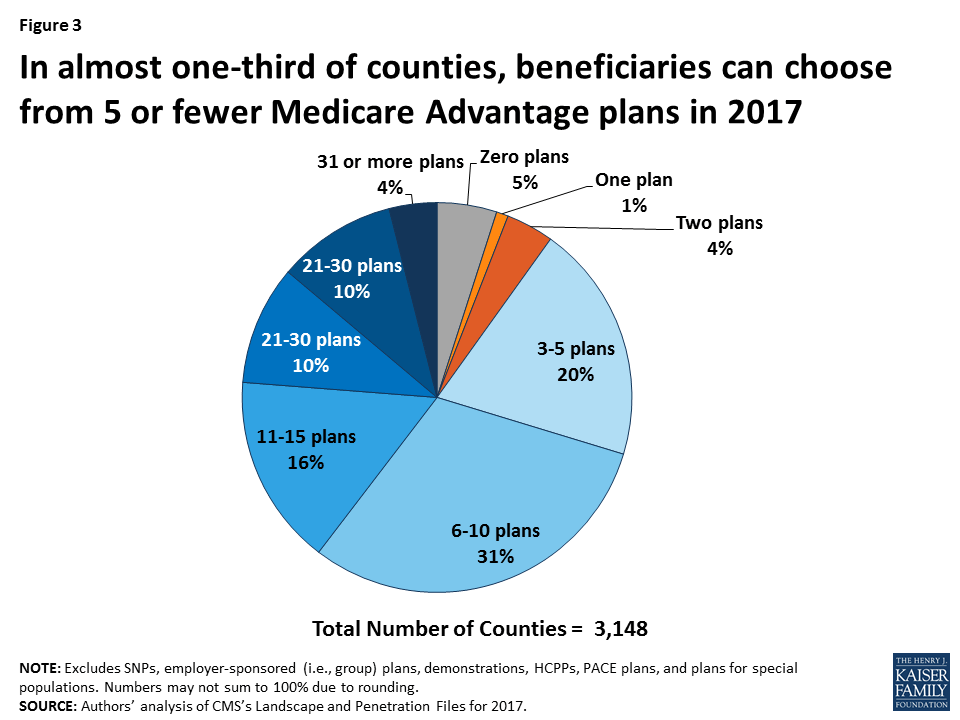
Despite the high number of plans available per beneficiary, relatively fewer plans are available in many counties. In almost one-third (30%) of counties, most of which are rural, beneficiaries can choose from five or fewer Medicare Advantage plans, including 10 percent of counties with less than 3 plans in 2017 (Figure 3). At the other end of the spectrum, in about one-quarter of counties, beneficiaries can choose from 16 or more plans, including 4 percent of counties in which beneficiaries can choose from more than 30 plans in 2017. About 14 percent of beneficiaries are in counties that have two plans or less and 54 percent of beneficiaries are in counties that have 5 or fewer plans.
Number of Firms Offering Medicare Advantage Plans
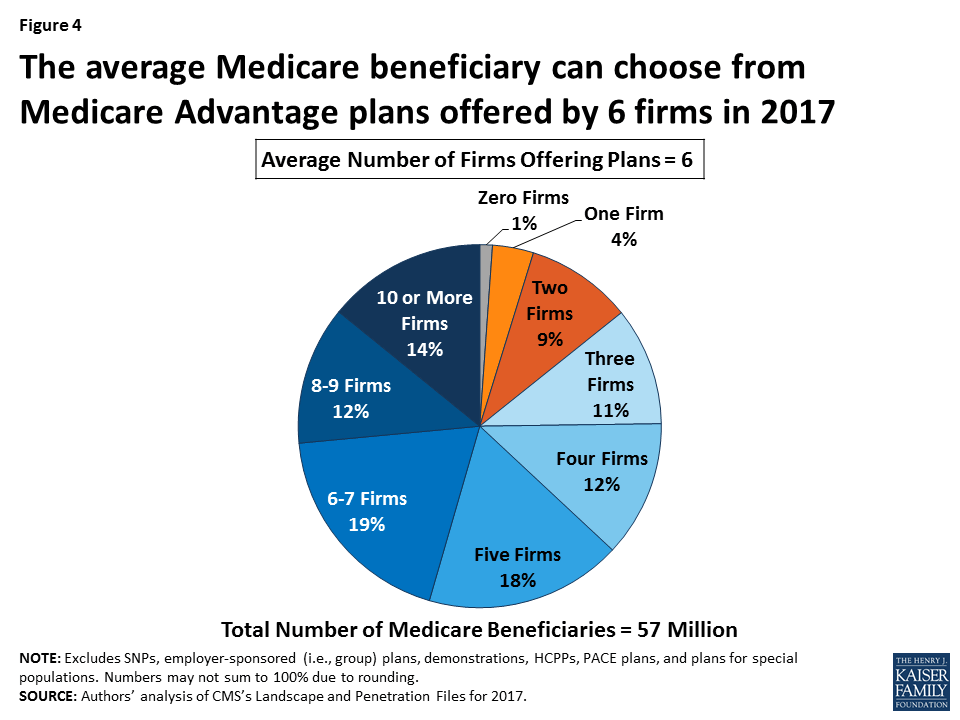
The average Medicare beneficiary will be able to choose from many plans, but in some areas, these plans will be offered by a handful of firms. The average Medicare beneficiary will be able to choose from plans offered by 6 firms, on average, in 2017, with sizeable variation across counties (Figure 4). One-quarter of beneficiaries will be able to choose from plans offered by three or fewer firms, while another quarter of beneficiaries will be able to choose from plans offered by 8 or more firms. The number of firms offering Medicare Advantage plans will be highest in the New York City area (Bronx, Kings, Queens, and New York Counties), Los Angeles County, and Orange County, California, where 15 or more firms will be offering Medicare Advantage plans. In contrast, in 439 counties in 26 states, most of which are rural counties with few Medicare beneficiaries, only one firm will offer Medicare Advantage plans in 2017, and in another 154 counties, zero firms will offer Medicare Advantage plans.
Access to Medicare Advantage Plans
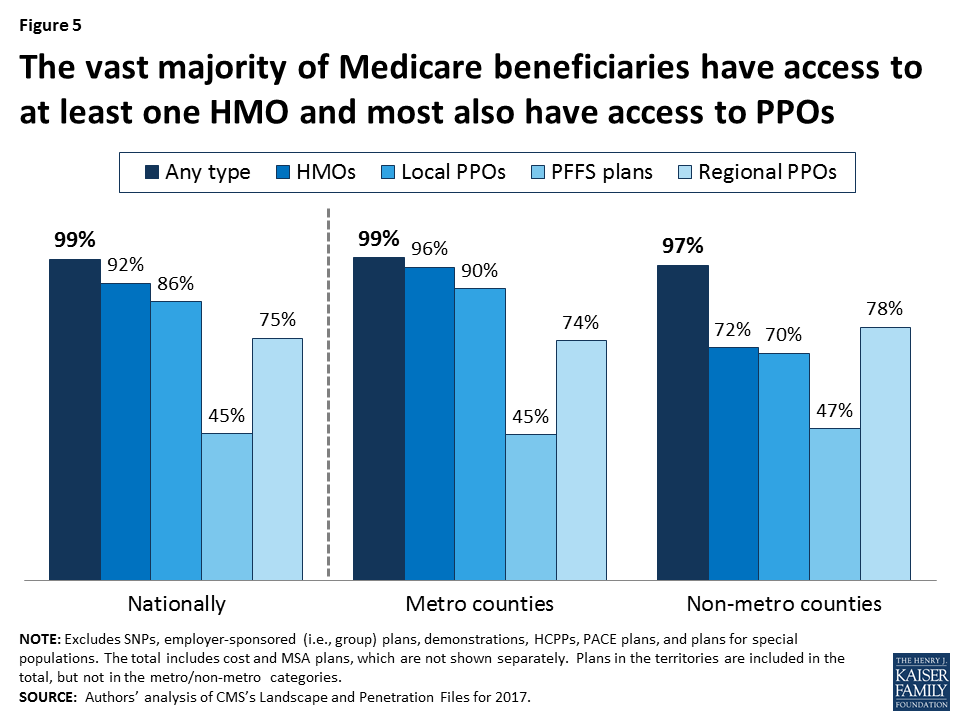
As in recent years, virtually all Medicare beneficiaries (99%) will continue to have access to a Medicare Advantage plan as an alternative to traditional Medicare (Figure 5). Virtually all beneficiaries in metropolitan areas (99%) and the vast majority of beneficiaries in non-metropolitan areas (97%) will continue to have access to at least one Medicare Advantage plan, similar percentages as in 2016. Consistent with prior years, in non-metropolitan counties relative to metropolitan counties, a smaller share of beneficiaries will have access to HMOs or local PPOs, and a slightly larger share of beneficiaries will have access to private fee-for-service (PFFS) plans and regional PPOs.
Change in Plan Availability By Firm
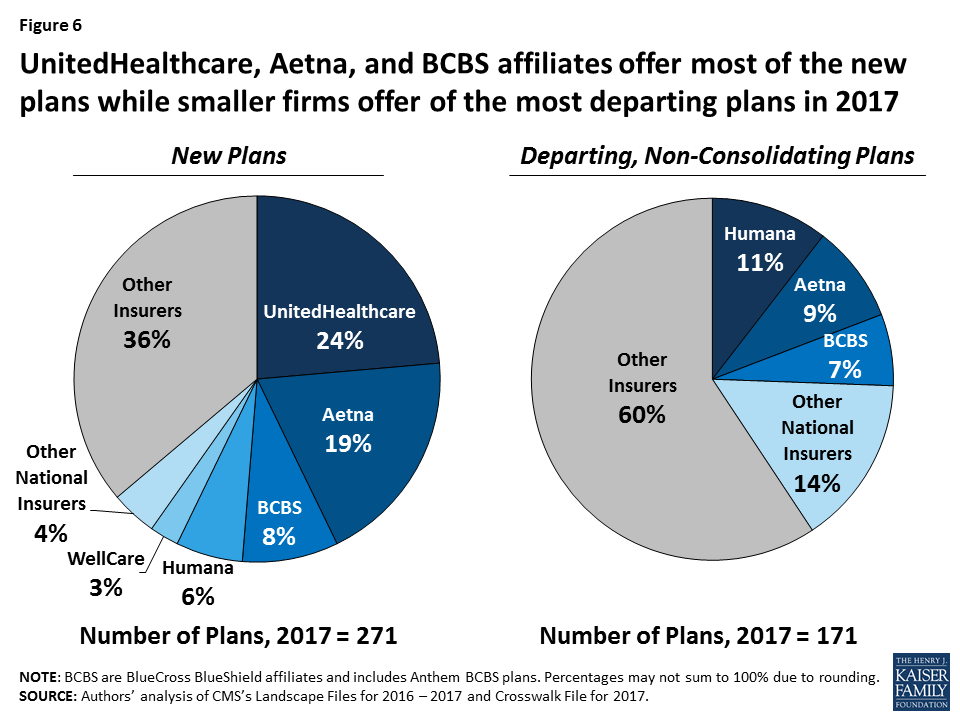
Half of the 271 new Medicare Advantage plans in 2017 are offered by UnitedHealthcare, Aetna, and firms affiliated with BlueCross BlueShield (BCBS; Figure 6). UnitedHealthcare alone accounts for about one-quarter of all new Medicare Advantage plans. Aetna and Humana, whose proposed merger is pending, together account for another one-quarter of new plans.
Fewer plans will be exiting than entering the Medicare Advantage market in 2017, and some firms will also be offering Medicare Advantage plans for the first time. Most of these appear to be local companies, some like SharpAdvantage in San Diego. These new firms will be in nine states: California, Illinois, Iowa, Georgia, Florida, Mississippi, North Dakota, Pennsylvania, and South Carolina.
Most (60%) of the 171 departing plans were offered by smaller firms that tend to have a more regional focus. Humana, Aetna, and BCBS affiliates comprise about one-quarter (26%) of the departing plans, with other national insurers, such as UnitedHealthcare, Cigna, Kaiser Permanente, Anthem and Wellcare, comprising a total of 15 percent, each with less than 3 percent of the departing plans.
Plan Premiums
Medicare beneficiaries enrolled in Medicare Advantage plans pay the Part B premium like other beneficiaries (less any rebate provided by the Medicare Advantage plan), and may also pay an additional monthly premium charged by the Medicare Advantage plan for benefits and prescription drug coverage. This analysis of premiums includes only Medicare Advantage plans that offer prescription drug coverage (MA-PDs). The minority of Medicare Advantage plans (12%) that do not cover prescription drugs are not included in the analysis, in order to better compare premiums across plan types and years. The analysis also weights plans by their 2016 enrollment to reflect the impact of premium changes on current enrollees. (Unweighted premiums, which reflect beneficiaries’ plan options, are in Appendix Table A3)
Premiums (Weighted by Enrollment), Assuming Enrollees Remain in the Same Plan
To examine how premiums will change for Medicare Advantage enrollees, assuming they remain in the same plan between 2016 and 2017, this spotlight examines the premiums among MA-PDs offered in both years and weights the premiums by plan enrollment in 2016. This analysis includes plans with no premiums as well as plans with monthly premiums. Enrollees may be able to prevent or reduce increases in premiums by switching to another plan. After the open enrollment period, we will analyze the premiums for plans selected by all Medicare Advantage enrollees in 2017.5 In recent years, average premiums, weighted by actual enrollment, have tended to be lower than estimates of weighted premiums based on prior year enrollment.
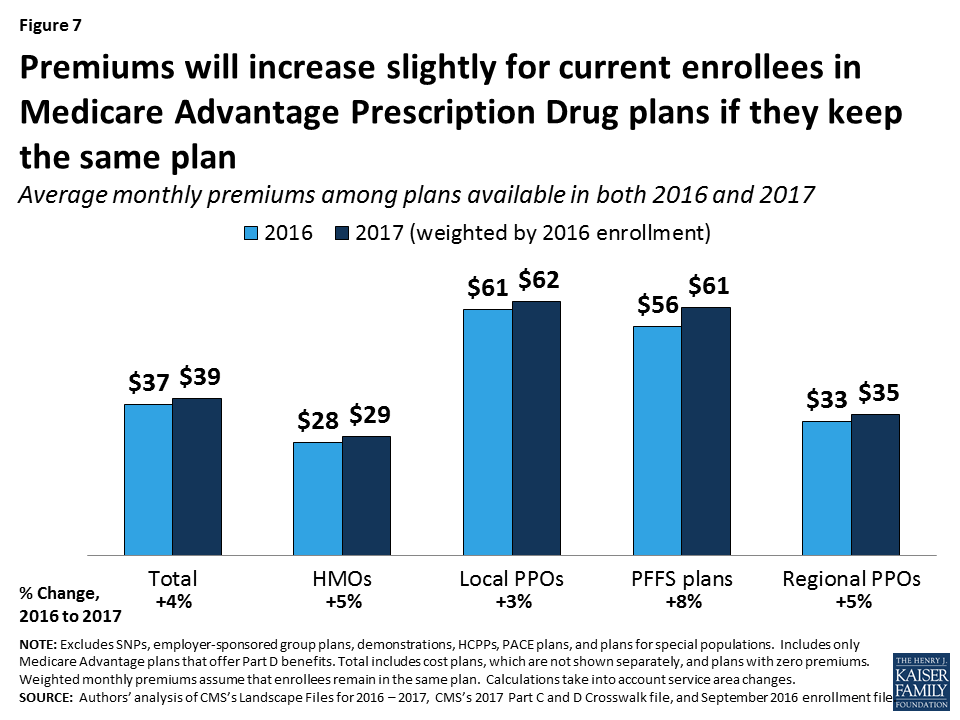
The difference reflects the net impact of beneficiaries making enrollment changes between one year and the next, and plan choices among new Medicare Advantage enrollees. Based on plan enrollment in the Fall of 2016, the average Medicare Advantage enrollee in a plan that will continue to be offered in 2017 will pay about $39 per month, an increase of $2 per month (or 4%) compared to 2016, if they stay in the same plan (Figure 7). In percentage terms, enrollees in PFFS plans will experience a larger increase in premiums (8% on average) than enrollees in other types of Medicare Advantage plans, assuming no change in enrollment. Monthly premiums, weighted for 2016 enrollment will be lower for enrollees in HMOs ($29 per month) than for enrollees in other types of Medicare Advantage plans.
In general, enrollees in MA-PDs that will continue to be offered in 2017 had somewhat lower premiums (averaging $37 per month), on average, than enrollees in plans that will be exiting the market (averaging $42 per month; Table A1). However, the difference varies across plan types and these changes are difficult to interpret because plan premiums are a function of many plan-specific factors, as well region-specific factors.
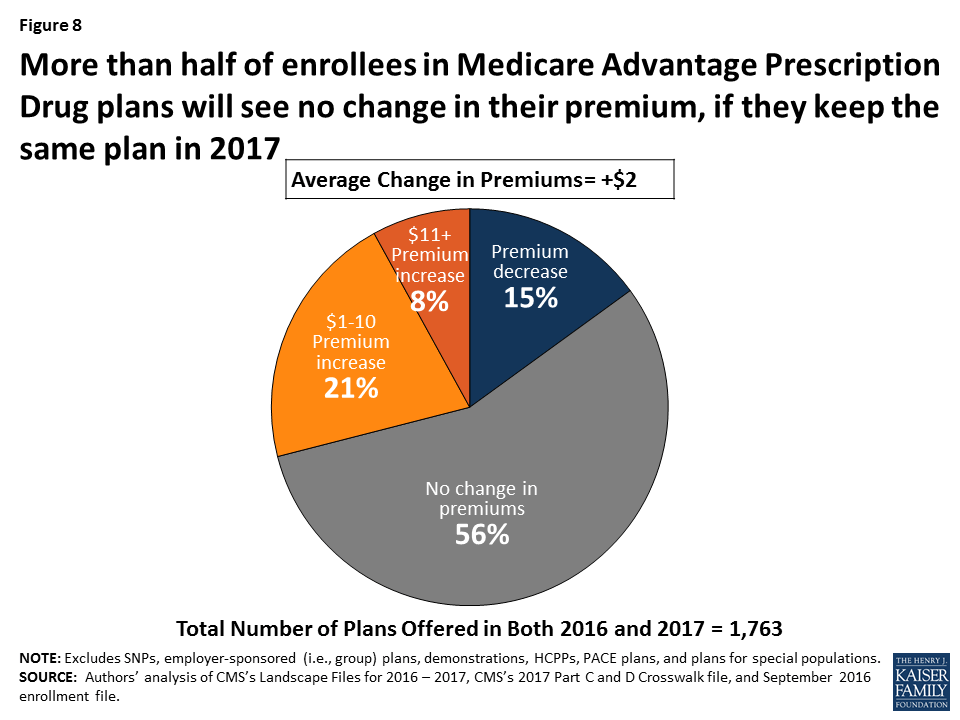
Change in Premiums. While over half (56%) of Medicare Advantage enrollees will see no change in their premiums, some enrollees will experience increases or decreases in their monthly premium (Figure 8). About 8 percent of enrollees will see the largest increases, with monthly premiums increasing by $11 or more a month, if they do not change their plan. In contrast, one in seven MA-PD enrollees (15%) will see premiums decline in 2017, if they stay in the same plan.
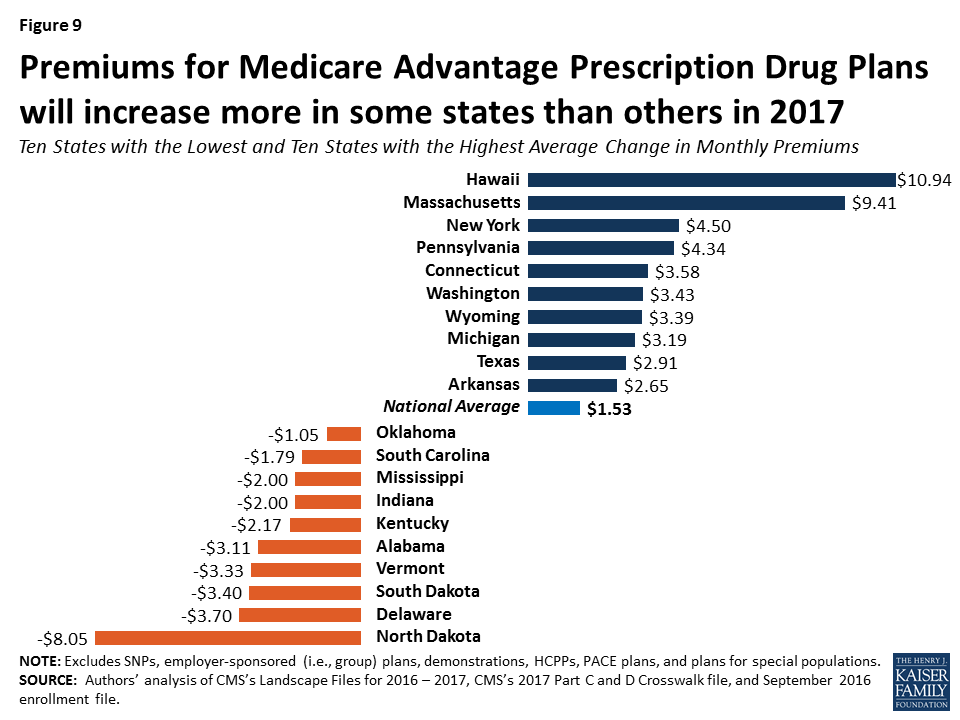
The change in monthly premiums also will vary somewhat across the country (Figure 9). In most states, average premiums will increase or decrease by less than $5 per month. However, in North Dakota, average premiums will decrease by about $8 per month, while in Massachusetts and Hawaii, average premiums will increase by more than $9 per month. Other work has shown that only about 10 percent of Medicare Advantage enrollees switch plans each year, and the share of people switching plans does not significantly increase until premiums increase by $20 or more per month, at which point 20 percent of enrollees switch plans, on average.6
Access to Plans with No Premium
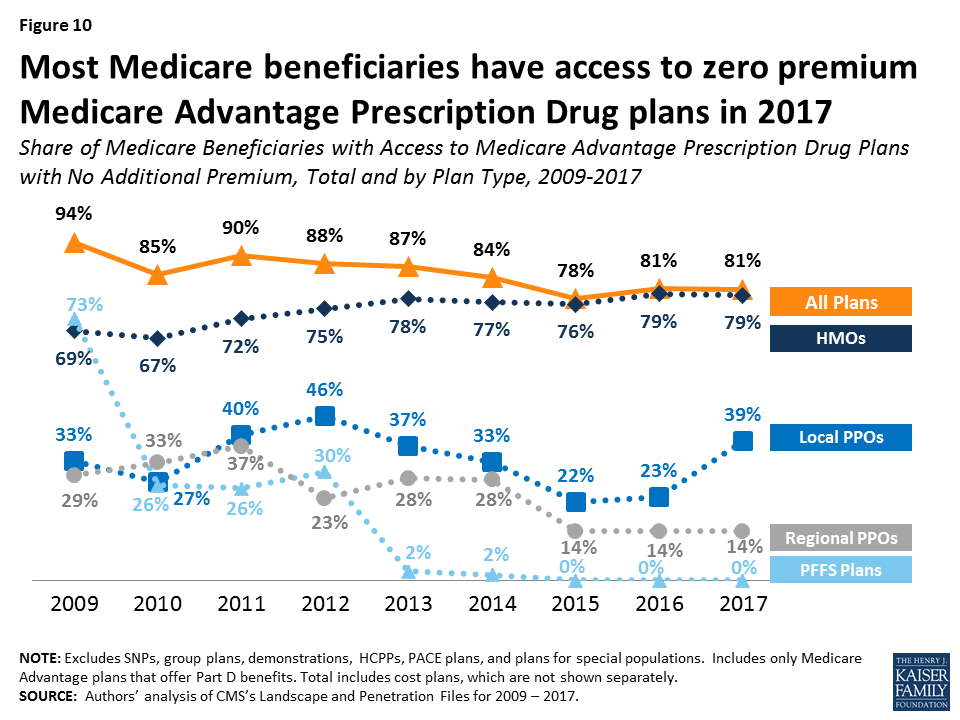
Medicare Advantage plans with no additional premium (other than the Medicare Part B premium) – so called “zero premium plans” – have been a feature of the Medicare Advantage landscape for many years. About four-fifths (81%) of all beneficiaries will have access to a zero-premium MA-PD in 2017, the same as in 2016 (Figure 10). The continued availability of zero-premium plans mainly reflects offerings among HMOs since zero-premium plans are less common among other plan types. More local PPOs will have zero premiums in 2017 but the share of local PPOs using this feature has varied over time.
Limits On Out-of-Pocket Spending
The traditional Medicare program does not include a limit on out-of-pocket spending for services covered under Parts A and B. In contrast, Medicare Advantage plans are required to limit enrollees’ out-of-pocket expenses for services covered under Parts A and B to no more than $6,700, with higher limits allowed for services received from out-of-network providers. Even before the 2011 implementation of this requirement, most Medicare Advantage plans (79% in 2010) voluntarily included a limit on enrollees’ out-of-pocket spending.7 CMS encourages plans to limit enrollees’ out-of-pocket expenses to no more than $3,400 per year, by allowing these plans to charge higher cost-sharing for some services. These out-of-pocket limits do not include expenses for Part D prescription drugs (which have a separate catastrophic threshold), nor do they include expenses for extra benefits or for services not covered by the plan.
Continuing the trend since 2011, out-of-pocket limits for MA-PDs will be higher in 2017 than in prior years, on average. In 2017, the average plan’s limit will be $5,332, up from $4,281 in 2011 (Figure 11).
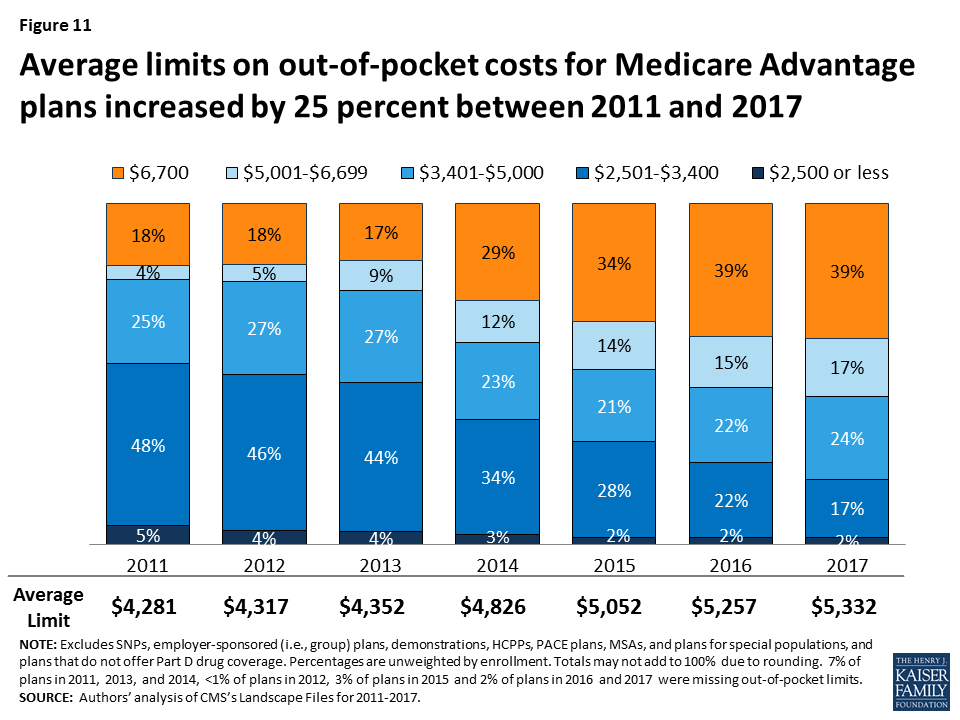
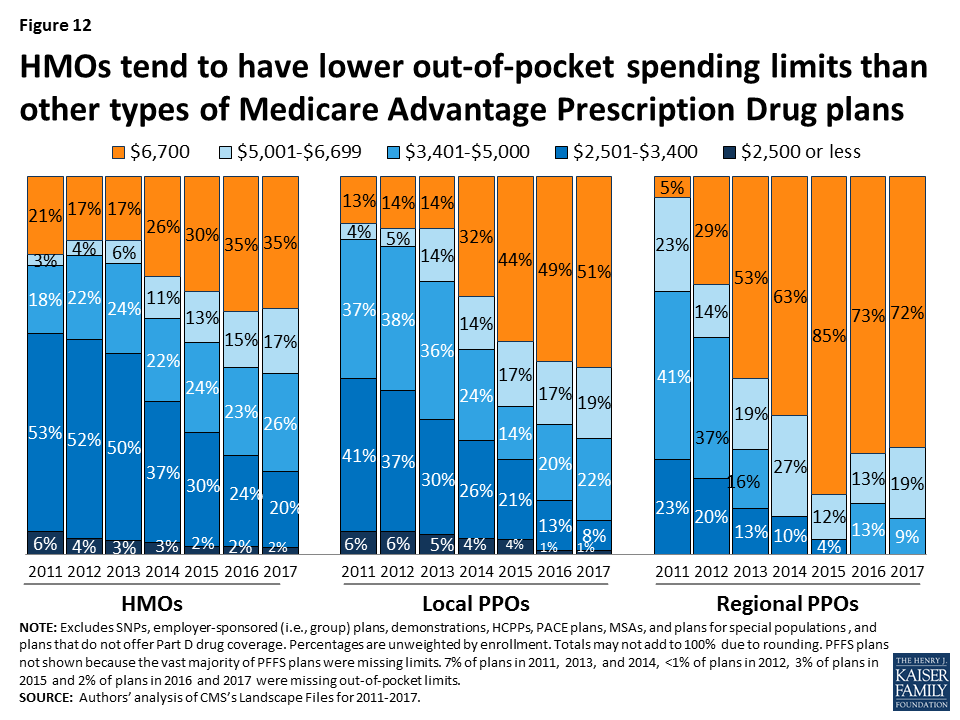
In 2017, two-fifths of plans (39%) will have limits equal to the maximum ($6,700), the same as in 2016. About 19 percent of plans will have a limit of $3,400 or less in 2017, a sharp decline since 2011 when over half (53%) of plans had limits of $3,400 or less. Average out-of-pocket limits are increasing across all plan types (Figure 12). Almost three-quarters (72%) of regional PPOs, half (51%) of local PPOs, and one-third (35%) of HMOs have out of pocket limits equal to $6,700. Limits at or below $3,400 are rare across all plan types.
Prescription Drug Coverage
In 2017, the vast majority (88%) of Medicare Advantage plans will offer prescription drug coverage. Historically, plans without a drug benefit were developed for beneficiaries who may have access to other sources of prescription drug coverage, such as retiree health coverage from former employers or the Veterans Health Administration, as well as those who for any other reason do not want to purchase such coverage.
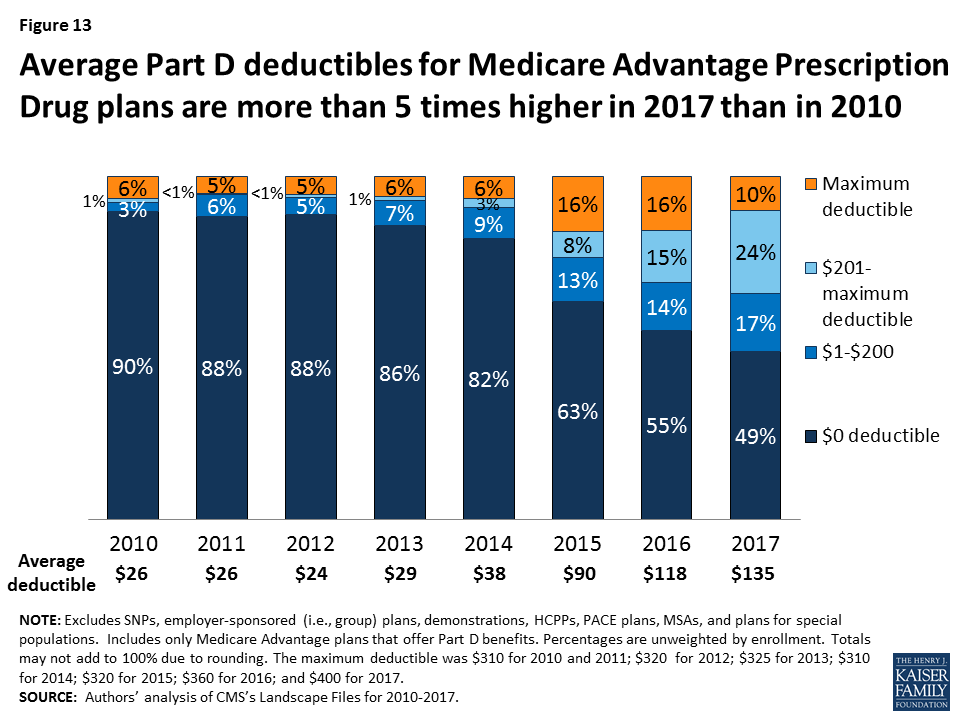
Coverage of the Part D Deductible
The standard design of the drug benefit includes an initial coverage deductible which is updated each year, and is $400 in 2017. Plans can vary the benefit design as long as they provide cost-sharing that is at least actuarially equivalent to the standard benefit. In 2017, half (51%) of MA-PDs will impose a deductible for prescription drug coverage. Since 2010, the average MA-PD deductible has quintupled from $26 in 2010 to $135 in 2017 (Figure 13). A smaller share of MA-PDs will charge the maximum deductible (10% in 2017 versus 16% in 2016). Deductibles are more frequently used in free standing PDPs and more charge the maximum allowed amount.8
Quality Ratings
For many years, the CMS has posted quality ratings of Medicare Advantage plans to provide Medicare beneficiaries with additional information about plans offered in their area. All Medicare Advantage plans are rated on a 1 to 5-star scale, with 1 star representing poor performance, 3 stars representing average performance, and 5 stars representing excellent performance. CMS assigns quality ratings at the contract level, rather than for each individual plan. This means that every Medicare Advantage plan covered under the same contract receives the same quality rating, and most contracts cover multiple plans of the same type (e.g. HMO).
Since 2012, Medicare Advantage plans have received bonus payments based on their contract’s quality ratings, and plans within contracts with higher ratings also receive higher rebate amounts. In 2017, plans within contracts with 4 or more stars will receive bonuses of 5 percent. Plans in lower scoring contracts receive no bonuses. (Those too new or with too few enrollees in their contract to be rated get a bonus of 3.5 percent). These bonus percentages are doubled in some counties.9 Additionally, beneficiaries can enroll in a plan with 5 stars (the highest rating) at any time during the year, not just during the annual open enrollment period.
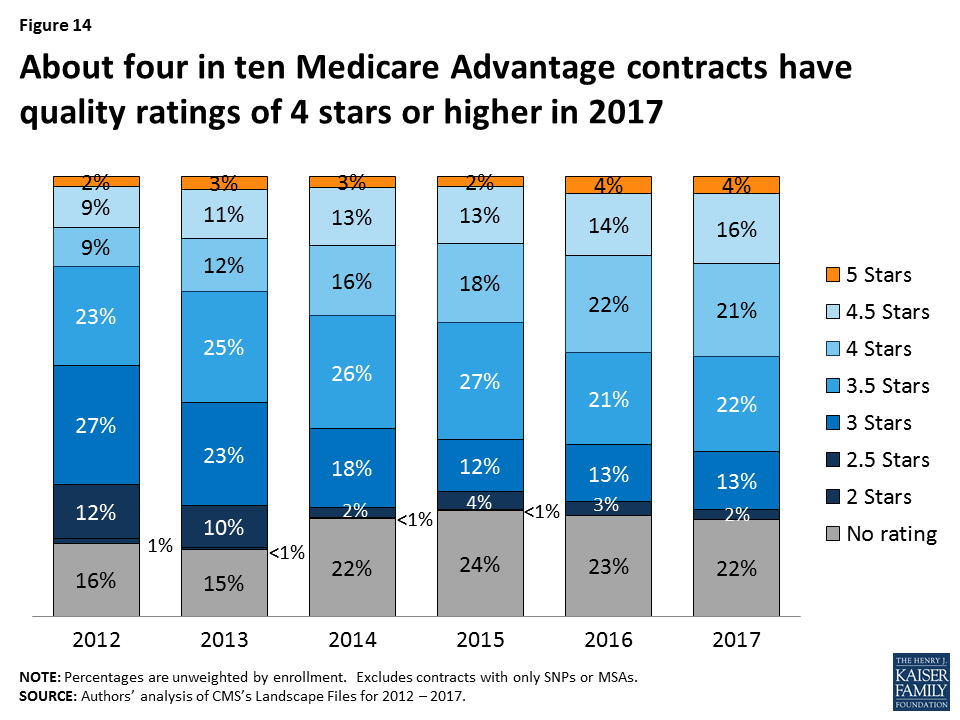
In 2017, about four in ten (41%) Medicare Advantage contracts will have ratings of four or more stars, similar to 2016 (Figure 14). Five percent of contracts received 5 stars, the highest rating possible. More than one-third (35%) of contracts will have average ratings (3 or 3.5 stars), and 2 percent of contracts will have below average ratings (2 or 2.5 stars) in 2017.
Change in Number and Availability of Plans Offered by Firm
While many organizations offer Medicare Advantage plans, most plans are owned or affiliated with a small number of companies and organizations. In 2016, 7 firms and affiliates accounted for almost three-quarters of all enrollment: UnitedHealthcare, Humana, Blue Cross and Blue Shield (BCBS) affiliated companies (including Anthem BCBS plans), Kaiser Permanente, Aetna, Cigna, and Wellcare. These companies and affiliates account for 64 percent of the plans being offered in 2017 (Table A4).
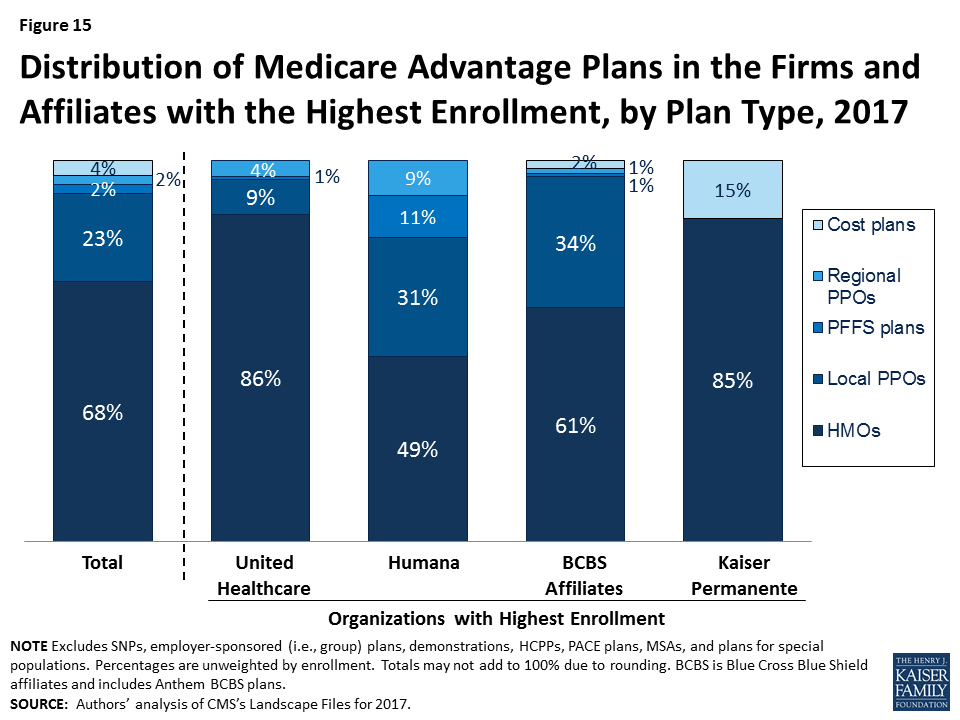
Firm strategies are reflected both in the types of plans they offer and the share of beneficiaries to whom they are available (Figure 15; Table A5). Two firms with the largest footprints in the Medicare Advantage market are United Healthcare and Humana. In 2017, 74 percent of Medicare beneficiaries will have a United Health plan available to them for individual enrollment, and 83 percent will have a Humana plan. Humana’s footprint continues to be large despite recent declines in the total number of plans they offer nationwide. Humana offers diverse types of plans than most other firms. HMOs, local PPOs, and regional PPOs offered by Humana will be available to more than half of beneficiaries (56%, 58%, and 61%, respectively) and Humana PFFS plans will be available to about four in ten beneficiaries (39%). UnitedHealthcare offerings, in contrast emphasize HMOs. More than half of beneficiaries (61%) will have access to a UnitedHealthcare HMO in 2017, up from 55 percent of beneficiaries in 2016.
How Mergers Could Affect Medicare Advantage Plan Offerings
Aetna’s proposed merger with Humana has raised concerns about its potential to reduce competition in the Medicare market. Humana is a dominant firm in the Medicare Advantage market and a merger with Aetna would likely increase the dominance of the combined firms, even with some divestment. Even without a merger, Aetna’s footprint in the Medicare Advantage market has expanded since its acquisition of Coventry. In 2017, Aetna plans will be available to more than half (56%) of all beneficiaries, up from 49 percent in 2016 and 33 percent in 2014, the year after the acquisition of Coventry. Between 2016 and 2017, Aetna will greatly increase the number of local PPOs it offers, rising from 82 plans in 2016 to 117 plans in 2017. Accordingly, a larger share of beneficiaries will have access to an Aetna local PPO (52%) in 2017, up from four in ten (40%) beneficiaries in 2016, and one-third of beneficiaries (33%) in 2015.
Cigna and Anthem have also proposed to merge, although this would have less of an impact on the Medicare Advantage marketplace than the Aetna-Humana proposed merger. Nonetheless, with its conversion to for profit status and acquisition of other BCBS affiliates, Anthem BCBS has expanded the geographic scope of its Medicare Advantage market, and will be available to 24 percent of all Medicare beneficiaries in 2017. Cigna currently is a somewhat smaller player in the Medicare Advantage market, with its plans available to 20 percent of beneficiaries in 2017. If this merger is approved, concerns about the effects on competition in Medicare Advantage would likely be limited to a few specific markets.
Discussion
Plan choices for beneficiaries will be relatively stable between 2016 and 2017, with very little change in the number or type of plans available to beneficiaries or the firms offering those plans. Firms continue to offer diverse products and most beneficiaries have a choice of HMOs and PPOs, while fewer beneficiaries have access to PFFS plans. Most beneficiaries will continue to have a wide choice of plans, including plans that require no additional premiums. Premium increases generally will be moderate but will vary considerably across enrollees. Medicare beneficiaries enrolling in a Medicare Advantage plan will find that the plans available to them, on average, have somewhat higher quality ratings in 2017 than in 2016 but provide less financial protection with higher limits on out-of-pocket costs.
Given the rise in Medicare Advantage enrollment, it is unfortunate that beneficiaries do not have more information that is readily available to facilitate plan comparisons and inform their choices. In particular, it remains challenging for consumers (and researchers) to obtain information that can be used to compare plan networks, cost sharing, and extra benefits, or the performance of individual plans on quality and efficiency metrics. Such information could be used to strengthen program oversight.
The multi-year experience of private plans in Medicare provides insight into the implications of choice for older adults and people with disabilities on Medicare. By its nature, the structure of the Medicare Advantage program and its reliance on competition among private plans demands much of plan enrollees, particularly if they want to maximize Medicare’s value. Since firms can make changes to their plans each year (e.g., premiums, cost-sharing, extra benefits and provider networks), each year’s choices bring potentially significant changes for beneficiaries to consider that can be particularly challenging for beneficiaries with serious health problems or cognitive limitations. Perhaps that is one reason why such a small share of Medicare Advantage enrollees change plans each year,10 unless confronted with relatively steep premium increases.
While Medicare Advantage has been relatively stable in recent years, it was not always so. Beneficiaries experienced considerable disruption in the late 1990s and early 2000s when firms departed many markets and reduced benefits under the Medicare +Choice program, the predecessor program to Medicare Advantage.11 The current stability in the Medicare Advantage market has benefited considerably from the current payment system which, even after the ACA payment reductions, pays plans, on average, 102 percent of the cost of coverage under traditional Medicare. Some lawmakers are now proposing to transform Medicare into a premium support system, building off of Medicare Advantage. A premium support system could be a major departure from the current program due to many factors, including a change in federal payments to plans and plans’ financial incentives, which would have uncertain effects for plans and beneficiaries.
Gretchen Jacobson, and Tricia Neuman are with the Kaiser Family Foundation; Anthony Damico is an independent consultant; and Marsha Gold is a Senior Fellow Emeritus with Mathematica Policy Research and independent consultant.
Appendix
Box 1: Availability of Special Needs Plans in 2017
Special Needs Plans (SNPs) are a type of Medicare Advantage plan that was authorized in 2003 as part of the Medicare Prescription Drug, Improvement and Modernization Act (MMA) to provide a managed care option for beneficiaries with significant or relatively specialized health care needs. Medicare beneficiaries can enroll in a SNP if they are dually eligible for Medicare and Medicaid (D-SNPs), require an institutional-level of care (I-SNPs), or have a severe or chronic condition (C-SNP). Most SNPs are HMOs, but they can also be PPOs.
When SNPs were authorized, there were few requirements beyond those required of other Medicare Advantage plans. The Medicare Improvements for Patients and Providers Act (MIPPA) of 2008 established additional requirements for SNPs, including requiring all SNPs to provide a care management plan to document how care would be provided for enrollees and requiring C-SNPs to limit enrollment to beneficiaries with specific diagnoses or conditions. As a result of the MIPPA requirements, the number of SNPs declined in 2010. The ACA required D-SNPs to have a contract with the Medicaid agency for every state in which the plan operates, beginning in 2013.
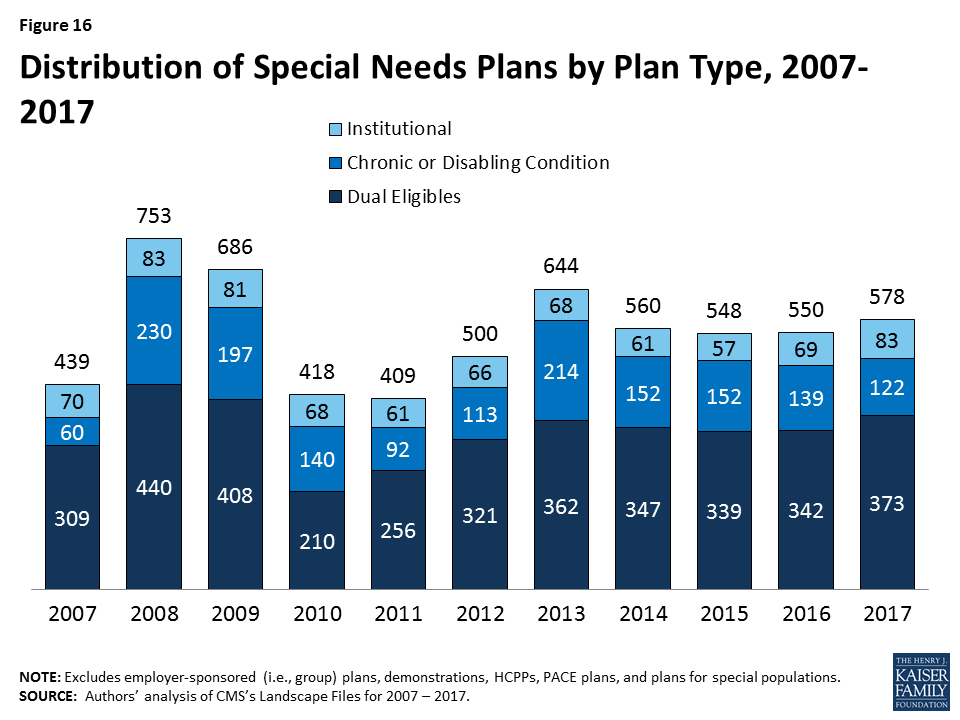
In 2017, 578 SNPs will be available, similar years since 2013 (Figure 16; Table A6). The availability of SNPs will continue to vary across states. In 2017, at least one SNP of any type will be available in all states but six (AK, IA, ND, SD, VT, and WY). SNPs were not available in Nebraska and Rhode Island in 2016 but will be available in 2017; Nebraska will have one D-SNP and Rhode Island will have one D-SNP and two I-SNPs. As in past years, SNPs will be most numerous in selected high population states, notably Florida (97 plans), California (70 plans), and New York (45 plans).
The total number of D-SNPs will increase from 342 plans to 373 plans between 2016 and 2017, and the number of C-SNPs will decline from 139 plans in 2016 to 122 plans in 2017. Similar to prior years, most C-SNPs (72%) will focus on diabetes, chronic heart failure, or cardiovascular disorders. The total number of I-SNPs will increase from 69 plans in 2016 to 83 plans in 2017, and six new companies will offer I-SNPs for the first time in 2017 (accounting for 8% of plans).
| Table A1. Medicare Advantage Plan Market Entries and Exits, Average Monthly Premiums and Average Out-of-Pocket Spending Limits for Medicare Advantage Prescription Drug plans (MA-PDs), Weighted by 2016 Enrollment, 2016-2017 | |||||||
| All Medicare Advantage Plans (MA-PD and MA-only plans) | All plans | HMO | Local PPO | PFFS | Regional PPO | Cost | MSA |
| 2016 Plan Total | 2,001 | 1,351 | 461 | 57 | 47 | 81 | 4 |
| Total number of staying plans | 1,763 | 1,193 | 400 | 47 | 47 | 72 | 4 |
| Number of staying plans with no service area reductions | 1,519 | 1,048 | 324 | 24 | 47 | 72 | 4 |
| Number of staying plans with reduced service areas | 185 | 99 | 63 | 23 | – | – | – |
| Number of consolidating plans, post consolidation | 59 | 46 | 13 | – | – | – | – |
| Total number of departing plans | 238 | 158 | 61 | 10 | – | 9 | – |
| Number of plans departing due to consolidation | 67 | 50 | 13 | – | – | 4 | – |
| Number of terminating plans | 171 | 108 | 48 | 10 | – | 5 | – |
| Number of new plans | 271 | 194 | 69 | 1 | 2 | 5 | – |
| 2017 Plan Total | 2,034 | 1,387 | 469 | 48 | 49 | 77 | 4 |
| Total Medicare Advantage enrollees, as of September 2016 | 12,282,452 | 8,496,896 | 2,065,184 | 225,353 | 1,065,036 | 427,283 | 2,700 |
| Number of staying plans’ enrollees | 11,867,742 | 8,223,231 | 1,951,216 | 198,751 | 1,065,036 | 426,808 | 2,700 |
| Number of enrollees losing access to their plan | 414,710 | 273,665 | 113,968 | 26,602 | – | 475 | – |
| Average premiums of MA-PDs, weighted by 2016 enrollment | |||||||
| Premiums for all plans, 2016 | $37.24 | $27.61 | $61.59 | $55.82 | $32.89 | $112.38 | $0.00 |
| Terminating plans, 2016 | $41.83 | $25.41 | $78.57 | $52.76 | N/A | $71.02 | N/A |
| Staying plans, 2016 | $37.08 | $27.69 | $60.60 | $56.23 | $32.89 | $112.42 | $0.00 |
| 2017 Premiums for remaining 2016 plans | $38.61 | $29.12 | $62.41 | $60.96 | $34.53 | $112.68 | $0.00 |
| Change in premiums for plans available in both 2016 and 2017 | $1.53 | $1.44 | $1.82 | $4.73 | $1.64 | $0.26 | $0.00 |
| Share of enrollees in MA-PDs with no premiums, among plans available in both 2016 and 2017 | |||||||
| 2016 | 49% | 59% | 24% | 8% | 45% | 1% | 100% |
| 2017 | 48% | 58% | 24% | 8% | 45% | 1% | 100% |
| Change in share of plans with no premiums | -1% | -1% | 0% | 0% | 0% | 0% | 0% |
| Average premiums paid per enrollee, among MA-PDs with premiums (excluding zero premium plans) and available in both 2016 and 2017 | |||||||
| 2016 | $73.11 | $67.99 | $79.98 | $60.91 | $59.60 | $113.90 | N/A |
| 2017 | $74.84 | $69.39 | $82.29 | $66.03 | $62.58 | $114.16 | N/A |
| Average out-of-pocket spending limits per year among MA-PDs, weighted by 2016 enrollment, among plans available in both 2016 and 2017 | |||||||
| 2016 | $5,204 | $4,974 | $5,661 | N/A | $6,595 | $3,538 | N/A |
| 2017 | $5,235 | $4,974 | $5,817 | N/A | $6,605 | $3,698 | N/A |
| Change in average out-of-pocket spending limits | $32 | $1 | $156 | N/A | $10 | $160 | N/A |
| Total MA-PD enrollees, as of September 2016 | 11,668,604 | 8,343,955 | 2,032,438 | 132,299 | 951,002 | 208,910 | – |
| Number of staying MA-PDs’ enrollees | 11,284,612 | 8,072,317 | 1,920,084 | 132,299 | 951,002 | 208,910 | – |
| Number of enrollees losing access to their MA-PD | 383,992 | 271,638 | 112,354 | – | – | – | – |
| NOTE: Excludes Special Needs Plans (SNPs), demonstrations, Health Care Prepayment Plans (HCPPs), Program of All Inclusive Care for the Elderly (PACE) plans, employer-sponsored (i.e., group) plans, and plans for special populations.SOURCE: Authors’ analysis of CMS’s Landscape Files for 2016 and 2017 and CMS’s 2016 and 2017 Part C and D Crosswalk file and September 2016 enrollment. | |||||||
| Table A2. Average Number of Plans Available to Beneficiaries by County of Residence, 2009-2017 | |||||||||
| 2009 | 2010 | 2011 | 2012 | 2013 | 2014 | 2015 | 2016 | 2017 | |
| National Average | 48 | 33 | 24 | 20 | 20 | 18 | 18 | 19 | 19 |
| Metro counties | 51 | 35 | 26 | 22 | 22 | 20 | 20 | 21 | 21 |
| Non-metro counties | 36 | 24 | 16 | 13 | 13 | 11 | 10 | 11 | 11 |
| Fee-for-Service Costs, by Quartile | |||||||||
| Lowest cost quartile | 45 | 28 | 18 | 17 | 17 | 17 | 15 | 15 | 15 |
| Second quartile | 46 | 31 | 20 | 17 | 16 | 15 | 14 | 15 | 15 |
| Third quartile | 44 | 30 | 20 | 17 | 18 | 16 | 16 | 17 | 17 |
| Highest cost counties | 53 | 37 | 30 | 24 | 24 | 21 | 22 | 23 | 23 |
| NOTE: Excludes SNPs, employer-sponsored (i.e., group) plans, demonstrations, HCPPs, PACE plans, and plans for special populations.SOURCE: Authors’ analysis of CMS’s Landscape and Penetration Files for 2009 – 2017. | |||||||||
| Table A3. Unweighted Average Monthly Premiums for Medicare Advantage Prescription Drug Plans, by Plan Type, 2009-2017 | ||||||||||
| 2009 | 2010 | 2011 | 2012 | 2013 | 2014 | 2015 | 2016 | 2017 | Change, 2016-2017 | |
| All Plans | $51.81 | $55.86 | $50.61 | $49.80 | $51.43 | $51.47 | $53.42 | $52.57 | $50.97 | -$1.60 |
| HMOs | $34.52 | $40.11 | $36.24 | $33.20 | $34.11 | $35.37 | $38.28 | $39.14 | $38.81 | -$0.33 |
| Local PPOs | $65.12 | $70.17 | $65.72 | $69.14 | $72.57 | $74.92 | $81.02 | $78.61 | $72.91 | -$5.70 |
| PFFS plans | $74.46 | $75.09 | $65.79 | $70.96 | $83.29 | $90.93 | $87.86 | $91.40 | $92.43 | $1.03 |
| Regional PPOs | $55.68 | $59.29 | $53.38 | $55.64 | $56.89 | $59.30 | $67.85 | $74.93 | $80.84 | $5.91 |
| NOTE: Excludes SNPs, demonstrations, HCPPs, PACE plans, employer-sponsored (i.e., group) plans, and plans for special populations. Premiums include plans with premiums as well as plans with no premiums. Cost plans are included in the total but are not shown separately.SOURCE: Authors’ analysis of CMS’s Landscape Files for 2009 – 2017. | ||||||||||
| Table A4. Number of Medicare Advantage Plans Available, by Plan Type and Firm, 2015-2017 | ||||||||||||||||||
| All | HMOs | Local PPOs | PFFS Plans | Regional PPOs | Cost Plans | |||||||||||||
| 2015 | 2016 | 2017 | 2015 | 2016 | 2017 | 2015 | 2016 | 2017 | 2015 | 2016 | 2017 | 2015 | 2016 | 2017 | 2015 | 2016 | 2017 | |
| Number of Plans – Total | 1945 | 2001 | 2034 | 1275 | 1351 | 1387 | 465 | 461 | 469 | 69 | 57 | 48 | 43 | 47 | 49 | 86 | 81 | 77 |
| UnitedHealthCare | 164 | 223 | 272 | 132 | 187 | 234 | 22 | 24 | 25 | 2 | 2 | 2 | 8 | 10 | 11 | 0 | 0 | 0 |
| Humana | 395 | 362 | 337 | 195 | 184 | 164 | 116 | 106 | 105 | 53 | 41 | 37 | 31 | 31 | 31 | 0 | 0 | 0 |
| BCBS – Total | 291 | 311 | 316 | 163 | 189 | 194 | 110 | 110 | 109 | 4 | 2 | 3 | 4 | 4 | 4 | 6 | 6 | 6 |
| Anthem BCBS | 54 | 62 | 65 | 35 | 45 | 48 | 16 | 14 | 14 | 0 | 0 | 0 | 3 | 3 | 3 | 0 | 0 | 0 |
| Other BCBS plans | 237 | 249 | 251 | 128 | 144 | 146 | 94 | 96 | 95 | 4 | 2 | 3 | 1 | 1 | 1 | 6 | 6 | 6 |
| Kaiser Permanente | 39 | 41 | 41 | 34 | 34 | 34 | 0 | 0 | 0 | 0 | 0 | 0 | 0 | 0 | 0 | 5 | 6 | 6 |
| Aetna | 195 | 203 | 233 | 121 | 119 | 113 | 74 | 82 | 117 | 0 | 0 | 0 | 0 | 2 | 3 | 0 | 0 | 0 |
| WellCare | 40 | 49 | 50 | 40 | 49 | 50 | 0 | 0 | 0 | 0 | 0 | 0 | 0 | 0 | 0 | 0 | 0 | 0 |
| Cigna | 43 | 46 | 43 | 40 | 43 | 41 | 3 | 3 | 2 | 0 | 0 | 0 | 0 | 0 | 0 | 0 | 0 | 0 |
| Other | 778 | 766 | 742 | 550 | 546 | 557 | 140 | 136 | 111 | 10 | 12 | 6 | 0 | 0 | 0 | 75 | 69 | 65 |
| NOTE: Excludes SNPs, demonstrations, HCPPs, PACE plans, employer-sponsored (i.e., group) plans, and plans for special populations. BCBS are BlueCross BlueShield affiliates, which includes Anthem BCBS plans. Total includes MSAs, which are not shown separately. For earlier years of data, see See Jacobson G, Gold M, Damico A, Neuman T, and Casillas, G. “Medicare Advantage 2016 Data Spotlight: Overview of Plan Changes.” December 2015. https://www.kff.org/medicare/issue-brief/medicare-advantage-2016-data-spotlight-overview-of-plan-changes/SOURCE: Authors’ analysis of CMS’s Landscape Files for 2015 – 2017. | ||||||||||||||||||
| Table A5. Share of Medicare Beneficiaries with Access to Firms’ Medicare Advantage Plan Offerings, by Plan Type and Firm, 2015-2017 | ||||||||||||||||||
| Any Plan | HMOs | Local PPOs | PFFS Plans | Regional PPOs | Cost Plans | |||||||||||||
| Firm | 2015 | 2016 | 2017 | 2015 | 2016 | 2017 | 2015 | 2016 | 2017 | 2015 | 2016 | 2017 | 2015 | 2016 | 2017 | 2015 | 2016 | 2017 |
| UnitedHealthcare | 69% | 70% | 74% | 49% | 55% | 61% | 18% | 13% | 10% | 2% | 2% | 2% | 32% | 32% | 33% | 0% | 0% | 0% |
| Humana | 86% | 85% | 83% | 56% | 58% | 56% | 54% | 53% | 58% | 44% | 43% | 39% | 61% | 61% | 61% | 0% | 0% | 0% |
| BCBS – Total | 71% | 72% | 72% | 54% | 58% | 58% | 46% | 45% | 41% | 1% | 1% | 3% | 15% | 15% | 15% | 2% | 2% | 2% |
| Anthem BCBS plans | 21% | 24% | 24% | 15% | 20% | 22% | 9% | 9% | 8% | 0% | 0% | 0% | 8% | 8% | 8% | 0% | 0% | 0% |
| Other BCBS plans | 58% | 55% | 55% | 46% | 44% | 43% | 37% | 36% | 33% | 1% | 1% | 3% | 7% | 7% | 7% | 2% | 2% | 2% |
| Kaiser Permanente | 15% | 17% | 17% | 13% | 13% | 13% | 0% | 0% | 0% | 0% | 0% | 0% | 0% | 0% | 0% | 2% | 2% | 2% |
| Aetna | 45% | 49% | 56% | 42% | 43% | 45% | 33% | 40% | 52% | 0% | 0% | 0% | 0% | 7% | 7% | 0% | 0% | 0% |
| Wellcare | 25% | 32% | 29% | 25% | 32% | 29% | 0% | 0% | 0% | 0% | 0% | 0% | 0% | 0% | 0% | 0% | 0% | 0% |
| Cigna | 19% | 20% | 20% | 19% | 20% | 20% | 2% | 2% | 1% | 0% | 0% | 0% | 0% | 0% | 0% | 0% | 0% | 0% |
| Others | 79% | 79% | 79% | 73% | 73% | 73% | 30% | 34% | 28% | 4% | 4% | 3% | 0% | 0% | 0% | 6% | 6% | 5% |
| NOTE: Excludes SNPs, demonstrations, HCPPs, PACE plans, employer-sponsored (i.e., group) plans, and plans for special populations. BCBS are BlueCross BlueShield affiliates, which includes Anthem BCBS plans. Any plan includes beneficiaries with access to an MSA (not shown separately). For earlier years of data, see See Jacobson G, Gold M, Damico A, Neuman T, and Casillas, G. “Medicare Advantage 2016 Data Spotlight: Overview of Plan Changes.” December 2015. https://www.kff.org/medicare/issue-brief/medicare-advantage-2016-data-spotlight-overview-of-plan-changes/SOURCE: Authors’ analysis of CMS’s Landscape Files for 2015 – 2017. | ||||||||||||||||||
| Table A6. Number and Type of Special Needs Plans, by State, 2016 and 2017 | ||||||||||||||||||||
| 2016 | 2017 | |||||||||||||||||||
| State | Overall | Dual eligibles | Institutional | Chronic conditions | Overall | Dual eligibles | Institutional | Chronic conditions | ||||||||||||
| Alabama | 6 | 4 | 2 | 0 | 6 | 4 | 2 | 0 | ||||||||||||
| Alaska | 0 | 0 | 0 | 0 | 0 | 0 | 0 | 0 | ||||||||||||
| Arizona | 33 | 21 | 4 | 8 | 30 | 19 | 4 | 7 | ||||||||||||
| Arkansas | 7 | 4 | 0 | 3 | 7 | 5 | 0 | 2 | ||||||||||||
| California | 72 | 31 | 4 | 37 | 70 | 28 | 4 | 38 | ||||||||||||
| Colorado | 9 | 4 | 3 | 2 | 9 | 4 | 3 | 2 | ||||||||||||
| Connecticut | 4 | 2 | 2 | 0 | 4 | 2 | 2 | 0 | ||||||||||||
| Delaware | 3 | 1 | 1 | 1 | 6 | 2 | 3 | 1 | ||||||||||||
| District of Columbia | 5 | 2 | 1 | 2 | 9 | 4 | 3 | 2 | ||||||||||||
| Florida | 94 | 58 | 6 | 30 | 97 | 64 | 8 | 25 | ||||||||||||
| Georgia | 14 | 8 | 2 | 4 | 20 | 12 | 3 | 5 | ||||||||||||
| Hawaii | 5 | 5 | 0 | 0 | 6 | 6 | 0 | 0 | ||||||||||||
| Idaho | 1 | 1 | 0 | 0 | 1 | 1 | 0 | 0 | ||||||||||||
| Illinois | 10 | 5 | 2 | 3 | 8 | 3 | 2 | 3 | ||||||||||||
| Indiana | 8 | 4 | 2 | 2 | 6 | 3 | 2 | 1 | ||||||||||||
| Iowa | 0 | 0 | 0 | 0 | 0 | 0 | 0 | 0 | ||||||||||||
| Kansas | 2 | 0 | 1 | 1 | 3 | 1 | 1 | 1 | ||||||||||||
| Kentucky | 13 | 8 | 1 | 4 | 13 | 9 | 1 | 3 | ||||||||||||
| Louisiana | 13 | 9 | 0 | 4 | 11 | 10 | 0 | 1 | ||||||||||||
| Maine | 4 | 2 | 1 | 1 | 4 | 2 | 1 | 1 | ||||||||||||
| Maryland | 10 | 3 | 3 | 4 | 12 | 3 | 5 | 4 | ||||||||||||
| Massachusetts | 9 | 7 | 1 | 1 | 10 | 7 | 2 | 1 | ||||||||||||
| Michigan | 6 | 4 | 1 | 1 | 6 | 4 | 1 | 1 | ||||||||||||
| Minnesota | 9 | 9 | 0 | 0 | 10 | 10 | 0 | 0 | ||||||||||||
| Mississippi | 6 | 4 | 0 | 2 | 6 | 6 | 0 | 0 | ||||||||||||
| Missouri | 12 | 3 | 5 | 4 | 8 | 3 | 3 | 2 | ||||||||||||
| Montana | 1 | 1 | 0 | 0 | 1 | 1 | 0 | 0 | ||||||||||||
| Nebraska | 0 | 0 | 0 | 0 | 1 | 1 | 0 | 0 | ||||||||||||
| Nevada | 7 | 0 | 1 | 6 | 7 | 0 | 1 | 6 | ||||||||||||
| New Hampshire | 1 | 0 | 1 | 0 | 1 | 0 | 1 | 0 | ||||||||||||
| New Jersey | 9 | 4 | 3 | 2 | 11 | 5 | 4 | 2 | ||||||||||||
| New Mexico | 3 | 2 | 1 | 0 | 6 | 6 | 0 | 0 | ||||||||||||
| New York | 53 | 37 | 11 | 5 | 45 | 31 | 11 | 3 | ||||||||||||
| North Carolina | 14 | 7 | 2 | 5 | 9 | 6 | 2 | 1 | ||||||||||||
| North Dakota | 0 | 0 | 0 | 0 | 0 | 0 | 0 | 0 | ||||||||||||
| Ohio | 18 | 11 | 4 | 3 | 18 | 12 | 5 | 1 | ||||||||||||
| Oklahoma | 1 | 0 | 1 | 0 | 1 | 0 | 1 | 0 | ||||||||||||
| Oregon | 11 | 7 | 3 | 1 | 15 | 8 | 6 | 1 | ||||||||||||
| Pennsylvania | 21 | 11 | 6 | 4 | 22 | 13 | 7 | 2 | ||||||||||||
| Puerto Rico | 15 | 13 | 0 | 2 | 16 | 14 | 0 | 2 | ||||||||||||
| Rhode Island | 0 | 0 | 0 | 0 | 3 | 1 | 2 | 0 | ||||||||||||
| South Carolina | 8 | 3 | 1 | 4 | 13 | 5 | 1 | 7 | ||||||||||||
| South Dakota | 0 | 0 | 0 | 0 | 0 | 0 | 0 | 0 | ||||||||||||
| Tennessee | 8 | 7 | 1 | 0 | 8 | 7 | 1 | 0 | ||||||||||||
| Texas | 31 | 22 | 2 | 7 | 36 | 26 | 2 | 8 | ||||||||||||
| Utah | 2 | 2 | 0 | 0 | 2 | 2 | 0 | 0 | ||||||||||||
| Vermont | 0 | 0 | 0 | 0 | 0 | 0 | 0 | 0 | ||||||||||||
| Virginia | 9 | 2 | 3 | 4 | 18 | 9 | 5 | 4 | ||||||||||||
| Washington | 8 | 6 | 2 | 0 | 9 | 6 | 3 | 0 | ||||||||||||
| West Virginia | 1 | 1 | 0 | 0 | 2 | 1 | 1 | 0 | ||||||||||||
| Wisconsin | 18 | 13 | 4 | 1 | 18 | 14 | 3 | 1 | ||||||||||||
| Wyoming | 0 | 0 | 0 | 0 | 0 | 0 | 0 | 0 | ||||||||||||
| Total, U.S. | 550 | 342 | 69 | 139 | 578 | 373 | 83 | 122 | ||||||||||||
| NOTE: Columns do not sum to U.S. total because some SNPs overlap state boundaries.SOURCE: Authors’ analysis of CMS’s Landscape Files for 2016-2017. | ||||||||||||||||||||
Endnotes
- See Jacobson G, Damico A, Neuman T, and Gold M. “Medicare Advantage 2016 Spotlight: Enrollment Market Update.” Kaiser Family Foundation. June 2016. https://modern.kff.org/medicare/issue-brief/medicare-advantage-2016-spotlight-enrollment-market-update/ ↩︎
- Jacobson G, Trilling A, Neuman T, Damico A, and Gold G. “Medicare Advantage Hospital Networks: How Much Do They Vary?” Kaiser Family Foundation. June 2016. https://modern.kff.org/medicare/report/medicare-advantage-hospital-networks-how-much-do-they-vary/ ↩︎
- Medicare Payment Advisory Commission. “Medicare Advantage Program Payment System.” October 2016. http://www.medpac.gov/docs/default-source/payment-basics/medpac_payment_basics_16_ma_final.pdf ↩︎
- Medicare Payment Advisory Commission (MedPAC) “Report to the Congress: Medicare Payment Policy,” March 2016, available at http://www.medpac.gov/docs/default-source/reports/chapter-12-the-medicare-advantage-program-status-report-march-2016-report-.pdf. ↩︎
- For example, see Gold M, Jacobson G, Damico A, and Neuman T, “Medicare Advantage 2016 Spotlight: Enrollment Market Update.” May 2016. https://modern.kff.org/medicare/issue-brief/medicare-advantage-2016-spotlight-enrollment-market-update/ ↩︎
- Jacobson G, Neuman T, and Damico A. “Medicare Advantage Plan Switching: Exception or Norm?” Kaiser Family Foundation. September 2016. https://modern.kff.org/medicare/issue-brief/medicare-advantage-plan-switching-exception-or-norm/ ↩︎
- See Gold M, Hudson M, Jacobson G, and Neuman T, “Medicare Advantage 2010 Data Spotlight: Benefits and Cost-Sharing.” February 2010. https://modern.kff.org/medicare/issue-brief/medicare-advantage-2010-data-spotlight-benefits-and/ ↩︎
- Hoadley J, et al. “Medicare Part D: A First Look at Prescription Drug Plans in 2017” Kaiser Family Foundation. October 2016. http://files.kff.org/attachment/Issue-Brief-Medicare-Part-D-A-First-Look-at-Prescription-Drug-Plans-in-2017 ↩︎
- For a list of the counties, see Jacobson G, Neuman T, Damico A, and Huang J. “Medicare Advantage Plan Star Ratings and Bonus Payments in 2012.” November 2011. https://modern.kff.org/medicare/report/medicare-advantage-2012-star-ratings-and-bonuses/ ↩︎
- Jacobson G, Neuman T, and Damico A. “Medicare Advantage Plan Switching: Exception or Norm?” Kaiser Family Foundation. September 2016. https://modern.kff.org/medicare/issue-brief/medicare-advantage-plan-switching-exception-or-norm/ ↩︎
- For example, see Gold, M. Interim Report Card on Medicare+Ch0ice, Health Aff July 2001 20:4120-138; and M. Gold, L. Achman, J. Mittler, and B. Stevens.“Monitoring Medicare+Choice: What Have We Learned?” Washington DC: Mathematica Policy Research April 2004. https://www.mathematica-mpr.com/our-publications-and-findings/publications/monitoring-medicarechoice-what-have-we-learned-findings-and-operational-lessons-for-medicare-advantage ↩︎