Medicare Advantage 2016 Spotlight: Enrollment Market Update
Appendix A: Special Needs Plans
Special Needs Plans (SNPs) restrict enrollment to specific types of beneficiaries with significant or relatively specialized care needs, including beneficiaries: (1) dually eligible for Medicare and Medicaid (D-SNPs); (2) requiring a nursing home or institutional level of care (I-SNPs); or (3) with severe chronic or disabling conditions (C-SNPs.)
Enrollment in SNPs increased modestly from 2.0 million to 2.1 million beneficiaries between 2015 and 2016 (Figure A1 and Table A8). In 2016, SNP enrollees account for about 12 percent of total Medicare Advantage enrollment, but account for a larger share of the Medicare Advantage enrollment in some states. In five states and the District of Columbia, enrollment in SNPs comprises more than one-fifth of Medicare Advantage enrollment (35% in DC, 28% in SC, 22% in AZ, 21% in AR, and 20% in AL and MS; data not shown).
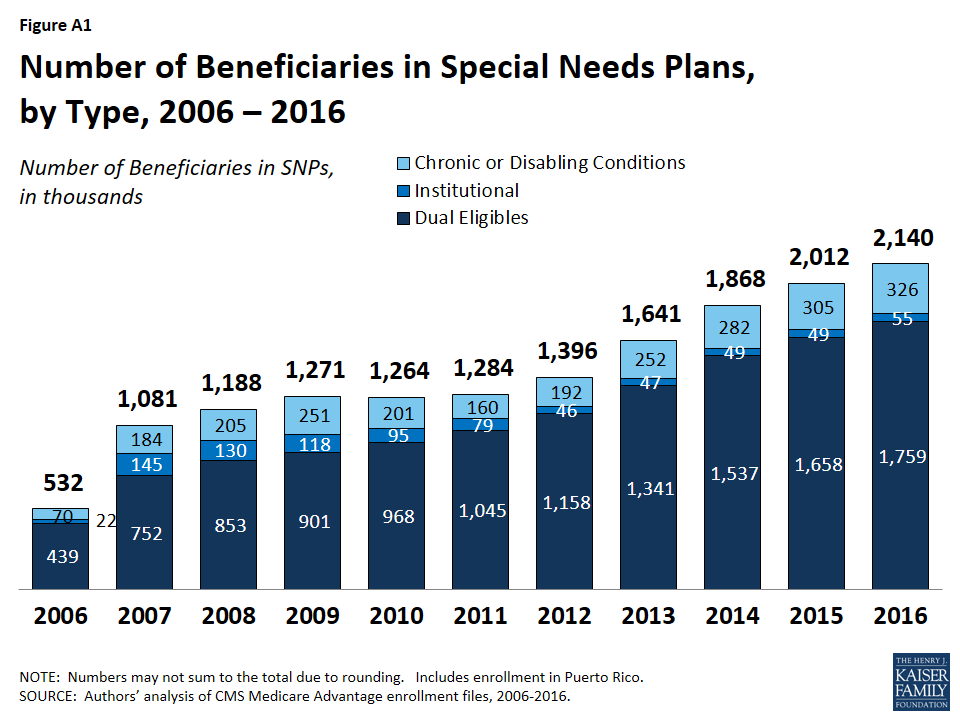
Figure A1: Number of Beneficiaries in Special Needs Plans, by Type, 2006 – 2016
Similar to prior years, most SNP enrollees are in HMOs (86%), with 11 percent enrolled regional PPOs and 3 percent in local PPOs. The majority of SNP enrollees (82%) are in plans serving those dually eligible for Medicare and Medicaid (D-SNPs). Enrollment of dually eligible beneficiaries in D-SNPs varies greatly by state, and is particularly prevalent in Hawaii (50%) and Arizona (40%) (Table A8).
Separately, several states are undertaking demonstrations with CMS to improve the alignment of Medicare and Medicaid for dually eligible beneficiaries using a capitated model, with the first state (Washington) beginning enrollment in its demonstration in July 2013. As of March 2016, more than 400,000 dual eligibles were enrolled in the demonstrations (Table A9). Most of these enrollees are not included in the SNP enrollment statistics provided here because they operate under unique authority and CMS classifies them as demonstrations. Minnesota is an exception because the demonstration uses its existing D-SNPs to improve the administrative alignment of Medicare and Medicaid in the state’s D-SNPs. In most states operating demonstrations for dual eligibles, enrollment in D-SNPs has increased since the demonstrations began in 2013. In the few states in which enrollment in D-SNPs has declined since 2013 (CA, MI, and MN), the decline has been much smaller than the total enrollment in the state demonstration. As a consequence, in all states operating demonstrations, the total number of dual eligibles in capitated Medicare arrangements has increased since 2013. It is unclear whether D-SNPs will continue to operate alongside the demonstrations in these states or how the demonstrations will affect the growth in D-SNP enrollment over time.
Appendix B: Tables
| Table A1. Medicare Advantage Enrollment by State and Plan Type, 2016 | |||||||
| State | Total | Distribution of Enrollment, by State and Plan Type | |||||
| % in HMOs | % in Local PPOs | % in Regional PPOs | % in PFFS Plans | % in Cost Plans | % in Other Plans | ||
| Total U.S. | 17,625,200 | 64% | 23% | 7% | 1% | 3% | <1% |
| Alabama | 257,218 | 61% | 33% | 6% | <1% | 0% | <1% |
| Alaska | 93 | 0% | 100% | 0% | 0% | 0% | 0% |
| Arizona | 442,282 | 92% | 6% | 2% | 1% | <1% | 0% |
| Arkansas | 121,543 | 42% | 16% | 26% | 16% | 0% | <1% |
| California | 2,244,709 | 96% | 3% | 0% | <1% | <1% | <1% |
| Colorado | 293,275 | 81% | 9% | 0% | 1% | 8% | 1% |
| Connecticut | 165,722 | 86% | 11% | 3% | 0% | 0% | 0% |
| Delaware | 16,792 | 55% | 44% | 0% | 0% | 0% | 1% |
| District of Columbia | 12,292 | 15% | 36% | 0% | 0% | 49% | 0% |
| Florida | 1,670,266 | 71% | 7% | 22% | <1% | <1% | <1% |
| Georgia | 508,161 | 32% | 44% | 22% | 2% | 0% | 0% |
| Hawaii | 113,451 | 41% | 56% | 3% | 0% | 0% | 0% |
| Idaho | 90,435 | 56% | 43% | 0% | 1% | 0% | 0% |
| Illinois | 405,756 | 45% | 52% | 2% | 1% | <1% | 0% |
| Indiana | 279,338 | 24% | 57% | 18% | 1% | 0% | <1% |
| Iowa | 98,790 | 30% | 60% | 0% | 1% | 9% | <1% |
| Kansas | 67,733 | 43% | 48% | 2% | 6% | 0% | <1% |
| Kentucky | 229,916 | 20% | 56% | 22% | 1% | 0% | 0% |
| Louisiana | 249,920 | 87% | 5% | 8% | <1% | 0% | <1% |
| Maine | 75,116 | 63% | 32% | 0% | 5% | 0% | 0% |
| Maryland | 88,998 | 31% | 25% | 0% | 0% | 44% | <1% |
| Massachusetts | 246,018 | 76% | 18% | 4% | 0% | 0% | 1% |
| Michigan | 621,118 | 39% | 56% | 4% | 1% | 0% | <1% |
| Minnesota | 510,713 | 23% | 7% | 0% | <1% | 69% | 0% |
| Mississippi | 85,208 | 53% | 16% | 29% | 2% | 0% | 0% |
| Missouri | 337,119 | 66% | 21% | 11% | 2% | 0% | <1% |
| Montana | 39,200 | 4% | 91% | 0% | 5% | 0% | 0% |
| Nebraska | 37,169 | 59% | 24% | <1% | 17% | <1% | <1% |
| Nevada | 157,379 | 89% | 11% | 0% | 0% | 0% | 0% |
| New Hampshire | 20,756 | 51% | 30% | 0% | 19% | 0% | 0% |
| New Jersey | 245,651 | 74% | 25% | <1% | 0% | 0% | <1% |
| New Mexico | 120,099 | 64% | 35% | 0% | 1% | 0% | <1% |
| New York | 1,243,714 | 73% | 16% | 8% | 2% | <1% | <1% |
| North Carolina | 547,079 | 44% | 49% | 6% | 1% | 0% | <1% |
| North Dakota | 21,627 | 0% | 7% | 0% | <1% | 92% | 1% |
| Ohio | 748,125 | 53% | 38% | 7% | <1% | 1% | <1% |
| Oklahoma | 116,489 | 66% | 27% | 3% | 4% | 0% | <1% |
| Oregon | 339,461 | 63% | 36% | 0% | <1% | 0% | <1% |
| Pennsylvania | 1,022,462 | 63% | 35% | 1% | 1% | 0% | <1% |
| Rhode Island | 72,954 | 94% | 4% | 2% | 0% | 0% | <1% |
| South Carolina | 224,130 | 30% | 20% | 46% | 4% | 0% | <1% |
| South Dakota | 31,158 | <1% | 22% | 0% | 1% | 76% | 0% |
| Tennessee | 440,394 | 69% | 29% | 2% | 0% | 0% | <1% |
| Texas | 1,174,621 | 58% | 24% | 13% | 2% | 2% | <1% |
| Utah | 120,237 | 82% | 18% | 0% | 0% | 0% | 0% |
| Vermont | 9,671 | 11% | 18% | 52% | 19% | 0% | 0% |
| Virginia | 219,382 | 40% | 25% | 12% | 13% | 9% | 1% |
| Washington | 360,712 | 86% | 14% | 0% | <1% | 0% | <1% |
| West Virginia | 103,805 | 8% | 82% | 5% | 5% | 0% | 0% |
| Wisconsin | 410,771 | 48% | 32% | 4% | 3% | 13% | 1% |
| Wyoming | 2,079 | 8% | 18% | 0% | 69% | 0% | 5% |
|
NOTE: Total U.S. includes Puerto Rico. Includes employer-sponsored plans, special needs plans, and other private plans. Other includes MSAs and demonstration plans.
SOURCE: Authors’ analysis of CMS Medicare Advantage enrollment and Landscape files, 2016.
|
|||||||
| Table A4. Weighted Average Premiums and the Share of Enrollees with Zero Premium in Medicare Advantage Prescription Drug Plans (MA-PDs), 2010-2016 |
|||||||
| 2010 | 2011 | 2012 | 2013 | 2014 | 2015 | 2016 | |
| Weighted Average Monthly Premiums for MA-PDs | |||||||
| Total | $44 | $39 | $35 | $35 | $35 | $38 | $37 |
| HMOs | $36 | $34 | $29 | $27 | $27 | $28 | $28 |
| Local PPOs | $66 | $59 | $53 | $57 | $59 | $65 | $63 |
| Regional PPOs | $29 | $23 | $26 | $29 | $32 | $36 | $37 |
| PFFS Plans | $55 | $43 | $42 | $51 | $63 | $68 | $76 |
| Share of Enrollees in MA-PDs with Zero Premium | |||||||
| Total | 48% | 53% | 56% | 55% | 56% | 48% | 49% |
| HMOs | 59% | 62% | 65% | 67% | 66% | 59% | 59% |
| Local PPOs | 23% | 23% | 29% | 24% | 25% | 18% | 22% |
| Regional PPOs | 48% | 63% | 59% | 49% | 54% | 39% | 38% |
| PFFS Plans | 15% | 23% | 29% | 17% | 17% | 0% | 0% |
|
NOTE: Excludes SNPs, employer-sponsored (i.e., group) plans, demonstrations, HCPPs, PACE plans, and plans for special populations. Includes only Medicare Advantage plans that offer Part D benefits. The total includes cost plans (not shown separately), as well as plans with zero premiums. The premiums for a subset of sanctioned plans were not available in 2011; these plans were excluded from this analysis. Excludes beneficiaries with unknown county addresses and beneficiaries in territories other than Puerto Rico.
SOURCE: Authors’ analysis of CMS’s Landscape Files for 2010–2016 and March Enrollment files for 2010-2016.
|
|||||||
| Table A7. Medicare Advantage Market Share by Firm, by State, 2016 | ||||||||
| State | Total Medicare Advantage Enrollment | Medicare Advantage Penetration Rate | Humana Medicare Advantage Market Share |
Aetna Medicare Advantage Market Share |
Combined Aetna-Humana Market Share |
Cigna Medicare Advantage Market Share |
Anthem Medicare Advantage Market Share |
Combined Anthem-Cigna Market Share |
| Total U.S. | 17,625,200 | 31% | 18% | 7% | 25% | 3% | 3% | 6% |
| Alabama | 257,218 | 26% | 20% | 1% | 21% | 23% | <1% | 23% |
| Alaska | 93 | <1% | 39% | 39% | ||||
| Arizona | 442,282 | 38% | 12% | 1% | 13% | 12% | 3% | 14% |
| Arkansas | 121,543 | 20% | 35% | 7% | 42% | 2% | 2% | |
| California | 2,244,709 | 39% | 3% | 1% | 4% | 4% | 4% | |
| Colorado | 293,275 | 36% | 13% | 1% | 14% | <1% | <1% | |
| Connecticut | 165,722 | 26% | 0% | 21% | 21% | 8% | 8% | |
| Delaware | 16,792 | 9% | 10% | 44% | 53% | 34% | 34% | |
| District of Columbia | 12,292 | 14% | 0% | 7% | 7% | 8% | 8% | |
| Florida | 1,670,266 | 41% | 36% | 6% | 42% | 3% | 2% | 5% |
| Georgia | 508,161 | 33% | 22% | 10% | 32% | 9% | 1% | 9% |
| Hawaii | 113,451 | 46% | 12% | <1% | 12% | |||
| Idaho | 90,435 | 31% | 9% | <1% | 9% | |||
| Illinois | 405,756 | 19% | 25% | 11% | 36% | 5% | <1% | 5% |
| Indiana | 279,338 | 24% | 37% | 3% | 40% | 1% | 15% | 16% |
| Iowa | 98,790 | 17% | 20% | 36% | 56% | |||
| Kansas | 67,733 | 14% | 42% | 43% | 86% | 1% | 1% | |
| Kentucky | 229,916 | 26% | 60% | 2% | 62% | 16% | 16% | |
| Louisiana | 249,920 | 31% | 65% | 1% | 66% | |||
| Maine | 75,116 | 24% | 6% | 22% | 29% | 3% | 3% | |
| Maryland | 88,998 | 9% | 2% | 8% | 10% | 16% | 16% | |
| Massachusetts | 246,018 | 20% | <1% | 1% | 1% | <1% | <1% | |
| Michigan | 621,118 | 32% | 9% | 2% | 11% | |||
| Minnesota | 510,713 | 55% | 6% | <1% | 7% | |||
| Mississippi | 85,208 | 15% | 63% | 1% | 64% | 13% | 13% | |
| Missouri | 337,119 | 29% | 20% | 29% | 48% | <1% | 2% | 2% |
| Montana | 39,200 | 19% | 14% | <1% | 15% | |||
| Nebraska | 37,169 | 12% | 14% | 33% | 47% | |||
| Nevada | 157,379 | 34% | 33% | 4% | 37% | 4% | 4% | |
| New Hampshire | 20,756 | 8% | 15% | 2% | 17% | 12% | 12% | |
| New Jersey | 245,651 | 16% | 0% | 26% | 26% | <1% | 3% | 3% |
| New Mexico | 120,099 | 32% | 13% | 1% | 14% | 2% | 2% | |
| New York | 1,243,714 | 37% | 2% | 5% | 7% | 6% | 6% | |
| North Carolina | 547,079 | 30% | 33% | 10% | 43% | 2% | 2% | |
| North Dakota | 21,627 | 18% | 7% | 0% | 7% | |||
| Ohio | 748,125 | 34% | 16% | 25% | 41% | 25% | 25% | |
| Oklahoma | 116,489 | 17% | 28% | 3% | 31% | |||
| Oregon | 339,461 | 44% | 1% | <1% | 1% | |||
| Pennsylvania | 1,022,462 | 40% | 4% | 21% | 25% | 5% | <1% | 5% |
| Rhode Island | 72,954 | 35% | <1% | <1% | ||||
| South Carolina | 224,130 | 23% | 44% | 2% | 46% | 5% | <1% | 5% |
| South Dakota | 31,158 | 20% | 16% | 6% | 23% | |||
| Tennessee | 440,394 | 35% | 30% | 1% | 31% | 21% | 2% | 23% |
| Texas | 1,174,621 | 32% | 24% | 13% | 37% | 10% | 3% | 12% |
| Utah | 120,237 | 34% | 6% | 8% | 15% | |||
| Vermont | 9,671 | 7% | <1% | 2% | 2% | |||
| Virginia | 219,382 | 16% | 60% | 5% | 65% | 3% | 3% | |
| Washington | 360,712 | 30% | 9% | <1% | 9% | <1% | <1% | |
| West Virginia | 103,805 | 25% | 70% | 16% | 86% | |||
| Wisconsin | 410,771 | 38% | 18% | <1% | 18% | 1% | 1% | |
| Wyoming | 2,079 | 2% | 3% | 9% | 11% | |||
|
NOTE: Totals may not sum to 100% due to rounding. Includes employer-sponsored plans, special needs plans, and other private plans. Total U.S. includes Puerto Rico. Blank cells indicate no plans offered. Anthem includes BCBS plans and other plans.
SOURCE: Authors’ analysis of CMS Medicare Advantage enrollment and Landscape files, 2016.
|
||||||||
| Table A8. Enrollment in Special Needs Plans (SNPs), by Plan Type and State, 2016 | ||||||
| State | Enrollment in Special Needs Plans | Total Dual Eligibles (in 2014) | % of Dual Eligibles in D-SNPs | |||
| Total | Dual eligibles (D-SNPs) |
Institutional (I-SNPs) |
Chronic or disabling conditions (C-SNPs) | |||
| Total U.S. | 1,852,085 | 1,482,050 | 55,439 | 314,596 | 11,063,740 | 13% |
| Alabama | 51,365 | 51,103 | 262 | 0 | 222,740 | 23% |
| Alaska | 0 | 0 | 0 | 0 | 17,420 | 0% |
| Arizona | 96,389 | 80,156 | 2,192 | 14,041 | 199,180 | 40% |
| Arkansas | 25,705 | 12,877 | 12,828 | 138,480 | 9% | |
| California | 191,776 | 145,860 | 2,451 | 43,465 | 1,424,500 | 10% |
| Colorado | 12,278 | 9,417 | 2,772 | 89 | 112,220 | 8% |
| Connecticut | 17,222 | 14,310 | 2,912 | 0 | 181,120 | 8% |
| Delaware | 2,232 | 988 | 520 | 724 | 30,440 | 3% |
| District of Columbia | 4,253 | 4,045 | 80 | 128 | 32,580 | 12% |
| Florida | 301,744 | 232,581 | 3,840 | 65,323 | 819,220 | 28% |
| Georgia | 98,080 | 52,120 | 2,541 | 43,419 | 330,800 | 16% |
| Hawaii | 20,068 | 20,068 | 0 | 0 | 39,860 | 50% |
| Idaho | 2,120 | 2,120 | 0 | 0 | 45,980 | 5% |
| Illinois | 14,249 | 11,561 | 944 | 1,744 | 402,620 | 3% |
| Indiana | 3,130 | 1,720 | 753 | 657 | 205,580 | 1% |
| Iowa | 0 | 0 | 0 | 0 | 91,920 | 0% |
| Kansas | 285 | 0 | 228 | 57 | 71,540 | 0% |
| Kentucky | 7,246 | 6,093 | 79 | 1,074 | 198,640 | 3% |
| Louisiana | 33,419 | 31,084 | 0 | 2,335 | 218,100 | 14% |
| Maine | 2,667 | 2,563 | 0 | 104 | 96,480 | 3% |
| Maryland | 12,443 | 5,601 | 2,870 | 3,972 | 148,480 | 4% |
| Massachusetts | 37,924 | 37,580 | 132 | 212 | 320,920 | 12% |
| Michigan | 12,489 | 12,384 | 16 | 89 | 330,840 | 4% |
| Minnesota | 36,591 | 36,591 | 0 | 0 | 149,660 | 24% |
| Mississippi | 16,675 | 14,697 | 0 | 1,978 | 172,020 | 9% |
| Missouri | 27,362 | 11,653 | 314 | 15,395 | 199,400 | 6% |
| Montana | 33 | 33 | 0 | 0 | 27,420 | <1% |
| Nebraska | 11 | 11 | 0 | 0 | 45,340 | <1% |
| Nevada | 9,998 | 0 | 514 | 9,484 | 60,200 | 0% |
| New Hampshire | 28 | 28 | 0 | 0 | 35,120 | <1% |
| New Jersey | 16,309 | 14,211 | 1,898 | 200 | 229,660 | 6% |
| New Mexico | 13,443 | 13,142 | 301 | 0 | 86,000 | 15% |
| New York | 218,678 | 201,444 | 16,474 | 760 | 900,480 | 22% |
| North Carolina | 25,306 | 19,764 | 2,457 | 3,085 | 345,240 | 6% |
| North Dakota | 0 | 0 | 0 | 0 | 17,540 | 0% |
| Ohio | 17,368 | 14,294 | 1,131 | 1,943 | 376,040 | 4% |
| Oklahoma | 156 | 0 | 156 | 0 | 124,120 | 0% |
| Oregon | 27,872 | 22,193 | 748 | 4,931 | 128,180 | 17% |
| Pennsylvania | 124,470 | 111,431 | 3,383 | 9,656 | 469,580 | 24% |
| Rhode Island | 1,610 | 11 | 1,599 | 0 | 43,360 | <1% |
| South Carolina | 62,133 | 22,518 | 0 | 39,615 | 164,720 | 14% |
| South Dakota | 0 | 0 | 0 | 0 | 22,880 | 0% |
| Tennessee | 79,561 | 79,561 | 0 | 0 | 285,100 | 28% |
| Texas | 162,745 | 130,210 | 229 | 32,306 | 740,940 | 18% |
| Utah | 8,036 | 8,036 | 0 | 0 | 39,620 | 20% |
| Vermont | 0 | 0 | 0 | 0 | 30,880 | 0% |
| Virginia | 5,379 | 1,737 | 163 | 3,479 | 204,900 | 1% |
| Washington | 26,226 | 24,574 | 1,652 | 0 | 200,040 | 12% |
| West Virginia | 371 | 371 | 0 | 0 | 93,240 | <1% |
| Wisconsin | 24,640 | 21,309 | 1,828 | 1,503 | 180,020 | 12% |
| Wyoming | 0 | 0 | 0 | 0 | 12,380 | 0% |
|
NOTE: Excludes Puerto Rico. Blank cells indicate no plans offered.
SOURCE: Authors’ analysis of CMS Medicare Advantage enrollment and Landscape files, 2016. Number of dual eligibles by state is derived from the CMS Chronic Conditions Data Warehouse standard analytic files for 2014.
|
||||||
| Table A9. Enrollment in Dual Eligible Special Needs Plans and Financial/Administrative Alignment Demonstrations, by State, 2016 | ||||
| State | Enrollment in Dual Eligible Special Needs Plans (D-SNPs) | Enrollment in Financial Alignment Demonstration | ||
| 2013 | 2016 | Change, 2013-2016 |
||
| Total U.S. | 1,099,100 | 1,482,050 | 382,950 | 365,826 |
| Alabama | 38,281 | 51,103 | 12,822 | 0 |
| Alaska | 0 | 0 | 0 | 0 |
| Arizona | 68,495 | 80,156 | 11,661 | 0 |
| Arkansas | 9,189 | 12,877 | 3,688 | 0 |
| California | 190,668 | 145,860 | -44,808 | 126,057 |
| Colorado | 8,444 | 9,417 | 973 | 0 |
| Connecticut | 4,612 | 14,310 | 9,698 | 0 |
| Delaware | 733 | 988 | 255 | 0 |
| District of Columbia | 1,756 | 4,045 | 2,289 | 0 |
| Florida | 135,100 | 232,581 | 97,481 | 0 |
| Georgia | 17,500 | 52,120 | 34,620 | 0 |
| Hawaii | 15,442 | 20,068 | 4,626 | 0 |
| Idaho | 662 | 2,120 | 1,458 | 0 |
| Illinois | 5,617 | 11,561 | 5,944 | 48,192 |
| Indiana | 2,998 | 1,720 | -1,278 | 0 |
| Iowa | 726 | 0 | -726 | 0 |
| Kansas | 0 | 0 | 0 | 0 |
| Kentucky | 683 | 6,093 | 5,410 | 0 |
| Louisiana | 18,354 | 31,084 | 12,730 | 0 |
| Maine | 2,553 | 2,563 | 10 | 0 |
| Maryland | 5,480 | 5,601 | 121 | 0 |
| Massachusetts | 23,616 | 37,580 | 13,964 | 12,524 |
| Michigan | 15,490 | 12,384 | -3,106 | 34,177 |
| Minnesota | 36,975 | 36,591 | -384 | 36,591 |
| Mississippi | 9,336 | 14,697 | 5,361 | 0 |
| Missouri | 8,383 | 11,653 | 3,270 | 0 |
| Montana | 0 | 33 | 33 | 0 |
| Nebraska | 1,073 | 11 | -1,062 | 0 |
| Nevada | 12 | 0 | -12 | 0 |
| New Hampshire | 12 | 28 | 16 | 0 |
| New Jersey | 23,745 | 14,211 | -9,534 | 0 |
| New Mexico | 6,076 | 13,142 | 7,066 | 0 |
| New York | 124,216 | 201,444 | 77,228 | 5,801 |
| North Carolina | 10,585 | 19,764 | 9,179 | 0 |
| North Dakota | 0 | 0 | 0 | 0 |
| Ohio | 11,754 | 14,294 | 2,540 | 62,177 |
| Oklahoma | 0 | 0 | 0 | 0 |
| Oregon | 19,271 | 22,193 | 2,922 | 0 |
| Pennsylvania | 93,372 | 111,431 | 18,059 | 0 |
| Rhode Island | 11 | 11 | 0 | |
| South Carolina | 9,213 | 22,518 | 13,305 | 1,418 |
| South Dakota | 0 | 0 | 0 | 0 |
| Tennessee | 51,760 | 79,561 | 27,801 | 0 |
| Texas | 87,476 | 130,210 | 42,734 | 48,010 |
| Utah | 7,497 | 8,036 | 539 | 0 |
| Vermont | 0 | 0 | 0 | 0 |
| Virginia | 635 | 1,737 | 1,102 | 27,470 |
| Washington | 16,988 | 24,574 | 7,586 | 0 |
| West Virginia | 44 | 371 | 327 | 0 |
| Wisconsin | 14,278 | 21,309 | 7,031 | 0 |
| Wyoming | 0 | 0 | 0 | 0 |
|
NOTE: Excludes Puerto Rico. Blank cells indicate no plans offered. Excludes dual eligible beneficiaries enrolled in financial/administrative alignment demonstrations who are missing state designation. All enrollment is from March of the respective year.
SOURCE: Authors’ analysis of CMS Medicare Advantage enrollment and Landscape files, 2013 and 2016.
|
||||