Key Questions About the Impact of Coronavirus on Long-Term Care Facilities Over Time
Summary
Long-term care (LTC) facilities have experienced a disproportionate share of deaths during the COVID-19 pandemic. The most recently available data show long-term care facilities making up 8% of all coronavirus cases, but more than 40% of all COVID-19 deaths. This analysis evaluates trends of long-term care cases and deaths between April and August 2020 to evaluate where and when the pandemic has hit long-term care facilities the hardest, how the share of cases and deaths attributed to long-term care facilities has changed over time, and whether states continue to report new cases and deaths in these facilities at the same rate now as they did back in April.
This analysis presents trends in long-term care data for states that have reported long-term care cases (35 states) and deaths (36 states) since early April 2020 (see methods and limitations for more details). Federally available, facility-specific data was not used for this analysis because facilities were not required to begin reporting until May 8, which would miss peaks in cases and deaths in April and May. Key findings from our analysis include:
- Nationally, reported cumulative cases and deaths in long-term care facilities have increased over time, increasing from 10,000 deaths and 50,000 cases in mid-April to over 70,000 deaths and nearly 400,000 cases in mid-August. However, trends in cases and deaths vary notably across states. (Interactives 1 and 2). Some states, such as New York and Massachusetts, experienced a surge of long-term care cases and deaths that peaked and plateaued much earlier than other states where long-term cases and deaths were first reported in later months and have continued to climb, such as Texas and North Carolina (Interactives 1 and 2).
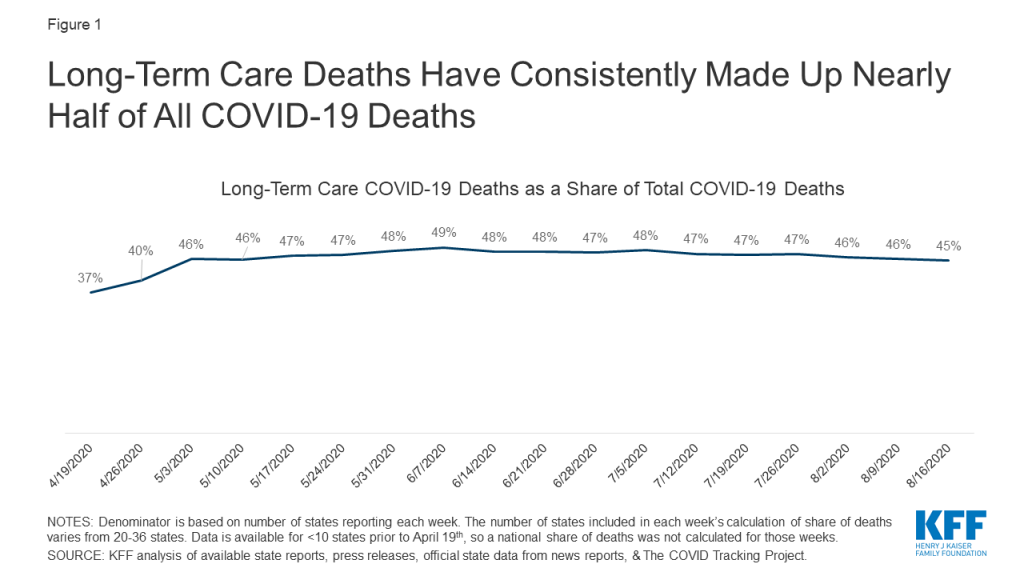
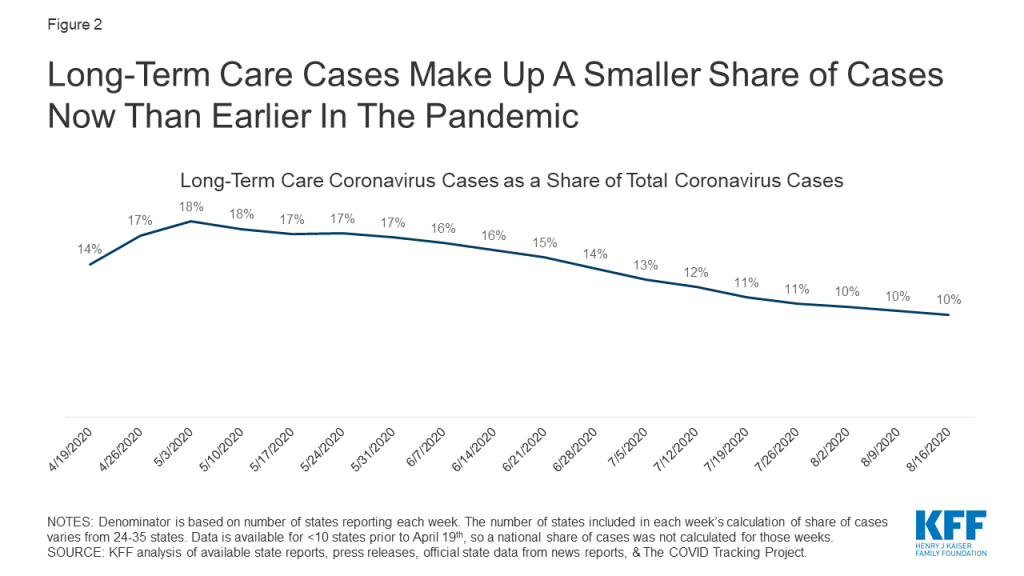
- Nationally, the share of deaths attributed to LTC facilities has stayed relatively constant since May, but the share of cases attributed to LTC facilities has decreased over time (Figures 1 and 2). The decreasing share of cases attributed to long-term care facilities is likely due broader availability of testing that contributed to the identification of more cases in the general population, particularly in younger age groups, in June and July.
- Nationally, the number of new LTC cases and deaths peaked in April, decreased in May and June, before rising in July, followed by a rise in new LTC deaths in August (Figure 3 and Table 2). These patterns of new LTC cases and deaths generally follow the patterns of cases and deaths that we have seen nationally, indicating a strong connection between community spread with cases and deaths in long-term care facilities. Recent analysis on cases in hotspot states supports this notion as well. A key distinction here is the number of new LTC cases per 100,000 residents in July and August was much lower than new LTC cases in April and May, which differs from the national pattern where new cases in the summer months were higher than new cases in April and May. (Figure 3).
Issue Brief
1. How do trends in total cases and deaths in long-term care facilities vary by state?
Total cases and deaths in long-term care facilities have increased over time, with notable differences across states (Interactives 1 and 2). Examining visual trend lines in cumulative cases and deaths since April indicates that there are some states, such as New York, Massachusetts, New Jersey, and Connecticut, that have “flattened the curve”, while other states, such as California, Texas, Georgia, and Ohio, have continued to see a rise in long-term care cases and deaths (Interactives 1 and 2).
As of August 20th, states with the highest burden of COVID-19 long-term care cases and deaths per 100,000 state residents were among those that experienced the earliest peaks in both long-term care and overall cases and deaths (Table 1). New Jersey, Massachusetts, Louisiana, Rhode Island, and Connecticut had the highest burden of cases and deaths in LTC facilities per 100,000 state residents (>250 cases per 100,000 residents and >40 deaths per 100,000 residents) among all states that report data. With the exception of Louisiana, these states were also among the states that experienced relatively large numbers of long-term care cases and deaths in the earlier months of the pandemic (Interactives 1 and 2, Table 2).
In contrast, while long-term care cases and deaths in states like California and Texas continued to rise into the summer months, after other states had flattened their curve (Interactives 1 and 2, Table 2), these states experienced a smaller number of long-term care cases and deaths per 100,000 residents (11-12 deaths and 118 cases per 100,000 state residents) than states that peaked in March/April (>40 deaths and >250 cases per 100,000 state residents) (Table 1). With the number of cases and deaths in these states continuing to rise, it will be important to re-assess the extent to which this finding holds over time.
Interactive 1:
–
Interactive 2:
–
2. How has the national share of deaths and cases attributed to long-term care facilities changed over time?
Nationally, the share of deaths attributed to long-term care facilities has stayed relatively constant over time (Figure 1). The share of reported deaths attributed to long-term care facilities increased from 37% the week of April 19th to 46% the week of May 3rd and has stayed relatively constant since then. The increase in share of deaths attributed to LTC facilities from April to May may be attributed to better reporting (Figure 1). Notably, 7 additional states started reporting data on deaths between the week of April 19th and the week of May 3rd.
In contrast, the share of cases attributed to long-term care facilities has decreased over time. When long-term care data began to be reported by more states in mid-April, 1 in every 7 coronavirus cases was a long-term care facility resident or staff member. By the beginning of May, that share had increased to nearly 1 of every 5 cases. However, since then, the share of cases attributed to residents and staff in long-term care facilities has decreased. The most recent data from mid-August show that 1 in every 10 cases is a long-term care facility case (Figure 2). This decrease can likely be attributed to an increase in testing of the general population, most likely due to the increased community transmission that occurred in June and July.These new cases primarily skewed towards a younger population, so share of cases attributed to long-term care facilities has decreased.
3. What has happened with new cases and deaths in long-term care facilities nationally and at the state-level?
Nationally, new reported long-term care cases per week were the highest in April and decreased through May and June, before increasing again in July and August. (Figure 3 and Table 2). The number of new long-term care cases nationwide decreased from April to May (16.6 cases to 10.0 cases per 100,000 US residents) and again in June (4.1 cases per 100,000 US residents). However, beginning in July, new cases began to rise again (5.2 cases per 100,000 US residents) and again in August to 6.0 new long-term care cases per 100,000 US residents.
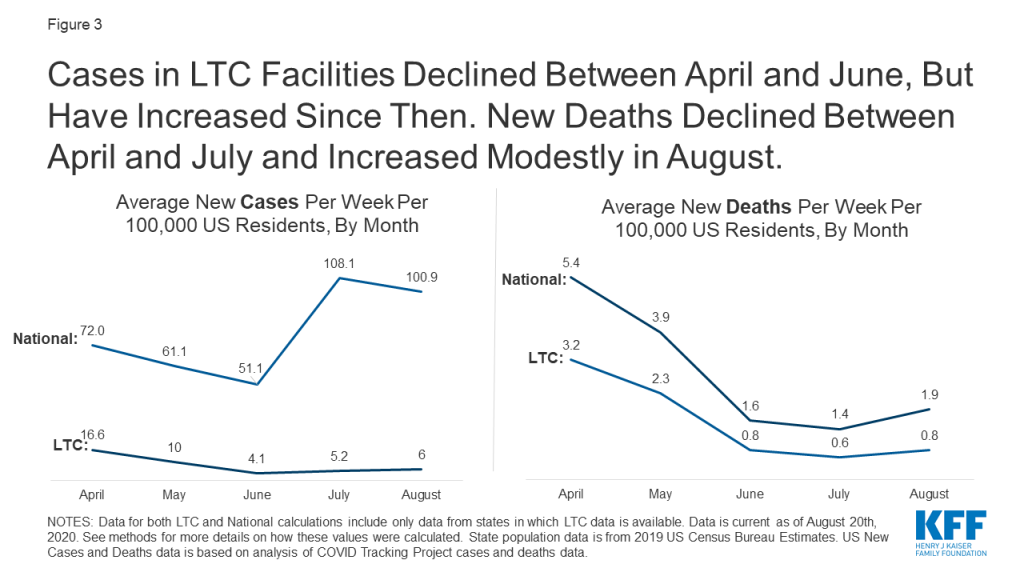
New reported long-term care COVID-19 deaths per week were the highest in April, decreased through May, June, and July, before increasing modestly in August (Figure 3 and Table 2). New weekly long-term care deaths decreased from April to May (3.2 deaths to 2.3 deaths per 100,000 US residents), to June (0.8 deaths per 100,000 US residents), to July (to 0.6 deaths per 100,000 US residents) before increasing slightly in August to 0.8 deaths per 100,000 US residents.
The number of new LTC cases and deaths per 100,000 US residents was overall lower in July and August than in April and May. This pattern of new LTC cases differs from national new case trends, while the pattern of new LTC deaths is similar to national new death trends (Figure 3 and Table 2). New LTC outbreaks were more severe in the earliest months of the outbreak (primarily in the Northeast) than in more recent months, based on the lower number of new LTC cases and deaths per week (Figure 3 and Table 2). This pattern mirrors new deaths nationally, but is in contrast to national new case trends where, new cases in the general population were higher in July and August than in April and May (Figure 3). It is important to continue to track new LTC cases and deaths in the coming months to understand if we are at the beginning of a continued increase in new LTC cases and deaths that will outpace the rate of new cases and deaths identified in April and May.
Trends in long-term care facilities may mirror trends in community outbreaks, but may also be affected by measures that have been put in place to mitigate the impact of the pandemic on residents and staff. Trends of new cases and deaths, as well as recent analysis of cases and deaths by hotspot state status, support the idea that increased community transmission plays a role in increasing cases and deaths in long-term care facilities. However, nationally, long-term care facilities have seen less severe outbreaks now than they did earlier in the pandemic. While the severity of long-term care cases and outbreaks have decreased, potentially as a result of policies restricting visitors, implementing universal testing of staff and residents, and greater social distancing in communities, it will be important to look at burden of cases/deaths and new cases/deaths again if states experience a rise in cases and deaths in the community.
Tables
| Table 1: Long-Term Care Coronavirus Cases and Deaths Per 100,000 Residents As of August 20th, 2020 | ||
| State | Long-Term Care Cases Per 100,000US and State Residents | Long-Term Care Deaths Per 100,000US and State Residents |
| US TOTAL | 128 cases per 100,000 US residents(35 states) | 23 cases per 100,000 US residents(36 states) |
| Alabama | 148 per 100,00 State Residents | N/A |
| Arkansas | 42 | N/A |
| California | 118 | 12 per 100,000 State Residents |
| Colorado | 88 | 13 |
| Connecticut | 287 | 91 |
| Delaware | 127 | 37 |
| District of Columbia | 147 | 24 |
| Florida | N/A | 19 |
| Georgia | 170 | 19 |
| Idaho | 105 | 10 |
| Illinois | 208 | 34 |
| Indiana | 148 | 27 |
| Iowa | N/A | 17 |
| Kansas | 57 | 7 |
| Kentucky | 112 | 12 |
| Louisiana | 319 | 42 |
| Maryland | 244 | 35 |
| Massachusetts | 356 | 82 |
| Michigan | 123 | 21 |
| Minnesota | 74 | 23 |
| Mississippi | 154 | 31 |
| Nevada | 78 | 7 |
| New Jersey | 425 | 79 |
| New York | N/A | 34 |
| North Carolina | 103 | 12 |
| North Dakota | N/A | 9 |
| Ohio | 138 | 22 |
| Oklahoma | 73 | 7 |
| Oregon | 43 | 5 |
| Pennsylvania | 194 | 40 |
| Rhode Island | 280 | 76 |
| South Carolina | 127 | 18 |
| Tennessee | 74 | 6 |
| Texas | 118 | 11 |
| Utah | 66 | 5 |
| Vermont | 38 | N/A |
| Virginia | 105 | 15 |
| Washington | 82 | 13 |
| Wisconsin | 28 | 7 |
| NOTES: All state data is “per 100,000 State Residents”. See methods for more details on how these values were calculated. State population data is from 2019 US Census Bureau Estimates. | ||
| Table 2: Average New LTC Cases and Deaths Per Week Per 100,000 Residents, By Month | ||||||||||
| State | Average New Cases Per Week Per 100,000US and State Residents | Average New Deaths Per Week Per 100,000US and State Residents | ||||||||
| April | May | June | July | August | April | May | June | July | August | |
| US TOTAL | 16.6(24 states) | 10.0(31 states) | 4.1(35 states) | 5.2(35 states) | 6.0(34 states) | 3.2(20 states) | 2.3(31 states) | 0.8(36 states) | 0.6(36 states) | 0.8(35 states) |
| Alabama | 5.7 | 7.3 | 7.3 | 8.4 | 9.6 | |||||
| Arkansas | 1.3 | 1.4 | 2.7 | 4.3 | ||||||
| California | 8.8 | 7.1 | 3.6 | 8.7 | 7.9 | 0.8 | 0.5 | 0.7 | 0.5 | |
| Colorado | 9.7 | 6.2 | 1.6 | 1.1 | 1.2 | 1.1 | 1.0 | 0.4 | 0.2 | 0.1 |
| Connecticut | 52.8 | 22.9 | 2.9 | 1.8 | 0.8 | 12.3 | 9.1 | 1.7 | 0.8 | 0.1 |
| Delaware | 7.7 | 13.7 | 6.0 | 1.0 | 1.5 | 2.4 | 3.0 | 2.3 | 0.9 | 0.1 |
| District of Columbia | 9.4 | 16.8 | 4.3 | 1.9 | 1.6 | 4.0 | 3.4 | 0.3 | 0.2 | |
| Florida | 0.8 | 0.8 | 0.7 | 1.0 | 2.1 | |||||
| Georgia | 12.0 | 7.5 | 4.4 | 9.4 | 11.4 | 1.1 | 1.1 | 0.5 | 0.8 | 1.3 |
| Idaho | 2.1 | 9.1 | 14.8 | 0.1 | 0.7 | 1.2 | ||||
| Illinois | 22.5 | 17.8 | 7.9 | 4.0 | 4.0 | 3.1 | 3.3 | 1.4 | 0.6 | 0.5 |
| Indiana | 8.6 | 3.7 | 15.1 | 2.8 | 2.0 | 0.8 | 1.7 | 0.9 | ||
| Iowa | 1.2 | 0.7 | 0.7 | 0.8 | ||||||
| Kansas | 1.6 | 2.0 | 2.3 | 4.8 | 0.3 | 0.4 | 0.2 | 0.3 | ||
| Kentucky | 4.5 | 5.1 | 5.3 | 8.4 | 0.5 | 0.7 | 0.5 | 0.3 | ||
| Louisiana | 15.5 | 15.5 | 8.1 | 18.1 | 23.0 | 3.1 | 2.2 | 1.1 | 1.1 | 3.0 |
| Maryland | 16.9 | 11.2 | 5.0 | 4.9 | 2.9 | 2.2 | 0.5 | 0.3 | ||
| Massachusetts | 57.7 | 29.3 | 6.1 | 2.4 | 3.0 | 11.3 | 7.2 | 2.5 | 1.2 | 1.0 |
| Michigan | 1.9 | 1.8 | 3.0 | 0.2 | 0.4 | 0.3 | ||||
| Minnesota | 5.2 | 7.3 | 2.3 | 0.9 | 2.9 | 2.1 | 1.1 | 0.4 | 0.5 | |
| Mississippi | 8.0 | 8.3 | 5.8 | 7.1 | 11.7 | 0.9 | 2.1 | 1.0 | 1.6 | 2.3 |
| Nevada | 8.0 | 3.2 | 2.0 | 4.3 | 5.7 | 0.3 | 0.5 | 0.2 | 0.2 | 0.5 |
| New Jersey | 72.5 | 35.8 | 7.0 | 3.2 | 0.6 | 13.5 | 6.6 | 1.4 | 0.8 | 1.0 |
| New York | 0.8 | 2.7 | 0.3 | 0.2 | 0.1 | |||||
| North Carolina | 4.7 | 4.3 | 3.5 | 5.1 | 10.0 | 0.7 | 0.7 | 0.5 | 0.3 | 1.0 |
| North Dakota | 0.2 | 0.3 | 0.3 | |||||||
| Ohio | 19.0 | 9.6 | 4.1 | 6.2 | 7.6 | 1.6 | 0.9 | 0.7 | 0.7 | |
| Oklahoma | 5.2 | 3.3 | 1.5 | 3.3 | 5.4 | 0.5 | 0.5 | 0.1 | 0.2 | 0.4 |
| Oregon | 2.3 | 2.5 | 3.7 | 0.3 | 0.2 | 0.3 | ||||
| Pennsylvania | 19.5 | 14.9 | 5.8 | 4.1 | 4.0 | 4.2 | 3.3 | 2.0 | 0.6 | 0.6 |
| Rhode Island | 36.9 | 24.4 | 5.3 | 1.2 | 2.6 | 2.9 | 8.3 | 3.6 | 0.7 | 0.2 |
| South Carolina | 5.0 | 5.8 | 2.8 | 9.7 | 12.0 | 0.6 | 0.7 | 0.5 | 1.4 | 1.9 |
| Tennessee | 2.7 | 1.9 | 0.9 | 3.7 | 13.5 | 0.2 | 0.3 | 0.1 | 0.1 | 0.9 |
| Texas | 1.4 | 2.0 | 16.1 | 9.9 | 0.2 | 0.2 | 0.9 | 1.3 | ||
| Utah | 2.1 | 3.6 | 5.9 | 3.8 | 0.2 | 0.2 | 0.5 | 0.4 | ||
| Vermont | 0.6 | 5.2 | 2.2 | 0.7 | ||||||
| Virginia | 4.9 | 8.6 | 5.3 | 3.3 | 3.8 | 0.4 | 1.7 | 0.8 | 0.3 | 0.4 |
| Washington | 2.5 | 2.5 | 3.8 | 0.4 | 0.3 | 0.6 | ||||
| Wisconsin | 2.6 | 1.9 | 1.1 | 0.7 | 1.2 | 0.5 | 0.3 | 0.1 | 0.2 | |
| NOTES: National values are per 100,000 US residents. State values are per 100,000 state residents. Data is current as of August 20th, 2020. See methods for more details on how these values were calculated. State population data is from 2019 US Census Bureau Estimates. | ||||||||||
| Table 3: Variations in State Reporting of Long-Term Care Facility Cases and Deaths Related to COVID-19 | |||||
| State | What is reported? | Who is included in counts? | What types of long-term care facilities are included? | How often is/was data updated? | Additional State Data Notes |
| Alabama | Cases | Residents and Staff | Long-term care facilities | Daily | |
| Arkansas | Cases and Deaths | Residents | Nursing Homes | Daily | Stopped updating number of cases at the end of July. Now only reports share of cases in nursing homes. Started reporting number of deaths in nursing homes at the beginning of August. Deaths are not included in this analysis due to short time period of availability. |
| California | Cases and Deaths | Residents and Staff | Nursing Homes, Residential Care Facilities for the Elderly, and Adult Residential Facilities (ARF) | Daily | 4/23-5/14: Includes resident/staff cases/deaths in nursing homes5/19: Drop in cases from 9908 to 9869 because of exclusion of staff cases. Added other types of LTCF cases and deaths.5/25-present: Includes staff & other LTCFs. |
| Colorado | Cases and Deaths | Residents and Staff | Nursing Homes and Assisted Living Facilities | Weekly | |
| Connecticut | Cases and Deaths | Residents and Staff | Nursing Homes and Assisted Living Facilities | Weekly | 4/16: Cases and deaths in nursing home residents4/29: Added cases in assisted living facilities5/13: Added deaths in assisted living facilities7/14: Includes cumulative staff cases and deaths since 6/17 in NH and 7/1 in ALFs.7/21: Drop in cases from 10,166 to 10,1378/11: Number of facilities with outbreaks drops from 307 to 306 |
| Delaware | Cases and Deaths | Residents | Long-term care facilities | Daily | Latest data on Staff cases/deaths is from June 26th – 461 staff cases and 1 staff death. Not included in counts due to inconsistent reporting of staff data.7/3: Drop in cases from 1,164 to 1,1547/10: Drop in deaths from 335 to 334 due to exclusion of resident who was found to be member of independent living facility |
| District of Columbia | Cases and Deaths | Residents and Staff | Long-term care facilities | Daily | 6/9: Drop in deaths from 165 to 1578/20: Drop in cases from 1055 to 1034Previously, data was updated daily reports via spreadsheet. In recent weeks, data is updated more irregularly. |
| Florida | Deaths | Residents and Staff | Long-term care facilities | Daily | Only active cases are reported, so cumulative cases cannot be trended. |
| Georgia | Cases and Deaths | Residents and Staff | Nursing homes, Assisted Living Communities and Personal Care Homes | Daily | |
| Idaho | Cases and Deaths | Residents and Staff | Nursing Home, Assisted Living Facility, or Intermediate Care Facility | Weekly | |
| Illinois | Cases and Deaths | Residents and Staff | Long-term care facilities | Weekly | |
| Indiana | Cases and Deaths | Residents and Staff | Long-term care facilities | Daily | 4/26 – 7/19: Cases and deaths in residents in long-term care facilities from 4/26-7/197/26 – present: Staff cases and deaths added to counts |
| Iowa | Deaths | Residents and Staff | Long-term care facilities | Daily | Only active cases are reported, so cumulative cases cannot be trended. |
| Kansas | Cases and Deaths | Residents and Staff | Long-term care facilities | Previously reported data in summary PDF; now reports data as part of Cluster Summary dashboard | |
| Kentucky | Cases and Deaths | Residents and Staff | Long-term care facilities | Daily | |
| Louisiana | Cases and Deaths | Residents and Staff | Long-term care facilities | Weekly | 3/29 – 5/10: nursing home resident cases/deaths5/18: staff cases added to countsLA also reports Adult Residential Care cases/deaths, but those are not reported consistently, so they are not included in this analysis to make trended data more reliable |
| Maryland | Cases and Deaths | Residents and Staff | Long-term care facilities | Weekly | |
| Massachusetts | Cases and Deaths | Residents and Staff | Long-term care facilities | Daily | |
| Michigan | Cases and Deaths | Residents and Staff | Long-term care facilities | Daily | Active cases only reported up till 6/14Deaths data fluctuates due to data reconciliation. |
| Minnesota | Cases and Deaths | Residents and Staff | Long-term care facilities | Daily | |
| Mississippi | Cases and Deaths | Residents and Staff | Long-term care facilities | Daily | |
| Nevada | Cases and Deaths | Residents and Staff | Long-term care facilities | Daily | |
| New Jersey | Cases and Deaths | Residents and Staff | Long-term care facilities | Daily | |
| New York | Deaths | Residents and Staff | Long-term care facilities | Daily | Deaths that occurred outside of facility are not counted. This excludes hospital deaths. |
| North Carolina | Cases and Deaths | Residents and Staff | Long-term care facilities | Multiple times per week | |
| North Dakota | Deaths | Residents and Staff | Long-term care facilities | Daily | Only active cases are reported, so cumulative cases cannot be trended. |
| Ohio | Cases and Deaths | Residents and Staff | Long-term care facilities | Weekly | 369 deaths reported prior to April 15th |
| Oklahoma | Cases and Deaths | Residents and Staff | Long-term care facilities | Daily | |
| Oregon | Cases and Deaths | Residents and Staff | Care facilities, Senior living communities, and Congregate Living Settings | Weekly | Active cases, deaths, and outbreaks were reported until 6/21 |
| Pennsylvania | Cases and Deaths | Residents and Staff | Nursing Homes and Personal Care Homes | Daily | |
| Rhode Island | Cases and Deaths | Residents and Staff | Long-term care facilities | Weekly | |
| South Carolina | Cases and Deaths | Residents and Staff | Long-term care facilities | Multiple times per week | |
| Tennessee | Cases and Deaths | Residents and Staff | Long-term care facilities | 6/12: cases and deaths drop from 1325 to 1055 and 155 to 1327/29: Aggregated & corrected data is reported, accounting for hike in cases & deaths | |
| Texas | Cases and Deaths | Residents and Staff | Nursing Homes and Assisted Living Facilities | Daily | Staff cases are as of August 6th. |
| Utah | Cases and Deaths | Residents and Staff | Long-term care facilities | Daily | |
| Vermont | Cases | Residents and Staff | Long-term care facilities | Weekly | 7/22: Cases drop from 407 to 4057/29: Vermont began reporting congregate care/living settings separately from other outbreaks accounting for large drop in reported cases |
| Virginia | Cases and Deaths | Residents and Staff | Long-term care facilities | Daily | |
| Washington | Cases and Deaths | Residents and Staff | Nursing Homes, Assisted Living Facilities, Adult Family Home | Weekly | 7/12: Deaths drop from 820 to 815 |
| Wisconsin | Cases and Deaths | Residents and Staff | Nursing Homes and Assisted Living Facilities | Daily | |
| SOURCE: KFF analysis of available state reports, press releases, press conferences, official state data from news reports, and The COVID Tracking Project | |||||
Methods
This analysis is based on data from 38 states plus Washington DC, for a total of 39 states. Within these 39 states, we were able to trend long-term care cases in 35 states and long-term care deaths in 36 states. Data was trended as far back as internal records and publicly available historical data allowed. States were chosen based on where we could reliably trend data. States were excluded from this analysis if they do not report data on cases and deaths in long-term care facilities, if their data is sourced from sporadically released media reports, or if there were data quality issues. The 12 states excluded from the analysis were excluded for the following reasons:
Alaska, Arizona, Hawaii, Missouri, Montana, New Mexico, South Dakota – Not reporting cases and deaths in long-term care facilities
Maine, Nebraska, New Hampshire, Wyoming – Data on cases and deaths in long-term care facilities are sourced from sporadic media reports
West Virginia – State-reported data has severe data quality issues
For all states, we trended the subset of data that would give us the longest reliable trend line. Notable examples of this include Louisiana, where data from non-nursing home long-term care facilities were excluded because they were not consistently reported. In Delaware, data excludes staff cases because that data was not reported consistently. For this reason, this analysis should not be used to identify state-level or national data on total long-term care cases and deaths. The most recent data on total cases and deaths in long-term care facilities can be located here.
Table 1: Long-Term Care Coronavirus Cases and Deaths Per 100,000 US and State Residents As of August 20th, 2020
This table presents the burden of long-term care cases and deaths that each state has experienced as of August 20th, 2020. Total population data was taken from 2019 state population estimates from the US Census Bureau. The latest long-term care cases/deaths data available was used to calculate the burden of cases and deaths experienced by each state. National long-term care case burden was calculated by summing US population from 35 states that reported case data, dividing total cases by total population in those 35 states, and multiplying by 100,000 to find the value per 100,000 US residents. National long-term care deaths burden was calculated similarly by using data from 36 states that report LTC deaths.
Table 2: Average New LTC Cases and Deaths Per Week Per 100,000 US and State Residents, By Month
Total population data was taken from 2019 state population estimates from the US Census Bureau. The first week of available data for each state was not included in this analysis since the first week of data does not reflect a single week of cases/deaths, but rather all cases and deaths that have occurred up to that point. New cases and deaths were calculated for each week thereafter, and then averaged for all of the weeks within the month. April, June, and July reflect 4 weeks of data. May reflects 5 weeks of data. August reflects 3 weeks of data. These average new cases were converted to represent cases and deaths per 100,000 state residents to allow for easier comparison across states. National new cases and national new deaths were calculated by averaging new cases and new deaths across states. See limitations for more details on this process.
Limitations
There were several possible approaches to this analysis, all of which posed major limitations. This analysis could be limited to the time period where most major states are reporting, which would limit the time period of this analysis to mid-June to present day. However, this approach would miss the major peaks in states such as Massachusetts, Connecticut, and New Jersey. Another option was to limit the analysis to states where we had the earliest weeks of data available. However, this approach would exclude Texas, Michigan, Maryland, and several other states where data was not available until at least several weeks after other states began reporting. Deaths in the states that would have been excluded in this approach make up 30% of all long-term care deaths due to COVID-19. This analysis could have also used the federally reported data, but this would have limited the time period of analysis as well.
Due to data availability and quality issues, we were unable to include all states in this analysis. Thus, all national calculations in this analysis are subject to data availability. In particular, national calculations of new cases and deaths in Table 2 are limited by varying numbers of states included in each week and month, the differences in policies across states, and the lack of reporting comparability. However, given the data limitations, this is the best approximation of new cases and deaths per month.
We conducted a sensitivity analysis for the analysis in Table 2 to see how much using different states in each month affected both the raw Ns and the direction of the trend. Our sensitivity analysis found no notable differences. When looking at the same set of 23 states for new cases and 19 states for new deaths from April to August, we found similar trends as when looking at all available states in respective months. As mentioned above, this method excludes several major states, such as Texas, Michigan, and Maryland.
Another key limitation is related to data on cases. Two large states – Florida and New York – do not report data on cumulative cases. Thus, the national numbers we present for case data are not truly nationally representative. These states report a large number of deaths, so they have likely experienced similarly large numbers of cases.