Where are the COVID-19 Hotspots? Tracking State Outbreaks
An updated map and data of state hot spots is available based on our analysis of more recent data.
There is growing concern about rising COVID-19 cases and other troubling trends in a subset of states that have reopened, and a few Governors and Mayors have either paused reopening or signaled their intention to do. Understanding in which states the pandemic is moving in the wrong, or right, direction, is critical but complex, as no single metric can tell the full story. For example, an increasing number of cases could be the result of more testing or the result of increasing transmission, or a combination of both.
A few existing resources examine state-level data to make assessments about current risk levels (see, in particular, https://www.covidexitstrategy.org/, https://covidactnow.org/, and https://www.aei.org/covid-2019-action-tracker/). We similarly sought to examine current trends across the U.S. and identify state “hotspots” for COVID-19. Specifically, we looked at two metrics that are readily available for all states and, when taken together, signal concern:
- COVID-19 Cases: Percent Change in Reported Daily Cases Over the Past 14 Days. An increase in reported cases could signal a growing caseload, though it could also be the result of increased testing. Used, however, in conjunction with the change in positivity rate helps to elucidate this trend.
- Positivity Rate: Percent Change in Share of COVID-19 Tests with Positive Results Over the Past 14 Days or Positivity Rate of 10% or Greater. The positivity rate is an important metric to monitor.1 If transmission is decreasing and more people are being tested, including those who are not infected, the positivity rate should fall. On the other hand, a rising positivity rate suggests that an insufficient share of the population is being tested and/or that actual cases are increasing, and likely increasing at a faster rate than the confirmed case counts would indicate. Additionally, a positivity rate of 10% or more indicates there are a relatively high number of cases and an ongoing epidemic in the state.
We examined data from the most recent 14-day period to account for the lag between transmission and the incubation period of the virus, as well as the time at which an individual seeks and receives testing and testing results are reported to health officials; even so, it is important to note that cases from the most recent two-week period still reflect prior transmission patterns. We calculated the percent change based on a 7-day rolling average, which helps to account for fluctuations in reporting throughout each week and other noise in the data; however, data anomalies exist leading to fluctuations in the data in a number of states. We excluded states for which the percent change in at least one of the 14-day metrics was below 5%. For the positivity rate, we reported the most recent rate based on the 7-day rolling average.
In addition to cases and positivity rates, we also include data on the percent change in the number of tests conducted, hospitalizations, and deaths, to provide additional context for interpreting trends. For example, hospitalization data provide information on severity of illness and strain on the health care system, though not all states report this information and it is a lagging measure that reflects transmissions from even longer ago. Increasing cases in the most recent period is likely predictive of future hospitalizations (and deaths), though depends on the characteristics or people being infected in any given area (since older people and those with pre-existing conditions are more likely to get severely ill once infected).
Results
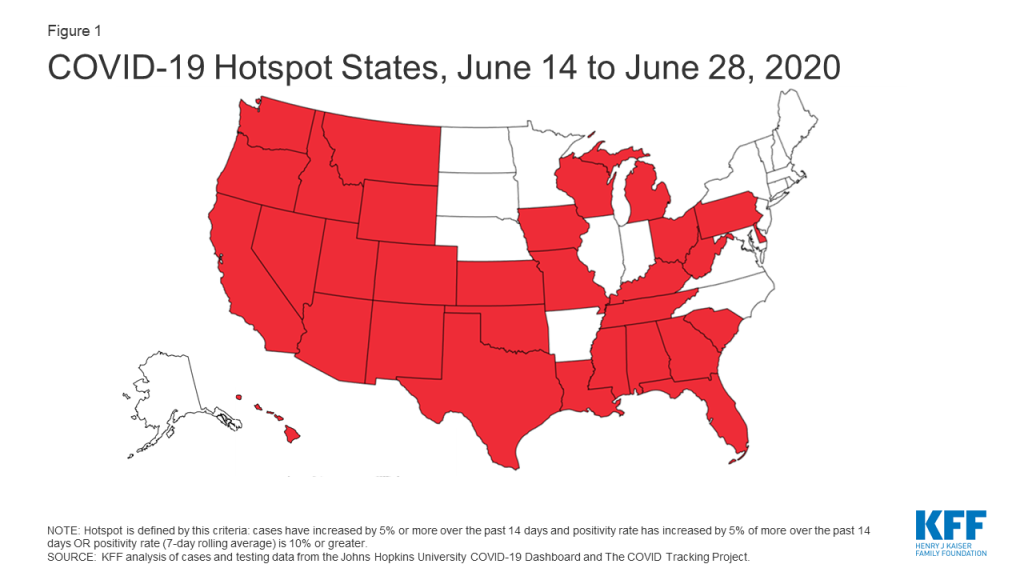
Looking at the period from June 14 to June 28, 31 states are classified as hotspots (i.e., have increasing cases, and increasing positivity rates over the most recent 14-day period or a positivity rate of 10% or greater). See Figure and Table 1 below. These states are primarily in the West (12) and South (12); six are in the Midwest and one is in the Northeast. Many are states that were not hit hard earlier in the pandemic. While four of the states are reporting fewer than 40 daily cases, 16 are reporting 400 or more new cases per day, and nine states have positivity rates above 10%.
| Table 1: COVID-19 Metrics for Hotspot States (as of 6/28/20) | |||||||||||
| State | 14-DayPercentChange inCases | 14-DayPercentChange inPositivityRate | Positivity Rate(7-Day RollingAverage) | 14-DayPercentChange inCurrentHospitalizations | 14-DayPercentChange inDeaths | 14-DayPercentChange inTests | Daily Cases(7-Day RollingAverage) | CurrentHospitalizations(7-Day RollingAverage) | Daily Deaths(7-Day RollingAverage) | Date Stay atHome OrderLifted | |
| Alabama | 6% | -4% | 13% | 21% | -1% | 10% | 774 | 11 | 667 | 4/30/2020 | |
| Arizona | 145% | 53% | 24% | 75% | 75% | 60% | 3,047 | 35 | 2,318 | 5/16/2020 | |
| California | 70% | 29% | 6% | 21% | -11% | 45% | 5,250 | 60 | 5,454 | Still in place | |
| Colorado | 57% | 28% | 5% | -16% | -59% | 12% | 252 | 4 | 243 | 4/27/2020 | |
| Delaware | 40% | 58% | 4% | -18% | 200% | -11% | 64 | 10 | 85 | 6/1/2020 | |
| Florida | 277% | 157% | 16% | N/A | 12% | 47% | 6,255 | 37 | N/A | 5/4/2020 | |
| Georgia | 116% | 61% | 12% | 37% | -50% | 34% | 1,787 | 19 | 1,130 | 5/1/2020 | |
| Hawaii | 60% | 14% | 1% | N/A | N/A | 22% | 12 | 0 | N/A | Still in place | |
| Idaho | 407% | 162% | 10% | N/A | -50% | 93% | 188 | 0 | N/A | 5/1/2020 | |
| Iowa | 16% | 5% | 7% | -39% | -57% | 6% | 365 | 3 | 143 | -* | |
| Kansas | 146% | 73% | 7% | N/A | 0% | 30% | 244 | 2 | N/A | 5/4/2020 | |
| Kentucky | 28% | 41% | 4% | -23% | 10% | -10% | 212 | 5 | 371 | -* | |
| Louisiana | 70% | 50% | 8% | 20% | 21% | 13% | 923 | 13 | 668 | 5/15/2020 | |
| Michigan | 106% | 65% | 2% | -14% | -25% | 25% | 319 | 10 | 557 | 6/1/2020 | |
| Mississippi | 134% | -36% | 13% | 11% | 37% | 263% | 750 | 14 | 725 | 4/27/2020 | |
| Missouri | 97% | 72% | 6% | -6% | 11% | 19% | 319 | 6 | 542 | 5/4/2020 | |
| Montana | 161% | 148% | 1% | 134% | 100% | 5% | 21 | 0 | 14 | 4/26/2020 | |
| Nevada | 156% | 250% | 15% | 32% | -48% | -26% | 560 | 2 | 450 | 5/29/2020 | |
| New Mexico | 59% | 30% | 4% | -26% | -41% | -1% | 178 | 3 | 135 | 5/22/2020 | |
| Ohio | 106% | 40% | 5% | 5% | -41% | 47% | 786 | 15 | 597 | 5/20/2020 | |
| Oklahoma | 125% | 53% | 6% | 85% | 33% | 50% | 347 | 2 | 282 | 5/12/2020 | |
| Oregon | 44% | 197% | 10% | 21% | -8% | -17% | 201 | 2 | 164 | Still in place | |
| Pennsylvania | 19% | 7% | 4% | -28% | -33% | 36% | 561 | 26 | 693 | 5/8/2020 | |
| South Carolina | 92% | 10% | 15% | 67% | 17% | 73% | 1,237 | 9 | 862 | 5/4/2020 | |
| Tennessee | 32% | 132% | 8% | N/A | 4% | -46% | 724 | 8 | 463 | 4/29/2020 | |
| Texas | 184% | 126% | 15% | 123% | 48% | 27% | 5,315 | 30 | 4,722 | 4/30/2020 | |
| Utah | 62% | 50% | 11% | 19% | -50% | 8% | 520 | 1 | 243 | 5/1/2020 | |
| Washington | 46% | 90% | 5% | 17% | -33% | 0% | 439 | 6 | 261 | 5/31/2020 | |
| West Virginia | 105% | 130% | 2% | -5% | 0% | -18% | 43 | 1 | 27 | 5/4/2020 | |
| Wisconsin | 52% | 66% | 5% | -32% | -28% | -12% | 418 | 5 | 246 | 5/13/2020 | |
| Wyoming | 95% | 88% | 5% | 0% | N/A | 4% | 31 | 0 | 6 | -* | |
| Note: N/A: Insufficient data to report. Decrease signifies a percentage decrease in the metric over the past two weeks. Testing data only include tests with results. * Iowa, Kentucky, and Wyoming never issued a stay at home order.Source: KFF analysis of Johns Hopkins University COVID-19 Dashboard and The COVID Tracking Project data. | |||||||||||
There are likely multiple policy, epidemiologic, and other factors driving these increases, including: when stay-at-home orders were lifted (and how long they were in place); the pace of reopening; the use of other social distancing measures (such as face mask requirements); increased population movement due to warming weather; outbreaks in congregate settings; the Memorial Day Holiday period; and, potentially, protests. For example, while 23 of the 31 states had lifted their stay-at-home orders by the end of May (California, Hawaii, and Oregon have maintained their stay-at-home orders as they have begun phased reopening; see Table 1), they did so at different paces. Many moved quickly, reopening businesses and lifting other restrictions within a two-week period. All states, except California and Washington, have lifted or eased bans on large gatherings and only eight require the general public to wear face masks. However, teasing out the role of these various factors and policy changes, many of which occurred simultaneously, will require further analysis.
What This All Means
Using these metrics – increasing COVID-19 cases over the past 14 days and increasing positivity rates over the past 14 days or a positivity rate of 10% or greater –we find that over 60% of states, representing nearly 70% of the US population, are moving in the wrong direction. These hotspot states are primarily in the South and West, and many were not hit hard in the earliest days of the U.S. outbreak. Hospitalizations have increased significantly in some states, and could increase in others. In addition, rising positivity rates in these states indicate that the growth in cases is not due to increased testing and likely reflects an actual increase in transmission.
While these trends are concerning, and beginning to drive the national trend, 20 states are moving in the right direction. Many of these states were among the last to reopen. Some phased in reopening over a longer time period and many have required the widespread use of face masks.
The factors determining which states are hotspots and which are not are difficult to tease out, but the inescapable reality is that the epidemic is getting worse, not better, in a significant portion of the country.
- The WHO recommends that the positivity rate should be at 5% or less for an extended period before reopening. ↩︎