Kaiser Family Foundation/CNN Working-Class Whites Poll
Section 1: Conventional Wisdom
Much has been studied and written about the white working class during the 2016 election season. In many ways, the findings from our survey confirm the findings from other studies, and conform to what has come to be “conventional wisdom” about the white working class:
- This group is unhappy about the direction of the country overall. Over half (53 percent) are very dissatisfied with the country’s economic situation, 47 percent say America’s best days are behind us, and 50 percent expect their children to have a worse standard of living than they have now – all much higher than for college-educated whites (Exhibit 1.1).
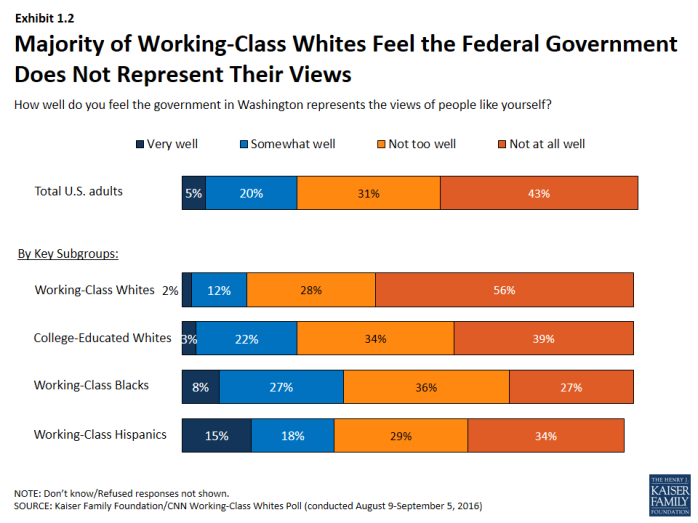
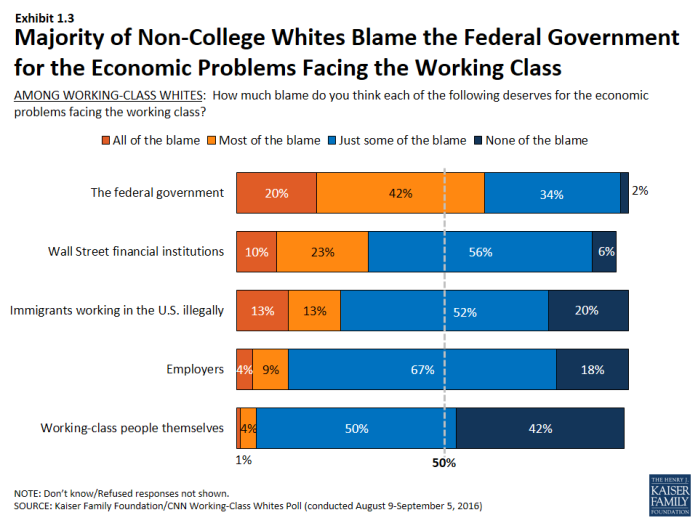
- The white working class is resentful of government and feels cut out of the political process. Two-thirds (68 percent) are dissatisfied with the influence people like them have on politics, 56 percent say the government in Washington does not represent their views well at all (Exhibit 1.2), and 62 percent say the federal government deserves all or most of the blame for the economic problems facing the working-class (Exhibit 1.3).
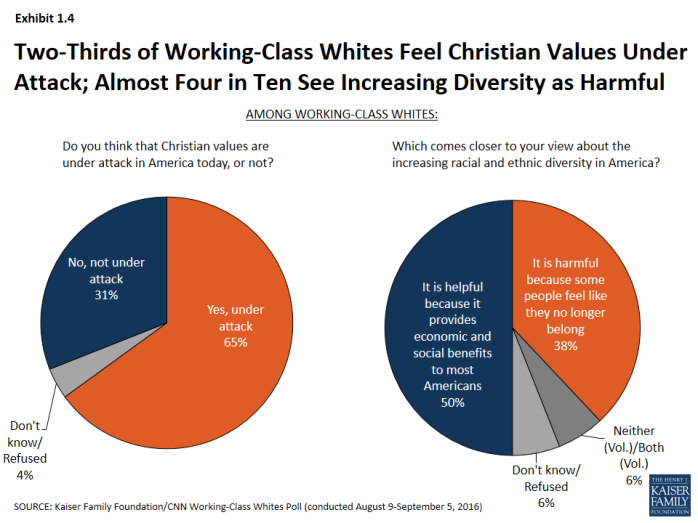
- Whites without a college degree are nervous about cultural changes taking place in the United States. About two-thirds (65 percent) say Christian values are under attack, and almost four in ten (38 percent) say increasing racial and ethnic diversity is harmful because “some people feel like they no longer belong” (Exhibit 1.4).
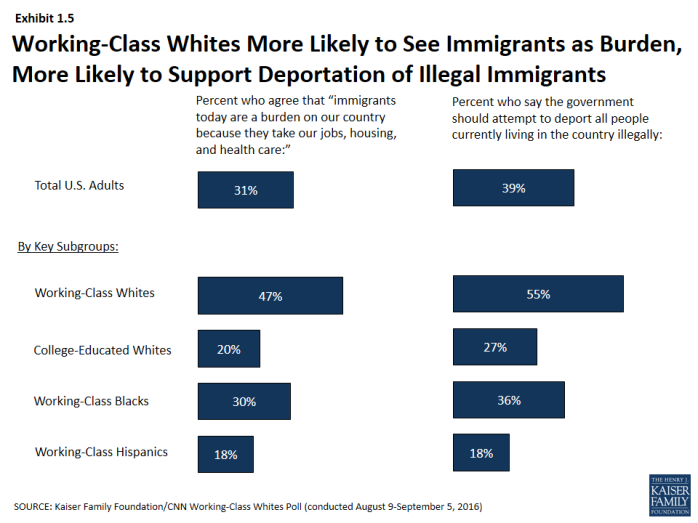
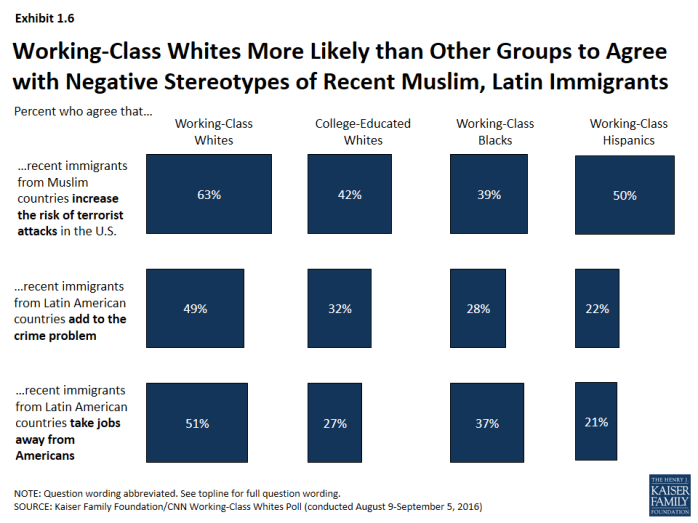
- This group has a more negative view of immigrants and immigration than other groups. Almost half (47 percent) see immigrants as a burden on the country, and 55 percent say the government should attempt to deport all people living in the country illegally (Exhibit 1.5). Over six in ten (63 percent) say that immigrants from Muslim countries increase the risk of terrorist attacks, and about half say that Latin American immigrants add to the crime problem and take jobs away from Americans – much higher than for other groups (Exhibit 1.6).
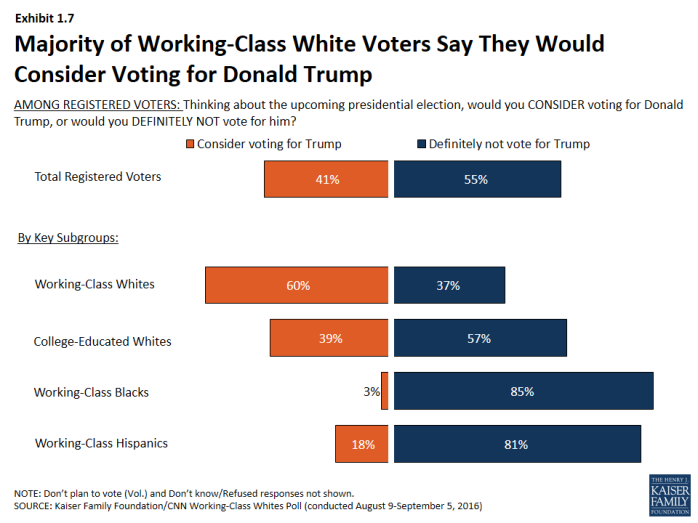
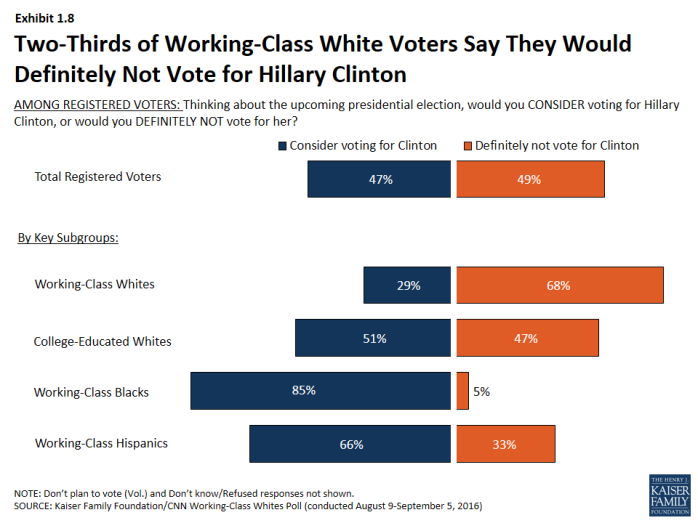
- Working-class white voters are a base of support for Donald Trump – six in ten say they would consider voting for him, compared with four in ten (39 percent) college-educated white voters and much smaller shares of black and Hispanic voters without college degrees (Exhibit 1.7). Two-thirds (68 percent) of working-class white voters say they would definitely not vote for Hillary Clinton, while half of college-educated whites and large majorities of working-class black and Hispanic voters say they’d consider voting for her (Exhibit 1.8).
In other ways, the survey findings run counter to the prevailing narrative about this group:
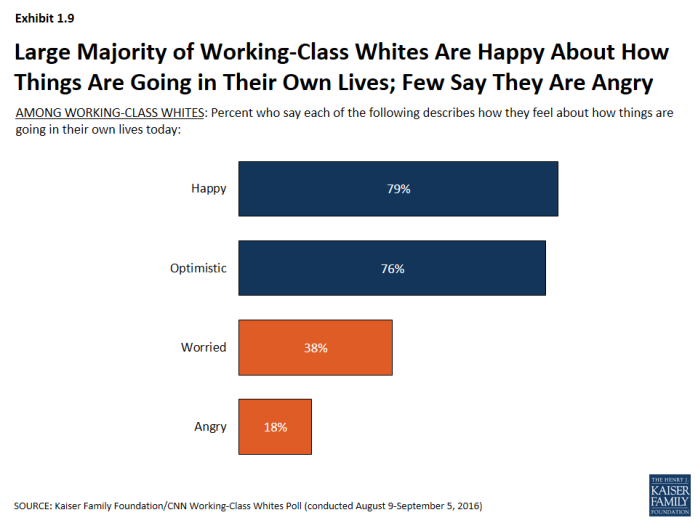
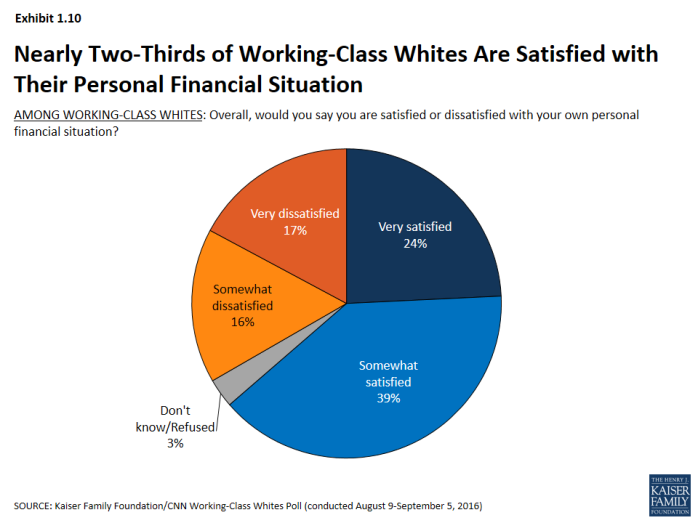
- Personally, things appear to be going well for the white working class. A large majority – 76 percent – say they are optimistic about how things are going in their own lives, and only 18 percent say they are angry (Exhibit 1.9). Nearly two-thirds (63 percent) are satisfied with their own personal financial situation (Exhibit 1.10).
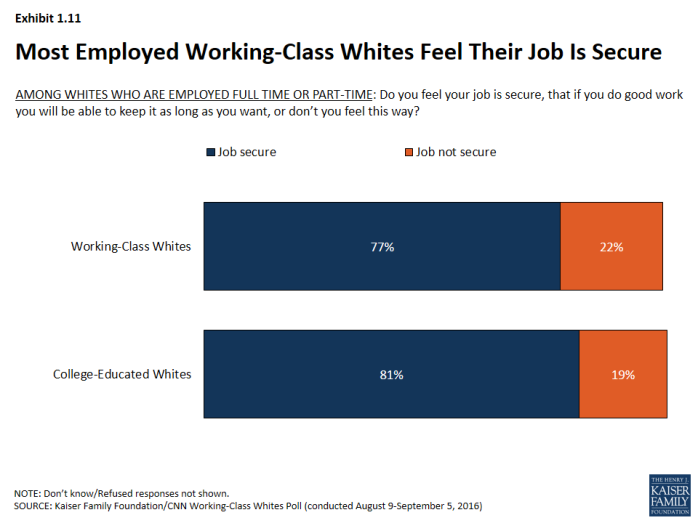
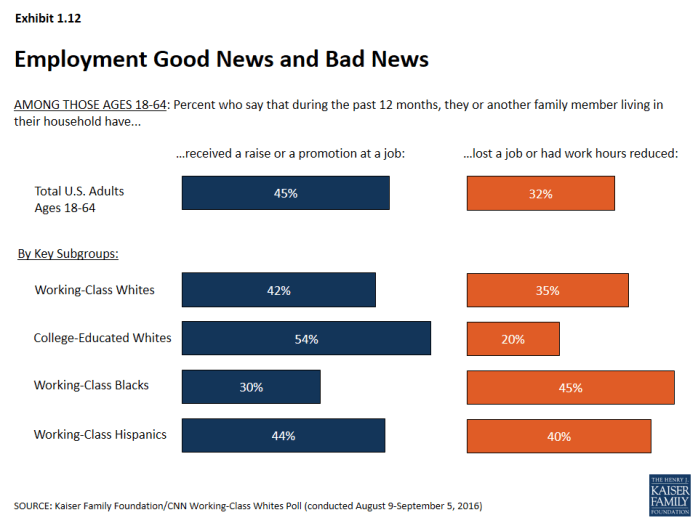
- Most working-age whites without college degrees are employed in secure jobs. Seventy-two percent of those ages 18-64 are employed either full- or part-time. More than three-quarters (77 percent) of those who are working feel their job is secure (Exhibit 1.11). More than four in ten (42 percent) of those under age 65 say they or someone in their household received a raise or a promotion in the past year (Exhibit 1.12).
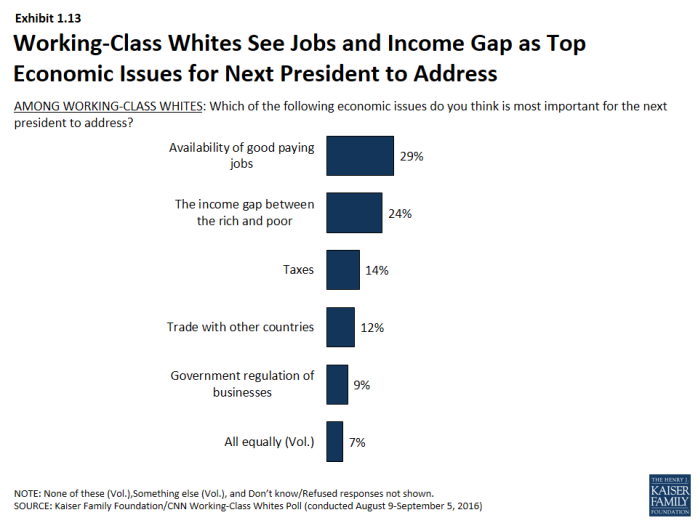
- Trade is not a major driving issue for working-class whites. While seven in ten (69 percent) feel that trade agreements with other countries has cost the U.S. jobs, just 12 percent pick trade as the top economic issue for the next president to address, ranking behind the availability of good jobs, the income gap between the rich and poor, and taxes (Exhibit 1.13).
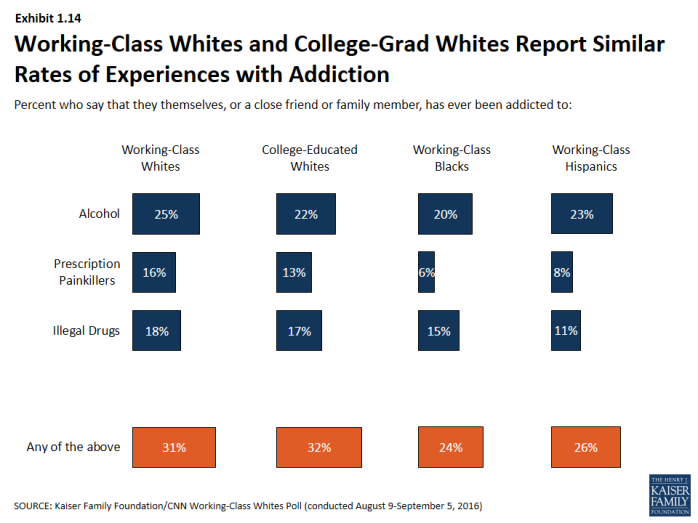
- Working-class whites are no more likely than whites with college degrees to report experiences with addiction. Thirty-one percent say someone close to them has been addicted to alcohol, prescription painkillers, or illegal drugs, almost identical to the share among whites with college degrees (Exhibit 1.14).
x
Exhibit 1.1
x
Exhibit 1.2
x
Exhibit 1.3
x
Exhibit 1.4
x
Exhibit 1.5
x
Exhibit 1.6
x
Exhibit 1.7
x
Exhibit 1.8
x
Exhibit 1.9
x
Exhibit 1.10
x
Exhibit 1.11
x
Exhibit 1.12
x
Exhibit 1.13
x


