How Much of the Medicare Spending Slowdown Can be Explained? Insights and Analysis from 2014
Introduction
Analysts have warned federal policy makers for many years that long-term growth in spending on health care threatens to upend the federal budget and consume an unsustainable share of the nation’s economy.1 Medicare is by far the largest federal health program in terms of spending,2 and, historically, spending growth in the program has been driven by persistent increases in enrollees and spending per enrollee. Because Medicare has accounted for a rising share of the federal budget and the nation’s economy, concerns about Medicare spending growth have prompted a steady stream of proposals for major changes to the program, such as increasing the age of eligibility, restructuring Medicare’s benefit design, or shifting the program to a defined contribution arrangement.3
Against this backdrop, a seemingly incongruous storyline has emerged in recent years: Medicare spending growth of late has been remarkably low relative to historical norms. Annual growth in aggregate spending has averaged just over 3 percent since 2009, despite rapid enrollment growth due to the aging of the “baby boom” generation. On a per enrollee basis, Medicare spending has been growing more slowly than GDP per capita,4 and has been relatively flat since 2009—even falling very slightly, in nominal dollars, since 2011 (Exhibit 1). Both the magnitude and the duration of the slowdown in Medicare spending growth have no precedent in Medicare’s nearly 50-year history.
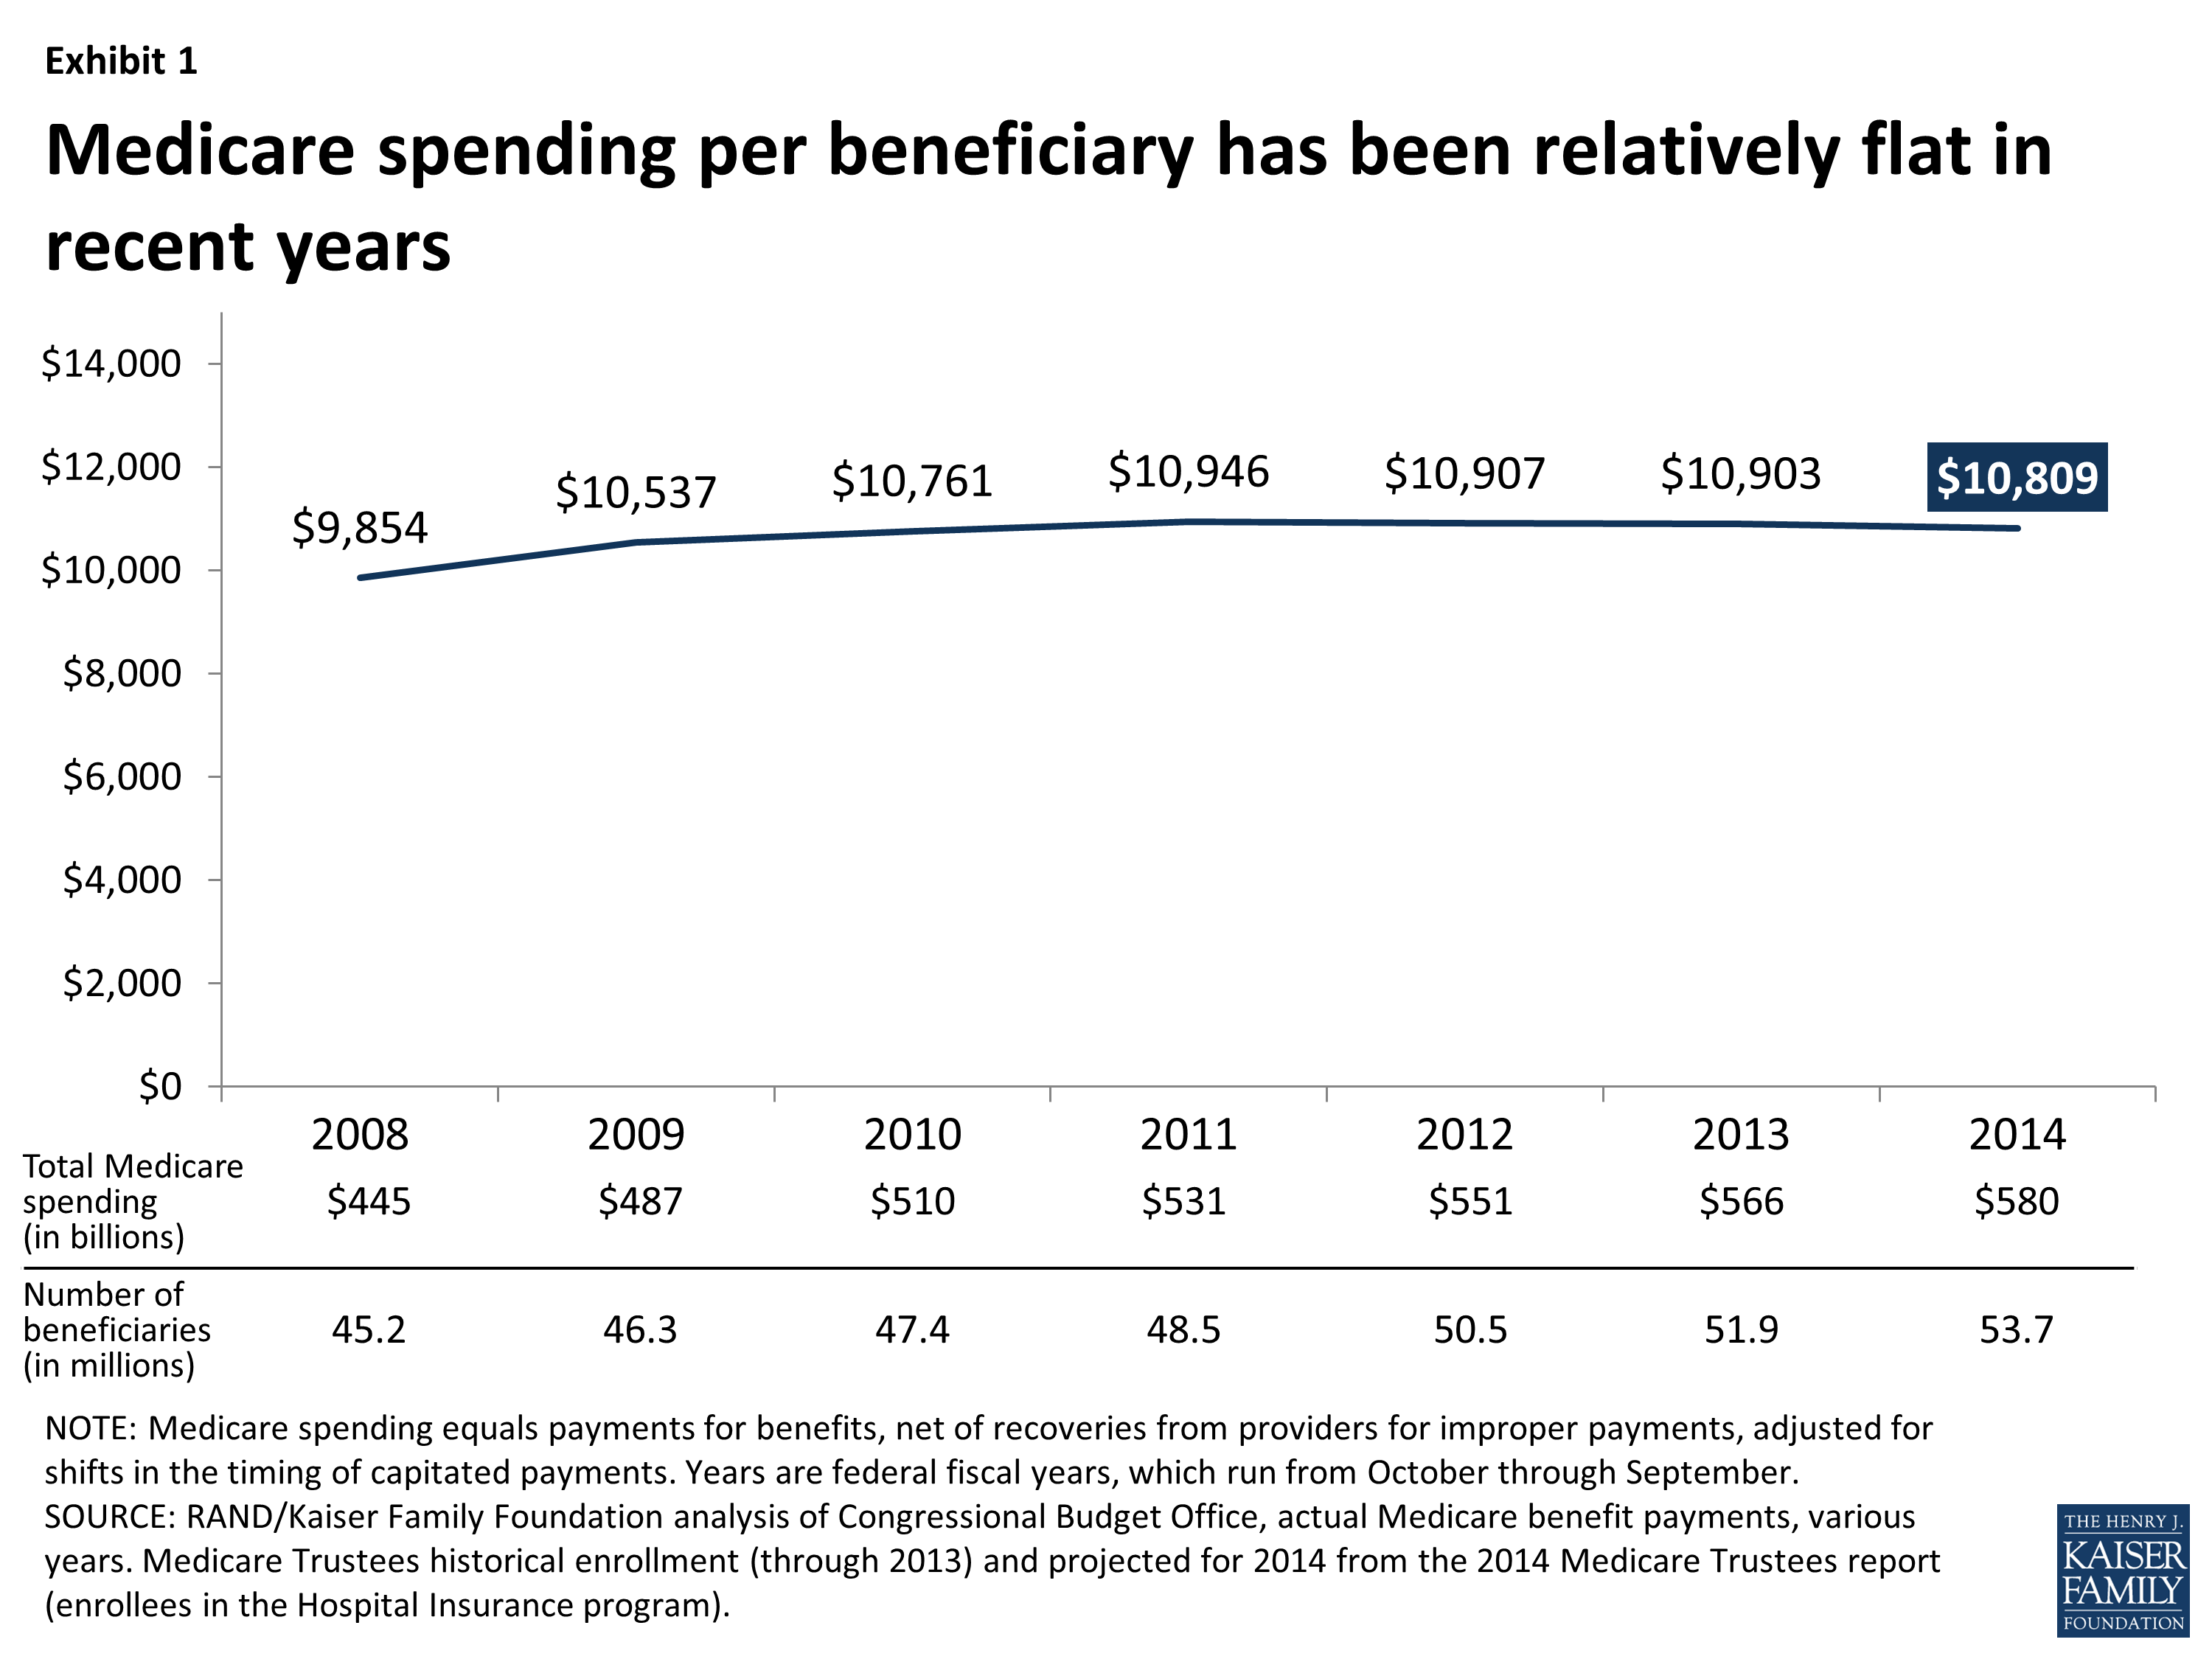
Exhibit 1: Medicare spending per beneficiary has been relatively flat in recent years
Medicare’s recent slow spending growth has manifested itself in several ways. Between 2009 and 2014, the Medicare Trustees extended by more than 10 years their projections of the solvency of the Medicare Hospital Insurance trust fund, from 2017 (2009 projection) to 2030 (2014 projection)—which is also related to growth in revenues from a payroll tax increase included in the Affordable Care Act (ACA) and to a stronger economy.5 The slow growth in Medicare spending has also led to relatively modest increases in Medicare premiums and cost sharing, which are indexed to rise with program costs. For example, Medicare Part B premiums, which are pegged to growth in Part B spending, were unchanged between 2013 and 2014 and will be the same in 2015 as in the previous two years. And the Medicare Trustees project that the Independent Payment Advisory Board (IPAB)—a controversial but not yet appointed or convened independent entity which was authorized by the ACA as a spending backstop—will not be required to issue recommendations for Medicare savings until 2022, due to relatively low projected spending trends.6
Issue Brief
Our Approach
The aim of this paper is to identify and quantify, to the extent possible, the factors that explain the gap between actual Medicare spending in 2014 and CBO’s 2009 projections of what Medicare spending would be this year. Other researchers have analyzed economic and other factors that are associated with the recent slow growth in overall health care spending, and in Medicare specifically. This study synthesizes information from a variety of sources and presents new analysis to assess the extent to which lower-than-projected Medicare spending in 2014 can be explained by deliberate policy and program changes, unexpected trends, and other factors.
To quantify the 2014 spending gap, we estimate the actual level of spending in 2014 ($580 billion) and compare that to the level of spending projected for this year by the Congressional Budget Office (CBO) in 2009 ($706 billion)—a gap of $126 billion. We include in the 2009 projections an upward adjustment for the cost of overriding the Sustainable Growth Rate (SGR) formula and freezing physician payments. That approach is consistent with CBO’s “alternative fiscal scenario” baseline, which reflects their assessment of Medicare’s likely spending path absent any changes in policy.
Because the Medicare program has, in fact, changed since 2009, we quantify how much of the gap between projected and actual 2014 Medicare spending can be attributed to specific legislative and policy changes since 2009, based mainly on CBO’s estimates of the projected effects of these changes. These estimates are not a perfect measure of actual spending reductions directly attributable to policy changes, but they are the best available proxies for gauging the impact of policy changes on Medicare spending. Such changes include provisions in the 2010 Affordable Care Act and the Budget Control Act of 2011. In addition, we quantify the portion of the 2014 spending gap that can be explained by other trends and changes that have had a measurable effect on Medicare spending in 2014 (including those that led to both lower-than-expected spending and higher-than-expected spending), and the remaining portion of the spending gap which remains unexplained. Finally, we describe several factors that could be associated with Medicare savings in 2014 for which empirical evidence is not yet available.
The analysis draws on several sources, including Congressional Budget Office (CBO) Medicare spending baseline projections over multiple years, CBO estimates of policies that affected Medicare expenditures, monthly statements of receipts and outlays issued by the U.S. Treasury for 2014 and other years, Medicare population projections from the Centers for Medicare & Medicaid Services (CMS) Office of the Actuary, and other data from a variety of government sources. (See Appendix 1: Methodology for more details about the methods used in this analysis, and Appendix 2: Factors Related to Changes in Projected Versus Actual Medicare Spending in 2014, for a table summarizing the factors included in this analysis and their spending effects.)
Summary of Prior Research
Slow growth in spending in the Medicare program is one piece of a larger puzzle: the surprisingly slow growth in overall health care spending in recent years. Analysts have noted a slowdown in total health care spending beginning in 2005,1 and a number of recent studies have examined the explanations for, and implications of, that broader slowdown of health care costs. The debate has shaped up between those who attribute the slowdown in health care costs primarily to the “Great Recession” and those who point to system-wide changes that might be taking hold. Those who attribute slow growth primarily to the Great Recession warn of a likely resurgence in spending growth.2 Other analysts suggest that the recent slowdown reflects broader, and possibly enduring, changes in the health care system, including the adoption of alternative payment approaches (e.g., value-based purchasing, pay-for-performance bonuses, and bundled payments), the use of “big data” to target wasteful spending, the introduction of Accountable Care Organization (ACOs) and other payment and delivery system reforms, the spread of high-deductible plans, and slower development of new medical treatments and technology such as “blockbuster” prescription medications.3
Several researchers have focused specifically on slow growth in Medicare spending, comparing trends in various time periods. White (2008) showed that the rate of growth in Medicare spending per enrollee was sharply lower from 1997-2005 than in earlier periods, which he attributes to a series of changes in provider payment policy, including reductions in hospital payments and new prospective payment systems for post-acute care.4 Levine and Buntin (2013) tested a number of possible explanations for the slowdown in the annual growth in spending per beneficiary in traditional Medicare between the years 2000-2005 (7.1 percent growth) and 2007-2010 (3.8 percent), including slower growth in payment rates, the Great Recession, and the influx of younger and healthier beneficiaries, and found that none of these factors explained the bulk of the observed slowdown.5
Chappel et al. (2014) compared annual growth in Medicare spending per beneficiary between two time periods: 2000-2008 versus 2009-2012.6 They used detailed claims data from beneficiaries in traditional Medicare to quantify the contributions to the slowdown from specific service categories (e.g., hospital inpatient, home health), and the contributions of trends in prices versus quantities. They find that the slowdown appears across nearly all service categories, and that for most service categories, slow growth in quantities, rather than prices, appeared to be the main driver of slow spending growth between 2009 and 2012. The Committee for a Responsible Federal Budget (2014) examined Medicare spending growth between 2013 and 2014 and suggested that much of the slowdown in that one year can be attributed to sequestration (which is scheduled to expire in 2024) and the phasing in and ramping up of provisions in the ACA.7 Neuman and Cubanski (2014) find that Medicare spending per enrollee in 2014 is $1,200 lower than was projected by the Congressional Budget Office (CBO) in 2010.8 Adler and Rosenberg (2014) compare CBO’s March 2011 and April 2014 Medicare spending baseline, and attribute much of the projected 10-year (2012-2021) reduction in Medicare spending from the 2011 to 2014 baselines to the slowdown in Part D spending.9 Dobson et al. (2014) highlight the role of structural changes, including payment reforms in the ACA, as explanations for the recent slow growth in Medicare spending.10
This analysis differs from previous work in several ways. Unlike Chappel et al. (2014), we examine spending in 2014 relative to CBO’s 2009 projections and the factors related to lower-than-expected Medicare spending this year. Unlike White (2008), Levine and Buntin (2013), Neuman and Cubanski (2014), and Adler and Rosenberg (2014), we focus on changes occurring between 2009 and 2014 that may have contributed to the gap in projected versus actual spending in 2014, including the implementation and effects of the Affordable Care Act and the Budget Control Act of 2011 (BCA) along with other changes.
Quantifying the Gap Between Projected and Actual Medicare Spending in 2014
To quantify the gap between projected Medicare spending in 2014 and actual spending this year, we compare actual 2014 spending with CBO’s 2009 “baseline” amount for 2014 (including an upward adjustment to physician payments to account for the fact that Congress has overridden the cuts called for by the SGR). That baseline reflects CBO’s best guess of Medicare’s spending trajectory if the program remained unchanged. An alternative approach to quantifying this difference would be to calculate average historical rates of growth in spending per beneficiary, and project spending from 2008 forward applying the historical average growth rate to the projected number of beneficiaries. The second approach is simpler and more transparent, but fails to take advantage of CBO’s detailed projection methodologies. (See Appendix 1: Methodology)
In 2009, CBO projected that Medicare spending would grow to $706 billion in 2014 (Exhibit 2). This estimate includes the estimated effects on Medicare spending from freezing physician payments rather than allowing the cuts called for by the Sustainable Growth Rate (SGR) to take effect. Using historical average growth rates yields similar projected levels of total spending in 2014, ranging from $702 billion (similar to the CBO projection for 2014) to $753 billion, depending on the historical period used.11 But actual Medicare spending in 2014 has ended up far below any of those projections, totaling $580 billion in 2014—18 percent, or $126 billion, lower than CBO’s 2009 projection. (See Appendix 1: Methodology for more details about these calculations.)
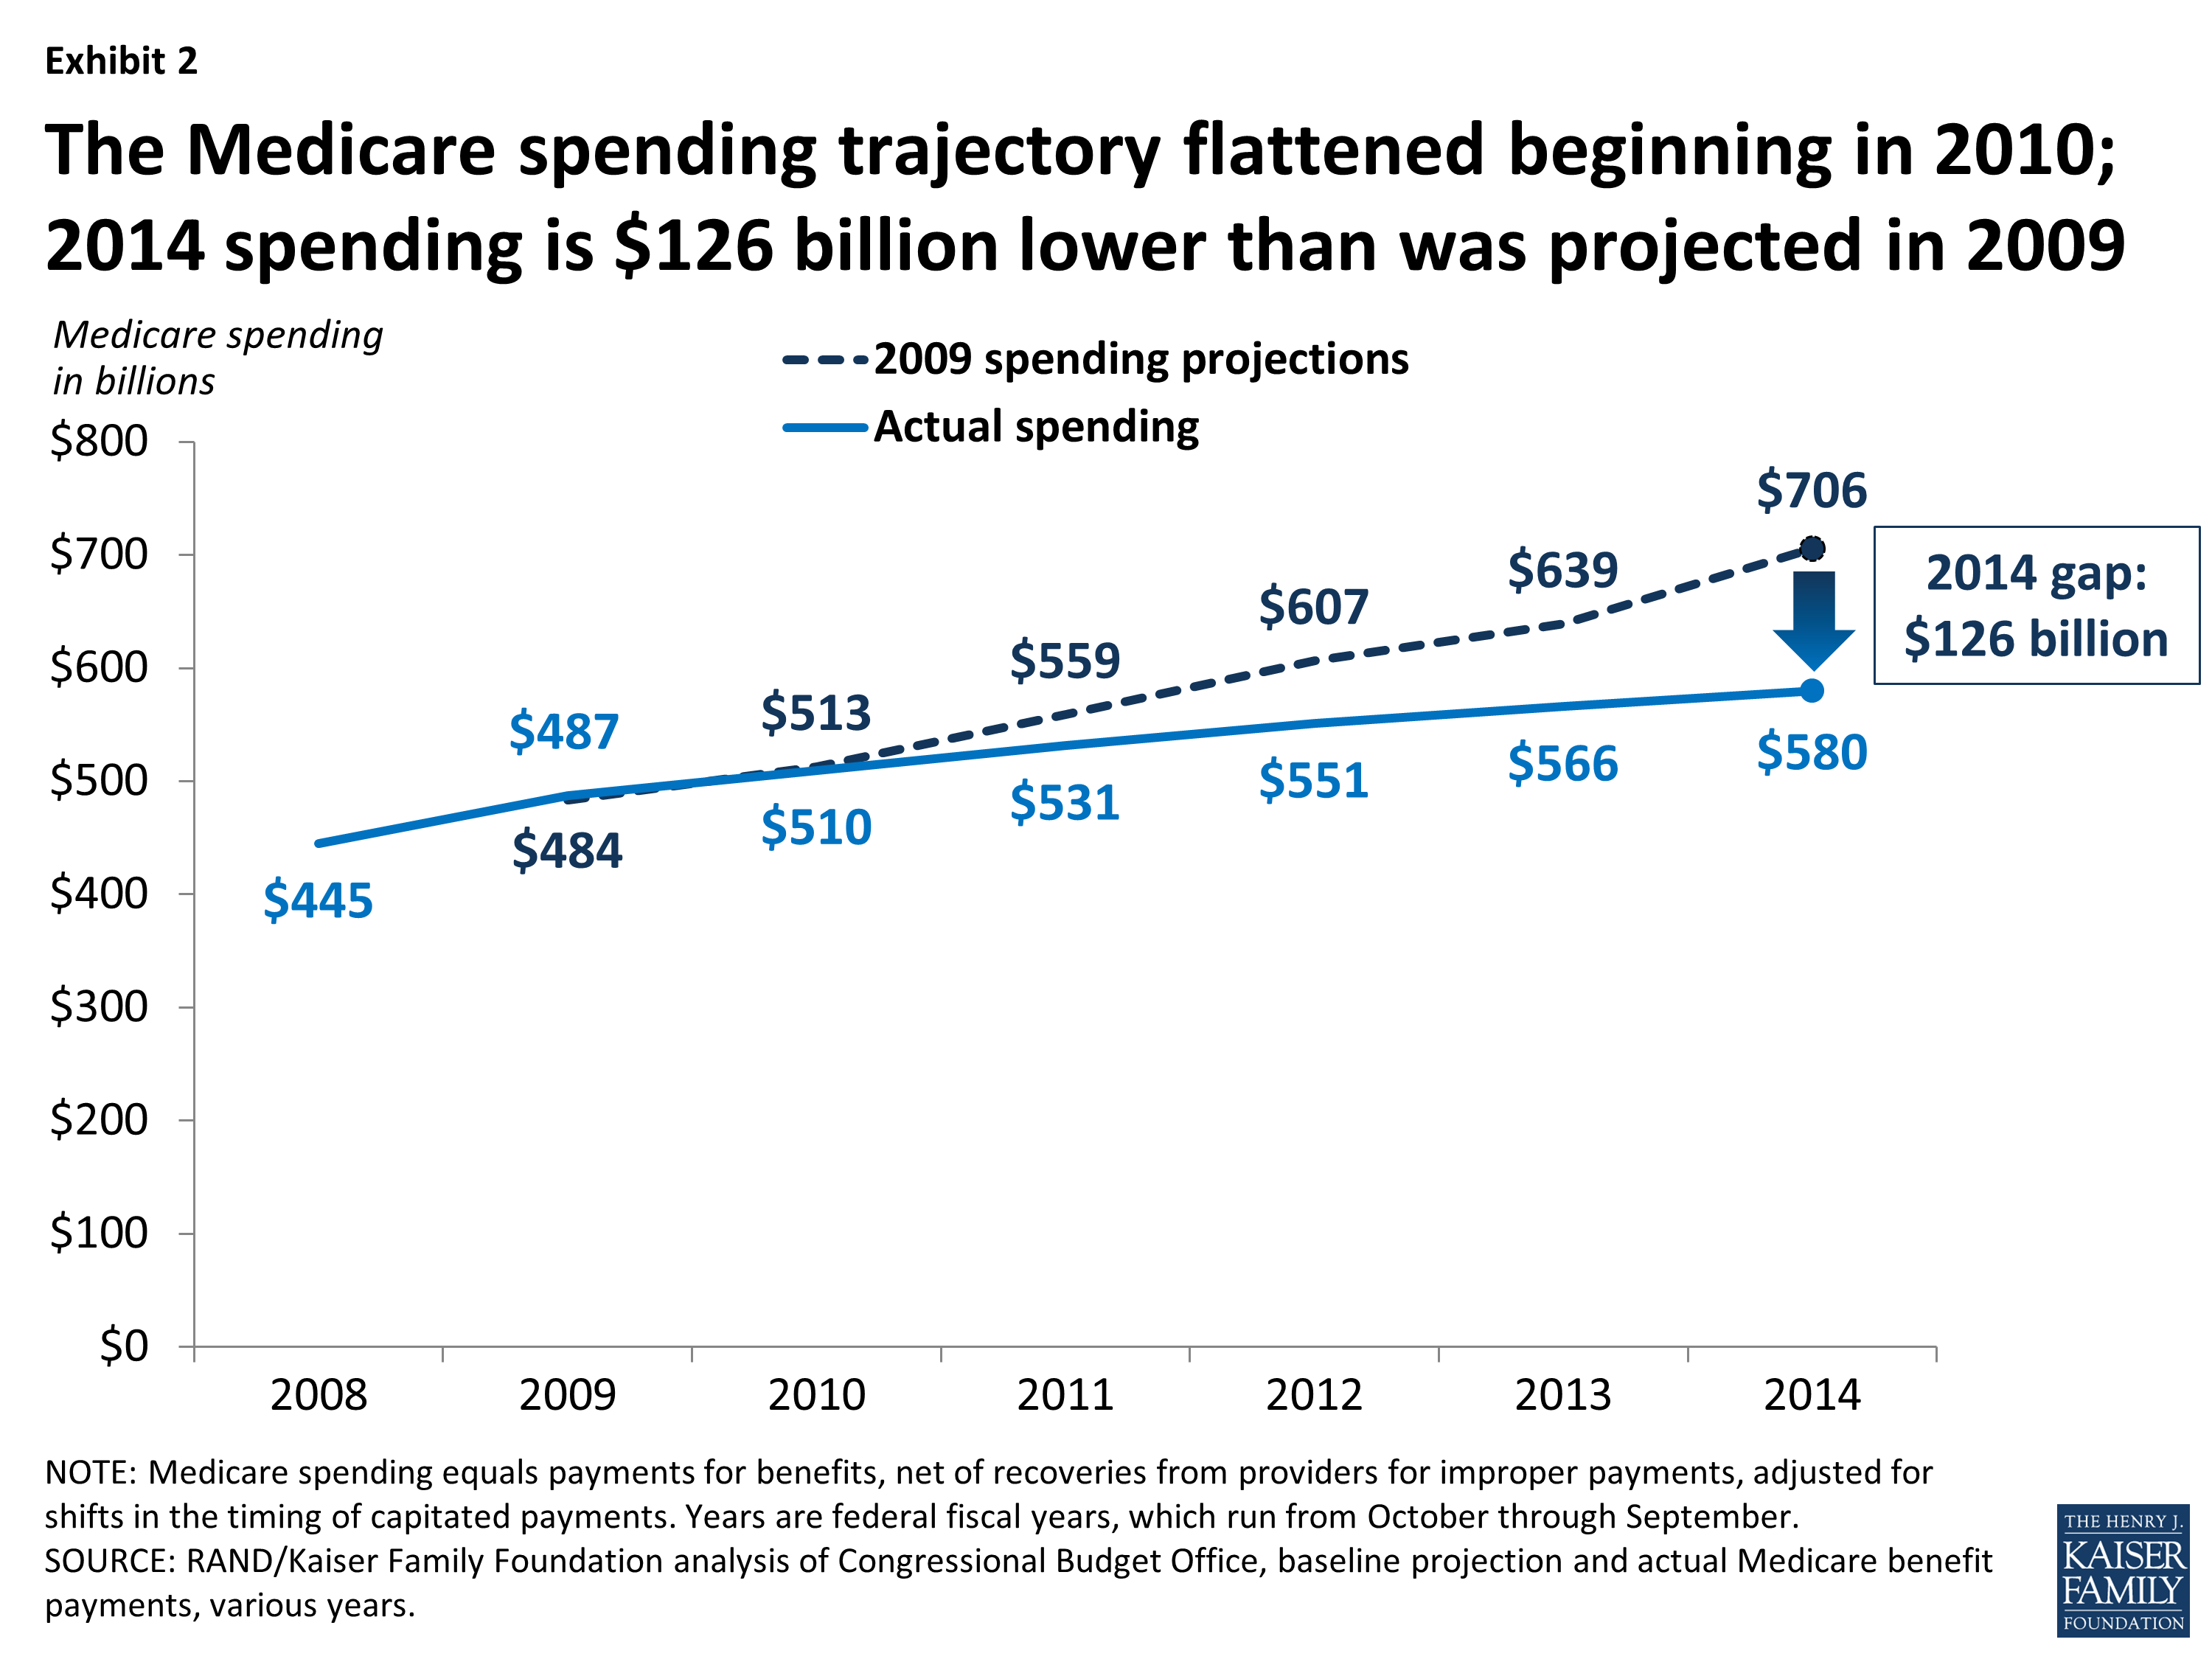
Exhibit 2: The Medicare spending trajectory flattened beginning in 2010; 2014 spending is $126 billion lower than was projected in 2009
The change in the trajectory of Medicare spending since 2009 is by no means a complete surprise; to the contrary, much of the change was the result of deliberate policy actions and was projected by CBO in 2010 with the enactment of the ACA and in 2011 with the enactment of the BCA. Together, these laws were projected to reduce Medicare spending on net by $65 billion in 2014, based on CBO estimates at the time.12,13 This explains about half of the difference between CBO’s 2009 projections of Medicare spending in 2014 and actual 2014 Medicare spending. Even after taking the savings attributed to the ACA and BCA into account, however, Medicare spending is still far lower in 2014 than CBO projected it would be in 2009.
The difference between 2009 projections of Medicare spending in 2014 and actual spending this year can be observed across all parts of the program, including Part A (which covers inpatient hospital stays, skilled nursing facility stays, some home health visits, and hospice care), Part B (which covers physician visits, outpatient services, preventive services, and some home health visits), and Part D (which covers outpatient prescription drugs). (Spending on enrollees in private Medicare Advantage plans is included in the totals for Parts A, B, and D.) According to our analysis, Part A spending in 2014 is $58 billion lower than was projected in 2009, Part B spending is $51 billion lower, and Part D spending is $16 billion lower (Exhibit 3).14 In each of those parts, actual spending in 2014 is around 20 percent below the levels that were projected for 2014 by CBO in 2009.15
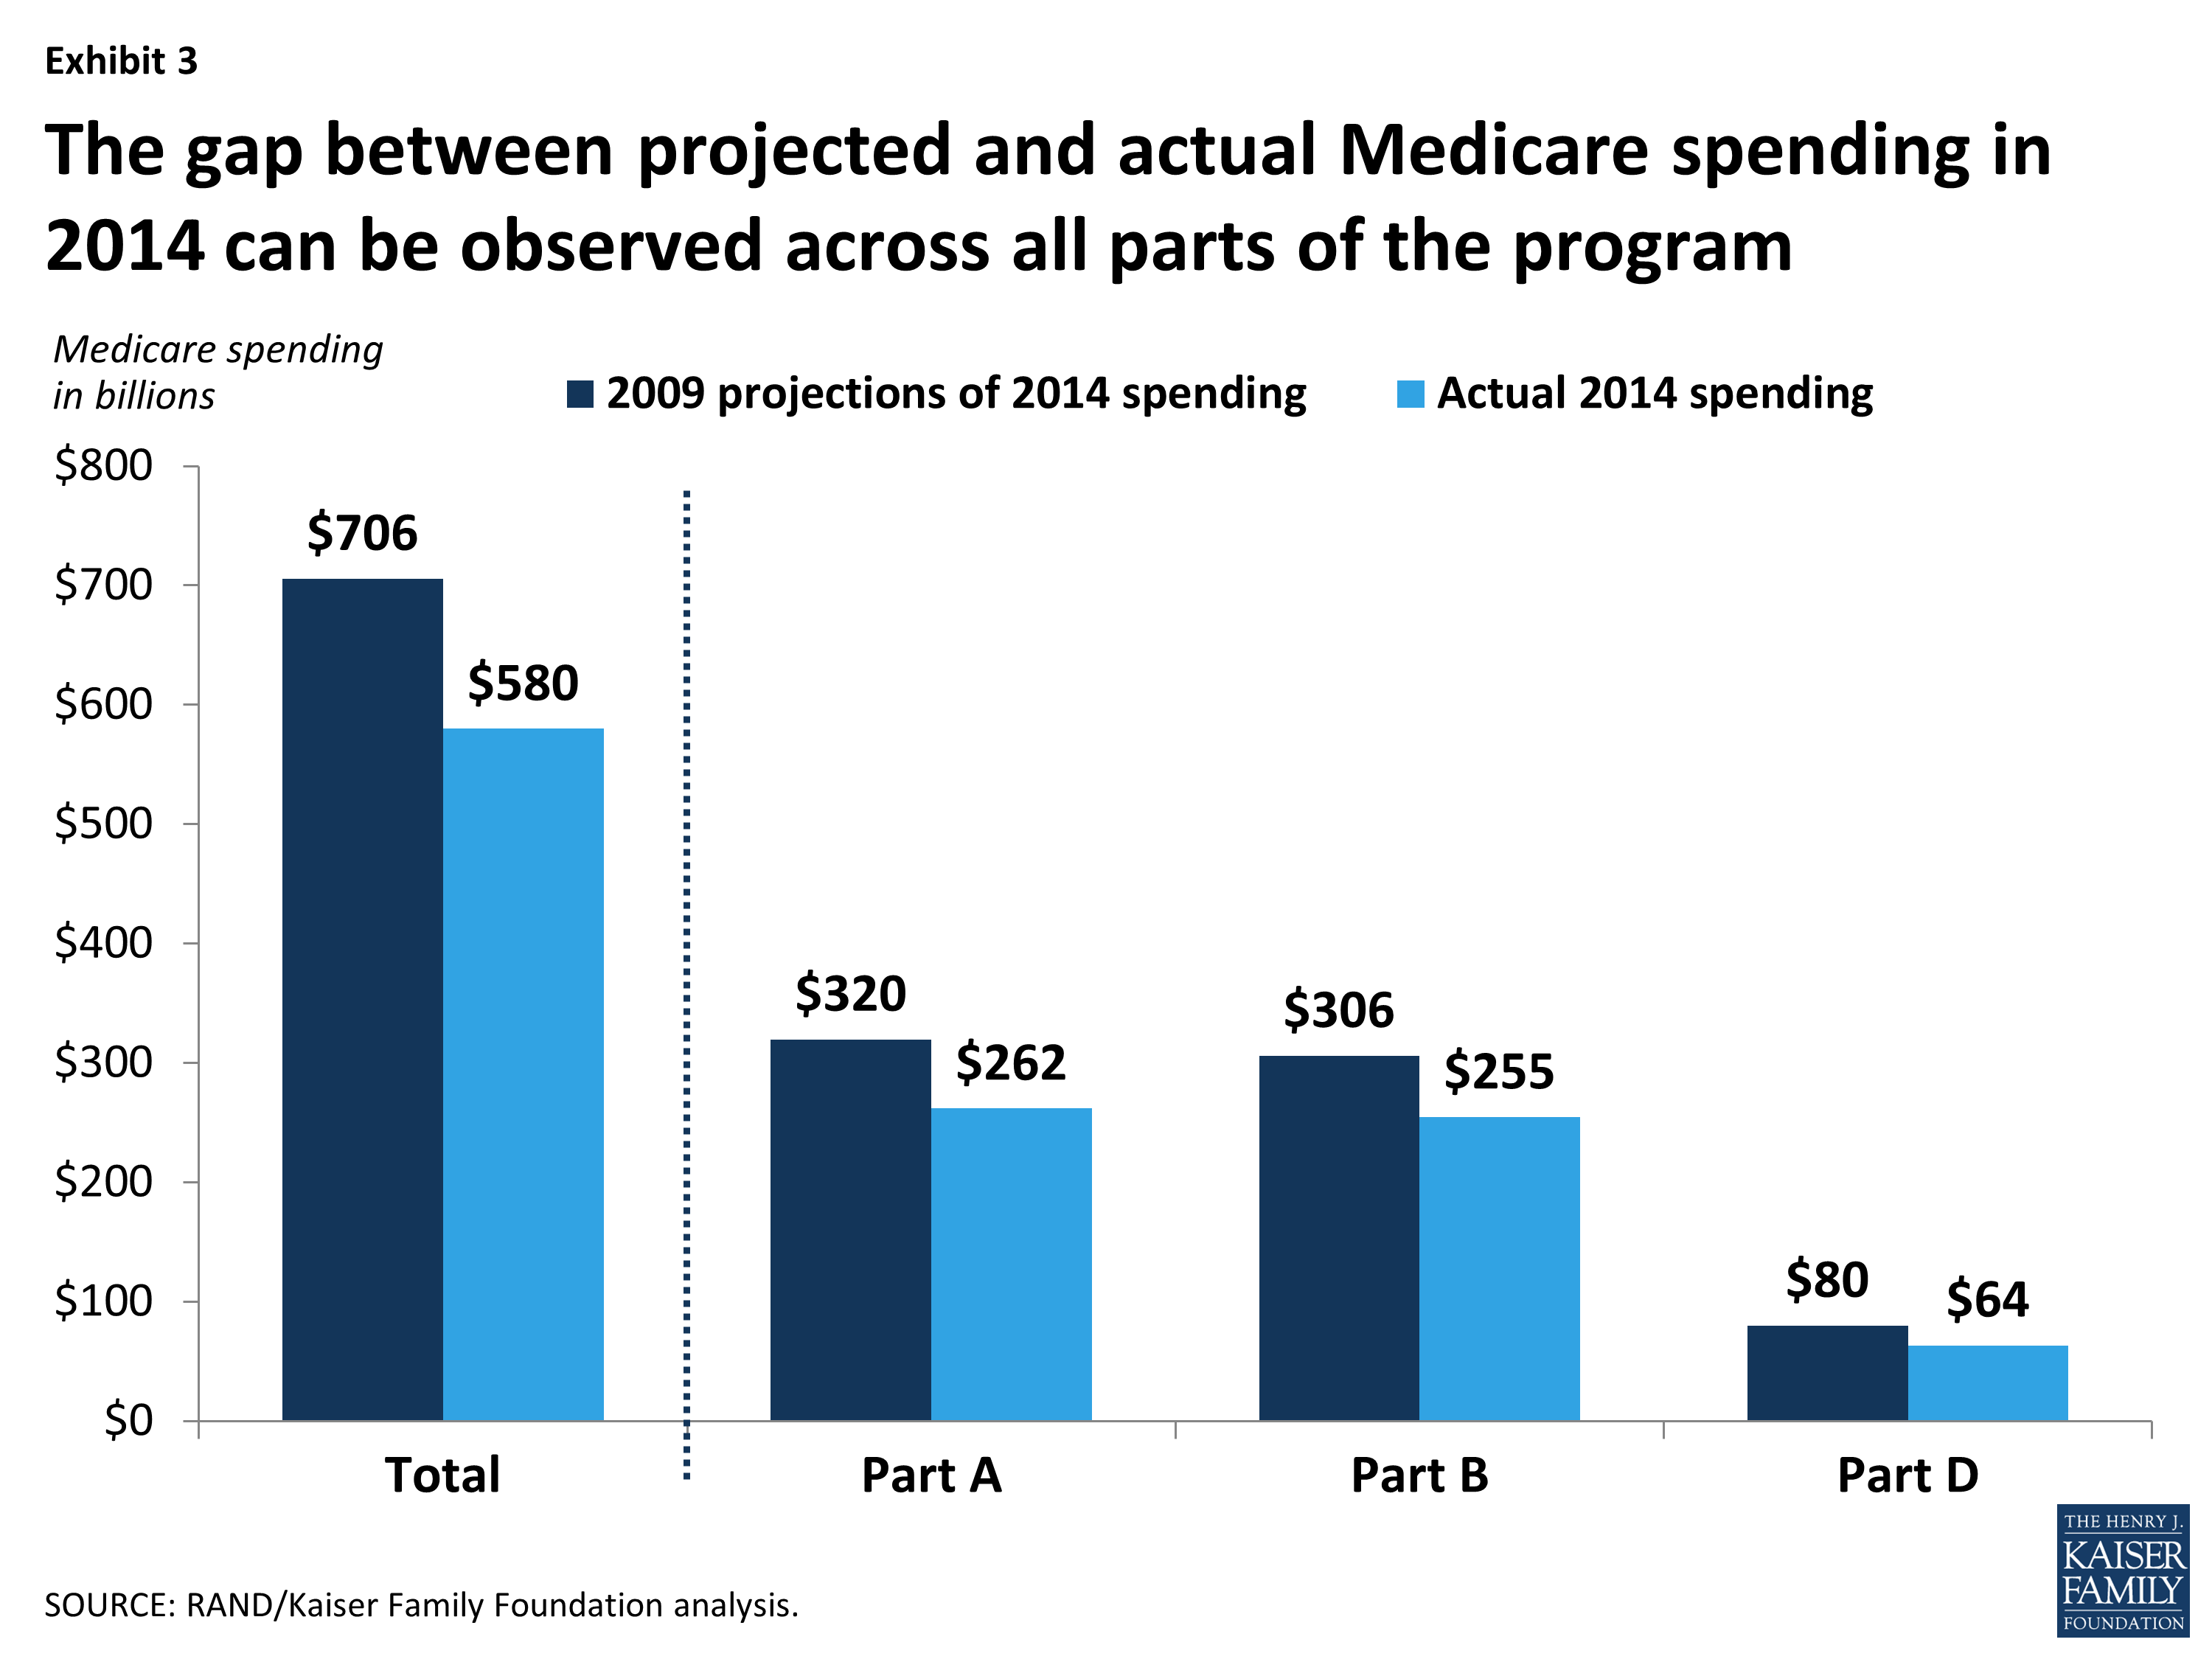
Exhibit 3: The gap between projected and actual Medicare spending in 2014 can be observed across all parts of the program
Explaining the Gap Between Projected and Actual Medicare Spending in 2014
Expected Effects of Changes in Medicare Policy Since 2009
In a program as large and complex as Medicare, three factors make it difficult to measure with any precision the spending effects of any specific policy change: 1) many aspects of the Medicare program are changing at the same time, 2) the program is embedded within a larger health care system that is also in flux, and 3) policy changes in one area of the program may have spillover or interaction effects with other areas. To make inroads in understanding the gap between the projected and actual spending amounts for 2014, we take the approach of using CBO’s estimates to quantify the effects of various policy changes on Medicare spending. In general, CBO estimates of savings are generally considered to be methodologically conservative in that they only credit savings if there is a clear and direct link from the policy to reduced spending. We take CBO’s estimates as a useful approximation of the direct effects of policy changes although, as we will point out, in some cases CBO’s estimates clearly missed the mark.
Based on our analysis, in 2010 CBO expected that the Medicare payment reductions in the ACA would reduce Medicare spending by $58 billion in 2014. The ACA also expanded benefits for prescription drugs and preventive services, which was expected to increase spending this year by around $4 billion, resulting in a net projected savings from the ACA of $54 billion in 2014 ($58 billion in savings minus $4 billion in new spending).16
In 2011, CBO projected that the BCA would reduce Medicare spending by $11 billion in 2014. Two other policy changes—a reduction in hospital payment rates in the American Taxpayer Relief Act of 2012 (ATRA) and competitive bidding for durable medical equipment—were projected to reduce Medicare spending by an estimated $4 billion this year. Taken together, these changes account for net savings of $69 billion in 2014, or more than half (55 percent) of the $126 billion gap between 2009 Medicare spending projections for 2014 and actual Medicare spending this year (See Appendix 2: Factors Related to Changes in Projected vs. Actual Medicare Spending in 2014).
The Affordable Care Act
The ACA, which was enacted in 2010, included a number of provisions designed to achieve Medicare savings:
- Reductions in the growth in Medicare provider payment rates. The prices that Medicare pays to health care providers in the traditional (fee-for-service) program are determined by formulas spelled out in law. The ACA included numerous downward adjustments in these price formulas. These adjustments are “cuts” in the sense that prices have and will continue to grow more slowly as a result of the ACA, although they continue to rise in nominal terms. The most important price cuts in the ACA are the “productivity adjustments,” which are permanent and apply to all providers except physicians. The productivity adjustments reduce default year-over-year price updates to account for economy-wide productivity growth.17 The ACA also included a number of targeted cuts to provider payments, such as reductions of one percentage point in price updates for home health care each year from 2011 through 2013, and reductions in payment rates for advanced imaging.18 The savings from these cuts include the direct effects of lower prices paid in traditional Medicare, as well as indirect savings from reduced payments to Medicare Advantage plans.19 Taken altogether, these provisions were expected to reduce Medicare spending by $24 billion in 2014.
- Reductions in Medicare payments to Medicare Advantage plans. Medicare Advantage plans provide services covered under Parts A and B of Medicare, and in many instances, prescription drugs covered under Part D. Medicare pays plans a fixed amount per enrollee. In 2009, the Medicare Payment Advisory Commission (MedPAC) estimated that Medicare payments per enrollee to Medicare Advantage plans were 114 percent of what spending would have been for those enrollees had they been covered under traditional Medicare, on average. The ACA modified the methodology for calculating benchmarks to reduce the gap in payment between Medicare Advantage and traditional Medicare. The payment reductions were scheduled to be phased in over a six-year period. As of 2014, the payment reductions have been fully implemented in more than half of all counties,20 and the ratio of payments to Medicare Advantage plans relative to traditional Medicare has declined from 114 percent to 106 percent.21 CBO expected these payment changes to reduce Medicare spending by $16 billion in 2014, although, as we describe below, unexpected growth in Medicare Advantage enrollment has offset some of the reduction in Medicare spending associated with the Medicare Advantage payment reductions in the ACA.22
- Elimination of the Medicare Improvement Fund. Prior to the ACA, Congress maintained a sizeable “Medicare Improvement Fund” in the federal accounts, which acted as a reserve source of financing for the program for federal fiscal years 2014 and 2015. The ACA zeroed out this fund, contributing another $16 billion to the difference between projected and actual Medicare spending in 2014.
- Other provisions of the ACA. The ACA launched a vast array of payment and delivery system reforms in the traditional Medicare program with the overarching goal of shifting the program from “paying for volume” to “paying for value.” These reforms include the creation of Accountable Care Organizations (ACOs) through the Medicare Shared Savings Program, authorization of the IPAB, quality-based payment incentives for physicians, hospitals, and Medicare Advantage plans, and enhanced program integrity efforts. The ACA also established the Patient-Centered Outcome Research Institute (PCORI) and the Center for Medicare & Medicaid Innovation (CMMI, or the “Innovation Center”), both of which are charged with testing new payment models and delivery systems. CBO generally scored little or no savings to the Medicare program from these reforms, and altogether they account for only around $2 billion of the expected Medicare savings from the ACA in 2014, based on CBO’s projections.
The ACA also included a number of provisions that were expected to increase Medicare spending in 2014:
- The ACA gradually phases in coverage in the Medicare Part D prescription drug benefit’s coverage gap (the so-called ‘doughnut hole’) and enhanced coverage of and lower beneficiary cost sharing for preventive services. Taken together, these provisions were estimated by CBO to increase Medicare spending by $4 billion in 2014.
Taken together, CBO expected the net effect of the ACA on Medicare spending in 2014 would be a reduction of $54 billion this year.23
The Budget Control Act of 2011
Congress’s goal in enacting the BCA was not to reform the Medicare program, but instead to pressure itself and the President to agree on a sweeping, long-term deficit reduction plan. As an action-forcing mechanism, the BCA included across-the-board fallback cuts (“sequestration”) that were intended to be unpalatable. But, because Congress and the Administration did not reach a broader agreement on a deficit reduction plan, these cuts were implemented beginning in March 2013. As a result, Medicare payments to plans and providers were cut by two percent across-the-board beginning in 2013, and that two-percent reduction in Medicare price levels is scheduled to remain in place through 2023. CBO estimated that the BCA would reduce Medicare spending by $11 billion in 2014.
Medicare Savings from Other Policy Changes Implemented Since 2009
In addition to the ACA and the BCA, Congress and the Administration have made a number of smaller legislative and regulatory changes to the Medicare program since 2009. Two notable changes have contributed approximately $4 billion to the difference between projected and actual Medicare spending in 2014:
- The American Taxpayer Relief Act of 2012 (ATRA) required CMS to reduce hospital payment rates to recoup overpayments resulting from coding “creep.” Coding creep refers to increases in patients’ severity of illness and treatment intensity that are due to changes in documentation rather than health status or care provided. CBO estimated that this adjustment would reduce Medicare spending by $2 billion in 2014.24
- CMS has implemented a pilot program of competitive bidding for durable medical equipment (DME), with the goal of reducing unjustifiably high prices for some types of equipment. An initial pilot was launched in nine metropolitan areas in 2011, and that pilot program was expanded to 91 other metropolitan areas in 2013. The CMS actuary, based on an analysis of claims data through 2011, estimated that the competitive bidding program would reduce Medicare spending by $26 billion over the 10-year period from 2013 through 2022.25 Assuming this spending reduction is distributed evenly over the 10-year period, this would correspond to roughly $2 billion in lower spending in 2014.
Slower Growth in Prescription Drug Spending
Analysts have shown that the growth rate in overall prescription drug spending has been relatively low since 2003, and lower than in previous years.26 This slow growth rate has been reflected in slower growth in Medicare Part D spending than CBO projected when the drug benefit was established.27 Experts attribute that slowing to a number of “blockbuster” drugs coming off patent, and a shift to tiered formularies with cost-sharing differentials that steer patients from higher-priced generics to lower-priced generic substitutes. The Medicare Trustees, in their 2014 report, attribute the slow growth in Part D benefit payments to “… the larger-than-expected impact from the patent expiration for some high-cost drugs and the continual shift from brand-name to generic drugs.”28 According to our estimates of Medicare Part D spending, this slow growth in prescription drug spending accounts for roughly $16 billion of the difference between CBO’s 2009 projections of Medicare spending in 2014 and actual spending this year.
Unanticipated Effects of Changes in Medicare Policy
As mentioned above, CBO generally scored little or no savings to the Medicare program from the Medicare payment and delivery system reforms in the ACA, aside from the more straightforward reductions in provider payment rates. For example, Medicare ACOs were projected by CBO to reduce Medicare spending by only $300 million in 2014, less than one-tenth of one percent of total Medicare spending this year. In the case of ACOs, those expectations of very modest savings appear to be on target, according to recent data from CMS.29
There is some evidence, however, that some of the other payment and delivery system reforms in the ACA, along with other changes in Medicare policy, are altering providers’ behavior and reducing spending in ways that CBO did not anticipate, including lower spending associated with reductions in hospital readmissions, reductions in the area of home health services, and more aggressive program integrity efforts. Taken altogether, we estimate that these factors account for $16 billion of the difference between projected and actual Medicare spending in 2014.
- Hospital readmissions have fallen. The ACA included several provisions targeting hospital readmission rates. One is the Hospital Readmission Reduction Program (HRRP), under which hospitals with high readmission rates began facing financial penalties in October 2012.30 As part of its estimate of the health reform law, CBO estimated $300 million in savings from this program. As it turns out, readmission rates have fallen sharply since 2011, and the Administration estimates an annual reduction of around 75,000 readmissions.31 Taking that number at face value, avoided readmissions this year translates to around $1 billion in Medicare savings in 2014,32 which implies additional savings around three times as large as CBO’s 2010 estimate of $300 million.33
- Home health spending has fallen sharply. The ACA included several provisions that affect home health agencies,34 including payment rebasing, the productivity adjustments, and targeted cuts to prices for home health care, and a new requirement that physicians have a face-to-face encounter before certifying that a patient is eligible for home health care.35 The ACA also expanded “program integrity” (anti-fraud) activities and imposed stiffer penalties for Medicare fraud. In addition, the Medicare Fraud Strike Force, which predated the ACA and was first launched in Miami in 2007, was given enhanced funding and authority under the ACA and was expanded to other cities beginning in 2010.36 The anti-fraud provisions apply broadly, but according to the Department of Health and Human Services Office of Inspector General, “[home health agencies] are considered to be particularly vulnerable to fraud, waste, and abuse.”37
Prior to the ACA, home health spending was growing rapidly, and in 2010, CBO estimated that the payment reductions for home health care in the ACA would deflect the Medicare spending trajectory only slightly downward; $2 billion in lower spending from those price cuts are included in the expected spending reduction from the Medicare provider payment reductions discussed above. Beginning in 2010, however, home health spending slowed much more sharply than expected, with aggregate payments to home health agencies essentially flat and spending per traditional Medicare enrollee falling in nominal terms each year since then. CBO estimated home health savings of around $2 billion in 2014 from the ACA provisions, while we estimate the difference in projected versus actual home health spending in 2014 to be around $12 billion.38 In other words, home health spending in 2014 is $10 billion lower than projected by CBO in 2010, after taking into account the $2 billion ACA payment reductions in 2014.
- Higher recoveries due to increased program integrity. The Medicare program has gradually strengthened its program integrity efforts in a number of ways. These include the nationwide expansion of the Recovery Audit Contractor (RAC) program in 2010,39 the localized Strike Forces described above, the increased penalties in the ACA, and a Fraud Prevention System designed to block improper payments before they go to the provider. The Government Accountability Office reports that the number of post-payment claims reviews grew by more than 50 percent from 2011 to 2012.40 The increased focus on program integrity also appears to have slowed home health spending growth, as described above.
Another visible effect of these program integrity efforts is an increase in recoveries from providers—that is, amounts paid by the Medicare program but then subsequently disallowed and recouped. In 2009, CBO projected that recoveries in the Medicare program would total $13 billion in 2014, but CBO now projects they will total $18 billion this year, a difference of $5 billion. What is impossible to judge is the extent to which the increased claims reviews are producing savings beyond those recovered amounts, by dissuading providers from submitting questionable claims in the first place. This “chilling effect” could be substantial, although it is not quantifiable.
Factors Related to Higher Medicare Spending
Not all of the trends and changes in the Medicare program since 2009 have led to lower spending in 2014 than CBO projected for this year back in 2009. Aside from the benefit improvements included in the ACA described above, two other changes are related to higher spending in 2014 than was anticipated in 2009:
- Higher-than-expected Medicare enrollment. In 2009, CBO projected that enrollment in Part A (which includes traditional Medicare and Medicare Advantage enrollees) would rise to 52 million in 2014. Now, CBO is projecting enrollment of 54 million in Part A this year, a difference of 2 million beneficiaries, or roughly 4 percent. This higher-than-expected enrollment has almost certainly increased Medicare spending this year, although the size of the effect is unclear and depends on exactly which types of beneficiaries account for the higher enrollment. For example, Medicare enrollees ages 65 to 69 have relatively low spending per person, particularly if they have employment-based coverage and Medicare is a secondary payer, whereas older beneficiaries who are more likely to have multiple chronic conditions, have relatively high spending per person. In the absence of evidence to the contrary, we assume that the additional two million enrollees incur spending that is equal to the average spending per person in Medicare. Based on this assumption, Medicare’s higher-than-expected enrollment in 2014 accounts for roughly $19 billion in increased spending this year.41
- Higher-than-expected Medicare Advantage enrollment. Another factor that has contributed to higher Medicare spending in 2014 is the unexpectedly robust enrollment in Medicare Advantage. As discussed earlier, the ACA reduced payments to Medicare Advantage plans, which CBO expected would lead to a roughly 25 percent drop in enrollment in Medicare Advantage in 2014. In fact, enrollment in Medicare Advantage increased between 2010 and 2014, both in absolute numbers (from 11 million to 16 million) and as a share of total Medicare enrollment (from 24 percent to 30 percent). The unexpected growth in Medicare Advantage enrollment affects total Medicare spending because Medicare payments for Medicare Advantage enrollees generally exceed what Medicare would spend on those individuals if they were enrolled in traditional Medicare. As noted above, MedPAC has estimated that the Medicare Advantage payment gap is now around 6 percent (down from 14 percent in 2009).42 The fact that Medicare Advantage enrollment in 2014 far exceeded CBO’s baseline projections in 2009 and 2010 results in an additional $4 billion in Medicare spending in 2014, according to our analysis.43 This is because the 2009 and 2010 projections assumed a larger number of beneficiaries would be covered under traditional Medicare in 2014, at a lower cost per person.
Together, these higher-than-expected enrollment trends can account for an increase of $27 billion in Medicare spending in 2014 that was not forecast back in 2009.
Other Factors that May Have Contributed to the Gap Between Projected and Actual Medicare Spending in 2014
The net effect of the factors that we have quantified thus far account for only about three-fifths of the $126 billion gap between CBO’s 2009 projections for 2014 Medicare spending and actual Medicare spending this year: $105 billion in spending reductions and $27 billion in spending increases, for a net reduction of $78 billion in spending based on factors that can be attributed to specific changes we can identify and quantify. This leaves $48 billion unexplained (Exhibits 4 and 5).

Exhibit 4: Of the net $126 billion gap between projected and actual Medicare spending in 2014, nearly two-thirds can be explained

Exhibit 5: The gap between projected and actual Medicare spending in 2014 includes $105 billion in LOWER spending and $27 billion in HIGHER spending that can be explained, and $48 billion in LOWER spending that is unexplained
Below we discuss several possible factors that could explain some or all of the $48 billion remainder, although it is not yet possible to quantify their specific contribution to the difference between projected and actual Medicare spending in 2014.
- Certain provisions in the ACA may be having a greater-than-expected effect on Medicare spending that is not yet quantifiable. For example, the ACA required that the Secretary of Health and Human Services establish a “National Strategy for Quality Improvement in Health Care,”44 which CBO scored as having no impact on Medicare spending. One outgrowth of the National Strategy was the “Partnership for Patients”45 (P4P), a public-private partnership launched in 2011 that has been focusing on reducing hospital readmission rates and “hospital-acquired conditions” (HACs), including medication errors, post-surgical infections, and pressure ulcers. The Agency for Healthcare Research and Quality has reported that overall hospital-acquired condition rates dropped by nine percent from 2010 to 2012, which the Administration credits to the P4P.46 While a reduction in HACs would reduce Medicare spending and may have contributed to the gap in projected versus actual spending in 2014, the size of the impact is not clear.
- Reductions in Medicare payment rates (prices) may have contributed to a reduction in utilization. The ACA and the BCA reduce the prices that Medicare pays providers for the services they provide. Some analysts believe that providers will make up for payment cuts by increasing volume, but a growing body of evidence links price reductions with reductions in the volume of services provided. Medicare price cuts have been associated with reduced volume of inpatient hospital stays,47 outpatient hospital visits,48 advanced imaging procedures,49 and skilled nursing facility days.50 It is, therefore, possible that the reductions in payment rates under the ACA and BCA are indirectly reducing utilization and spending.51
- Coverage expansions for the nonelderly may be having a modest impact on use of services by Medicare beneficiaries. Coverage expansions have been shown, in some contexts, to reduce the utilization of services among continuously insured populations, such as Medicare beneficiaries.52 That type of displacement can occur when newly insured individuals seek care from a fixed pool of providers, and, as a result, providers shift some of their output to serve the newly insured. The ACA coverage expansions began on a small scale in 2010, and are taking full effect in 2014 with the expansions of Medicaid eligibility and availability of subsidized exchange coverage. It will take months or years for researchers to determine whether the ACA coverage expansions might have had this type of offsetting effect on utilization of services by Medicare beneficiaries, but we would expect the effect, if any, to be modest, if it occurs at all.
- The “Great Recession” may have had indirect effects on Medicare spending. The sharp economic downturn that began in December 2007 resulted in massive losses of employment, income, and employment-based health coverage among the non-elderly.53 As discussed earlier, many analysts have attributed the recent slow growth rate in overall health spending partly to these effects of the Great Recession. But Medicare beneficiaries were largely shielded from those direct effects because they maintained their health care coverage, including, for most beneficiaries, supplemental coverage that covers most out-of-pocket liabilities. The elderly did experience declines in income, housing wealth, and liquid assets from 2008 to 2010, but those losses do not appear to be associated with reductions in utilization of health care services.54
It is possible that the recession may have had a more indirect effect on Medicare spending, but there is little evidence to support this hypothesis. For example, the recession clearly limited hospitals’ revenues and access to capital, and appears to have slowed their investment in new facilities and equipment.55 That reduction in capital investment could have, in turn, limited the supply of services available to treat Medicare beneficiaries, which could have contributed to a reduction in hospital spending. But, at the same time, unemployment and uninsurance among the nonelderly population could have prompted providers to increase the share of their output going to Medicare beneficiaries, which could have increased Medicare spending.56 Thus, while the Great Recession may have affected Medicare spending, the possible net effects are uncertain.
- Medicare may be affected by spillovers from broader health care trends. The health care system is undergoing many changes that could be indirectly affecting spending trends in the Medicare program, including the adoption of alternative payment approaches, increased adherence by medical professionals to treatment guidelines, and an increased role for patients in care decisions.
- Alternative payment approaches. Alternative payment approaches include value-based purchasing, pay-for-performance bonuses, episode-based or “bundled” payments, and global payments capitation. As these payment approaches are being tested in Medicare, similar developments are occurring in commercial health plans and Medicaid.57 The broader application of these payment approaches by other purchasers may reinforce the changes in Medicare and contribute to slowing the growth of Medicare spending.
- Treatment guidelines. There is a growing movement among medical professionals to embrace “parsimonious care” as an ethical obligation, which has been defined as “practic[ing] effective and efficient health care and…us[ing] health care resources responsibly.”58 One prominent force in this movement is the ABIM Foundation’s “Choosing Wisely” campaign, which began in 2011 with top 5 “don’t do” lists for primary care physicians.59 To the extent that more physicians are adhering to such treatment guidelines, this could have the effect of reducing the amount or type of services provided to Medicare beneficiaries, which may affect overall program spending.
- Increased role for patients. Patients are increasingly being encouraged or expected to factor the cost of services into their utilization decisions and to shop around for providers offering the best combination of price and quality, and there is growing interest in efforts to increase the availability of health care price and quality data.60 Although Medicare beneficiaries are not directly affected by these trends, consumerism might indirectly impact Medicare beneficiaries if providers recommend lower-cost treatment protocols or refer their patients to lower-cost settings (e.g., an ambulatory surgical center instead of a hospital outpatient department for advanced imaging).
Conclusion
Much has been written about the slow growth in Medicare spending in recent years. This analysis aims to elaborate on the factors behind the gap between CBO’s 2009 projections of what Medicare spending would be in 2014 and actual 2014 spending. Our analysis shows that policy choices make a difference: the ACA and BCA, along with various policies adopted by the Administrations, account for most of the $126 billion difference between CBO’s 2009 Medicare spending projections for 2014 and actual spending this year. Yet, even after taking into account Medicare spending reductions included in the ACA and BCA, additional savings associated with slower-than-expected growth in drug spending and other changes for which we could find solid evidence of savings, we are still unable to explain what accounts for more than one-third of the gap between projected and actual spending for 2014.
Three significant questions remain. The first is how to explain the remaining portion of the gap between projected and actual spending this year that is, as yet, unexplained. There are several possible factors that we have discussed, but they are difficult or impossible to test and quantify. The second question is how beneficiaries have been affected by the historically low rate of Medicare spending growth. From a financial standpoint, slower spending growth has clearly benefitted beneficiaries by limiting their cost sharing and premium liabilities, but the effects on quality and access to care are more difficult to assess. The third question is whether slow growth in Medicare spending can and will be sustained. Our analysis suggests that the answer to this question depends in large part on future policy choices.
This brief was prepared by Juliette Cubanski and Tricia Neuman from the Kaiser Family Foundation, and Chapin White of the RAND Corporation.
Appendix
Appendix 1: Methodology
For this analysis, “Medicare spending” is defined as payments by the Medicare program for covered services, excluding the costs of administering the program. This spending amount does not include an offset for Part B premium payments (so-called “offsetting receipts”), but does include an offset for amounts paid to providers and subsequently recovered by the program due to improper documentation or some other reason. The years are federal fiscal years (October through September), and spending is adjusted to smooth out unevenness from year to year in the number of capitation payments to Medicare Advantage plans and Part D plans.1
Projected Medicare spending for 2014 is taken from CBO’s March 2009 baseline,2 with an upward adjustment applied to Part B spending on physician services to reflect a physician fee freeze.3 That 2009 projection takes into account the increase in the number of enrollees in the program due to the aging of the “baby boomer” generation, and the shift in enrollment toward a relatively younger population.
Actual spending in 2014 is from the September 2014 issue of the Monthly Treasury Statement, which covers the 2014 fiscal year (October-September).4 The difference between the two estimates—the 2009 spending projection for 2014 and the 2014 actual spending amount—serves as the focus of the analysis of the Medicare spending gap that we attempt to explain in this paper. We use the same methodology to quantify the difference in projected versus actual spending separately for Parts A, B, and D. For each of those parts, we compared CBO’s 2009 projected Medicare spending in 2014 versus actual 2014 spending from the Monthly Treasury Statement.
Chappel et al. (2014) take an alternative approach to quantifying the Medicare spending slowdown. They first measure the historical average annual growth in Medicare spending per enrollee excluding Part D from 2000-2008 (6.3 percent), and then create a benchmark by applying that growth rate from 2008 forward. That approach results in projected spending in 2014 that is even higher than the method we use. One difference between the approaches lies in the fact that using historical average growth rates implicitly assumes that the Medicare program will continue to be changed in ways that are similar to the ways it has been changed in the past, while using CBO’s projections (as we do) assumes that the Medicare program will remain unchanged during the projection period.
Appendix 2: Factors Related to Changes in Projected Versus Actual Medicare Spending in 2014
| Factor | Estimate of Medicare spending effect | Source of estimate |
| PROJECTED MEDICARE SPENDING IN 2014 (BASED ON 2009 ESTIMATES) | $706 BILLION | Author’s analysis of CBO (2009a, 2009b) |
| ACTUAL MEDICARE SPENDING IN 2014 | $580 BILLION | Author’s analysis of CBO (2014) and Treasury (2014) |
| DIFFERENCE | $126 BILLION | |
| FACTORS RELATED TO LOWER MEDICARE SPENDING IN 2014 | Effect on Medicare Spending in 2014 | |
| CBO projected savings from the ACA and BCA | ||
| ACA: Fee-for-service price cuts | $24 billion spending reduction | Author’s analysis of CBO (2010) |
| ACA: Medicare Advantage cuts | $16 billion spending reduction | Author’s analysis of CBO (2010) |
| ACA: Elimination of Medicare Improvement Fund | $16 billion spending reduction | Author’s analysis of CBO (2010) |
| ACA: Payment and delivery system reform | $2 billion spending reduction | Author’s analysis of CBO (2010) |
| BCA: Fee-for-service price cuts (sequestration) | $11 billion spending reduction | CBO (2011) |
| SUBTOTAL | $69 billion spending reduction | |
| Other policy changes | ||
| ATRA: Recoupment of coding “creep” | $2 billion spending reduction | CBO (2013) |
| MMA and ACA: Competitive bidding for durable medical equipment | $2 billion spending reduction | Author’s analysis based on CMS (2012) |
| SUBTOTAL | $4 billion spending reduction | |
| Prescription drugs | ||
| Unexpectedly slow growth in prescription drug spending | $16 billion spending reduction | Author’s analysis based on Medicare Trustees reports (2013 and 2014) |
| SUBTOTAL | $16 billion spending reduction | |
| Unanticipated effects of changes in Medicare policy | ||
| Reduction in hospital readmissions | $1 billion spending reduction | DHHS (2014) |
| Reductions in home health utilization | $10 billion spending reduction | Author’s analysis |
| Increased recoveries from providers | $5 billion spending reduction | Author’s analysis of CBO (2009 and 2014) |
| SUBTOTAL | $16 billion spending reduction | |
| SUBTOTAL: Factors related to lower Medicare spending | $105 billion spending reduction | |
| FACTORS RELATED TO HIGHER MEDICARE SPENDING IN 2014 | ||
| ACA benefit expansions | $4 billion spending increase | Author’s analysis of CBO (2010) |
| Unexpected growth in overall enrollment | $19 billion spending increase | Author’s analysis |
| Unexpected growth in enrollment in Medicare Advantage | $4 billion spending increase | Author’s analysis |
| SUBTOTAL: Factors related to higher Medicare spending | $27 billion spending increase | |
| SUBTOTAL: EXPLAINED FACTORS | $78 billion spending reduction | |
| RESIDUAL: Unexplained factors related to lower Medicare spending | $48 billion spending reduction | |
| SOURCES: CBO, 2009a, CBO’s March 2009 Baseline: MEDICARE; CBO, 2009b, “A Preliminary Analysis of the President’s Budget and an Update of CBO’s Budget and Economic Outlook,” March 2009; CBO, 2010, “Cost estimate for the amendment in the nature of a substitute for H.R. 4872, incorporating a proposed manager’s amendment made public on March 20, 2010;” CMS, Competitive Bidding Update—One Year Implementation Update, April 17, 2012; CBO, Estimated Impact of Automatic Budget Enforcement Procedures Specified in the Budget Control Act, September 12, 2011; CBO, Detail on Estimated Budgetary Effects of Title VI (Medicare and Other Health Extensions) of H.R. 8, the American Taxpayer Relief Act of 2012, as passed by the Senate on January 1, 2013, January 1, 2013; CBO, 2014, “Congressional Budget Office’s April 2014 Medicare Baseline.” U.S. Department of Health and Human Services, 2014, “New HHS Data Shows Major Strides Made in Patient Safety, Leading to Improved Care and Savings;” U.S. Department of the Treasury, Monthly Treasury Statement of Receipts and Outlays of the United States Government for Fiscal Year 2014 Through September 30, 2014, and Other Periods. | ||
Endnotes
Introduction
See for example: Orszag, P. R., and P. Ellis. 2007. "Addressing Rising Health Care Costs—A View from the Congressional Budget Office." New England Journal of Medicine 357(19), 1885-87; Orszag, P. R., and P. Ellis. 2007. "The Challenge of Rising Health Care Costs—A View from the Congressional Budget Office." New England Journal of Medicine 357(18), 1793-95; U.S. Government Accountability Office. 2007. "Health Care 20 Years from Now: Taking Steps Today to Meet Tomorrow’s Challenges ", http://www.gao.gov/assets/210/203207.pdf.
Medicare accounts for one-seventh of all federal spending and 3 percent of the nation’s economy. (See Table 1-1 in Congressional Budget Office. 2014. "The 2014 Long-Term Budget Outlook." http://www.cbo.gov/sites/default/files/cbofiles/attachments/45471-Long-TermBudgetOutlook.pdf.
Jacobson, Gretchen, "Medicare and the Federal Budget: Comparison of Medicare Provisions in Recent Federal Debt and Deficit Reduction Proposals," Kaiser Family Foundation, January 13, 2014, https://www.kff.org/medicare/issue-brief/medicare-and-the-federal-budget-comparison-of-medicare-provisions-in-recent-federal-debt-and-deficit-reduction-proposals/.
Kronick, R., and R. Po. 2013. "Growth In Medicare Spending Per Beneficiary Continues To Hit Historic Lows." Assistant Secretary for Planning and Evaluation, http://aspe.hhs.gov/health/reports/2013/medicarespendinggrowth/ib.cfm.
Medicare Trustees. 2014. "2014 Annual Report Of The Boards Of Trustees Of The Federal Hospital Insurance And Federal Supplementary Medical Insurance Trust Funds," http://www.cms.gov/Research-Statistics-Data-and-Systems/Statistics-Trends-and-Reports/ReportsTrustFunds/Downloads/TR2014.pdf.
Spitalnic, Paul, Letter to Administrator Tavenner Updating the IPAB Determination, Centers for Medicare & Medicaid Services, July 28, 2014, http://www.cms.gov/Research-Statistics-Data-and-Systems/Research/ActuarialStudies/Downloads/IPAB-2014-07-28.pdf.
Issue Brief
Roehrig, Charles, Ani Turner, Paul Hughes-Cromwick, and George Miller, "When the Cost Curve Bent — Pre-Recession Moderation in Health Care Spending," New England Journal of Medicine, Vol. 367, No. 7, August 16, 2012, pp. 590-593.
See for example: Dranove, D., C. Garthwaite, and C. Ody. 2014. "Health Spending Slowdown Is Mostly Due To Economic Factors, Not Structural Change In The Health Care Sector." Health Affairs 33(8), 1399-406; Cuckler, G. A., A. M. Sisko, S. P. Keehan, S. D. Smith, A. J. Madison, J. A. Poisal, C. J. Wolfe, J. M. Lizonitz, and D. A. Stone. 2013. "National Health Expenditure Projections, 2012–22: Slow Growth Until Coverage Expands And Economy Improves." Health Affairs 32(10); Levitt, Larry, Gary Claxton, Charles Roehrig, and Thomas Getzen, Assessing the Effects of the Economy on the Recent Slowdown in Health Spending, April 22, 2013. https://www.kff.org/health-costs/issue-brief/assessing-the-effects-of-the-economy-on-the-recent-slowdown-in-health-spending-2/.
See for example: McIntyre, Adrianna, Orszag: It's time for some optimism about health care spending, Vox, June 15, 2014. http://www.vox.com/2014/6/15/5807046/orszag-its-time-for-some-optimism-about-health-care-spending; Cutler, D. M., and N. R. Sahni. 2013. "If Slow Rate Of Health Care Spending Growth Persists, Projections May Be Off By $770 Billion." Health Affairs 32(5), 841-50, http://content.healthaffairs.org/content/32/5/841.full.pdf; Chandra, A., J. Holmes, and J. Skinner. 2013. "Is This Time Different? The Slowdown in Healthcare Spending." NBER Working Paper No. 19700, http://www.nber.org/papers/w19700; Blumenthal, D., K. Stremikis, and D. Cutler. 2013. "Health Care Spending — A Giant Slain or Sleeping?" New England Journal of Medicine 369(26), 2551-57, http://www.nejm.org/doi/full/10.1056/NEJMhpr1310415.
White, Chapin, "Why Did Medicare Spending Growth Slow Down?," Health Affairs, Vol. 27, No. 3, May/June, 2008, pp. 793-802.
Levine, Michael, and Melinda Buntin. 2013. "Why Has Growth in Spending for Fee-for-Service Medicare Slowed?", CBO Working Paper 2013-06, http://www.cbo.gov/sites/default/files/cbofiles/attachments/44513_MedicareSpendingGrowth-8-22.pdf.
Chappel, Andre, Arpit Misra, and Steven Sheingold, Medicare's Bending Cost Curve, Assistant Secretary for Planning and Evaluation, July 28, 2014, http://aspe.hhs.gov/health/reports/2014/MedicareCost/ib_medicost.pdf.
Committee for a Responsible Federal Budget, Temporary Effects Driving Medicare's Slow Growth in 2014, May 13, 2014, http://crfb.org/blogs/temporary-effects-driving-medicares-slow-growth-2014.
Neuman, Tricia, and Juliette Cubanski, "The Mystery of the Missing $1,200 Per Person: Can Medicare’s Spending Slowdown Continue?" September 29, 2014, https://www.kff.org/health-costs/perspective/the-mystery-of-the-missing-1000-per-person-can-medicares-spending-slowdown-continue.
Adler, Loren and Adam Rosenberg, "The $500 Billion Medicare Slowdown: A Story About Part D," Health Affairs blog, October 21, 2014, http://healthaffairs.org/blog/2014/10/21/the-500-billion-medicare-slowdown-a-story-about-part-d/.
Dobson, Al, Gregory Berger, Kevin Reuter, and Joan E. DaVanzo, Do Structural Changes Drive the Recent Health Care Spending Slowdown? New Evidence, February 28, 2014, http://fahpolicy.org/wp-content/uploads/2014/03/Dobson-DaVanzo-Federation-Study.pdf.
In 2008, total Medicare spending was $445 billion and there were 44.4 million beneficiaries (both from CBO’s March 2009 Medicare baseline). CBO projected in 2009 that the number of beneficiaries would grow to 51.9 billion in 2014. We measured average annual rates of growth in Medicare spending per beneficiary on Parts A and B over four historical periods: 2000-2008 (6.4%), 1995-2008 (5.1%), 1990-2008 (6.1%), and 1985-2008 (6.3%). (From the Medicare Trustees. 2014. "2014 Annual Report Of The Boards Of Trustees Of The Federal Hospital Insurance And Federal Supplementary Medical Insurance Trust Funds." http://www.cms.gov/Research-Statistics-Data-and-Systems/Statistics-Trends-and-Reports/ReportsTrustFunds/Downloads/TR2014.pdf.) Projected spending in 2014 equals $445 billion*(51.9/44.4)*((1+g )^(2014-2008)), where g equals the historical growth rate. This yields projected spending of $753 billion (g=0.064, 2000-2008), $702 billion (g=0.051, 1995-2008), $740 billion (g=0.061, 1990-2008), and $750 billion (g=0.063, 1985-2008).
Congressional Budget Office, Cost estimate for the amendment in the nature of a substitute for H.R. 4872, incorporating a proposed manager's amendment made public on March 20, 2010, March 20, 2010, http://www.cbo.gov/ftpdocs/113xx/doc11379/AmendReconProp.pdf.
Congressional Budget Office, Estimated Impact of Automatic Budget Enforcement Procedures Specified in the Budget Control Act, September 12, 2011, http://www.cbo.gov/sites/default/files/09-12-BudgetControlAct_0.pdf.
The savings for Parts A, B, and D are calculated by comparing: 1) CBO’s projections in March 2009 of benefit payments in each part of the program (with recovered amounts allocated proportionally, and with Part B benefit payments increased to reflect an “SGR fix”) with 2) actual benefit payments using FY 2014 outlays from the September 2014 Monthly Treasury Report. See U.S. Department of the Treasury, Monthly Treasury Statement of Receipts and Outlays of the United States Government for Fiscal Year 2014 Through September 30, 2014, and Other Periods, http://www.fiscal.treasury.gov/fsreports/rpt/mthTreasStmt/mts0914.pdf.
Loren Adler and Adam Rosenberg have reported that “Part D has accounted for over 60 percent of the slowdown in Medicare benefits since 2011” (See Adler, L., and A. Rosenberg. 2014. "The $500 Billion Medicare Slowdown: A Story About Part D." Health Affairs Blog, http://healthaffairs.org/blog/2014/10/21/the-500-billion-medicare-slowdown-a-story-about-part-d/). Adler and Rosenberg’s analysis differs in two key ways from our analysis. First, to quantify the Medicare spending slowdown, they compare CBO’s March 2011 baseline with CBO’s April 2014 baseline. The March 2011 baseline already incorporates the projected savings in Parts A and B from the ACA. Second, they do not adjust the March 2011 baseline to reflect the anticipated effect of the SGR fixes.
For CBO’s score of the ACA, see Congressional Budget Office. 2010. "Cost estimate for the amendment in the nature of a substitute for H.R. 4872, incorporating a proposed manager's amendment made public on March 20, 2010." http://www.cbo.gov/ftpdocs/113xx/doc11379/AmendReconProp.pdf. The $54 billion in savings is larger than the $42 billion reported by CBO for 2014 for “Medicare and Other Medicaid and CHIP Provisions.” The difference between $54 billion and $42 billion reflects the fact that we are focusing on Medicare spending, whereas CBO’s estimated $42 billion reflects the estimated effect of the Medicare provisions on net outlays, which includes an offset for reduced collections of beneficiary premium payments.
See ACA section 3401.
See ACA sections 3401(e) and 10319(d).
This analysis follows CBO’s general approach of including indirect savings in the Medicare Advantage program in the savings attributed to changes in fee-for-service prices. For example, CBO notes in its 2014 score of the "SGR Repeal and Medicare Beneficiary Improvement Act of 2013" (http://cbo.gov/sites/default/files/cbofiles/attachments/s1871.pdf): “Payments to Medicare Advantage (MA) plans are based on underlying fee-for-service (FFS) costs, so CBO estimates an interaction between changes in FFS spending and MA plan payments. … Most estimates in the preceding table incorporate the effect of changes in FFS spending on MA spending …”
Neuman, Tricia, and Gretchen Jacobson, Medicare Advantage: Take Another Look, May 7, 2014. https://www.kff.org/medicare/perspective/medicare-advantage-take-another-look/.
Medicare Payment Advisory Commission, Medicare Payment Policy, March, 2014.
In 2009, CBO projected that there would be 12 million enrollees in Medicare Advantage plans in 2014, and that Medicare would spend a total of $155 billion on Medicare Advantage, or $12,600 per enrollee. Based on CBO’s most recent projections, actual spending on Medicare Advantage will total $156 billion in 2014, which almost exactly matches the total projected in 2009. That near match reflects two major offsetting factors: enrollment in Medicare Advantage is much higher than was projected in 2009—16 million beneficiaries rather than 12 million—and spending per enrollee is much lower than was projected in 2009—$9,600 rather than $12,600. If CBO has projected that Medicare Advantage enrollment would increase to 16 million in 2014 when estimating the effects of the ACA Medicare Advantage payment reductions, rather than decline to 9 million, CBO’s projected Medicare baseline for 2014 would have been higher, as would their estimates of savings attributable to the Medicare Advantage payment reductions that year; quantifying these effects is beyond the scope of this analysis.
CBO’s 2010 score of the ACA reports that the Medicare provisions would reduce the deficit by $43 billion. That total is smaller than the $54 billion net reduction in Medicare spending. The effect on the deficit is smaller than the effect on spending because the deficit effect includes an offset for reduced premium payments (i.e. “offsetting receipts”).
Congressional Budget Office, Detail on Estimated Budgetary Effects of Title VI (Medicare and Other Health Extensions) of H.R. 8, the American Taxpayer Relief Act of 2012, as passed by the Senate on January 1, 2013, January 1, 2013, http://www.cbo.gov/sites/default/files/cbofiles/attachments/SenateHR8-TitleVI_0.pdf.
Centers for Medicare & Medicaid Services, Competitive Bidding Update—One Year Implementation Update, April 17, 2012, http://www.cms.gov/Medicare/Medicare-Fee-for-Service-Payment/DMEPOSCompetitiveBid/Downloads/Competitive-Bidding-Update-One-Year-Implementation.pdf.
Congressional Budget Office, "Competition and the Cost of Medicare's Prescription Drug Program," July 30, 2014, http://www.cbo.gov/publication/45552; Medicare Trustees, 2014 Annual Report Of The Boards Of Trustees Of The Federal Hospital Insurance And Federal Supplementary Medical Insurance Trust Funds.
Jack Hoadley, "Medicare Part D Spending: Understanding Key Drivers and the Role of Competition," Kaiser Family Foundation, May 2012, https://www.kff.org/health-costs/issue-brief/medicare-part-d-spending-trends-understanding-key/.
Medicare Trustees, 2014 Annual Report Of The Boards Of Trustees Of The Federal Hospital Insurance And Federal Supplementary Medical Insurance Trust Funds, page 105.
Centers for Medicare & Medicaid Services, Medicare Shared Savings Program Performance Year 1 Results, September, 2014, http://www.cms.gov/Medicare/Medicare-Fee-for-Service-Payment/sharedsavingsprogram/Downloads/MSSP-PY1-Final-Performance-ACO.pdf.
Health Affairs. 2013. "Medicare Hospital Readmissions Reduction Program."
U.S. Department of Health and Human Services. 2014. "New HHS Data Shows Major Strides Made in Patient Safety, Leading to Improved Care and Savings," http://innovation.cms.gov/Files/reports/patient-safety-results.pdf.
Based on historical data on program payments per discharge and estimates by the Medicare Trustees of increases in prices per discharge, average spending per inpatient hospital discharge is just over $12,000 this year.
The full effects of avoided readmissions on total Medicare spending will depend on spillover effects on services that are substitutes (e.g. emergency department visits), as well as complements (e.g. post-acute rehabilitation services). While the rate of hospital readmissions has declined since 2010, the rate of emergency department visits has increased, as has the rate of “observation stays,” meaning . This suggests that emergency department visits and observation stays might be substituting for at least some of the avoided readmissions, and that savings to the Medicare program might be smaller than $1 billion. But, Gerhardt et al. (2014) report that “our analysis of Medicare claims data does not suggest that the overall reduction in Medicare readmission rates that occurred in 2012 was primarily the result of greater use of outpatient ED visits or observation stays.” (Gerhardt, G., A. Yemane, K. Apostle, A. Oelschlaeger, E. Rollins, and N. Brennan. 2014. "Evaluating Whether Changes in Utilization of Hospital Outpatient Services Contributed to Lower Medicare Readmission Rate." Medicare & Medicaid Research Review 4(1), E1-E13.)
The relevant ACA sections are: productivity adjustments (Sec. 3401), targeted cuts to prices for home health care (Sec. 3131), a new requirement that physicians have a face-to-face encounter before certifying that a patient is eligible for home health care (Sec. 6407), expanded “program integrity” (anti-fraud) activities (Secs. 6402 and 6411), and stiffer penalties Medicare fraud (Secs. 6408 and 10606).
Medicare Payment Advisory Commission, Medicare Payment Policy, March 2014, Chapter 9; http://medpac.gov/documents/reports/mar14_entirereport.pdf.
Department of Health and Human Services, Medicare Fraud Strike Force charges 90 individuals for approximately $260 million in false billing, May 13, 2014, http://www.hhs.gov/news/press/2014pres/05/20140513b.html.
Office of Inspector General. 2012. "CMS And Contractor Oversight Of Home Health Agencies." http://oig.hhs.gov/oei/reports/oei-04-11-00220.pdf.
In 2009, CBO projected that home health spending per enrollee in traditional Medicare would be $732 in 2014. CBO’s most recent projections of home health spending per enrollee in 2014 are $500. When multiplied by 54 million enrollees, the change in home health spending ($500 versus $732) has reduced total Medicare spending by $12.5 billion (this estimate includes the Medicare Advantage interaction).
U.S. Government Accountability Office, Medicare Program Integrity: Increasing Consistency of Contractor Requirements May Improve Administrative Efficiency, July 2013, http://www.gao.gov/assets/660/656132.pdf.
The additional spending from higher enrollment equals $12,000 spending per enrollee multiplied by 1.6 million additional enrollees.
Medicare Payment Advisory Commission, Medicare Payment Policy, March 2009; Medicare Payment Advisory Commission, Medicare Payment Policy, March 2014.
In 2010, after the enactment of the ACA, CBO projected that 18 percent of Medicare enrollees would be in Medicare Advantage in 2014. Based on the most recent Medicare Trustees report, the actual share of enrollees in Medicare Advantage in 2014 is around 30 percent, which is 12 percentage points higher than CBO projected in 2010. The estimated spending impact of higher-than-expected enrollment in Medicare Advantage equals 12 percent (i.e. 30 percent minus 18 percent) of enrollees multiplied by the 6 percent payment gap multiplied by total spending of $580 billion. This estimate is our best approximation of the added Medicare spending due to higher-than-expected Medicare Advantage enrollment; calculating the exact amount would require knowing the counties in which those additional Medicare Advantage enrollees live and the difference between Medicare Advantage and traditional Medicare spending in those counties and for those individual enrollees.
U.S. Department of Health and Human Services. 2012. "National Strategy for Quality Improvement in Health Care."
The Administration describes the Partnership for Patients as “a public-private partnership working to improve the quality, safety and affordability of health care for all Americans.” See Centers for Medicare & Medicaid Services, 2014, "Partnership for Patients," http://innovation.cms.gov/initiatives/partnership-for-patients/.
U.S. Department of Health and Human Services. 2014. "New HHS Data Shows Major Strides Made in Patient Safety, Leading to Improved Care and Savings," http://innovation.cms.gov/Files/reports/patient-safety-results.pdf.
See the rightmost column in Table 7, Dafny, L. S. 2005. "How Do Hospitals Respond to Price Changes?" American Economic Review 95(5), 1525-47; White, C., and N. Nguyen. 2011. "How Does the Volume of Post-Acute Care Respond to Changes in the Payment Rate?" Medicare & Medicaid Research Review 3(1), E1-E22, http://dx.doi.org/10.5600/mmrr.001.03.a01.
He, D., and J. M. Mellor. 2012. "Hospital volume responses to Medicare’s Outpatient Prospective Payment System: Evidence from Florida." Journal of Health Economics 31, 730–43; He, D., and J. M. Mellor. 2013. "Do Changes in Hospital Outpatient Payments Affect the Setting of Care?" Early View, http://onlinelibrary.wiley.com/doi/10.1111/1475-6773.12069/full.
Levin, David C., Vijay M. Rao, and Laurence Parker, "Trends in the Utilization of Outpatient Advanced Imaging After the Deficit Reduction Act," Journal of the American College of Radiology, Vol. 9, No. 1, January, 2012, pp. 27-32. http://www.sciencedirect.com/science/article/pii/S1546144011004844.
White, C., and T. Yee. 2013. "When Medicare Cuts Hospital Prices, Seniors Use Less Inpatient Care." Health Affairs 32(10), 1789–95.
In the market for physician services, the evidence on the effects of price changes on volume is more mixed. An early generation of studies found that Medicare price cuts appeared to increase the volume of services provided (the so-called “volume offset”). For example, see Nguyen, X. N., and F. W. Derrick. 1997. "Physician Behavioral Response to a Medicare Price Reduction." Health Services Research 32(3), 283-98; and Yip, W. C. 1998. "Physician Response to Medicare Fee Reductions: Changes in the Volume of Coronary Artery Bypass Graft (CABG) Surgeries in the Medicare and Private Sectors." Journal of Health Economics 17(6), 675-99. Also a recent study shows evidence of a volume offset in the provision of chemotherapy (Jacobson, Mireille, Tom Y. Chang, Joseph P. Newhouse, and Craig C. Earle, Physician Agency and Competition: Evidence from a Major Change to Medicare Chemotherapy Reimbursement Policy, NBER, July, 2013. http://www.nber.org/papers/w19247). But, most recent studies suggest that the market for physician services operates like a typical market, and that reduced prices for physician services lead to reduced physician labor supply, and reduced volume of physician services provided. For example, see Staiger, D. O., D. I. Auerbach, and P. I. Buerhaus. 2010. "Trends in the Work Hours of Physicians in the United States." Journal of the American Medical Association 303(8), 747-53; and Dunn, A., and A. H. Shapiro. 2012. "Physician Market Power and Medical-Care Expenditures," http://www.bea.gov/papers/pdf/physician_market_power_and_medical_care.pdf.
See for example: Stewart, W. H., and P. E. Enterline. 1961. "Effects of the National Health Service on Physician Utilization and Health in England and Wales." New England Journal of Medicine 265, 1187-94; Enterline, P. 1973. "The Distribution of Medical Services before and after 'Free' Medical Care -- The Quebec Experience." New England Journal of Medicine 289, 1174-78; Bond, A. M., and C. White. 2013. "Massachusetts Coverage Expansion Associated with Reduction in Primary Care Utilization among Medicare Beneficiaries." Health Services Research 48(6pt1), 1826-39. Also, the expansion of coverage when Medicare was established in the 1960s has been linked to an increase in spending on hospital services among the nonelderly; see Finkelstein, Amy, "The Aggregate Effects of Health Insurance: Evidence from the Introduction of Medicare," Quarterly Journal of Economics, Vol. 122, No. 1, 2007, pp. 1-37. That type of positive spending spillover from a coverage expansion may be a historical artifact that does not apply to the current coverage expansions—Medicare’s payments to hospitals at the time the program was established were extremely generous, and supported broad-based expansions in capacity and staffing.
White, C., and J. D. Reschovsky. 2012. "Great Recession Accelerated Long-Term Decline of Employer Health Coverage." National Institute for Health Care Reform, Number 8, Online: http://www.nihcr.org/Employer_Coverage.pdf.
Levine and Buntin, "Why Has Growth in Spending for Fee-for-Service Medicare Slowed?"
American Hospital Association. 2010. "Hospitals Continue to Feel Lingering Effects of the Economic Recession," http://www.aha.org/content/00-10/10june-econimpact.pdf.
McInerney, M. P., and J. M. Mellor. 2012. "State Unemployment In Recessions During 1991–2009 Was Linked To Faster Growth In Medicare Spending " Health Affairs 31(11), 2464-73.
See for example: Song, Z., D. G. Safran, B. E. Landon, M. B. Landrum, Y. He, R. E. Mechanic, M. P. Day, and M. E. Chernew. 2012. "The ‘Alternative Quality Contract,’ Based On A Global Budget, Lowered Medical Spending And Improved Quality." Health Affairs 31(8), 1-10; Grossman, J., H. Tu, and D. Cross. 2013. "Arranged Marriages: The Evolution of ACO Partnerships in California," http://www.chcf.org/~/media/MEDIA%20LIBRARY%20Files/PDF/A/PDF%20ArrangedMarriagesACOsCalifornia.pdf; Newcomer, L. N. 2012. "Changing Physician Incentives For Cancer Care To Reward Better Patient Outcomes Instead Of Use Of More Costly Drugs." Health Affairs 31(4), 780-85; Hussey, P. S., A. W. Mulcahy, C. Schnyer, and E. C. Schneider. 2012. "Bundled Payment: Effects on Health Care Spending and Quality," Agency for Healthcare Research and Quality, Number 208, http://www.effectivehealthcare.ahrq.gov/ehc/products/324/1235/EvidenceReport208_CQGBundledPayment_FinalReport_20120823.pdf.
Snyder, L. 2012. "American College of Physicians Ethics Manual: Sixth Edition." Annals of Internal Medicine 156(1, Part 2), p. 86.
The Good Stewardship Working Group. 2011. "The “Top 5” Lists in Primary Care." Archives of Internal Medicine 171(15), 1385, http://archinte.jamanetwork.com/data/Journals/INTEMED/22524/isa15004_1385_1390.pdf.
White, C., P. B. Ginsburg, H. T. Tu, J. D. Reschovsky, J. M. Smith, and K. Liao. 2014. "Healthcare Price Transparency: Policy Approaches and Estimated Impacts on Spending." West Health Policy Center, http://www.westhealth.org/sites/default/files/Price%20Transparency%20Policy%20Analysis%20FINAL%205-2-14.pdf.
Appendix
Most federal fiscal years include 12 monthly capitation payments, but some years include 13 and others include only 11.
CBO, March 2009 Baseline: Medicare, https://www.cbo.gov/sites/default/files/cbofiles/attachments/medicare.pdf.
As was widely expected in 2009, the physician fee cuts called for under the Sustainable Growth Rate (SGR) formula were overridden each year from 2010 through 2014. Therefore, to calculate CBO’s projected Medicare spending in 2010 through 2014, we added the estimated increase in Medicare spending from overriding the SGR. The spending increase from overriding the SGR was based on the President’s 2009 budget, which proposed to freeze physician fees at the 2009 level, as reported in Congressional Budget Office. 2009. "A Preliminary Analysis of the President's Budget and an Update of CBO's Budget and Economic Outlook." http://www.cbo.gov/sites/default/files/cbofiles/ftpdocs/100xx/doc10014/03-20-presidentbudget.pdf. The spending increase reported by CBO includes an offset for changes in Part B premium payments. Therefore, we divided the spending increase reported by CBO by one minus 0.25 (the approximate share of Part B spending financed by beneficiary premium payments).
U.S. Department of the Treasury, Monthly Treasury Statement of Receipts and Outlays of the United States Government for Fiscal Year 2014 Through September 30, 2014, and Other Periods, http://www.fiscal.treasury.gov/fsreports/rpt/mthTreasStmt/mts0914.pdf.