How Much Fiscal Relief Can States Expect From the Temporary Increase in the Medicaid FMAP?
Issue Brief
The economic consequences of the coronavirus pandemic have led to historic levels of job loss in the United States and severe declines in state revenues. Medicaid is a countercyclical program, so during economic downturns more people lose income and will qualify for Medicaid at a time when it is difficult for states to support increased program spending. The Families First Coronavirus Response Act (FFCRA) provided a 6.2 percentage point increase in the federal share of Medicaid spending with requirements to maintain eligibility and provide continuous coverage for Medicaid enrollees. The FMAP increase included in the FFCRA was designed to provide broad fiscal relief to all states; however, the current level of aid may be small relative to state revenue losses and projected shortfalls, and the duration of the aid is not certain. It is likely that without an increase in federal support, states will need to make large budget cuts in many areas of the budget, including Medicaid, to meet balanced budget requirements. Without an extension in declaration of the public health emergency (PHE) set to expire at the end of July, the FMAP increase could end on September 30, 2020 (the end of federal fiscal year 2020 but partway through most state fiscal years), further deteriorating state finances.
This brief examines how much fiscal relief states can expect from the increase in the FMAP under FFCRA under different assumptions about the duration of the relief, how the FMAP increase provides broad fiscal relief to states and the factors that affect how much relief is available across states.
How much fiscal relief can states expect from the FMAP increase in FFCRA?
The Families First Coronavirus Response Act (FFCRA) included a temporary increase in the Medicaid FMAP from January 1, 2020 through duration of the emergency period. Federal fiscal relief provided through increases in the Medicaid FMAP—or the share of Medicaid costs paid by the federal government— during significant economic downturns has been successful in helping to support Medicaid and provide efficient and effective fiscal relief to states in the past. FFCRA uses this model as well. The 6.2 percentage point increase does not apply to the expansion group under the Affordable Care Act (ACA), for which the federal government already pays 90% of costs. To be eligible for the funds, states cannot implement more restrictive eligibility standards or higher premiums than those in place as of January 1, 2020, must provide continuous eligibility for enrollees through the end of the month of the emergency period, and cannot impose cost sharing for COVID-19 related testing and treatment services including vaccines, specialized equipment, or therapies. To access the enhanced funds, states submit claims for federal reimbursement for Medicaid expenditures. The purpose of the additional federal aid is not only to provide support to cover anticipated increases in enrollment, but also to provide broader fiscal relief for states.
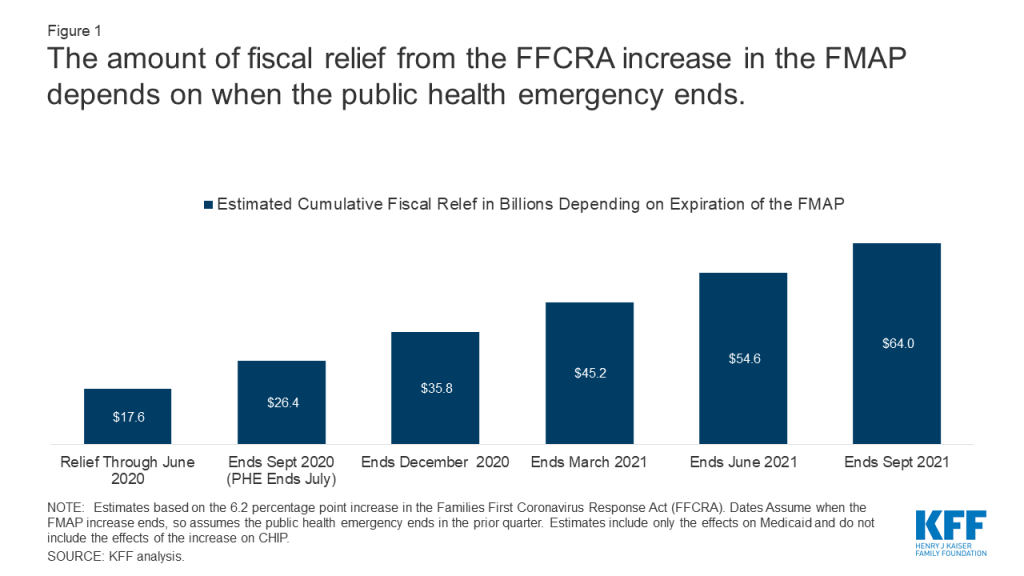
The amount of federal relief to states is uncertain at this time because the duration of the FMAP increase is tied to the public health emergency (PHE). The current 6.2 percentage point increase in the match rate will expire at the end of the quarter in which the PHE ends. The current PHE is issued by the Secretary of HHS for 90 day periods. The PHE was first issued on January 31 and then renewed on April 26; it is set to expire on July 24. While it is expected that the PHE will be renewed again, if it were to expire in July, the increase in the match rate would expire on September 30, 2020. Under this scenario, states would receive an estimated $26.4 billion in relief (including an estimated $17.6 billion that may have gone out to states through June 2020, corresponding with the end of the 2020 fiscal year in most states). The amount of fiscal relief to states would grow if the increase in the match rate under FFCRA were in place longer. States could receive a total of $54.6 if the relief is in place through June 2021 (the end of state fiscal year 2021 for most states) and $64 billion if in place through September (the end of the federal fiscal year 2021) (Figure 1, Appendix Table 1).
An increase in the FMAP could offset or reduce state spending but is unlikely to fully offset state revenue declines and address budget shortfalls. An increase in the federal match rate would allow states to reduce state spending for Medicaid at the same amount as the increase in federal spending. Such a reduction in state Medicaid spending would relieve other budget pressures stemming from reduced revenues and other state spending increases. However, federal fiscal relief through Medicaid will not fully address state budget shortfalls. Early estimates indicate that states are facing large shortfalls, with some estimates showing state budget shortfalls of $110 billion for SFY 2020 and $290 billion for SFY 2021. These shortfalls compare to an estimated $17.6B in federal fiscal relief in SFY2020 and $37.0B in SFY2021 (Exhibit 1) assuming the relief is in place through June 2021 and the increase in the FMAP at the current rate assuming the relief is in place through June 2021 (which is not certain). Other early reports from states similarly show state revenue declines of up to 15% in SFY 2020 and up to 20% for SFY 2021; compared to pre-pandemic state estimates of state revenue totaling $913B for SFY2020 and $944B in SFY2021, federal fiscal relief available through the FFCRA accounts for roughly 2% of state revenue in SFY2020 and 4% in SFY2021. Uncertainty about federal fiscal relief makes it difficult for states to budget and plan to meet balanced budget requirements. It is likely that the economic consequences of the pandemic will persist even beyond the public health crisis.
| Table 1: The Amount of Federal Fiscal Relief Funds to States under FFCRA FMAP Depends on When the PHE Ends | |||||
| PHE Ends | FMAP Increase Ends | Funds Received inSFY 2020(ended June 2020) | Funds Received in SFY2021(ends June 2021) | Funds Received in SFY2022(ends June 2022) | Total |
| July 2020 | September 2020 | $17.6B | $8.8B | $26.4B | |
| September 2020 | December 2020 | $17.6B | $18.2B | $35.8B | |
| December 2020 | March 2021 | $17.6B | $27.6B | $45.2B | |
| March 2021 | June 2021 | $17.6B | $37.0B | $54.6B | |
| June 2021 | September 2021 | $17.6B | $37.0B | $9.4B | $64.0B |
How does an FMAP increase provide state fiscal relief?
The FMAP increase included in the FFCRA was designed to provide broad fiscal relief to all states. Medicaid is a countercyclical program, so during economic downturns more people lose income and will qualify for Medicaid at a time when it is difficult for states to support increased program spending. Federal matching payments automatically increase as Medicaid spending grows, but state costs increase as well. The increase in federal support through a higher FMAP can help states maintain Medicaid coverage at a time when many people need it and can also help pay for costs for expected increases in enrollment. Because states make claims on federal Medicaid dollars throughout the year, and because Medicaid responds to economic conditions, increasing the FMAP provides relief funds to states using an existing mechanism and does not require development of new formulas to distribute grant funds, so funds can be distributed quickly. This can provide broad fiscal relief by freeing up funds for other purposes or filling gaps in overall state budget shortfalls.
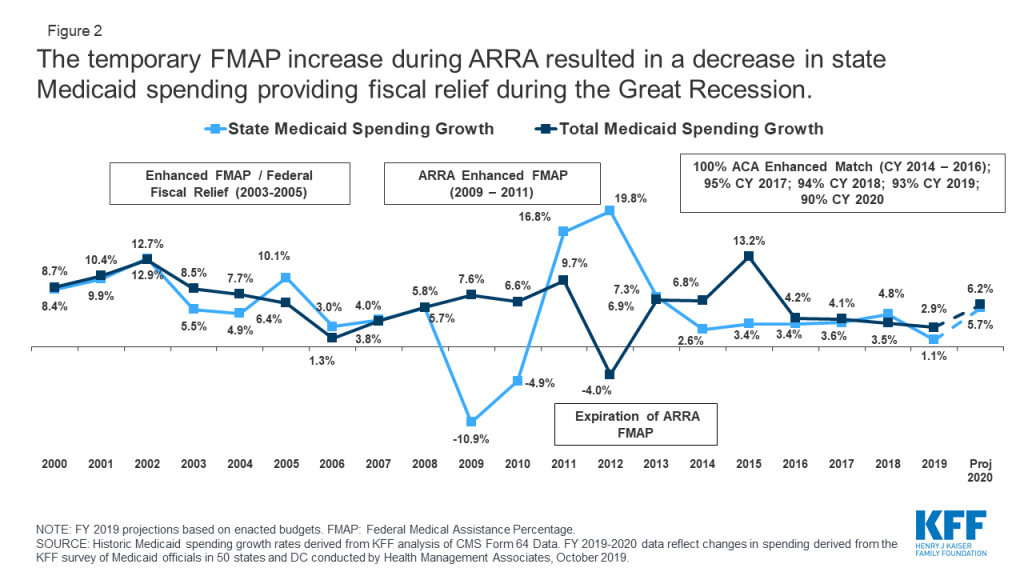
Temporary FMAP increases to provide fiscal relief to states during economic downturns prior to the COVID-19 crisis allowed states to maintain Medicaid and address budget shortfalls. The enhanced match rate included in the American Recovery and Reinvestment Act (ARRA) provided states over $100 billion in additional federal funds during the Great Recession when the unemployment rate peaked at 10 percent in October 2009. As a result of this federal support, state spending for Medicaid declined by more than 10 percent in state fiscal year 2009, even with eligibility protections and increased enrollment (Figure 2). States reported that the relief was used to close Medicaid or other general fund budget shortfalls, support enrollment growth, and to mitigate or avoid provider and benefit restrictions.
What are other factors that affect the amount of fiscal relief available to states?
Expected increases in enrollment could offset a large share of the fiscal relief. States anticipate increased Medicaid enrollment due to the economic downturn, though it is unclear when enrollment will occur and what share of people will take up coverage. A survey of states found that nearly all states that had developed projections anticipate higher enrollment growth into FY 2021 as a result of the pandemic, and review of Medicaid managed care enrollment has shown early enrollment increases in many states, though enrollment is likely to grow over time. An earlier KFF analysis estimated potential loss of employer-based insurance (ESI) due to job losses from March 1 through May 2 and eligibility for ACA coverage among people losing ESI. It estimated by January 2021, when unemployment insurance (UI) benefits cease for most people, nearly 17 million people would be eligible for Medicaid, assuming those who are recently unemployed have not found work. The estimates do not account for participation rates among those newly eligible, those who may have lost jobs after May, individuals who do not lose job based coverage (i.e. those who may have had marketplace coverage) but experience income loss and become eligible for Medicaid, or the effect of the maintenance of eligibility (MOE) provisions that are in effect as a condition for states to receive the enhanced FMAP. The federal share for those newly eligible in the expansion group would be 90% (same as current law) while those newly eligible and enrolled in other categories would receive the regular lower match rate plus 6.2 percentage points, assuming the FMAP increase is still in place.
States have limited choices to cut Medicaid. As noted, to receive the increase in the FMAP under FFCRA, states cannot restrict eligibility and must provide continuous coverage for current enrollees. In prior economic downturns, states have turned to reductions in provider rates as well as cuts in some optional benefits. Often, these rates and benefits may be restored when economic conditions improve. States also frequently turn to greater reliance on provider taxes to help raise the state share of Medicaid during economic downturns. However, given that many providers, particularly those serving Medicaid enrollees, may be under fiscal strain from the pandemic, provider rate cuts may be harder to implement.
To save state dollars, states need to make larger program cuts to Medicaid. Because Medicaid is funded from a combination of federal and state funds, states need to make substantial cuts to Medicaid to generate state savings. For example, for a state with a 50 percent match rate, a $100 cut to Medicaid will reduce state spending by $50 and federal spending by $50. However, for the ACA expansion population, a $100 reduction will yield only $10 in state savings and reduce federal spending by $90 (as the federal match rate is set at 90 percent for newly eligible expansion adults).
The needs may vary across states. The pandemic may have different effects on economies and Medicaid enrollment across states. The current structure of the relief is broad and uniform across states and not tied to changes in unemployment or other economic conditions.
Looking Ahead
Without any additional changes in federal law, the amount of the fiscal relief from the FMAP increase without regard to enrollment changes will depend on the duration of the public health emergency. If the public health emergency is not renewed beyond the end of July, the FMAP increase will expire at the end of September, or the end of FY 2020. A July 10 letter from state groups again urged Congress to consider extending and increasing the FMAP increase (to 12 percentage points through September 2021) given overall state budget issues and increased demands for Medicaid. The House passed Health and Economic Recovery Omnibus Emergency Solutions Act (HEROES) included an additional increase in the FMAP of 14 percentage points from July 1, 2020 through June 30, 2021, but that proposal has not yet been considered in the Senate. Congress may consider a further increase in the FMAP during debate on additional legislation to address the pandemic, as well as options to target the fiscal relief to states experiencing the greatest need in terms of enrollment increases or increases in the unemployment rate.
Methods
We estimated baseline spending for FFY 2020 and 2021 using Medicaid enrollment and spending data from the 2014 Medicaid Statistical Information System (MSIS), the 2018 Medicaid Budget Expenditure System (MBES), the Congressional Budget Office (CBO), and the CMS Office of the Actuary (OACT).
FY 2020 and FY 2021 Baseline Spending: We used 2018 MBES enrollment for total enrollment and enrollment in the expansion group; we then distributed non-expansion enrollment groups (children, disabled, aged, and non-expansion adults) based on the proportion of enrollees in each group using 2014 MSIS. We inflated enrollment to FFY 2020 and FFY 2021 using annual enrollment growth by eligibility group from the 2018 Actuarial Report on the Financial Outlook for Medicaid by OACT. We did not use CBO growth rates for enrollment as their projects are rounded to millions and do not provide precise growth rates. For spending, we used total spending and spending for the expansion population based on 2018 MBES data and distributed spending for non-expansion edibility groups based on the distribution of spending by eligibility group in the 2014 MSIS. Then, we calculated spending per enrollee by dividing the total spending for each enrollment group by the total number of enrollees in each group. We inflated the spending per enrollee to FFY 2020 and 2021 using an average of the projected annual growth rates for each eligibility group as reported in the 2018 Actuarial Report by OACT and the March 2020 baseline estimates from the CBO. We averaged spending per enrollee growth from the CBO and OACT because the two estimates had substantial differences in annual growth rates for some enrollment groups, especially for 2018-2019 and 2019-2020. Finally, we multiplied enrollment and per enrollee spending estimates for each enrollment group to calculate a total spending baseline in FFY 2020 and 2021.
Special Adjustments: Special adjustments using state data were made for states that expanded after the FFY 2018 period including Idaho, Maine, Utah, and Virginia. Due to anomalies in New York’s 2017 and 2018 MBES data, we used total spending for New York from the CMS Form-64 for FY 2018 and estimated expansion spending based on estimates included in the National Association of State Budget Officers’ 2019 State Expenditure Report. We distributed other spending using the same methodology used for other states noted above.
FMAP Change: We assumed total spending remained constant and that increases in the FMAP from FFCRA increased federal spending and reduced state spending by the same amount. This resulted in different percentage changes in federal and state spending from the baseline.
Appendix
| Appendix Table 1: Estimated Cumulative Fiscal Relief from a 6.2 Percentage Point Increase in FMAP,Depending on Expiration of FMAP Increase (In Millions) | ||||||
| State | Relief Through June 2020 | EndsSept. 2020 | EndsDec. 2020 | EndsMarch 2021 | EndsJune 2021 | EndsSept. 2021 |
| United States | 17,617 | 26,426 | 35,811 | 45,197 | 54,582 | 63,967 |
| Alabama | 193 | 290 | 393 | 497 | 600 | 703 |
| Alaska | 58 | 87 | 117 | 148 | 179 | 210 |
| Arizona | 308 | 461 | 625 | 789 | 953 | 1,117 |
| Arkansas | 158 | 236 | 320 | 404 | 488 | 572 |
| California | 2,477 | 3,715 | 5,034 | 6,354 | 7,673 | 8,992 |
| Colorado | 263 | 394 | 534 | 673 | 813 | 953 |
| Connecticut | 226 | 339 | 459 | 580 | 700 | 821 |
| Delaware | 60 | 90 | 123 | 155 | 187 | 219 |
| District of Columbia | 81 | 121 | 164 | 207 | 250 | 293 |
| Florida | 807 | 1,211 | 1,641 | 2,072 | 2,502 | 2,932 |
| Georgia | 371 | 556 | 754 | 952 | 1,150 | 1,347 |
| Hawaii | 56 | 84 | 114 | 144 | 174 | 204 |
| Idaho | 68 | 103 | 139 | 176 | 212 | 249 |
| Illinois | 582 | 874 | 1,184 | 1,494 | 1,805 | 2,115 |
| Indiana | 321 | 481 | 652 | 822 | 993 | 1,164 |
| Iowa | 136 | 205 | 277 | 350 | 422 | 495 |
| Kansas | 120 | 180 | 244 | 308 | 372 | 436 |
| Kentucky | 245 | 368 | 499 | 630 | 760 | 891 |
| Louisiana | 274 | 411 | 557 | 703 | 849 | 995 |
| Maine | 96 | 143 | 194 | 245 | 296 | 347 |
| Maryland | 305 | 457 | 619 | 781 | 944 | 1,106 |
| Massachusetts | 528 | 792 | 1,074 | 1,355 | 1,636 | 1,917 |
| Michigan | 432 | 649 | 879 | 1,109 | 1,339 | 1,569 |
| Minnesota | 382 | 573 | 776 | 980 | 1,183 | 1,386 |
| Mississippi | 183 | 274 | 372 | 469 | 567 | 664 |
| Missouri | 360 | 540 | 732 | 924 | 1,116 | 1,307 |
| Montana | 40 | 60 | 81 | 102 | 123 | 145 |
| Nebraska | 73 | 109 | 148 | 187 | 226 | 265 |
| Nevada | 93 | 140 | 190 | 239 | 289 | 339 |
| New Hampshire | 59 | 89 | 121 | 152 | 184 | 216 |
| New Jersey | 413 | 619 | 839 | 1,058 | 1,278 | 1,498 |
| New Mexico | 127 | 191 | 259 | 327 | 395 | 462 |
| New York | 2,070 | 3,106 | 4,209 | 5,313 | 6,417 | 7,520 |
| North Carolina | 455 | 683 | 925 | 1,168 | 1,410 | 1,653 |
| North Dakota | 33 | 50 | 68 | 86 | 103 | 121 |
| Ohio | 624 | 936 | 1,268 | 1,600 | 1,933 | 2,265 |
| Oklahoma | 168 | 252 | 342 | 432 | 522 | 611 |
| Oregon | 228 | 342 | 463 | 585 | 706 | 828 |
| Pennsylvania | 857 | 1,286 | 1,742 | 2,198 | 2,655 | 3,111 |
| Rhode Island | 74 | 111 | 151 | 191 | 230 | 270 |
| South Carolina | 216 | 324 | 439 | 554 | 668 | 783 |
| South Dakota | 31 | 46 | 63 | 79 | 96 | 112 |
| Tennessee | 341 | 512 | 694 | 876 | 1,058 | 1,239 |
| Texas | 1,325 | 1,988 | 2,694 | 3,401 | 4,107 | 4,814 |
| Utah | 86 | 129 | 174 | 220 | 266 | 311 |
| Vermont | 48 | 71 | 97 | 122 | 148 | 173 |
| Virginia | 321 | 481 | 652 | 822 | 993 | 1,164 |
| Washington | 311 | 466 | 632 | 798 | 963 | 1,129 |
| West Virginia | 96 | 144 | 196 | 247 | 298 | 349 |
| Wisconsin | 416 | 624 | 845 | 1,067 | 1,288 | 1,510 |
| Wyoming | 21 | 31 | 42 | 53 | 65 | 76 |
| NOTES: State estimates may not sum to national total due to rounding. Estimates based on the 6.2 percentage point increase in the Families First Coronavirus Response Act. Dates assume when the FMAP increase ends, so assumes the public emergency ends in the prior quarter. Estimates include only the effects on Medicaid and do not include the effect of the increase on CHIP.SOURCE: KFF Analysis. | ||||||