How Many Seniors Are Living in Poverty? National and State Estimates Under the Official and Supplemental Poverty Measures in 2016
Introduction
The Census Bureau’s official poverty measure was created in the early 1960s and is used to provide official statistics of the share of Americans living in poverty. To calculate the share of people in poverty, the Census Bureau compares pre-tax monetary income (such as income from a job and Social Security benefits) to the official poverty threshold. Under the official measure, the poverty thresholds are set at three times the subsistence food budget from 1963, adjusted annually for inflation, and vary based on the size of a family and the age of its members, with lower thresholds for families with members age 65 or older. In 2016, the poverty threshold was $12,486 for an individual under age 65, and $11,511 for an individual age 65 or older, and the official poverty rate for older adults was 9.3 percent.
In response to concerns that the official poverty measure is outdated and does not accurately reflect people’s financial resources or liabilities, the Census Bureau has developed an alternative measure of poverty, known as the Supplemental Poverty Measure (SPM). The SPM differs from the official measure in several ways, thereby producing different estimates of poverty (see Appendix for details). Two primary differences are how poverty thresholds are measured and how financial resources are measured:
- Measuring poverty thresholds. The SPM bases poverty thresholds on patterns of expenditures on basic necessities that are more recent than 1963, and adjusts thresholds to reflect homeownership status and regional differences in housing prices. The SPM thresholds vary by household size, but not by age.
- Measuring resources. In addition to monetary income, the SPM incorporates certain information about a household’s financial resources and liabilities. Resources include the monetary value of tax credits and in-kind government benefits received for food, clothing, shelter, and utilities (e.g., food stamps). Liabilities include job-related expenses, taxes paid, and out-of-pocket expenses on health care, including premiums.
The deduction of out-of-pocket medical expenses from income is especially important for people ages 65 and older, who spend a larger share of their household budgets on health care costs than younger households do. Below we present our estimates of the share of older adults living below poverty and below 200 percent of poverty in 2016, comparing the SPM and official poverty measure, both nationally and at the state level. We present estimates for poverty among older adults overall and by age, gender, race/ethnicity, and self-reported health status.
Findings
National Estimates of Poverty among People Ages 65 and Older
The 2016 poverty rate among people ages 65 and older was higher under the SPM than the official measure at the national level, both overall and among certain subgroups. The difference in poverty rates among older adults between the two measures is largely due to the fact that the SPM deducts out-of-pocket medical expenses from income, while the official measure does not.
- 100% of poverty: In 2016, 7.1 million people ages 65 and older (14.5%) had incomes below the SPM poverty thresholds, compared to 4.6 million (9.3%) based on the official measure. The higher poverty rate for people ages 65 and older under the SPM translated to an additional 2.6 million older adults living in poverty in 2016.The difference between the two poverty measures is smaller among nonelderly adults (13.3% versus 11.6% for those ages 18 to 64), and the rate of poverty among children (under age 18) is actually lower under the SPM than under the official measure (15.2% versus 18.0%), in part due to the inclusion of refundable tax credits and food stamps under the SPM—although the poverty rate is higher among children than older adults under both poverty measures.
- 200% of poverty: Nearly 21 million people ages 65 and older (42.4%) had incomes below 200 percent of the SPM poverty thresholds in 2016, compared to 15.0 million (30.4%) under 200 percent of the official poverty threshold (Figure 2). Under the SPM, an additional 5.9 million older adults lived below 200 percent of poverty in 2016 than under the official measure.
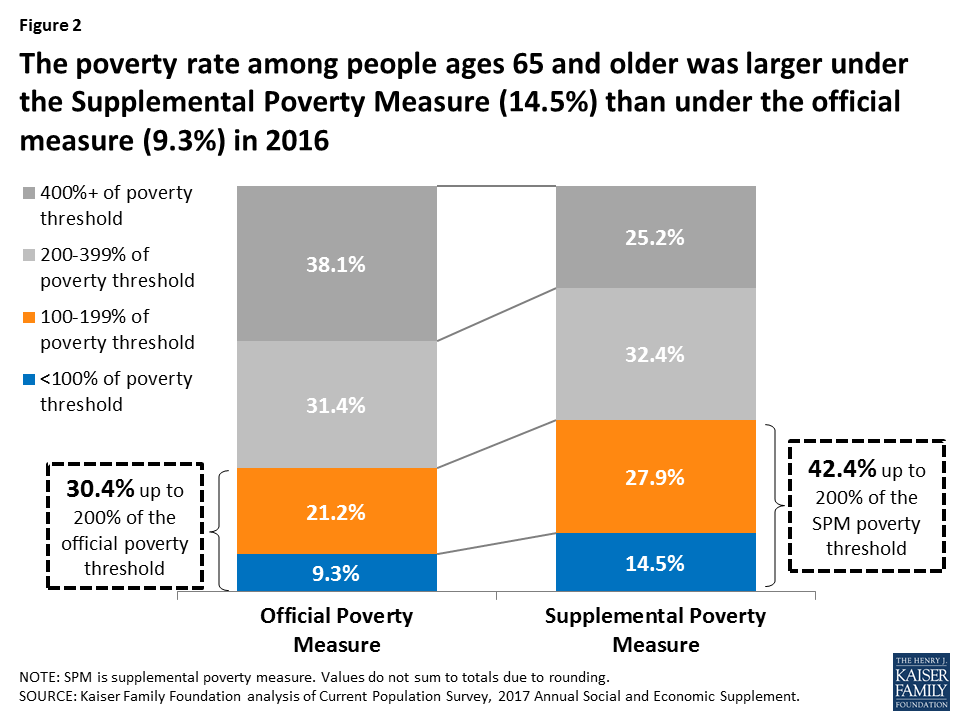
Figure 2: The poverty rate among people ages 65 and older was larger under the Supplemental Poverty Measure (14.5%) than under the official measure (9.3%) in 2016
Poverty among People Ages 65 and Older, by Selected Characteristics
Under both the official measure and the SPM, the poverty rate among people ages 65 and older in 2016 increased with age and was higher for women, blacks and Hispanics, and people in relatively poor health. The rate of poverty and the number of people living in poverty were higher for all demographic subgroups under the SPM than under the official poverty measure (Tables 1 and 2).
Age
- 100% of poverty: The official poverty rate in 2016 among people ages 80 and older was 11.3 percent, compared to 8.6 percent among those ages 65 to 69 (Figure 3). Under the SPM, however, 18.9 percent of people ages 80 and older lived in poverty in 2016, compared to 12.3 percent of those ages 65 to 69.
- Under the SPM, 2.2 million people ages 80 and older lived in poverty in 2016, almost double the number under the official measure (1.3 million).
- 200% of poverty: Under the official poverty measure, roughly 4 in 10 people ages 80 and older had incomes below 200 percent of poverty in 2016, compared to one quarter of people ages 65 to 69. Under the SPM, however, more than half of those ages 80 and older had incomes below 200 percent of the SPM poverty thresholds in 2016, compared to around one-third of those ages 65 to 69.
- Under the SPM, 6.1 million people ages 80 and older had incomes below 200 percent of poverty in 2016, 1.5 million more than under the official measure.
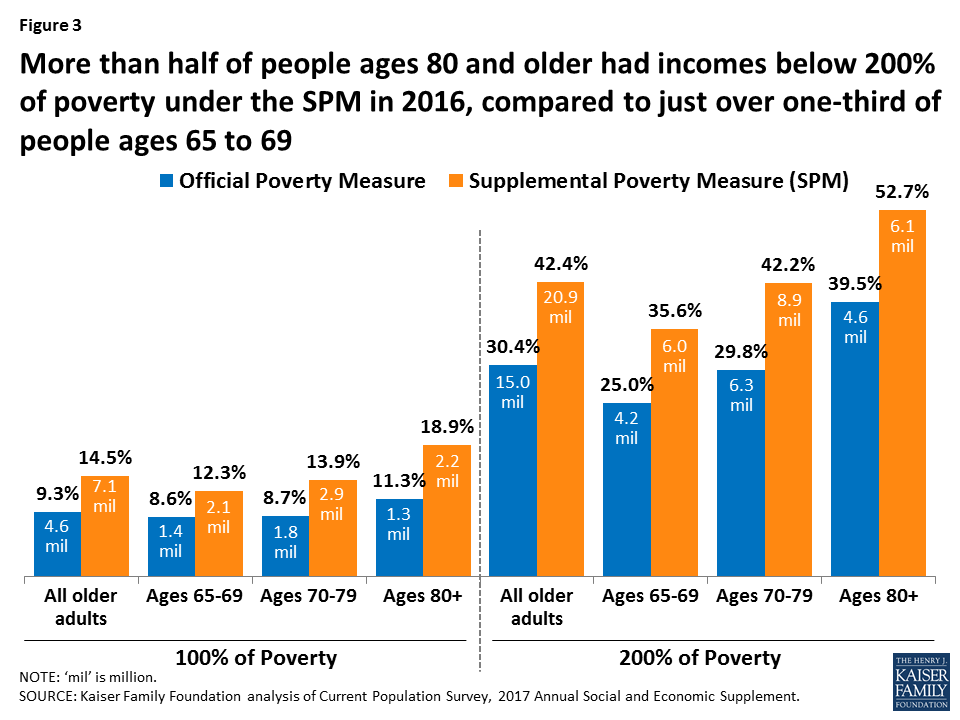
Figure 3: More than half of people ages 80 and older had incomes below 200% of poverty under the SPM in 2016, compared to just over one-third of people ages 65 to 69
Gender
- 100% of poverty: In 2016, the official poverty rate among women ages 65 and older was 10.6 percent, which was higher than the poverty rate of 7.6 percent among older men. Under the SPM, however, 16.2 percent of older women lived in poverty in 2016, compared to 12.5 percent of older men (Figure 4).
- Under the SPM, 4.4 million older women lived in poverty in 2016, 1.5 million more than under the official measure; 2.8 million older men lived in poverty under the SPM, 1.1 million more than under the official measure.
- The gender difference in poverty rates among older adults is larger among people ages 80 and older: for example, under the SPM, 21.1 percent of women ages 80 and older lived in poverty in 2016, compared to 15.6 percent of men ages 80 and older (1.5 million women ages 80 and older vs. 0.7 million men ages 80 and older) (Table 1).
- 200% of poverty: Under the official poverty measure, one-third of women ages 65 and older lived below 200 percent of poverty in 2016, compared to one-quarter of older men. But under the SPM, close to half of all women ages 65 and older lived below 200 percent of the SPM poverty thresholds, compared to 37.5 percent of older men.
- Under the SPM, 12.6 million older women had incomes below 200 percent of poverty in 2016, 3.3 million more than under the official measure; 8.3 million older men had incomes below 200 percent of poverty under the SPM, 2.5 million more than under the official measure.
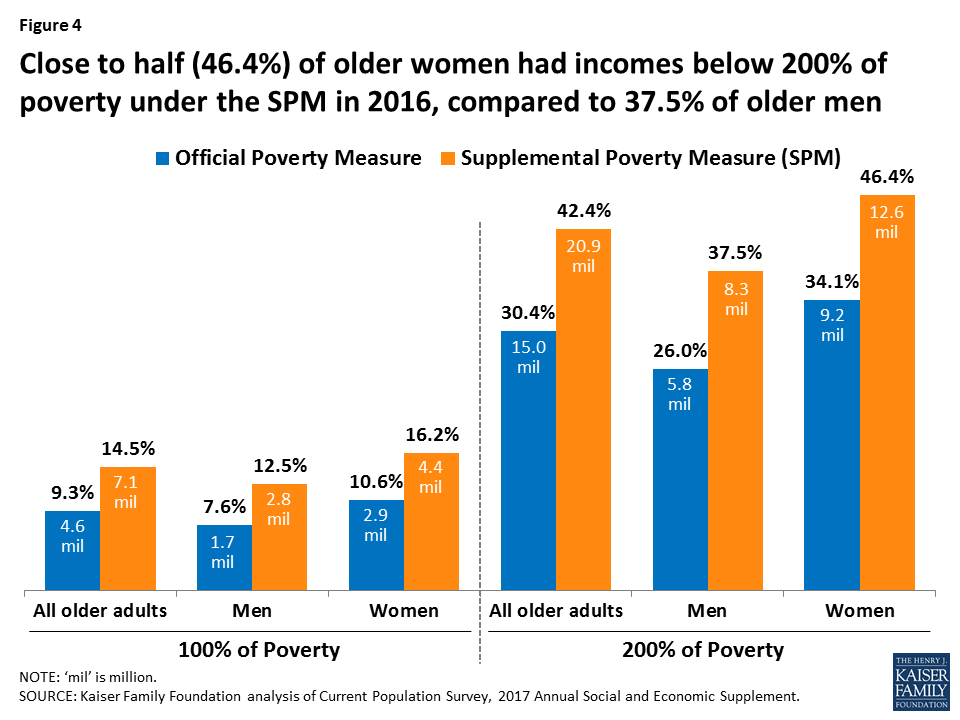
Figure 4: Close to half (46.4%) of older women had incomes below 200% of poverty under the SPM in 2016, compared to 37.5% of older men
Race/Ethnicity
- 100% of poverty: Under the official measure, the 2016 poverty rate was more than twice as large among Hispanic and black adults ages 65 and older than among older white adults (17.4%, 18.8%, and 7.1%, respectively) (Figure 5). Under the SPM, however, more than a quarter of Hispanic older adults and nearly a quarter of black older adults lived in poverty in 2016, compared to around 1 in 10 white adults ages 65 and older.
- Higher poverty rates under the SPM than the official measured translated to an additional 0.4 million Hispanic older adults living in poverty in 2016, along with 0.2 million more black older adults and 1.8 million more white older adults.
- 200% of poverty: Under the official poverty measure, close to half of black and Hispanic seniors had incomes below 200 percent of poverty in 2016, compared to just over one quarter of white seniors. In contrast, under the SPM, roughly 6 in 10 black and Hispanic seniors had incomes below 200 percent of poverty, compared to around one-third of white older adults.
- Higher poverty rates under the SPM than under the official measure translated to an additional 0.6 million black older adults, 0.7 million Hispanic older adults, and 4.1 million white older adults with incomes below 200 percent of poverty in 2016.
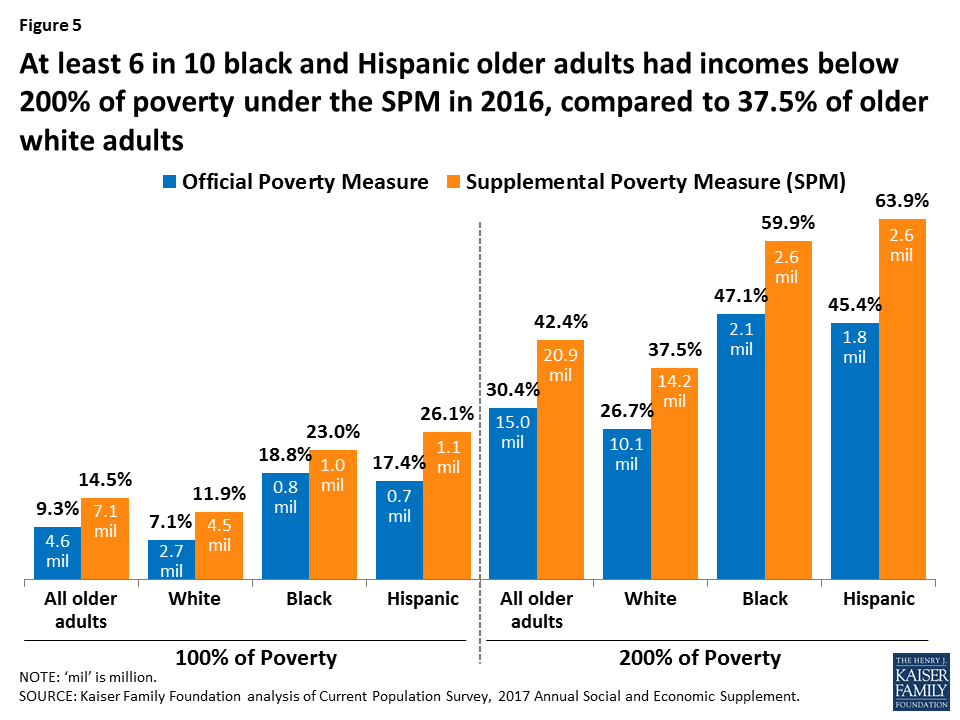
Figure 5: At least 6 in 10 black and Hispanic older adults had incomes below 200% of poverty under the SPM in 2016, compared to 37.5% of older white adults
Health Status
- 100% of poverty: Under the official measure, the 2016 poverty rate was 14.8 percent among older adults in relatively poor health, nearly three times larger than the poverty rate of 5.6 percent among those in excellent or very good health (Figure 6). Under the SPM, however, more than one in five older adults who rated their health as fair or poor lived in poverty in 2016, compared to roughly one in ten older adults who rated their health as excellent or very good.
- Under the SPM, 2.9 million older adults in fair or poor health lived in poverty in 2016, 0.9 million more than under the official measure.
- 200% of poverty: Under the official poverty measure, more than 4 in 10 seniors who rated their health as fair or poor had income below 200 percent of poverty in 2016, compared to 2 in 10 seniors in excellent or very good health. In contrast, under the SPM, nearly 6 in 10 seniors who rated their health as fair or poor fell below 200 percent of the SPM thresholds in 2016, compared to 3 in 10 seniors in excellent or very good health.
- Under the SPM, 7.7 million older adults in fair or poor health had incomes below 200 percent of poverty in 2016, 1.8 million more than under the official poverty measure.
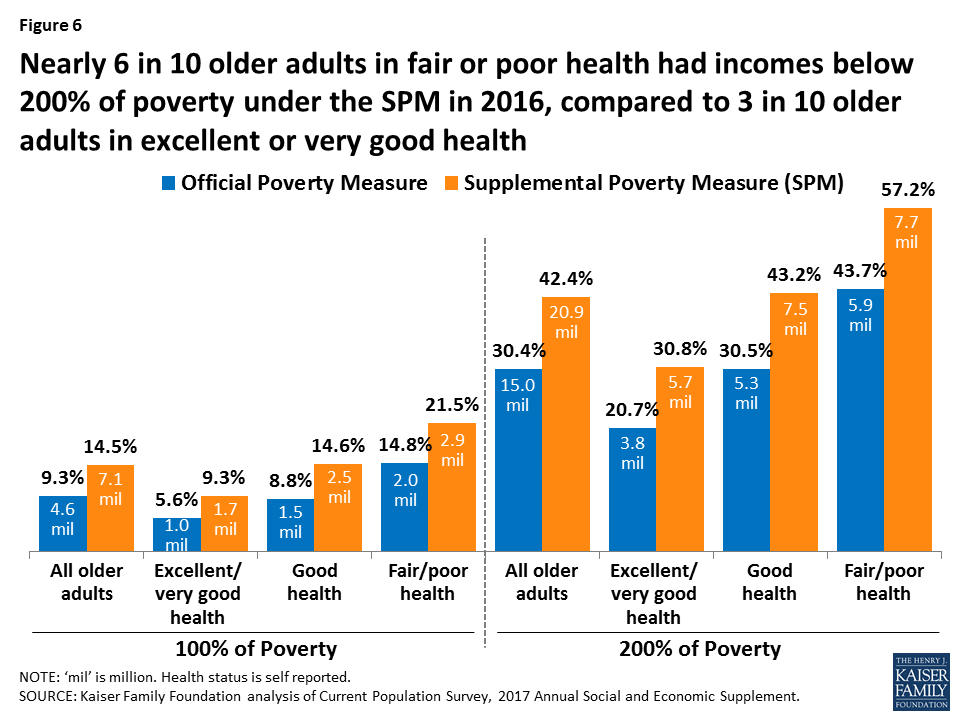
Figure 6: Nearly 6 in 10 older adults in fair or poor health had incomes below 200% of poverty under the SPM in 2016, compared to 3 in 10 older adults in excellent or very good health
Poverty Among People Ages 65 and Older, by State
The share of people ages 65 and older with income below poverty and below 200 percent of poverty was higher in many states under the SPM than under the official measure in 2016, and was especially high in some states. The difference in poverty rates under the official measure compared to the SPM may vary geographically for several reasons, including state income distributions; differences in housing prices, which are factored into the SPM poverty thresholds; variations in medical use and costs, since such costs are deducted from income under the SPM but not the official measure; and differences in the generosity of state Medicaid programs, which affects out-of-pocket medical expenses.
- 100% of poverty: Under the official poverty measure, the share of people ages 65 and older living in poverty was less than 10 percent in a majority (36) of states in 2016. In contrast, under the SPM, at least 10 percent of older adults lived in poverty in Washington, D.C. and all but 9 states (Alaska, Arkansas, Iowa, Minnesota, New Hampshire, South Carolina, Vermont, Washington, and Wisconsin) (Table 3).
- The official poverty rate for older adults in 2016 was above 15 percent in Washington, D.C. only, whereas under the SPM, at least 15 percent of older adults lived in poverty in Washington, D.C. and 10 states (California, Florida, Georgia, Hawaii, Indiana, Louisiana, New Jersey, New Mexico, Texas, and Virginia,). Under the SPM, nearly 3 in 10 older adults in Washington, D.C. and one in five older adults in California and New Jersey lived in poverty in 2016.
- The poverty rate among older adults was roughly twice as large under the SPM than under the official measure in 7 states: California, Colorado, Florida, Hawaii, Maryland, Michigan, and New Jersey.
- 200% of poverty: Under the official poverty measure, less than 31 percent of older adults lived below 200 percent of poverty in most states (30) in 2016. In contrast, under the SPM, at least 31 percent of older adults had incomes below 200 percent of poverty in every state except Iowa (Table 4; Figure 7).
- Under the official poverty measure, no state had more than 45 percent of people ages 65 and older living below 200 percent of poverty in 2016, whereas under the SPM, at least 45 percent or more of older adults lived below 200 percent of poverty in Washington, D.C. and 11 states: Alabama, California, Florida, Georgia, Hawaii, Kentucky, Louisiana, Mississippi, New Jersey, New York, and Texas.
- In Washington D.C. and 8 states (California, Delaware, Hawaii, Maryland, Massachusetts, New Hampshire, New York, Nevada), the share of older adults below 200 percent of poverty was at least 15 percentage points higher under the SPM than under the official measure.
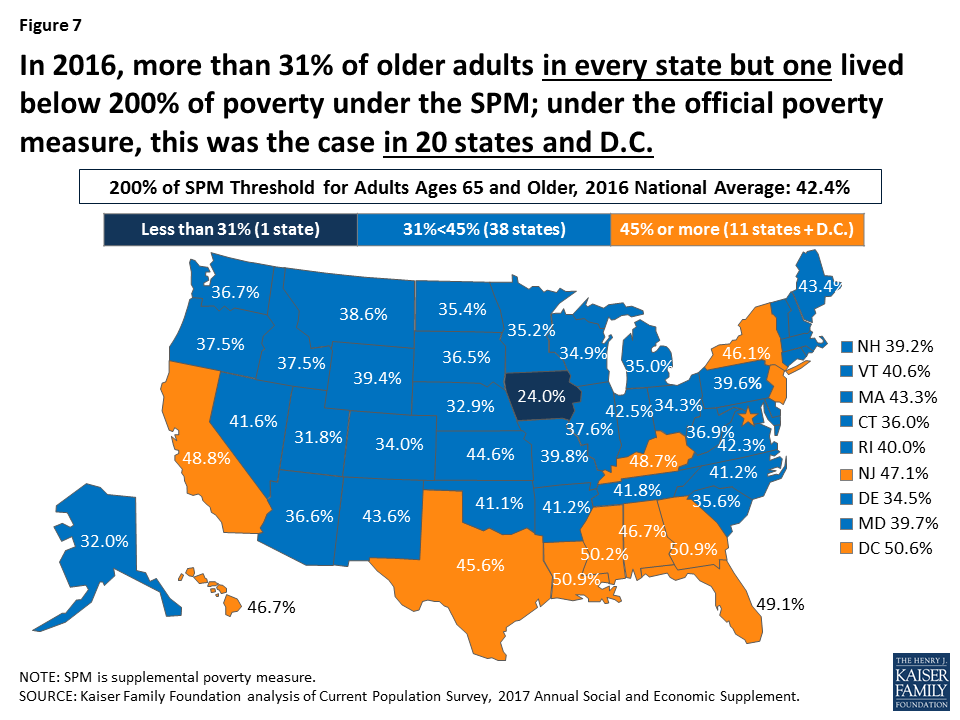
Figure 7: In 2016, more than 31% of older adults in every state but one lived below 200% of poverty under the SPM; under the official poverty measure, this was the case in 20 states and D.C.
Discussion
This analysis shows a substantially higher percent and number of older adults living in poverty under the Supplemental Poverty Measure than under the official poverty measure, primarily because the alternative measure takes into account liabilities, primarily medical expenses, that are higher for older adults. Under the SPM, the poverty rate among people ages 65 and older in 2016 was 5 percentage points higher than under the official measure (14.5% vs. 9.3%, or 7.1 million vs. 4.6 million older adults). This difference translates to an additional 2.6 million people ages 65 and over living in poverty in 2016 under the SPM compared to the official measure. Under both measures, the poverty rate among adults ages 65 and older was higher among women, black and Hispanic adults, and people in relatively poor health. At the state level, the share of seniors living below poverty was larger in many states under the SPM than under the official measure, and roughly twice as large in some states.
In light of the differences between the official measure of poverty and the SPM, there is ongoing interest in assessing these methods for measuring poverty and the implications of each measure for public programs designed to serve low-income populations. Our analysis provides context for evaluating the implications of proposals that would affect the financial resources of people ages 65 and older, including policies that affect Social Security and other sources of income, and policies that affect seniors’ out-of-pocket health care spending. Higher premiums and cost-sharing requirements under Medicare could lead to higher a poverty rate among people ages 65 and older as measured by the SPM, though the official poverty rate would be unaffected by these changes. This is because the SPM deducts out-of-pocket medical expenses from income. Although Medicaid covers Medicare cost-sharing requirements for some low-income people on Medicare, many low-income beneficiaries do not receive Medicaid coverage. Proposed reductions in Social Security benefits, such as imposing a slower rate of growth on benefits, could also lead to higher poverty rates among adults ages 65 and older under both the official measure and the SPM over time. Yet regardless of how such changes would affect estimates of poverty among older adults, our analysis of current estimates of poverty based on the SPM suggests that a substantially larger number and share of older adults are already struggling financially than is conveyed by the official poverty measure.
Juliette Cubanski, Kendal Orgera and Tricia Neuman are with the Kaiser Family Foundation.
Anthony Damico is an independent consultant.
This work was funded in part by the Retirement Research Foundation.