Do People Who Sign Up for Medicare Advantage Plans Have Lower Medicare Spending?
Key Findings
People on Medicare can choose coverage from either traditional Medicare or Medicare Advantage plans, typically trading off broad access to providers for potentially lower premiums and out-of-pocket costs. Beneficiaries who choose Medicare Advantage may differ from those in traditional Medicare in both measurable and unmeasurable ways, which may influence their use of services and spending. Yet, Medicare payments to Medicare Advantage plans per enrollee are based on average spending among beneficiaries in traditional Medicare.
This analysis looks at whether beneficiaries who choose to enroll in Medicare Advantage plans have lower spending, on average – before they enroll in Medicare Advantage plans – than similar people who remain in traditional Medicare. We compare average traditional Medicare spending and use of services in 2015 among beneficiaries who switched to Medicare Advantage plans in 2016 with those who remained in traditional Medicare that year, after adjusting for health risk. We adjust Medicare spending values for health conditions and other factors, with a model similar to the CMS HCC Risk Adjustment Model that is used to adjust payments to Medicare Advantage plans (see Methods).
Key Findings
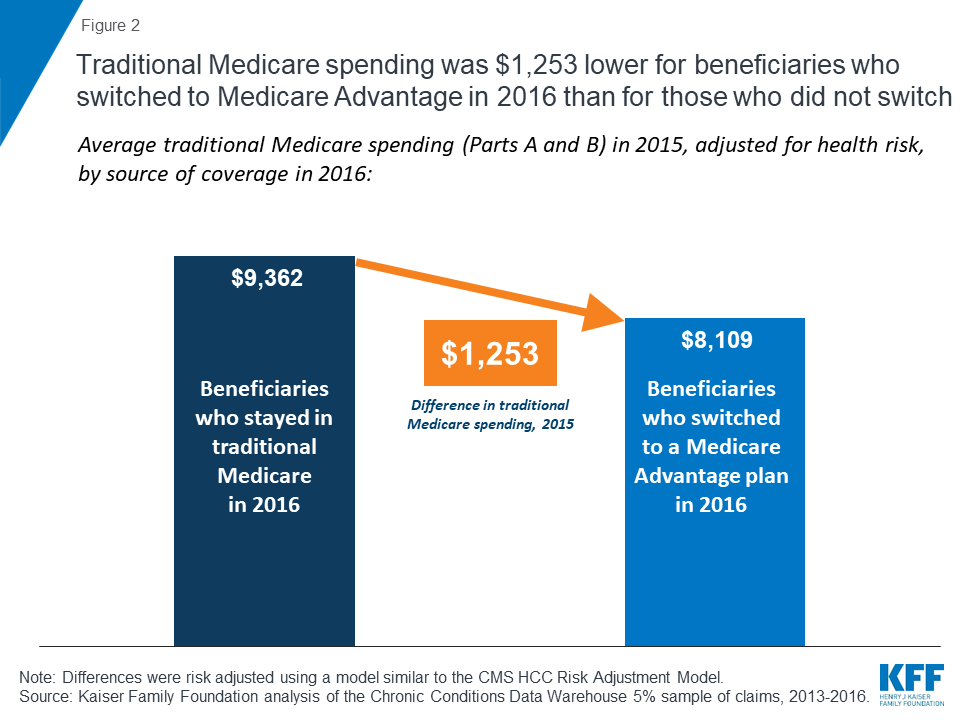
- People who switched from traditional Medicare to Medicare Advantage in 2016 spent $1,253 less in 2015, on average, than beneficiaries who remained in traditional Medicare, after adjusting for health risk (ES Figure).

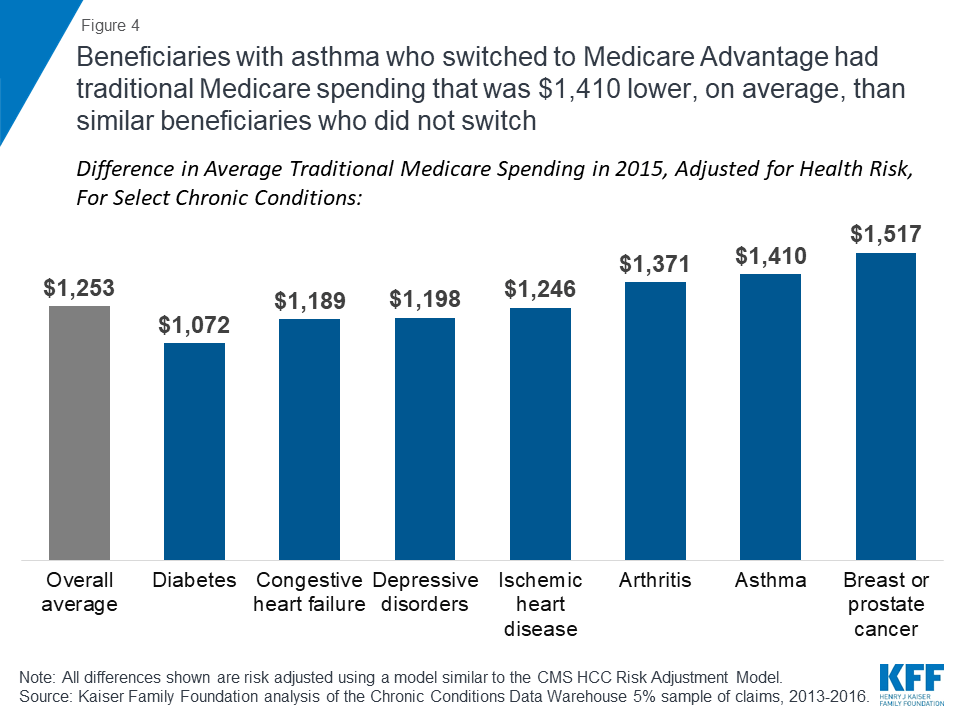
- Even among traditional Medicare beneficiaries with specific health conditions, those who shifted to Medicare Advantage in 2016 had lower average spending in 2015, including people with diabetes ($1,072), asthma ($1,410), and breast or prostate cancer ($1,517).
Even after risk adjustment, the results indicate that beneficiaries who choose Medicare Advantage have lower Medicare spending – before they enroll in Medicare Advantage plans – than similar beneficiaries who remain in traditional Medicare, suggesting that basing payments to plans on the spending of those in traditional Medicare may systematically overestimate expected costs of Medicare Advantage enrollees.
Issue Brief
Overview
Medicare payments to Medicare HMOs and PPOs, known as Medicare Advantage plans, have always been based on Medicare spending by similar people in traditional Medicare, partly because Medicare has never had accurate, complete data on the use of services or health care spending for beneficiaries in Medicare Advantage plans.1 The assumption has been that adjusting payments to plans for health status and other factors accounts for differences between beneficiaries in traditional Medicare and those in Medicare Advantage plans. Profits are assumed to be due to plans reducing spending by either managing fees (e.g., by having lower-cost hospitals in their network) or changing patterns of care (e.g., reducing hospital readmissions), rather than to favorable selection. Nonetheless, selection bias has been an ongoing concern and the subject of many studies over the years, with mixed evidence of favorable selection.2 ,3 ,4 ,5 ,6 This question is important because it affects the accuracy of Medicare payments to plans on behalf of 20 million Medicare beneficiaries, and rising.
This is the first known analysis to examine whether beneficiaries who choose to enroll in Medicare Advantage plans have lower spending and use fewer services – before enrolling in Medicare Advantage – than similar people in traditional Medicare. If Medicare Advantage enrollees use fewer services and have lower Medicare spending before they enroll in Medicare Advantage plans, compared to similar beneficiaries in traditional Medicare, then basing payments to Medicare Advantage plans on the Medicare spending for similar beneficiaries in traditional Medicare would overestimate the expected costs of Medicare Advantage enrollees and overpay plans by billions of dollars over the next decade. Studies that have looked at differences in the use of services and Medicare spending for Medicare Advantage enrollees compared to beneficiaries in traditional Medicare that did not account for actual prior differences may have overestimated the extent to which plans are reducing enrollees’ spending or use of services.
To address this question, we examine Medicare Part A and B spending and service use for traditional Medicare beneficiaries in 2015. We compare average Medicare spending and use of services for traditional Medicare beneficiaries who enrolled in Medicare Advantage plans versus those who remained in traditional Medicare in 2016, after adjusting spending values for health conditions and other relevant factors (Figure 1). We examine how the results differ across demographics, chronic conditions, and counties, and also examine how the results change when Part D spending is included. The analysis is based on a five percent sample of Medicare claims data and excludes beneficiaries who may not have been active choosers in 2016; more details about the analysis are included in the Methods.

Differences in Medicare Spending
Among beneficiaries in traditional Medicare in 2015, those who enrolled in Medicare Advantage in 2016 had spending (for Part A and Part B) that was $1,253 lower (13% difference), on average, than beneficiaries who remained in traditional Medicare in 2016, after adjusting for health risk factors (Figure 2; Tables 1 and 2).7
When Part D spending is included, the results changed only slightly. Traditional Medicare beneficiaries in 2015 who switched to Medicare Advantage in 2016 had total Medicare spending (including Part D) that was 15 percent lower than spending for beneficiaries who remained in traditional Medicare in 2016.
Comparison to Other Payments Received by Medicare Advantage Plans. To put the difference in Medicare spending in context, the $1,253 average difference in spending is nearly four-times larger than the average per capita quality-based bonus payment ($336) paid to Medicare Advantage prescription drugs plans that qualified for bonuses in 2015 (Figure 3). The average difference in spending is also more than twice as large as the average annual premium paid by Medicare Advantage enrollees in 2015, including enrollees in plans with no premium.

Differences in Medicare Spending, by Demographics
Traditional Medicare spending in 2015 was lower for beneficiaries who enrolled in Medicare Advantage plans in 2016 than for similar beneficiaries who remained in traditional Medicare that year, by age and gender, and among beneficiaries dually eligible for Medicare and Medicaid, after adjusting for health risk and other factors (Table 1).
- Age: The difference in average traditional Medicare spending in 2015 among beneficiaries who switched to Medicare Advantage in 2016, compared to those who remained in traditional Medicare, was evident for beneficiaries of all ages, and increased with age for beneficiaries over the age of 65, after risk adjustment. For example, among beneficiaries ages 65-69, average traditional Medicare spending in 2015 was $1,119 lower among beneficiaries who switched to a Medicare Advantage plan in 2016 than for similar beneficiaries who remained in traditional Medicare; among beneficiaries ages 85-89, the difference in spending was $1,314. This finding suggests that selection bias, and the associated potential overpayments, may increase with age.
- Gender: The average difference in spending between the two groups was similar among men and women ($1,271 and $1,247, respectively).
- Dual eligibility for Medicaid: Traditional Medicare spending in 2015 for Medicare beneficiaries with full Medicaid benefits (full dual eligible) who enrolled in Medicare Advantage in 2016 was $1,142 lower, on average, than spending for similar full dual eligibles who stayed in traditional Medicare in 2016, after adjusting for health and demographic factors. Similarly, partial dual eligibles who enrolled in Medicare Advantage in 2016 had traditional Medicare spending in 2015 that was $1,162 lower than spending for those who remained in traditional Medicare in 2016, after adjusting for risk factors. In other words, among dually eligible beneficiaries – a group of beneficiaries with relatively high Medicare spending – those who used more services and incurred higher Medicare spending in 2015 were more likely to remain in traditional Medicare in 2016 while dual eligibles with lower service use and spending were more likely to enroll in a Medicare Advantage plan in 2016.
- Institutional status: Among Medicare beneficiaries living in institutions, such as nursing homes, traditional Medicare spending in 2015 was $1,825 lower among those who enrolled in Medicare Advantage plans in 2016 than among similar institutional residents who stayed in traditional Medicare that year. If higher-cost nursing home residents are remaining in traditional Medicare while lower-cost residents are moving to Medicare Advantage plans, it could make it easier for Medicare Advantage plans serving the nursing home population to be profitable, which may explain the relatively recent increase in firms offering Special Needs Plans for this population (I-SNPs).8
Differences in Medicare Spending, by Chronic Conditions
Even among beneficiaries with the same chronic conditions, those who enrolled in Medicare Advantage plans in 2016 consistently had lower Medicare spending in 2015 than similar beneficiaries who remained in traditional Medicare in 2016 (Table 1).
For example, among traditional Medicare beneficiaries with diabetes in 2015, those who enrolled in Medicare Advantage plans in 2016 had Medicare spending that was $1,072 lower in 2015, on average, than similar beneficiaries with diabetes who stayed in traditional Medicare in 2016, after adjusting for differences in health status (Figure 4). In other words, it would appear that lower-cost beneficiaries with diabetes are more inclined to enroll in Medicare Advantage than higher-cost diabetics. Likewise, traditional Medicare beneficiaries with asthma who enrolled in Medicare Advantage plans in 2016 had Medicare spending that was $1,410 lower in 2015, on average, than similar beneficiaries with asthma who remained in traditional Medicare in 2016, even after adjusting for health risk factors.
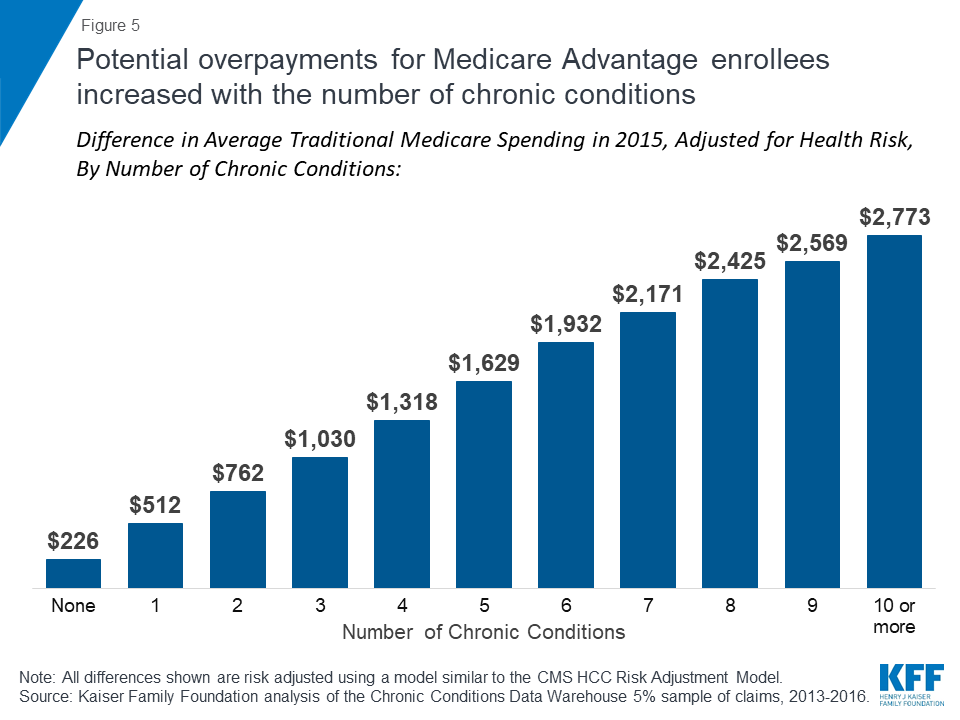
The difference in average, adjusted 2015 traditional Medicare spending between beneficiaries who subsequently enrolled in Medicare Advantage versus those who remained in traditional Medicare increases with the number of chronic conditions, rising from $226 among those with no chronic conditions to $1,629 or more among beneficiaries with 5 or more chronic conditions (Figure 5). This finding suggests that potential overpayments may be largest for the Medicare Advantage plans that are serving the sickest beneficiaries.
Differences in Medicare Spending, by County
In this section, we looked at whether the observed differences in spending and service use persist across markets, and the extent to which differences may vary from one market to another. We compared average spending in 2015 among beneficiaries who switched to Medicare Advantage in 2016 versus those who remained in traditional Medicare, without adjusting for other factors. We were not able to replicate the analysis by county with the adjustment for risk factors, such as health conditions and demographics, due to sample size constraints. For this analysis, we looked at 20 relatively large markets that vary geographically, and vary by Medicare Advantage penetration and payment quartiles.
Among large, urban counties, the differences in spending between Medicare Advantage enrollees and beneficiaries in traditional Medicare varied greatly across the country (Figure 6; Table 3). In some counties, such as Los Angeles, CA, San Bernardino, CA, Wayne, MI (Detroit), and Cuyahoga, OH (Cleveland), beneficiaries who enrolled in Medicare Advantage plans in 2016 had significantly lower traditional Medicare spending in 2015 ( ≥$3,000 lower) than beneficiaries in the county who remained in traditional Medicare in 2016.
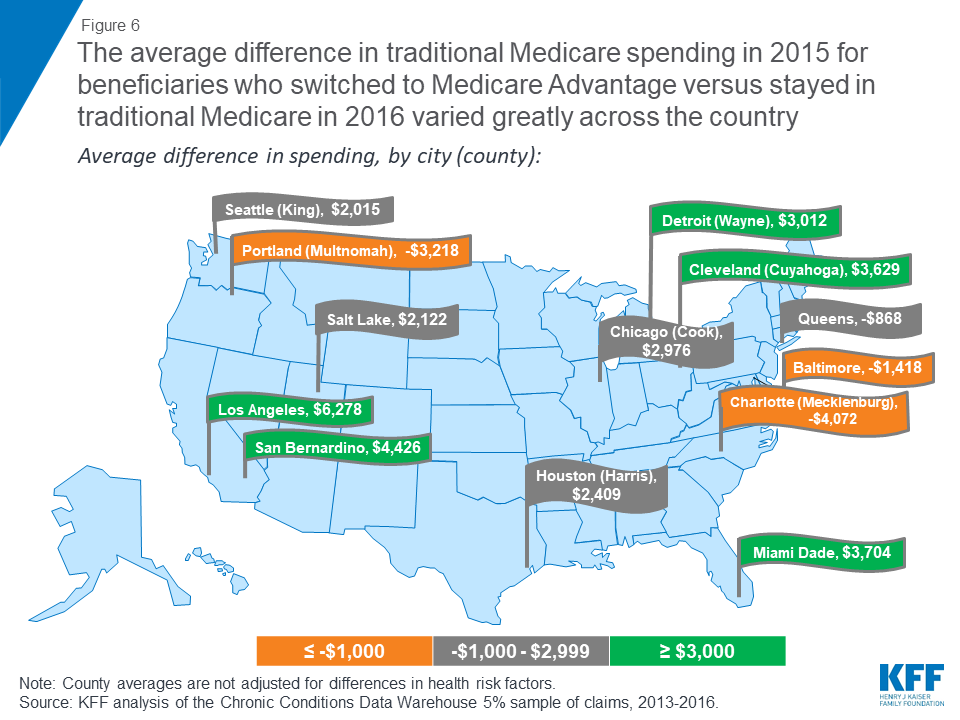
In other counties, such as Allegheny, PA (Pittsburgh), Baltimore City, MD, Mecklenburg, NC (Charlotte), Erie, NY (Buffalo), and Multnomah, OR (Portland) beneficiaries who enrolled in Medicare Advantage plans in 2016 had higher prior year traditional Medicare spending ( ≤-$1,000) than beneficiaries in the county who remained in traditional Medicare in 2016. These differences across counties suggest that the selection bias into Medicare Advantage may vary across markets.
Discussion
This analysis examines whether beneficiaries who choose to enroll in Medicare Advantage plans have lower spending and use fewer services – before enrolling in Medicare Advantage – than similar people in traditional Medicare. The study found that beneficiaries who chose to enroll in a Medicare Advantage plan in 2016 had average expenditures in traditional Medicare (in 2015) that were $1,253 less, on average, than similar beneficiaries who remained in traditional Medicare. Similar differences in spending were found across all demographics and chronic conditions, even after adjusting for health risk factors. The results suggest that favorable self-selection into Medicare Advantage plans is occurring, even among traditional Medicare beneficiaries with similar health conditions. The findings raise questions as to why beneficiaries who are higher utilizers are less likely to go into Medicare Advantage and instead remain in traditional Medicare.
Other studies have examined services used by people while they were enrolled in Medicare Advantage plans, based on limited data, and have generally found that beneficiaries in Medicare Advantage plans use fewer services than those in traditional Medicare.9 ,10 ,11 Notably, the authors of these studies almost universally attribute differences in service utilization to care management by the plans – rather than to pre-existing differences in care seeking behavior and use of health services. This study suggests that differences in health care use, and spending, are evident before beneficiaries decided to enroll in Medicare Advantage plans or remain in traditional Medicare, raising questions about the extent to which plans are actually lowering spending or managing care.
It is not clear whether the differences in spending observed in this study increase, decrease, or persist over time as beneficiaries age, which has implications for whether a similar difference in spending could be assumed for all Medicare Advantage enrollees.12 Likewise, it is not clear how this difference in spending will change as the share of counties with the majority of beneficiaries in Medicare Advantage plans grows. This missing information could have important implications for Medicare spending. Potential overpayments could amount to billions in excess Medicare spending over a ten-year period if the observed differences in spending hold up as beneficiaries age and Medicare Advantage enrollment continues to rise. To illustrate, if the difference in average Medicare spending ($1,253) applied to just 10 percent of all Medicare Advantage enrollees in 2016, or 1.8 million enrollees, it would amount to more than $2 billion in excess spending in one year alone.
Policymakers could consider adjusting payments to reflect Medicare Advantage enrollees’ prior use of health care services, which could lower total Medicare spending and in turn reduce Medicare Part B premiums and deductibles for all beneficiaries. With more than 20 million enrollees in Medicare Advantage plans and Medicare payments to plans projected to reach $250 billion in 2019, the stakes are high for making payments to plans as accurate as possible.13 ,14
Gretchen Jacobson and Tricia Neuman are with the Kaiser Family Foundation. Anthony Damico is an independent consultant.
This paper benefitted from the methodological expertise of Bianca Frogner at the University of Washington.
Methods
This analysis focuses on beneficiaries in traditional Medicare who were enrolled in both Medicare Part A and Medicare Part B in 2015, examining average adjusted 2015 Medicare Part A and B spending for these beneficiaries, based on their 2016 enrollment in Medicare Advantage plans or traditional Medicare. Beneficiaries who enrolled in Medicare Advantage plans at any point during the 2016 calendar year were categorized as Medicare Advantage enrollees.
To conduct this analysis, we excluded beneficiaries who: (1) became Medicare beneficiaries after 2013 or were not in traditional Medicare with both Part A and Part B in 2013, 2014, and 2015 (5.8 million people) because three years of claims data were required for each person to collect sufficient information about chronic conditions; (2) died prior to January 2016 (1.5 million people) because they would not have had the same opportunity to enroll in Medicare Advantage as other beneficiaries; (3) had end-stage renal disease in 2015 or 2016 (290 thousand people) because the vast majority were not eligible to enroll in a Medicare Advantage plan in 2016; (4) were unlikely to have actively selected (and instead may have been passively enrolled in) a Medicare Advantage plan, including beneficiaries who enrolled in Medicare-Medicaid Plans (MMPs) and employer group health plans (183 thousand people); (5) lived in Puerto Rico and other territories because some elements in the Medicare claims data are not as reliable or accurate for these beneficiaries; (6) enrolled in cost, Medical Savings Account (MSA), or PACE plans in 2016 (21 thousand people) because these plans are paid differently than Medicare Advantage plans; and (7) enrolled in a Special Needs Plan for people with specified chronic conditions (C-SNP; 13 thousand people) because the design of these plans may disproportionately attract healthier people with chronic conditions. When we relaxed the first inclusion requirement, for beneficiaries to be in traditional Medicare with both Part A and Part B in 2013, 2014, and 2015, and instead only required included beneficiaries to be in traditional Medicare with Part A and B in 2014 and 2015, the findings did not materially change, with the adjusted percent difference in spending remaining 13%. Similarly, when we included people in C-SNPs, the adjusted percent difference in spending did not change. In total, the primary analysis included 24 million beneficiaries who were in traditional Medicare in 2015.
The brief uses claims data from a five percent sample of Medicare beneficiaries from the Master Beneficiary Summary Files of CMS’s Chronic Conditions Data Warehouse for 2013 through 2016. The analysis first examined the bivariate differences in spending and use of services by demographics, chronic conditions, and other factors. To control for differences in health status and other factors that could account for the difference in Medicare spending, a multivariate generalized linear log link model with a gamma distribution was developed that mimics as closely as possible the CMS-HCC Risk Adjustment Model, which is used to risk-adjust payments to Medicare Advantage plans. The model for this study includes the same structure of the demographic variables and interaction terms as the HCC Risk Adjustment Model. This study’s model also includes the only available (although imperfect) variable to indicate whether someone who used a Part D covered drug was residing in a long-term care facility at any point during the year; this approach misses information about institutional residency status for the people who do not take drugs covered under Part D.
This study examined bivariate differences in traditional Medicare spending across counties, for those county residents who enrolled in Medicare Advantage compared to those who did not. The data used in the study did not include a sufficient number of people to adjust these county-level values for health risk factors. Future studies could examine whether the observed bivariate differences across counties hold, after adjusting for health risk factors.
The model used in this analysis does not include the HCCs in the Risk Adjustment Model that are not recorded as chronic conditions in the Chronic Conditions Data Warehouse, the majority of which are HCCs for acute or relatively rare conditions. The margins command, with values as observed, was used to generate the adjusted spending values. Alternative models for this analysis also included as covariates the per capita traditional Medicare spending for each county, beneficiaries’ race/ethnicity as defined by the RTI race variable, and additional chronic conditions, with no meaningful change in the results. We also looked at the sensitivity of the findings to the inclusion criteria; when we included beneficiaries who were in traditional Medicare with Part A and B in 2014 and 2015 but either were not in traditional Medicare or did not have both Part A and Part B in 2013, the findings did not materially change, with the risk adjusted difference in spending rising from $1,253 to $1,298.
Tables
| Table 1. Average Traditional Medicare Spending in 2015 for Beneficiaries who Switched to Medicare Advantage Or Stayed in Traditional Medicare in 2016, After Adjusting for Health Risk Factors | |||||
| Characteristics in 2015 | People who stayed in TM in 2016 | People who switched to MA in 2016 | Difference in spending, 2015 | ||
| Number of people | Average Part A & B spending, 2015 | Number of people | Average Part A & B spending, 2015 | ||
| Overall | 23,714,780 | $9,362 | 443,240 | $8,109 | $1,253 |
| Age | |||||
| Under 35 | 314,880 | $8,631 | 8,220 | $7,476 | $1,155 |
| 35-44 | 527,740 | $8,778 | 15,020 | $7,603 | $1,175 |
| 45-54 | 1,030,820 | $8,549 | 36,140 | $7,405 | $1,144 |
| 55-59 | 801,600 | $8,362 | 31,180 | $7,243 | $1,119 |
| 60-64 | 904,460 | $8,108 | 41,120 | $7,023 | $1,085 |
| 65-69 | 3,360,240 | $8,365 | 79,480 | $7,246 | $1,119 |
| 70-74 | 5,598,560 | $9,229 | 96,280 | $7,994 | $1,235 |
| 75-79 | 4,341,380 | $9,592 | 63,060 | $8,309 | $1,284 |
| 80-84 | 3,175,960 | $9,687 | 37,900 | $8,391 | $1,296 |
| 85-89 | 2,218,880 | $9,819 | 21,260 | $8,505 | $1,314 |
| 90-94 | 1,089,460 | $10,235 | 10,340 | $8,865 | $1,370 |
| 95 and older | 350,800 | $11,409 | 3,240 | $9,883 | $1,527 |
| Dual eligibility | |||||
| Non-dual eligible | 19,132,740 | $9,779 | 281,300 | $8,471 | $1,309 |
| Partial dual eligible | 1,257,160 | $8,536 | 61,580 | $7,394 | $1,142 |
| Full dual eligible | 3,324,880 | $8,681 | 100,360 | $7,520 | $1,162 |
| Original reason for eligibility | |||||
| Disabled | 5,757,400 | $9,234 | 190,840 | $7,999 | $1,236 |
| Aged | 17,957,380 | $9,471 | 252,400 | $8,204 | $1,267 |
| Gender | |||||
| Female | 13,211,740 | $9,320 | 240,420 | $8,073 | $1,247 |
| Male | 10,503,040 | $9,500 | 202,820 | $8,229 | $1,271 |
| Institutional status | |||||
| Community resident | 13,363,540 | $9,684 | 267,420 | $8,388 | $1,296 |
| Institutional resident | 1,205,040 | $13,638 | 21,880 | $11,813 | $1,825 |
| Unknown | 9,146,200 | $7,559 | 153,940 | $6,548 | $1,011 |
| Chronic conditions | |||||
| Anemia | 5,212,220 | $11,148 | 86,360 | $9,657 | $1,492 |
| Rheumatoid arthritis | 7,987,660 | $10,244 | 136,800 | $8,873 | $1,371 |
| Asthma | 2,077,200 | $10,534 | 42,740 | $9,125 | $1,410 |
| Atrial fibrillation | 2,160,960 | $10,096 | 24,240 | $8,745 | $1,351 |
| Breast or prostate cancer | 1,581,540 | $12,274 | 18,920 | $10,757 | $1,517 |
| COPD | 2,767,340 | $10,103 | 54,960 | $8,751 | $1,352 |
| Congestive heart failure | 3,199,460 | $8,884 | 51,220 | $7,695 | $1,189 |
| Depressive disorders | 6,273,440 | $9,985 | 139,940 | $8,787 | $1,198 |
| Diabetes | 6,592,380 | $8,013 | 136,920 | $6,941 | $1,072 |
| Epilepsy | 594,560 | $9,403 | 13,180 | $8,145 | $1,258 |
| Hypothyroidism | 3,865,660 | $8,540 | 57,540 | $7,398 | $1,143 |
| Ischemic heart disease | 6,792,700 | $9,314 | 107,780 | $8,068 | $1,246 |
| Kidney disease | 4,279,460 | $9,414 | 73,760 | $8,154 | $1,260 |
| Liver disease | 790,800 | $11,631 | 17,040 | $10,074 | $1,556 |
| Mobility impairments | 577,820 | $12,766 | 11,120 | $11,058 | $1,708 |
| Obesity | 2,942,860 | $9,687 | 69,620 | $8,503 | $1,184 |
| Peripheral vascular disease | 2,888,480 | $9,219 | 47,420 | $7,985 | $1,234 |
| Pressure ulcers | 993,360 | $12,827 | 16,060 | $11,110 | $1,716 |
| Schizophrenia | 452,120 | $10,686 | 13,840 | $9,256 | $1,430 |
| Stroke/TIA | 907,500 | $11,935 | 15,180 | $10,338 | $1,597 |
| No. of chronic conditions | |||||
| 0 | 4,513,760 | $1,687 | 93,200 | $1,461 | $226 |
| 1 | 4,483,440 | $3,823 | 82,120 | $3,311 | $512 |
| 2 | 4,105,140 | $5,694 | 74,140 | $4,932 | $762 |
| 3 | 3,225,380 | $7,701 | 59,420 | $6,670 | $1,030 |
| 4 | 2,357,580 | $9,846 | 44,160 | $8,529 | $1,318 |
| 5 | 1,666,820 | $12,173 | 29,760 | $10,544 | $1,629 |
| 6 | 1,164,460 | $14,436 | 20,940 | $12,504 | $1,932 |
| 7 | 801,800 | $16,222 | 14,660 | $14,052 | $2,171 |
| 8 | 544,880 | $18,120 | 10,040 | $15,696 | $2,425 |
| 9 | 357,240 | $19,197 | 6,080 | $16,628 | $2,569 |
| 10 or more | 494,280 | $20,725 | 8,720 | $17,952 | $2,773 |
| NOTE: All values shown were risk adjusted using a model similar to the CMS HCC Risk Adjustment Model. Excludes beneficiaries in Puerto Rico and those who enrolled in cost, Medicare Medical Savings Account (MSA), PACE plans, Medicare-Medicaid Plans (MMPs) and employer group health plans. Excludes beneficiaries with end-stage renal disease. Excludes people who died before the end of 2015. Excludes people not enrolled in Medicare prior to 2013. TM is traditional Medicare. MA is Medicare Advantage. Only chronic conditions with at least 10,000 people switching to Medicare Advantage are shown in table.SOURCE: Kaiser Family Foundation analysis of the Chronic Conditions Data Warehouse 5% sample of claims, 2013-2016. | |||||
| Table 2. Results from Multivariate Regression of Traditional Medicare Spending in 2015 for Beneficiaries who Switched to Medicare Advantage Or Stayed in Traditional Medicare in 2016, Adjusting for Risk Factors Included in the CMS HCC-Risk Adjustment Model | ||
| Coefficients | Estimate | Std. Error |
| Intercept | 7.109633 | 0.009402 |
| Switching | -0.143651 | 0.0142682 |
| Gender: Male | referent category | |
| Female | -0.0110686 | 0.0117174 |
| Age 0-34 | -0.0712961 | 0.025248 |
| 35-44 | -0.0163406 | 0.021451 |
| 45-54 | -0.0408814 | 0.0170427 |
| 55-59 | -0.06427 | 0.0179617 |
| 60-64 | -0.0190008 | 0.017056 |
| 65-69 | referent category | |
| 70-74 | 0.0873604 | 0.0095115 |
| 75-79 | 0.1411297 | 0.0101946 |
| 80-84 | 0.1577402 | 0.0112485 |
| 85-89 | 0.1494632 | 0.0130799 |
| 90-94 | 0.1666209 | 0.018159 |
| 95+ | 0.3183193 | 0.0344025 |
| Dual eligibility: Non-duals | referent category | |
| Partial duals | -0.1038725 | 0.0282699 |
| Full duals | -0.1306216 | 0.0198355 |
| Community residents | referent category | |
| Institutional residents | 0.4165534 | 0.0333449 |
| Missing residency status | -0.2392473 | 0.0071132 |
| Original reason for entitlement: Aged | referent category | |
| Disabled | -0.0033169 | 0.0138178 |
| Chronic conditions/HCC codes | ||
| Acute MI | 0.810567 | 0.0252134 |
| Anemia | 0.3412536 | 0.0120288 |
| Asthma | 0.1515625 | 0.0151335 |
| Atrial fibrillation | 0.1202888 | 0.0153342 |
| Blindness | 0.1981732 | 0.0244406 |
| Brain injury | 0.2645299 | 0.0313467 |
| Breast or Prostate cancer | 0.2771732 | 0.0132984 |
| Cerebral palsy | -0.0489468 | 0.033602 |
| Chronic kidney disease | 0.154923 | 0.0152935 |
| Colorectal cancer | 0.4436472 | 0.0204056 |
| Congestive heart failure | -0.0452462 | 0.05673 |
| COPD | 0.2339984 | 0.0398189 |
| Cystic fibrosis | 0.034797 | 0.0282677 |
| Depressive disorders | 0.0929828 | 0.0119425 |
| Diabetes | -0.1646257 | 0.0151394 |
| Endometrial cancer | 0.4495853 | 0.0356021 |
| Epilepsy | 0.2226373 | 0.0456154 |
| Hepatitis | 0.1817627 | 0.0225243 |
| Hip/Pelvic fracture | 0.9409028 | 0.0247483 |
| HIV/AIDS | 0.0927405 | 0.0346999 |
| Hypothyroidism | -0.1240166 | 0.0120557 |
| Ischemic heart disease | -0.0107028 | 0.0119693 |
| Leukemia | 0.5217791 | 0.0189631 |
| Liver disease | 0.2347011 | 0.0150768 |
| Lung cancer | 0.6364471 | 0.0232583 |
| Mobility impairments | 0.3394306 | 0.0170233 |
| Multiple sclerosis | 0.4343622 | 0.0308529 |
| Muscular dystrophy | 0.7138206 | 0.0798967 |
| Obesity | 0.0173455 | 0.0123963 |
| Peripheral vascular disease | -0.0216004 | 0.0124903 |
| Personality disorders | 0.1777524 | 0.02434 |
| Pressure ulcers | 0.485386 | 0.0206655 |
| PTSD | 0.0428833 | 0.0225038 |
| Rheumatoid arthritis | 0.1957197 | 0.0116852 |
| Schizophrenia | 0.1277205 | 0.0207238 |
| Spina bifida | 0.2069589 | 0.0493435 |
| Spinal cord injuries | 0.4995232 | 0.0333971 |
| Stroke/TIA | 0.2737327 | 0.0149603 |
| No. of chronic conditions – 0 | referent category | |
| 1 | 0.8182002 | 0.0126207 |
| 2 | 1.21658 | 0.0228322 |
| 3 | 1.518567 | 0.0335242 |
| 4 | 1.764325 | 0.0443301 |
| 5 | 1.976463 | 0.0551261 |
| 6 | 2.146921 | 0.0659209 |
| 7 | 2.263623 | 0.0766949 |
| 8 | 2.374266 | 0.0874716 |
| 9 | 2.431992 | 0.0983541 |
| 10 or more | 2.508572 | 0.1192487 |
| Interaction terms | ||
| Gender and age: 0-34 x female | 0.1451276 | 0.0377312 |
| 35-44 x female | 0.0114095 | 0.0303987 |
| 45-54 x female | 0.0155029 | 0.0239679 |
| 55-59 x female | 0.0030464 | 0.0253859 |
| 60-64 x female | -0.0209732 | 0.0240343 |
| 70-74 x female | -0.0346688 | 0.0130251 |
| 75-79 x female | -0.0609598 | 0.0138234 |
| 80-84 x female | -0.0728437 | 0.0150058 |
| 85-89 x female | -0.034932 | 0.0169001 |
| 90-94 x female | 0.0064602 | 0.0223403 |
| 95+ x female | -0.0674294 | 0.0395159 |
| Dual eligibility and institutional status: Full duals x institutional resident | -0.1198834 | 0.0491795 |
| Full duals x missing residency | -0.0315702 | 0.0433176 |
| Partial duals x institutional resident | 0.5107559 | 0.2224101 |
| Partial duals x missing residency | -0.5571722 | 0.0537358 |
| Dual eligibility, institutional status, and original reason for entitlement: | -0.1183059 | 0.0765971 |
| Non-duals x institutional resident x disabled | ||
| Non-duals x missing residency x disabled | -0.2336562 | 0.0162378 |
| Full duals x community resident x disabled | 0.1227525 | 0.0263483 |
| Full duals x institutional resident x disabled | -0.1656144 | 0.0392149 |
| Full duals x missing residency x disabled | -0.3121091 | 0.0477308 |
| Partial duals x community resident x disabled | 0.059407 | 0.0349008 |
| Partial duals x institutional resident x disabled | -0.522261 | 0.2330442 |
| Partial duals x missing residency x disabled | 0.1359108 | 0.0591859 |
| Dual eligibility, institutional status, original reason for entitlement, and gender: | ||
| Non-duals x institutional resident x aged x female | -0.0360198 | 0.0387172 |
| Non-duals x institutional resident x disabled x female | 0.0632813 | 0.0972535 |
| Non-duals x missing residency x aged x female | 0.1022933 | 0.009524 |
| Non-duals x missing residency x disabled x female | 0.2030838 | 0.0219463 |
| Full duals x community resident x aged x female | 0.0253688 | 0.0238392 |
| Full duals x community resident x disabled x female | -0.0109653 | 0.0235554 |
| Full duals x institutional resident x aged x female | -0.0780793 | 0.036145 |
| Full duals x institutional resident x disabled x female | -0.0157271 | 0.0325536 |
| Full duals x missing residency x aged x female | 0.291827 | 0.0494258 |
| Full duals x missing residency x disabled x female | 0.1634248 | 0.0433238 |
| Partial duals x community resident x aged x female | -0.0641133 | 0.0335277 |
| Partial duals x community resident x disabled x female | -0.0105862 | 0.028095 |
| Partial duals x institutional resident x aged x female | -0.37536 | 0.2447585 |
| Partial duals x institutional resident x disabled x female | -0.0201749 | 0.123955 |
| Partial duals x missing residency x aged x female | 0.4419479 | 0.0623898 |
| Partial duals x missing residency x disabled x female | 0.3076511 | 0.0604882 |
| Original reason for entitlement, CHF: | -0.1078823 | 0.0139239 |
| Aged x CHF | ||
| Original reason for entitlement, Disabled x pressure ulcers: | 0.321468 | 0.0158037 |
| Original reason for entitlement, Aged x pressure ulcers | 0.485386 | 0.0206655 |
| Original reason for entitlement, Aged x multiple sclerosis: | -0.235861 | 0.0597826 |
| Aged x multiple sclerosis | ||
| No Congestive heart failure x diabetes | -0.3146191 | 0.0121283 |
| Congestive heart failure x No diabetes | 0.1646257 | 0.0151394 |
| No Congestive heart failure x (asthma or COPD or cystic fibrosis) | -0.039098 | 0.0152652 |
| Congestive heart failure x No (asthma or COPD or cystic fibrosis) | -0.0093765 | 0.0194537 |
| No Congestive heart failure x chronic kidney disease | -0.0777502 | 0.0128155 |
| No Congestive heart failure x atrial fibrillation | 0.0852685 | 0.0142362 |
| Congestive heart failure x No atrial fibrillation | -0.1202888 | 0.0153342 |
| Schizophrenia x congestive heart failure | 0.1068341 | 0.0439697 |
| No Schizophrenia x COPD | 0.1029918 | 0.0169278 |
| Schizophrenia x No COPD | 0.1277205 | 0.0207238 |
| Schizophrenia x COPD | 0.3617188 | 0.0429217 |
| Schizophrenia x epilepsy | -0.1311777 | 0.0462925 |
| NOTE: One dollar was added to all spending values to remove zeros. Other regressions included additional chronic conditions, county-level average traditional Medicare spending, and beneficiaries’ race/ethnicity with no meaningful change in results.SOURCE: Kaiser Family Foundation analysis of the Chronic Conditions Data Warehouse 5% sample of claims, 2013-2016. | ||
| Table 3. Average Traditional Medicare Spending in 2015, Unadjusted for Health Risk Factors, for Beneficiaries who Switched to Medicare Advantage Or Stayed in Traditional Medicare in 2016, In Selected Counties | ||||||
| County(Largest city in the county) | People who stayed in TM in 2016 | People who switched to MA in 2016 | Difference in spending (unadjusted) | Percentage difference in spending, 2015 | ||
| Number of people | Average Part A & B spending, 2015 | Number of people | Average Part A & B spending, 2015 | |||
| Allegheny, Pennsylvania (Pittsburgh) | 45,820 | $9,358 | 1,440 | $11,464 | ($2,105) | -22% |
| Baltimore City, Maryland | 51,900 | $13,413 | 1,140 | $14,831 | ($1,418) | -11% |
| Bexar, Texas (San Antonio) | 87,360 | $8,427 | 1,720 | $7,957 | $471 | 6% |
| Clark, Nevada (Las Vegas) | 104,260 | $9,323 | 3,180 | $7,294 | $2,029 | 22% |
| Cook, Illinois (Chicago) | 339,340 | $9,629 | 6,040 | $6,653 | $2,976 | 31% |
| Cuyahoga, Ohio (Cleveland) | 80,740 | $8,941 | 2,160 | $5,312 | $3,629 | 41% |
| Erie, New York (Buffalo) | 43,720 | $7,992 | 1,300 | $9,489 | ($1,498) | -19% |
| Fulton, Georgia (Atlanta) | 39,480 | $7,930 | 1,660 | $6,903 | $1,027 | 13% |
| Harris, Texas (Houston) | 157,860 | $10,134 | 5,040 | $7,725 | $2,409 | 24% |
| King, Washington (Seattle) | 113,020 | $8,044 | 2,820 | $6,029 | $2,015 | 25% |
| Los Angeles, California | 322,160 | $11,719 | 5,300 | $5,440 | $6,278 | 54% |
| Marion, Indiana (Indianapolis) | 65,580 | $9,084 | 2,720 | $9,597 | ($513) | -6% |
| Mecklenburg, North Carolina (Charlotte) | 53,760 | $7,835 | 1,560 | $11,907 | ($4,072) | -52% |
| Miami Dade, Florida (Miami) | 87,920 | $12,523 | 4,940 | $8,819 | $3,704 | 30% |
| Milwaukee, Wisconsin | 51,820 | $9,217 | 2,320 | $9,007 | $210 | 2% |
| Multnomah, Oregon (Portland) | 25,800 | $9,216 | 1,080 | $12,434 | ($3,218) | -35% |
| Queens, New York (New York City) | 102,980 | $11,460 | 3,880 | $12,328 | ($868) | -8% |
| Salt Lake, Utah | 41,720 | $8,418 | 1,220 | $6,296 | $2,122 | 25% |
| San Bernardino, California | 46,720 | $9,576 | 1,440 | $5,150 | $4,426 | 46% |
| Wayne, Michigan (Detroit) | 125,520 | $11,272 | 1,600 | $8,260 | $3,012 | 27% |
| NOTE: Excludes beneficiaries in Puerto Rico and those who enrolled in cost, Medicare Medical Savings Account (MSA), PACE plans, Medicare-Medicaid Plans (MMPs) and employer group health plans. Excludes beneficiaries with end-stage renal disease. Excludes people who died before the end of 2015. Excludes people not enrolled in Medicare prior to 2013. TM is traditional Medicare. MA is Medicare Advantage.SOURCE: Kaiser Family Foundation analysis of the Chronic Conditions Data Warehouse 5% sample of claims, 2013-2016. | ||||||
| Table 4. Average Traditional Medicare Spending in 2015 for Beneficiaries who Switched to Medicare Advantage Or Stayed in Traditional Medicare in 2016, Unadjusted for Health Risk Factors | ||||||
| Characteristics in 2015 | People who stayed in TM in 2016 | People who switched to MA in 2016 | Difference in spending | Percentage difference in spending | ||
| Number of people | Average Part A & B spending, 2015 | Number of people | Average Part A & B spending, 2015 | |||
| Overall | 23,714,780 | $8,859 | 443,240 | $7,628 | $1,231 | 14% |
| Age | ||||||
| Under 65 | 3,579,500 | $8,431 | 131,680 | $8,461 | -$30 | 0% |
| 65-69 | 3,360,240 | $6,900 | 79,480 | $6,084 | $815 | 12% |
| 70-74 | 5,598,560 | $7,341 | 96,280 | $5,915 | $1,426 | 19% |
| 75-79 | 4,341,380 | $8,792 | 63,060 | $7,469 | $1,323 | 15% |
| 80 and older | 6,835,100 | $11,327 | 72,740 | $10,347 | $980 | 9% |
| Dual eligibility | ||||||
| Full dual eligible | 3,324,880 | $12,951 | 100,360 | $12,310 | $641 | 5% |
| Partial dual eligible | 1,257,160 | $9,220 | 61,580 | $8,565 | $654 | 7% |
| Non-dual eligible | 19,132,740 | $8,122 | 281,300 | $5,788 | $2,335 | 29% |
| Gender | ||||||
| Female | 13,211,740 | $9,071 | 240,420 | $8,185 | $887 | 10% |
| Male | 10,503,040 | $8,588 | 202,820 | $7,017 | $1,572 | 18% |
| Chronic conditions | ||||||
| Anemia | 5,212,220 | $20,958 | 86,360 | $20,026 | $932 | 4% |
| Rheumatoid Arthritis | 7,987,660 | $14,133 | 136,800 | $12,960 | $1,173 | 8% |
| Asthma | 2,077,200 | $22,438 | 42,740 | $19,451 | $2,986 | 13% |
| Atrial fibrillation | 1,581,540 | $15,181 | 18,920 | $13,531 | $1,650 | 11% |
| Breast or prostate cancer | 2,160,960 | $20,359 | 24,240 | $20,502 | -$143 | -1% |
| COPD | 3,199,460 | $23,280 | 51,220 | $22,306 | $975 | 4% |
| Congestive heart failure | 2,767,340 | $21,551 | 54,960 | $18,925 | $2,626 | 12% |
| Depressive disorders | 6,273,440 | $15,846 | 139,940 | $13,779 | $2,067 | 13% |
| Diabetes | 6,592,380 | $12,749 | 136,920 | $10,973 | $1,776 | 14% |
| Epilepsy | 4,279,460 | $19,836 | 73,760 | $18,556 | $1,281 | 6% |
| Hypothyroidism | 3,865,660 | $13,668 | 57,540 | $12,931 | $737 | 5% |
| Ischemic heart disease | 6,792,700 | $15,853 | 107,780 | $15,162 | $691 | 4% |
| Kidney Disease | 594,560 | $20,993 | 13,180 | $18,447 | $2,547 | 12% |
| Liver disease | 790,800 | $21,789 | 17,040 | $19,090 | $2,699 | 12% |
| Mobility impairments | 577,820 | $32,279 | 11,120 | $29,137 | $3,142 | 10% |
| Obesity | 2,942,860 | $16,436 | 69,620 | $14,545 | $1,892 | 12% |
| Peripheral vascular disease | 2,888,480 | $19,606 | 47,420 | $18,489 | $1,118 | 6% |
| Pressure ulcers | 452,120 | $15,314 | 13,840 | $15,335 | -$21 | 0% |
| Schizophrenia | 993,360 | $31,390 | 16,060 | $31,312 | $78 | 0% |
| Stroke/TIA | 907,500 | $26,581 | 15,180 | $25,888 | $694 | 3% |
| NOTE: Values have not been adjusted for differences in health status and other risk factors. Excludes beneficiaries in Puerto Rico and those who enrolled in cost, Medicare Medical Savings Account (MSA), PACE plans, Medicare-Medicaid Plans (MMPs) and employer group health plans. Excludes beneficiaries with end-stage renal disease. Excludes people who died before the end of 2015. Excludes people not enrolled in Medicare prior to 2013. TM is traditional Medicare. MA is Medicare Advantage. Only chronic conditions with at least 10,000 people switching to Medicare Advantage are shown in table.SOURCE: Kaiser Family Foundation analysis of the Chronic Conditions Data Warehouse 5% sample of claims, 2013-2016. | ||||||
Endnotes
- Medicare Payment Advisory Commission, “Medicare Advantage encounter data,” Presentation to Commissioners, March 7, 2019. Available at: http://www.medpac.gov/docs/default-source/default-document-library/ma-encounter-data-march-2019.pdf ↩︎
- Neuman, Patricia and Gretchen Jacobson. “Medicare Advantage Checkup” New England Journal of Medicine 2018; 379: 2163-2172 Available at: https://www.nejm.org/doi/full/10.1056/NEJMhpr1804089 ↩︎
- Medicare Payment Advisory Commission, “Improving risk adjustment in the Medicare program,” June 2014. Available at: http://www.medpac.gov/docs/default-source/reports/jun14_ch02.pdf ↩︎
- Newhouse, Joseph P., J. Michael McWilliams, Mary Price, et al., “Do Medicare Advantage Plans Select Enrollees in Higher Margin Clinical Categories?” Journal of Health Economics. 2013 December; 32(6) ↩︎
- Newhouse, Joseph P., Mary Price, J. Michael McWilliams, et al., “How Much Favorable Selection is Left In Medicare Advantage?” American Journal of Health Economics. 2015 1(1):1-26 ↩︎
- McWilliams, J. Michael, John Hsu, and Joseph P. Newhouse, “New Risk-Adjustment System Was Associated With Reduced Favorable Selection In Medicare Advantage,” 2011. Vol. 31, no. 12. ↩︎
- We examined health care service utilization in 2015 among beneficiaries who switched to Medicare Advantage in 2016 vs. those who remained in traditional Medicare. As might be expected based on the finding of lower average spending, we found lower rates of utilization among those who switched to Medicare Advantage. The difference in percent of beneficiaries using services, was largest for Part B drugs, evaluation and management, imaging, tests, and physician visits, respectively. Among beneficiaries who used the specific services, the quantities used were not appreciably different. This analysis was conducted at the bivariate level. ↩︎
- Kaiser Family Foundation, “Medicare Advantage 2019 Spotlight: First Look,” October 2019. Available at: https://modern.kff.org/report-section/medicare-advantage-2019-spotlight-first-look-tables/ ↩︎
- Raetzman, Susan O., Anika L. Hines, Marguerite L. Barrett, and Zeynal Karaca, “Hospital Stays in Medicare Advantage Plans Versus the Traditional Fee-for-Service Program, 2013,” HCUP Statistical Brief #198. December 2015. Agency for Healthcare Research and Quality, Rockville, MD. http://www.hcup-us.ahrq.gov/reports/statbriefs/sb198-Hospital-Stays-Medicare-Advantage-Versus-Traditional-Medicare.pdf. ↩︎
- Landon, Bruce E., Alan M. Zaslavsky, Robert C. Saunders, et al., “Utilization of Services in Medicare Advantage versus Traditional Medicare since the Passage of the Medicare Modernization Act,” Health Affairs. 2012; 31(12): 2609-2617. ↩︎
- Ayanian, John Z., Landon, Bruce E., Newhouse, Joseph P. et. al. “Analysis of Medicare Advantage HMOs Compared with Traditional Medicare Shows Lower Use of Many Services During 2003-09.” Health Affairs, 31, 12 (December 2012): 1-9. ↩︎
- A recent study found that death rates were initially lower among beneficiaries who enrolled in Medicare Advantage than those who stayed in traditional Medicare but the rates began to converge over time, raising questions about the differences in case mix between traditional Medicare and Medicare Advantage, and how potential overpayments would change over time. See Newhouse, Joseph P., Mary Price, J. Michael McWilliams, et al., “Adjusted Mortality Rates Are Lower For Medicare Advantage Than Traditional Medicare, But The Rates Converge Over Time,” Health Affairs, 38, 4 (April 2019). ↩︎
- Congressional Budget Office, “Medicare Baseline,” April 2018. Available at: https://www.cbo.gov/system/files?file=2018-06/51302-2018-04-medicare.pdf ↩︎
- Kaiser Family Foundation, “A Dozen Facts About Medicare Advantage,” November 2018. Available at: https://modern.kff.org/medicare/issue-brief/a-dozen-facts-about-medicare-advantage/ ↩︎