Community Health Centers: Recent Growth and the Role of the ACA
Executive Summary
Community health centers are the nation’s largest source of comprehensive primary care for medically underserved communities and populations. Under the Affordable Care Act (ACA), increased patient revenues due to the expansion of Medicaid and private health insurance, along with substantially increased direct federal investment in the program, have led to growth in the number of health centers and their capacity to provide services. This brief draws on 2015 federal data on health centers and our 2016 Survey of Health Centers’ Experiences and Activities under the Affordable Care Act to provide a snapshot of health centers and their patients, analyze recent changes, and compare the experience of health centers in Medicaid expansion and non-expansion states. This information is germane to the impending debate on the ACA and the potential impact of changes on coverage and access to care for low-income Americans and financing for safety-net providers. Key findings include:
- Health centers are a core source of primary care in the U.S., particularly for Medicaid beneficiaries and uninsured people. In 2015, 1,375 health centers provided care to 24.3 million patients, including 1 in 12 U.S. residents and nearly 1 in 6 Medicaid enrollees. Almost three-quarters of all health center patients had income below the poverty level.
- Health center patients are increasingly insured, primarily due to the ACA Medicaid expansion. In 2015, 76% of health center patients were insured (49% through Medicaid), up from 65% in 2013, the year before the ACA coverage expansions took effect. State Medicaid expansion decisions made a large difference in coverage. Over half of health center patients in expansion states had Medicaid, compared to one-third in non-expansion states. About 1 in 5 health center patients in Medicaid expansion states remained uninsured, compared to 1 in 3 in non-expansion states.
- The Medicaid expansion strengthened health center finances and capacity. Health centers in Medicaid expansion states reported higher total operating revenues than those in non-expansion states, and Medicaid provided a larger share of their revenues. On average, health centers in expansion states served 40% more patients than those in non-expansion states, reported higher staffing ratios for oral and behavioral health care, and were more likely to report increased capacity to provide services. Workforce recruitment and retention are leading challenges for health centers, especially in Medicaid expansion states.
- Health centers report increased numbers of insured patients who are unable to pay their deductibles and cost-sharing. Nearly two-thirds of health centers in non-expansion states reported an increase in insured patients who could not afford their deductibles and cost-sharing, and over half reported an increase in the share of their privately insured patients who pay sliding fees. The share of health centers in expansion states reporting these trends, though significantly smaller, was also substantial.
- Federal grant funding remains essential to support health centers. In 2015, federal grants provided close to 20% of health center revenues. This funding enables health centers to finance care for uninsured patients, subsidize insured patients unable to afford their deductibles and copays, and finance services not covered by insurance. Over 70% of federal health center grant funding is from the health center trust fund set up by the ACA.
- If the ACA were repealed, ending the Medicaid expansion and the health center trust fund, health centers would be challenged to sustain their operations. Increased numbers of uninsured patients, together with both the loss of Medicaid revenues associated with the Medicaid expansion and most federal grant funding, would be a severe financial shock to health centers and likely leave them unable to sustain their operations and capacity at current levels. The contraction of health centers would likely leave the most medically underserved urban and rural communities in the nation – for which the health center program was created – with reduced access to comprehensive primary health care.
Issue Brief
Introduction
Community health centers are an integral component of our nation’s health care system, representing the largest source of comprehensive primary health care for medically underserved rural and urban communities and populations. The health center program, which enjoys broad bipartisan support, has grown significantly over time due primarily to expanded Medicaid eligibility and substantial increases in federal grant funding, most recently under the Affordable Care Act (ACA), which expanded Medicaid to nonelderly adults with income up to 138% of the federal poverty level (FPL) and established new private insurance marketplaces and subsidies for people with incomes between 100% and 400% FPL. The ACA also created a special trust fund for health centers, extended in 2015 for two additional years (through September 30, 2017). The 2012 Supreme Court decision on the ACA effectively made the Medicaid expansion optional for states; as of January 1, 2017, 32 states (including the District of Columbia (DC)) had adopted the expansion and 19 states had not.1
This issue brief provides a 2015 snapshot of health centers and their patients. In addition, it compares the characteristics and experience of health centers in Medicaid expansion and non-expansion states, including the coverage profile of their patients, their revenue sources, their service capacity, and changes in these factors relative to January 1, 2015. The analysis relies on data from the federal Uniform Data System (UDS), into which all community health centers must report on an annual basis, as well as data from the 2016 round of the Survey of Health Centers’ Experiences and Activities under the Affordable Care Act, designed jointly by the Geiger Gibson/RCHN Community Health Foundation Research Collaborative at the George Washington University’s Milken Institute School of Public Health and the Kaiser Family Foundation. Previous rounds of the survey were conducted in 2013 and 2014.2
Data and Methods
We analyzed data from the 2015 UDS to develop a current profile of community health centers and their patients, and also to compare health centers in Medicaid expansion and non-expansion states. To assess changes in selected health center variables since the ACA coverage expansions took effect in 2014, we compared 2013 and 2015 UDS data. We also analyzed data from our health center survey to compare the recent experience of health centers in Medicaid expansion and non-expansion states in terms of revenue, service capacity, and access to care.
We emailed the survey during May-July 2016 to all 1,278 federally-funded community health centers identified in the 2014 UDS.3 A total of 640 health centers responded, yielding a response rate of 50%. We received survey responses from health centers in all 50 states and DC and four U.S. territories. Excluding health center respondents in the territories (n=11), 61% of the survey respondents were located in Medicaid expansion states and 39% were located in non-expansion states. To adjust for observed differences between respondents and non-respondents, we weighted the survey data by total health center patients, the percentage of their patients reported as racial/ethnic minorities, and total revenues per patient, using 2015 UDS data. After weighting the data, we conducted bivariate analyses (Chi-squared and t-tests) to determine whether responses differed based on health centers’ location in Medicaid expansion versus non-expansion states.
In the UDS analysis, all states that expanded Medicaid by the end of 2015 were counted as expansion states (30 states including DC) and the others were counted as non-expansion state (21 states).4 In the survey analysis, Montana, which expanded Medicaid in early 2016, was also counted as an expansion state on the assumption that its health centers would have felt effects of the expansion by survey time, but we counted Louisiana, which expanded Medicaid in July 2016, as a non-expansion state. Thus, the survey analysis counts 31 states including DC as Medicaid expansion states and 20 non-expansion states. Health centers in the territories were excluded from all analyses comparing health centers in Medicaid expansion and non-expansion states.
Findings
National Profile of Health Centers, 2015
Health centers serve a large and diverse low-income population.
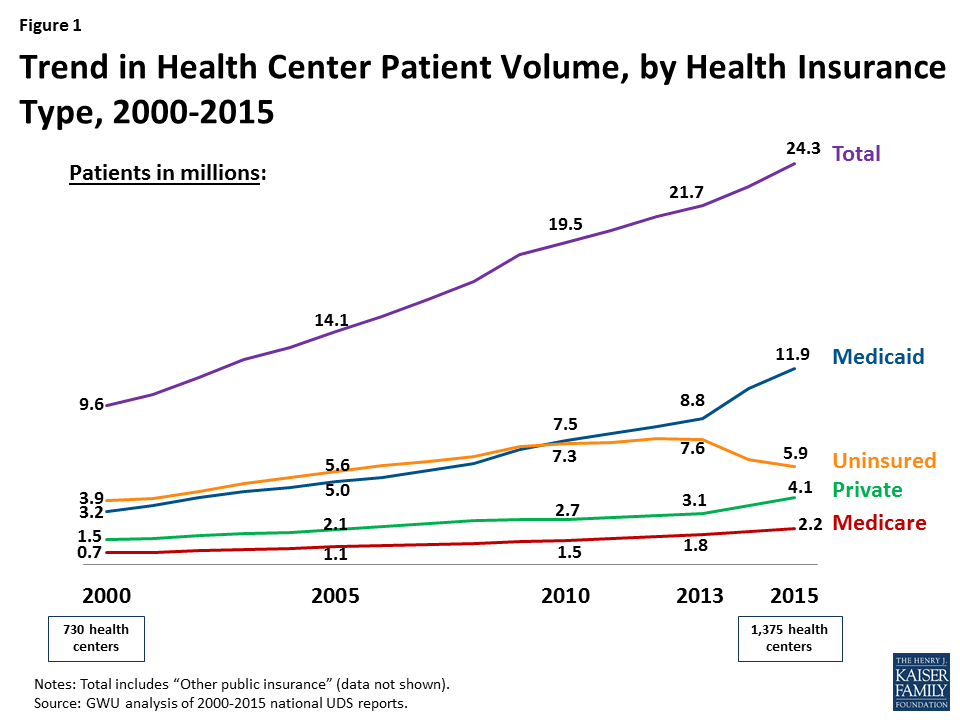
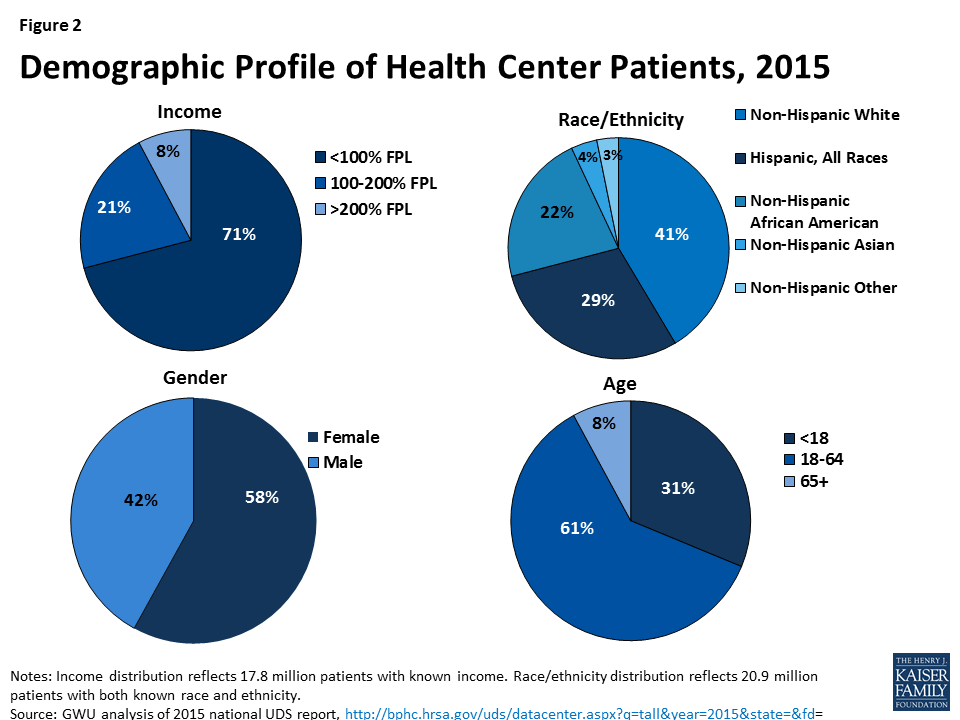
In 2015, 1,375 community health centers in more than 9,750 communities served 24.3 million patients (Figure 1) – nearly 1 in 12 U.S. residents. This patient caseload is more than 10% greater than the caseload just two years ago, in 2013. Health centers serve a diverse, low-income population. Over half (55%) of health centers are located in rural areas and 45% are located in urban areas. In 2015, the vast majority (92%) of health center patients had income at or below 200% FPL ($40,180 for a family of 3 in 20155 ), including 71% who had income below 100% FPL (Figure 2). Nearly 6 in 10 patients were female. The large majority of health center patients were non-elderly adults (61%) and children (31%), but almost 1 in 10 were elderly. The patient population was also racially and ethnically diverse, with non-Hispanic Whites, Hispanics, and African Americans each making up a sizable share of the total.
The health center patient population is increasingly insured, primarily due to Medicaid.
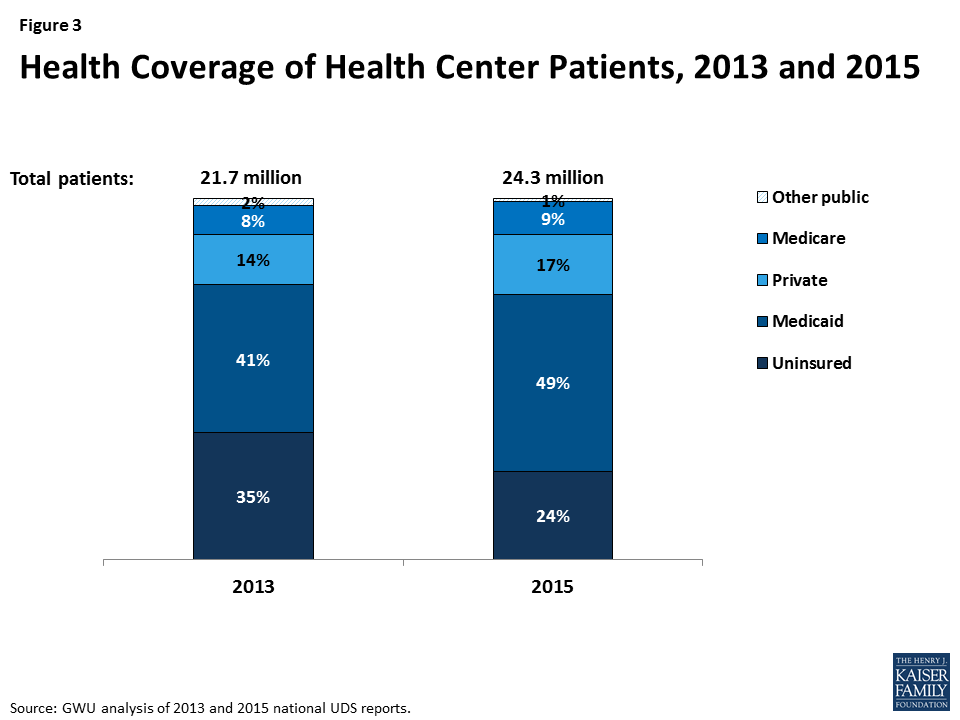
In 2013, 65% of health center patients were insured (Figure 3) – 41% by Medicaid, 14% by private insurance, 8% by Medicare, and 2% by other public insurance. By 2015, 76% of health center patients had coverage – an increase of 11 percentage points. About half were covered by Medicaid, 17% by private insurance, 9% by Medicare, and 1% by other public insurance. These increases in coverage coincided with implementation of the ACA insurance expansions, which began January 1, 2014. The increased share of patients with Medicaid reflects the low-income communities served by health centers. The potential for gains in private insurance in these communities is more limited because of the high concentration of poverty and the fact that individuals with income below 100% FPL are not eligible for subsidies to purchase coverage in the ACA marketplaces.
Even with expanded coverage, 1 in 4 health center patients remains uninsured.
As health coverage rates rose from 2013 to 2015, the uninsured rate among health center patients fell. Notably, however, even with substantial gains in coverage, 24% of health center patients were uninsured in 2015, nearly triple the rate in the general population (9.1%).6
Health centers are key Medicaid providers.
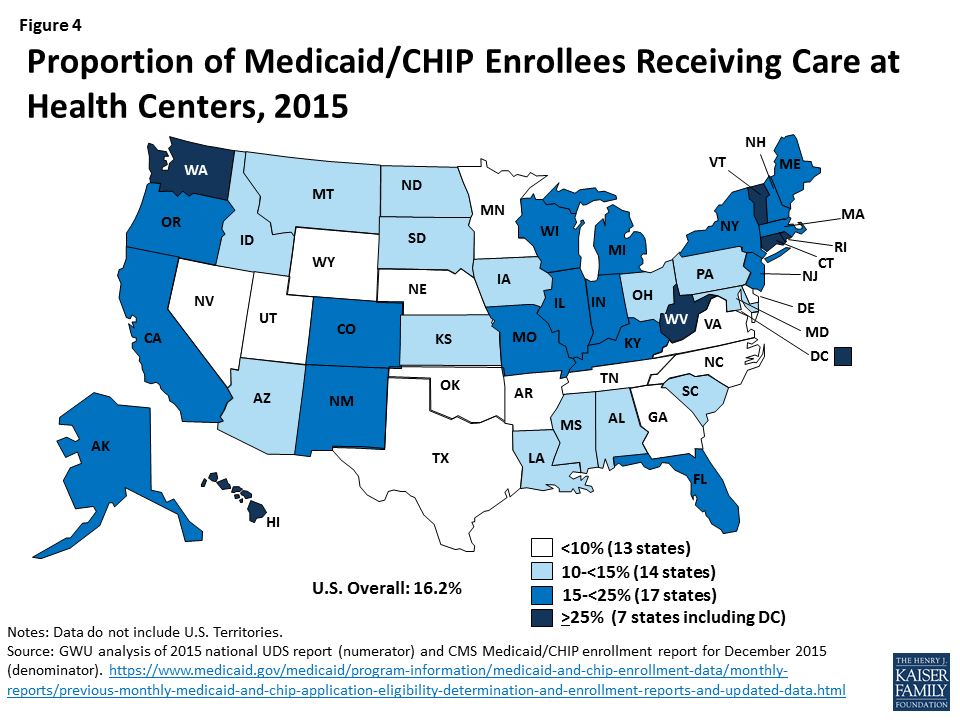
Health centers are a major source of comprehensive primary care for Medicaid beneficiaries. In 2015, close to 1 in 6 Medicaid enrollees received health center services (Figure 4). This statistic varies across the nation, but in almost half the states, more than 1 in 7 Medicaid enrollees received health center care, including seven states where at least 1 in 4 enrollees used health center services.
Even with increasing patient revenues, grant funding provides essential support for health centers.
Health centers’ total revenues grew from $15.9 billion in 2013 to $21.0 billion in 2015 (Figure 5), due to increases in both patient revenues and federal grant funding under Section 330. As health insurance expanded under the ACA, so did the share of health center revenues derived from insurance payments. In 2013, the year prior to the ACA coverage expansions, patients from public and private insurance accounted for 56% of health centers’ total revenues, with 40% coming from Medicaid. In 2015, insurance payments provided 61% of health centers’ total revenues – up five percentage points from 2013 – with increased Medicaid revenues making the largest difference. Even with higher patient revenues, Section 330 grants (18%) and other grants (13%) provided one-third of health centers’ total revenues in 2015.
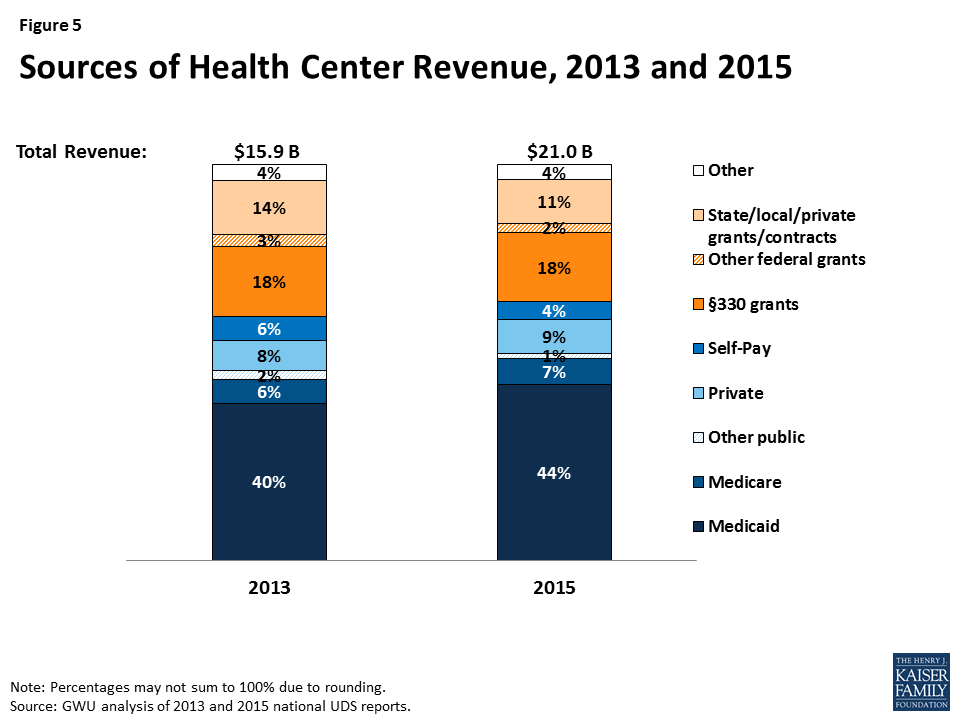
More than 70% of all Section 330 funding comes from the ACA health center trust fund, which Congress extended through September 30, 2017.7 Grant funding enables health centers to provide care for uninsured patients; provide services not covered by most insurance, such as adult dental care, transportation, translation services, and care management; and use sliding fees for privately insured patients who cannot afford their deductibles and cost-sharing.
Health Center Profile, by State Medicaid Expansion Status
coverage of health center patients
State Medicaid expansion decisions affect coverage of health center patients.
In 2015, half of all health center patients nationwide were covered by Medicaid, but those in Medicaid expansion states were more likely to be covered than those in non-expansion states – 55% compared to 34% (Figure 6). The difference largely reflects much broader Medicaid eligibility for adults in the expansion states. The rate of private insurance coverage was somewhat higher in health centers in non-expansion states than expansion states – 19% versus 16%. The higher private insurance rate in non-expansion states likely reflects, at least in part, subsidized marketplace coverage among patients with income between 100% and 138% FPL, who would have qualified for Medicaid instead in an expansion state. Analysis of average Medicaid and private coverage rates in health centers in expansion and non-expansion states show that differences are statistically significant (data not shown).
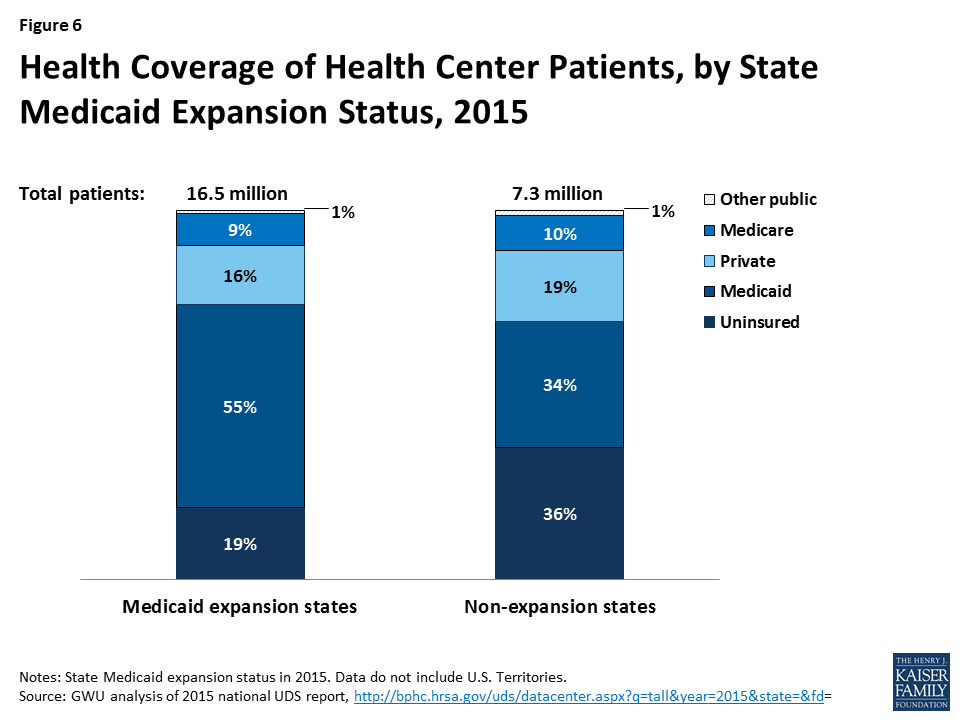
Health center patients in Medicaid non-expansion states are more likely to be uninsured.
Between very limited Medicaid eligibility for adults in non-expansion states and the unavailability of marketplace subsidies for individuals with income below 100% FPL, health center patients in non-expansion states are much more likely to be uninsured than their counterparts in expansion states. In 2015, more than 1 in 3 health center patients in non-expansion states were uninsured, compared to fewer than 1 in 5 in expansion states; a comparison between mean uninsured rates for health centers in expansion and non-expansion states provides evidence that they differ significantly (data not shown).
Health center revenues
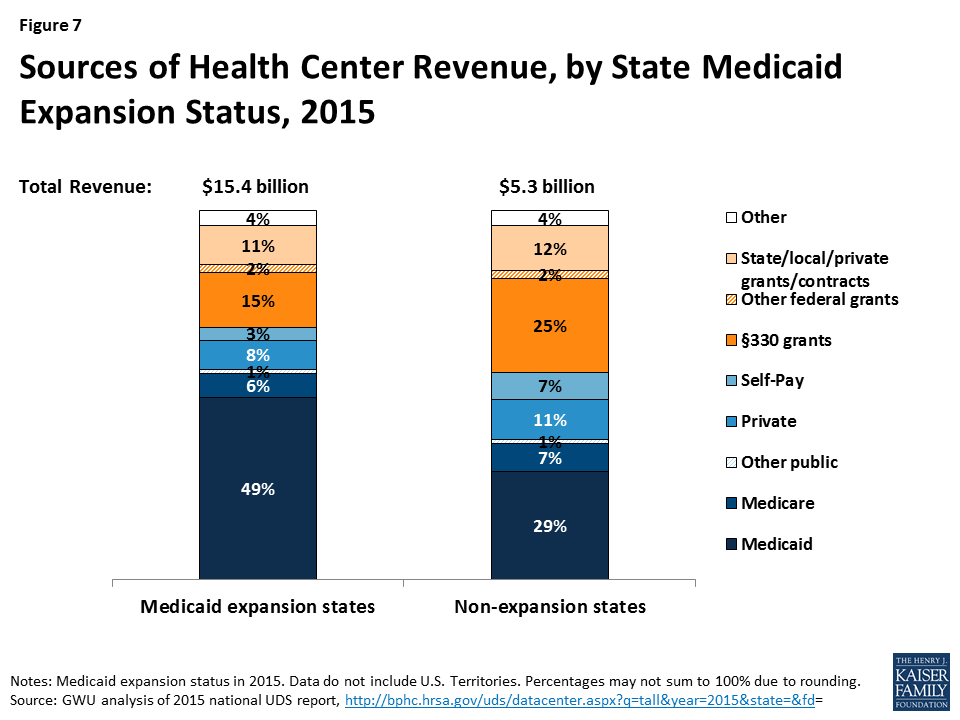
Health centers in Medicaid expansion states have higher total revenues, get more revenue from Medicaid, and rely less on grant funding than those in non-expansion states.
In 2015, health centers in Medicaid expansion states had total revenues of $15.4 billion, compared to $5.3 billion for those in non-expansion states (Figure 7). Health centers in expansion states received almost half their operating revenues from Medicaid. Federal Section 330 grants, the second-largest revenue source, provided 15%. In contrast, health centers in non-expansion states derived less than one-third (29%) of their revenues from Medicaid and depended on Section 330 grants for 25% of their revenues – almost as much as Medicaid provided. On average (Table 3), health centers in expansion states had significantly greater total revenues than those in non-expansion states – $18.4 million versus $10.4 million – as well as significantly higher revenue per patient ($586 versus $369) and Medicaid revenue per Medicaid patient ($800 versus $537).
Health centers in Medicaid expansion and non-expansion states report different patterns of revenue growth.
Our survey asked health centers about changes in revenue sources since January 1, 2015. In both expansion and non-expansion states, about three-quarters of health centers reported increased federal grant funding and about one-quarter reported increased state and local grants (Table 1). Nearly 80% of health centers in expansion states also reported Medicaid revenue growth, compared to 44% of those in non-expansion states.
| Table 1: Share of Health Centers Reporting Increased RevenuesSince January 1, 2015, by State Medicaid Expansion Status | ||
| Revenue source | Share of health centers reporting increase in revenue | |
| Medicaid expansion states | Medicaid non-expansion states | |
| Private capital | 17% | 17% |
| Federal grants | 76% | 75% |
| State and local grants | 25% | 27% |
| Medicaid revenue* | 79% | 44% |
| Private insurance revenue* | 45% | 56% |
| Family planning funding* | 7% | 12% |
| *Difference by state Medicaid expansion status is significant at p<.05.NOTE: Statistically significant result indicates that the distribution of health center responses (increased, decreased, no change, not applicable) was different in Medicaid expansion versus non-expansion states; only the share reporting increased revenues are shown. | ||
Fewer health centers (45%) in expansion states reported increased private insurance revenues, while 56% of those in non-expansion states reported an increase in this source; the larger share reporting increased private insurance revenues in non-expansion states may be due, at least in part, to marketplace coverage among patients with income between 100% and 138% FPL in these states. Notably, the share of health centers reporting increased family planning grant funding was greater in non-expansion states.
Many health centers report increased coverage lapses and underinsurance among their insured patients, which put pressure on health center finances.
Due, at least in part, to the larger number of insured health center patients, many health centers also report increased numbers of patients with coverage lapses (Table 2). Health centers in non-expansion states were significantly more likely to report increased coverage lapses since January 1, 2015, compared to health centers in Medicaid expansion states (49% versus 45%). Coverage lapses translate into increases in uninsured patients, a relative reduction in patient revenues, and greater reliance on grant funding to sustain health center capacity and services.
| Table 2: Share of Health Centers Reporting Increased Coverage Lapses and UnderinsuranceSince January 1, 2015, by State Medicaid Expansion Status | ||
| Coverage lapses and underinsurance | Share of health centers reporting an increase | |
| Medicaid expansion states | Medicaid non-expansion states | |
| Number of patients with a lapse or break in coverage* | 45% | 49% |
| Number of insured patients unable to pay their deductibles and cost-sharing | 55% | 64% |
| Proportion of privately insured patients who pay sliding scale fees* | 42% | 55% |
| *Difference by state Medicaid expansion status is significant at p<.05.NOTE: Statistically significant result indicates that the distribution of health center responses (increased, decreased, no change, not applicable) was different in Medicaid expansion versus non-expansion states; only the share reporting increased coverage lapses and underinsurance are shown. | ||
More than half of health centers in both expansion and non-expansion states reported increased numbers of insured patients who are unable to pay their deductibles and cost-sharing amounts – a form of underinsurance. One likely cause of this increase is the growth in the sheer number of privately insured patients, many of whom may find these costs difficult to afford on their low incomes. More than half (55%) of health centers in non-expansion states also reported an increase in the proportion of their privately insured patients who pay sliding fees; the share of health centers in expansion states that reported an increase was substantial but significantly smaller, at 42%.
Health Center Capacity and Access
Health centers in Medicaid expansion states have larger-scale operations and greater service capacity.
In 2015, health centers in Medicaid expansion states were located about evenly in rural and urban areas; they were more likely to be located in rural areas in non-expansion states (Table 3). Health centers in expansion states had 7.6 service sites on average, compared to 6.5 sites in non-expansion states. They served close to 40% more patients and provided 60% more visits on average than health centers in non-expansion states. In addition, health centers in expansion states reported significantly higher dental, mental health, and substance use treatment provider-to-patient ratios compared to health centers in non-expansion states.
| Table 3: Health Center Profile, by State Medicaid Expansion Status, 2015 | ||
| Health center profile | Medicaid expansion states | Medicaid non-expansion states |
| Health center characteristics | ||
| Location* | ||
| Rural | 49% | 63% |
| Urban | 51% | 37% |
| Size (mean) | ||
| Number of sites* | 7.6 | 6.5 |
| Patients* | 19,751 | 14,426 |
| Clinic visits* | 82,508 | 51,337 |
| Health center staffing (mean) | ||
| Medical FTEs per 10,000 patients | 36.1 | 27.6 |
| Dental FTEs per 10,000 patients* | 6.4 | 5.7 |
| Mental health FTEs per 10,000 patients* | 4.8 | 3.5 |
| Substance abuse FTEs per 10,000 patients* | 1.0 | 0.4 |
| Enabling services FTEs per 10,000 patients | 11.0 | 10.0 |
| Health center revenues | ||
| Total revenue* | $18,401,772 | $10,442,549 |
| Total revenue per patient* | $1,185 | $825 |
| Patient revenue per patient* | $586 | $369 |
| Medicaid revenue per Medicaid patient* | $800 | $537 |
| *Difference between Medicaid expansion and non-expansion states is significant at p<.05.SOURCE: GW analysis of 2015 UDS. | ||
Health centers in Medicaid expansion states were more likely than those in non-expansion states to report increases in certain staff and services capacity. Roughly 6 in 10 health centers in both Medicaid expansion and non-expansion states reported increased dental service capacity since January 1, 2015 (Table 4). A similar share in both groups of states also reported increased chronic care management capacity. Most health centers in expansion states had increased mental health services and staff since the start of 2015 (76% and 71%, respectively), and more than one-third (35%) had increased substance abuse treatment staff. The share of health centers in non-expansion states reporting increased capacity in these areas was significantly smaller – 66%, 55%, and 25%, respectively. Notably, however, health centers in non-expansion states were significantly more likely than those in expansion states to have increased family planning services (35% versus 25%).
Health centers have taken steps to expand access to care, but waits for appointments have increased, especially in Medicaid expansion states. Close to half of health centers in both expansion and non-expansion states reported an increased number of sites since January 1, 2015 (Table 5). A majority of health centers in expansion states also increased their hours of operation. Possibly reflecting increased demand for medical services as more patients gain coverage, about 40% of health centers in expansion states and 30% in non-expansion states reported increased waits for new patient appointments. Many health centers also reported longer wait times for follow-up appointments; this problem was significantly more prevalent in Medicaid expansion states than non-expansion states (34% versus 22%). Around 1 in 5 health centers in both expansion and non-expansion states reported an increase in other community providers serving the uninsured (data not shown), a factor that may mitigate demand for health center services.
| Table 4: Share of Health Centers Reporting Increased Service CapacitySince January 1, 2015, by State Medicaid Expansion Status | ||
| Type of service/capacity | Share of health centers reporting an increase | |
| Medicaid expansion states | Medicaid non-expansion states | |
| Dental services | 61% | 56% |
| Dental staff | 55% | 47% |
| Mental health services* | 76% | 66% |
| Mental health staff* | 71% | 54% |
| Substance use treatment services | 41% | 31% |
| Substance use treatment staff* | 35% | 25% |
| Chronic care management services | 60% | 58% |
| Vision care services | 19% | 15% |
| Vision care staff | 17% | 10% |
| Family planning services* | 25% | 35% |
| Family planning staff | 20% | 24% |
| Social services (e.g., housing, SNAP) | 34% | 35% |
| Increased use of telemedicine | 17% | 16% |
| *Difference by Medicaid expansion is significant at p<.05.NOTE: Statistical significance indicates that the distribution of possible responses (increased, decreased, no change, not applicable) was different between health centers in Medicaid expansion and non-expansion states. Only the percentages reporting “increased” are shown. | ||
| Table 5: Share of Health Centers Reporting Change in Selected Measures of AccessSince January 1, 2015, by State Medicaid Expansion Status | ||
| Measure of access | Share of health centers reporting the change | |
| Medicaid expansion states | Medicaid non-expansion states | |
| Expanded access | ||
| Increased number of sites | 47% | 44% |
| Increased hours of operation* | 56% | 44% |
| Increased days of operation/week | 25% | 24% |
| Increased pressure on access | ||
| Increased waits for new patient appointments | 38% | 29% |
| Increased waits for follow-up appointments* | 34% | 22% |
| Increased waits in the waiting room | 17% | 18% |
| *Difference by Medicaid expansion is significant at p<.05.NOTE: Statistical significance indicates that the distribution of possible responses (increased, decreased, no change, not applicable) was different between health centers in Medicaid expansion and non-expansion states. Only the percentages reporting “increased” are shown. | ||
HEALTH CENTER CHALLENGES
The survey provided respondents with a list of issues and asked them to identify and rank the three that are most challenging for their health center. Workforce recruitment is the challenge health centers most often included in their top-three lists, with a majority in both expansion and non-expansion states mentioning it; workforce retention also made the top-three for more than one-third of health centers (Table 6). Workforce recruitment and retention were significantly more likely to be among the top three challenges identified by health centers in Medicaid expansion states, compared to health centers in non-expansion states.=
| Table 6: Share of Health Centers Ranking Selected Factors Among Their Top Three Challenges,by State Medicaid Expansion Status | ||
| Factor Reported as Top-Three Challenge | Medicaid expansion states | Medicaid non-expansion states |
| Workforce recruitment* | 75% | 64% |
| Workforce retention* | 49% | 36% |
| Insufficient insurance reimbursement | 40% | 42% |
| Insufficient grant funding | 27% | 29% |
| High numbers of uninsured patients* | 21% | 58% |
| Competition from other providers | 26% | 26% |
| Integrating care provided by the health center with care provided by other providers* | 37% | 26% |
| *Difference by Medicaid expansion is significant at p<.05. | ||
Perhaps not surprisingly, health centers in expansion and non-expansion states ranked having a high number of uninsured patients differently. Likely reflecting their patients’ much higher uninsured rates and their more limited patient revenues, well over half (58%) of health centers in non-expansion states identified high numbers of uninsured patients as a top-three challenge, compared to 1 in 5 in Medicaid expansion states.
Notwithstanding the very different health insurance environments in which they operate, about 40% of health centers in both expansion and non-expansion states cited insufficient insurance reimbursement as one of their top three challenges. Also, roughly one-quarter of health centers in both groups of states named insufficient grant funding as a top-three challenge.
Discussion
As the ACA enters a period of uncertainty, health centers offer a window into what the ACA has meant for many of the nation’s poorest communities. Increased access to affordable health insurance has led to marked gains in coverage among health center patients, particularly in Medicaid expansion states, and increased direct investment in health centers has led to expanded primary care capacity and access to services. Over a two-year period, health centers were able to add 2.6 million patients – an increase of more than 10% – and expand services such as oral health and mental health treatment, for which there is great need. Notably, even with the progress in coverage, 1 in 4 health center patients remains uninsured, and many insured patients need help with cost-sharing and non-covered services. Thus, grant funding for health centers has continued to be essential both to finance care for uninsured patients and to subsidize insured patients who face high out-of-pocket costs, limited benefits, or both.
The findings from this analysis document the growth in health center patient coverage and health center capacity to serve low-income communities following implementation of the ACA. By extension, the findings also suggest what would be at risk in these communities if the ACA were to be repealed. Increased numbers of uninsured patients, together with the loss of Medicaid revenues associated with the Medicaid expansion and most federal grant funding, would be a severe financial shock to health centers and likely leave them unable to sustain their operations and capacity at current levels. The contraction of health centers would likely leave the most medically underserved urban and rural communities in the nation – for which the health center program was created – with reduced access to comprehensive primary health care.
Additional funding support for this paper was provided to The George Washington University by the RCHN Community Health Foundation.
Endnotes
- Status of State Action on the Medicaid Expansion Decision, Kaiser State Health Facts, Kaiser Family Foundation, https://modern.kff.org/health-reform/state-indicator/state-activity-around-expanding-medicaid-under-the-affordable-care-act/?currentTimeframe=0 ↩︎
- Shin P et al., Assessing the Potential Impact of State Policies on Community Health Centers’ Outreach and Enrollment Activities, Policy Research Brief No. 35, Geiger Gibson/RCHN Community Health Foundation Research Collaborative, George Washington University, 2014, http://www.rchnfoundation.org/?p=3814; and Health Center Patient Trends, Activities, and Service Capacity: Recent Experience in Medicaid Expansion and Non-Expansion States, Kaiser Commission on Medicaid and the Uninsured, 2015, https://modern.kff.org/medicaid/issue-brief/health-center-patient-trends-enrollment-activities-and-service-capacity-recent-experience-in-medicaid-expansion-and-non-expansion-states/ ↩︎
- The total number of health centers reporting into the UDS in 2015 was 1,375, exceeding the total in 2014. ↩︎
- State Decisions on Health Insurance Marketplaces and the Medicaid Expansion, State Health Facts, Kaiser Family Foundation, https://modern.kff.org/health-reform/state-indicator/state-decisions-for-creating-health-insurance-exchanges-and-expanding-medicaid/?currentTimeframe=0 ↩︎
- 2015 Poverty Guidelines for the 48 Contiguous States and the District of Columbia, Office of The Assistant Secretary for Planning and Evaluation, U.S. Department of Health and Human Services, 2015, https://aspe.hhs.gov/2015-poverty-guidelines ↩︎
- Barnett J and M Vornovitsky, Health Insurance Coverage in the United States: 2015, U.S. Census Bureau, 2016, https://www.census.gov/content/dam/Census/library/publications/2016/demo/p60-257.pdf ↩︎
- Section 330 Health Center Grant Funds: Two Sources Combine to Form One Program, National Association of Community Health Centers, http://www.saveourchcs.org/client/CHC%20Mandatory%20Discretionary%20Explainer.pdf ↩︎