
Being Low-Income and Uninsured in Missouri: Coverage Challenges during Year One of ACA Implementation
Executive Summary
Introduction
In January 2014, the major coverage provisions of the 2010 Affordable Care Act (ACA) went into full effect. These provisions include the creation of a new Health Insurance Marketplace where people can purchase coverage and middle income families can receive premium tax credits to offset the cost. In Missouri, the federal government is operating the Marketplace, as the state decided to not operate its own. The ACA also included an expansion of Medicaid to cover low-income adults, but the Supreme Court’s 2012 ruling effectively made Medicaid expansion optional for states. As of May 2015, Missouri had not expanded its Medicaid program, known as MO HealthNet, to cover more adults under the ACA. As a result of this decision, many low-income adults in Missouri remain without affordable health insurance options. Using findings from the 2014 Kaiser Survey of Low-Income Americans and the ACA, this report examines the uninsured population who would largely be eligible for Medicaid if Missouri were to expand. Specifically, it focuses on the low-income uninsured in Missouri, comparing who they are, their access to health care, and their financial situation to those enrolled in Missouri’s Medicaid program and to the low-income privately insured. It also examines why low-income uninsured adults in the state remain uninsured and their options for gaining coverage in 2015.
Key Findings
Who Are the Low-Income Uninsured in Missouri?
Because coverage options for the low-income uninsured in Missouri are largely the same as before the ACA, few people gained coverage in 2014, and the profile of the low-income population without coverage is largely the same as it was before the ACA. As in the past, being uninsured is a long-term problem: seven in ten of the low-income uninsured report having been uninsured for more than one year. The majority of the low-income uninsured are non-Hispanic White, about half are male, and the majority are under 35. About four in ten low-income uninsured have dependent children, as does about four in ten low-income privately insured, but the children of the low-income privately insured are more likely to be insured. Low-income uninsured adults are more likely to report having poorer health than the low-income privately insured, and they are also more likely to have unmet health needs.
How Do the Low-Income Uninsured Access Care?
As in the past, where we found that low-income adults without coverage in Missouri continue to lag behind their insured counterparts in access to care, this year’s survey findings continue to show access barriers among uninsured adults in the state. The low-income uninsured are less likely than MO HealthNet enrollees or the low-income privately insured to report having a usual source of care or to have a regular doctor at a usual source of care, indicating that they are less likely to be linked to care than others. The low-income uninsured also use medical care at lower rates and ultimately go without needed care more frequently than those enrolled in MO HealthNet or the low-income privately insured. When uninsured adults do receive care, clinics and health centers are an important source of care for them: of those with a usual source of care, four in ten usually go to a doctor’s office or HMO1 for their care, and about four in ten go to a clinic or health center.
How Does Coverage Affect Financial Security?
Although all low-income people in the state experience varying degrees of financial insecurity, low-income uninsured adults’ financial insecurity is exacerbated by their lack of insurance. The low-income uninsured report higher rates of having problems paying medical bills than those enrolled in MO HealthNet or the low-income privately insured. Although many of those enrolled in MO HealthNet are generally financially insecure, only a third are not confident they can afford usual medical costs and only a third are not confident they can afford major medical costs. By contrast, over three quarters of the low-income uninsured are not confident they can afford usual medical costs, and close to nine out of ten are not confident that they can afford major medical costs. This worry has an effect on people’s well-being: a third of the low-income uninsured report that worry about medical costs affected their job performance, family relationships, or ability to sleep.
Why Are People Still Uninsured and What Are Their Coverage Options?
The majority of low-income uninsured adults say that the main reason they remain uninsured is because of cost. Fewer low-income uninsured in Missouri than a year ago say the main reason they are uninsured because of job-related reasons, such as not being employed or not being eligible for employer provided coverage. Nearly half of low-income uninsured adults tried to obtain MO HealthNet or Marketplace insurance in 2014, but most were told they were ineligible or found the coverage available to be unaffordable. The majority of the low-income uninsured are not eligible for employer sponsored coverage, either because they do not work, their employer doesn’t offer coverage, or they are not eligible for employer sponsored coverage, leaving them with few options for affordable coverage in 2015. Few low-income uninsured adults said they thought they would gain coverage in the upcoming year.
Policy Implications
The survey findings indicate that many low-income uninsured sought insurance coverage in 2014 but found few affordable options. The majority are not eligible for coverage through an employer, even though most are in a working family. Purchasing non-group coverage is the only remaining option for most, but those under the poverty level are ineligible for subsidies in the Marketplace. As a result, insurance remains too expensive for many. However, uninsured adults in the state still have health needs, many of which are not being adequately met, and will continue to face financial hardship in meeting those needs without a source of coverage.
Without the Medicaid expansion, the safety net remains an important source of care for the uninsured in the state. However, these providers face the possibility of revenue cuts in the future. Disproportionate Share Hospital (“DSH”) funding to hospitals will decline starting in 2018, without the expected balance of an increase in the number of Medicaid patients. Further, the Supreme Court decision in King v. Burwell may eliminate subsidies for people covered through the federal marketplace, leaving community clinics with less revenue if privately insured patients cannot afford insurance without subsidies. Ultimately this strain may limit the amount of care that the safety net can provide to the uninsured. If coverage options remain limited for low-income individuals in the state, it will be important to continue to monitor the ability of the uninsured to access services and the capacity and fiscal stability of the providers that serve them.
Lastly, the survey indicates some areas of improvement for MO HealthNet as it exists now. Some low-income uninsured reported that their insurance application was still pending as of Fall 2014, serving as a reminder of the importance of a streamlined application system. In addition, the survey shows MO HealthNet enrollees are linked to and use the health care system, but about half have encountered delays in needed services. While most ultimately do receive the care that they need, ensuring timely access to needed services is an important policy goal in making sure Medicaid works for the people it covers.
Report
Introduction
In January 2014, the major coverage provisions of the 2010 Affordable Care Act (ACA) went into full effect in Missouri and across the country. These provisions include the creation of a new Health Insurance Marketplace where people can purchase coverage and middle income families (between about $27,300 and $79,200 for a family of three in 2014) can receive premium tax credits to offset the cost. In Missouri, the federal government is operating the Marketplace through the healthcare.gov portal, as the state decided to not operate its own. Under the ACA, the Medicaid expansion was intended to be the means of providing affordable coverage to low-income adults (about $27,300 or less for a family of three in 2014), but the Supreme Court’s 2012 ruling in NFIB v. Sebelius effectively made Medicaid expansion optional for states. As of May 2015, Missouri had not expanded its Medicaid program, known as MO HealthNet. As a result of this decision, many low-income adults in Missouri remain without affordable health insurance options.
The majority (64%) of adults who remain without insurance coverage in Missouri are in the income range for Medicaid expansion. There is no deadline for the state to opt to expand its Medicaid program, and many in the state continue to argue for expansion. To inform this debate, this report uses the 2014 Kaiser Survey of Low-Income Americans and the ACA to profile who the low-income uninsured adults in Missouri are, what their health care access and financial security experiences have been, and why they remain uninsured. Findings from the 2013 Kaiser Survey of Low-Income Americans and the ACA, fielded prior to the start of open enrollment for 2014 Marketplace coverage, provided a baseline snapshot of health insurance coverage, health care use and barriers to care, and financial security among the insured and uninsured adults at the starting line of ACA implementation and discussed how those findings could inform early implementation.1 The 2013 survey included both a national sample and a Missouri sample, funded by the Missouri Foundation for Health. In the fall of 2014, we conducted a second wave of the Kaiser Survey of Low-Income Americans and the ACA nationally and in Missouri (again with support from the Missouri Foundation for Health) to understand how these factors changed under the first year of the law’s main coverage provisions. The survey, which included a state-representative sample of 1,864 nonelderly (age 19-64) Missouri adults, was conducted between September 2 and December 15, 2014, with the majority of interviews (68%) conducted prior to November 15, 2014 (the start of open enrollment for 2015 Marketplace coverage; Medicaid enrollment is open throughout the year).
To provide a meaningful comparison for the low-income uninsured in the state, we compare their experience to that of other low-income populations. Specifically, we compare the uninsured with incomes at or below 138% of poverty (“the low-income uninsured”) to enrollees in Missouri’s Medicaid program, also known as “MO HealthNet,” the program that would serve most uninsured adults should the state expand Medicaid. Most (79%) MO HealthNet enrollees have incomes below 138% of poverty. In stark contrast, however, only about one in ten (11%) of the privately insured in Missouri have family incomes at or below 138% of poverty. Thus, in comparisons to the privately insured, we restrict the analysis to the privately insured with incomes at or below 138% of poverty (“the low-income privately insured”). Additional tables provide parallel results for insured and uninsured individuals in higher income groups. A full description of the methods underlying the survey and analysis are available online.
Background: ACA Implementation in Missouri
In 2013, the last year before open enrollment, 5,001,000 non-elderly adults lived in Missouri, 12% of whom were uninsured.1 Although this rate was below the national average, Missouri faces disparities in health insurance and access to care. One in three people in Missouri live in a primary care health professional shortage area. About a third (37%) of the Missouri population lives in a rural setting, where poverty rates are higher than in cities, and many do not have access to employer sponsored coverage. In addition, a large percentage of the uninsured in Missouri live in St. Louis and Kansas City, the two largest cities in the state.2 In 2014, the St. Louis area was the setting for protests and riots following the shooting death of unarmed teenager Michael Brown. Along with many other important issues, these protests have brought attention to the economic disparities existing in these communities and the consequences of these disparities, which include the health and well-being of their residents.3
Medicaid and the Safety Net
MO HealthNet, Missouri’s Medicaid program, currently provides coverage to low-income children, some of their parents, pregnant women, the elderly, and individuals with disabilities. Prior to the ACA, all states expanded eligibility levels for children to levels beyond that for adults. In Missouri, children with family incomes up to 305% of poverty (about $60,400 for a family of three in 2014) are eligible for coverage through Medicaid or the Children’s Health Insurance Program (CHIP). Eligibility for adults is limited to those with dependent children with incomes below 23% of poverty (about $4,600 for a family of three in 2014), one of the lowest eligibility levels in the nation. The Medicaid eligibility level for adults has remained low since 2005, when Missouri lowered eligibility levels amidst great debate in response to an economically-driven budget shortfall.4 Non-disabled adults without dependent children remain ineligible for Medicaid at any level. As in all states, regardless of whether or not they have expanded Medicaid, undocumented immigrants are ineligible for Medicaid under federal rules. The state did enact the option to cover income-eligible pregnant women regardless of immigration status through CHIP’s unborn child option, called “Show-Me Healthy Babies,” though this program was not implemented as of April 2015.
The uninsured in Missouri continue to rely on safety-net services when they need care. Most notably, the city and county of St. Louis provide funding to health centers and clinics through an 1115 Medicaid waiver, known as Gateway to Better Health. Through the waiver, uninsured nonelderly adults who live within the City and County limits, and who are not eligible for Medicaid, Medicare, or the Marketplace, are able to access primary and specialty care.5
ACA Medicaid Expansion and the Marketplace
Although the ACA envisioned providing insurance to the low-income population through Medicaid expansion, the Supreme Court’s ruling in June 2012 effectively made this optional to the states. Missouri has not expanded its MO HealthNet program under the ACA. Governor Jay Nixon supports the expansion, but faces opposition in the Missouri General Assembly, where a number of legislators oppose any form of expansion. Opposition arguments have centered on reforming Medicaid before expanding it and lack of trust that the Federal government would provide funding at the levels promised.6 However, many in the state continue to advocate for expansion, including the Missouri Hospital Association. Arguments in favor of expansion focus on extending coverage to the uninsured, financial support for rural hospitals (particularly in light of upcoming cuts in Disproportionate Share Hospital funding7), and the economic benefits of new jobs in Missouri.
Because Missouri opted not to operate its own Marketplace, the federal government operates the Marketplace in the state.8 On March 4, 2015, the Supreme Court heard arguments in King v. Burwell challenging the legality of subsidies to people who purchased insurance through Federally-run Marketplaces. The Supreme Court will provide their ruling by the end of their term in June 2015. If they rule in favor of the plaintiffs, individuals who purchased coverage through the Marketplace with a subsidy would lose that subsidy, likely making such coverage unaffordable for them. Additionally, the employer requirement for coverage under the ACA, which goes into effect in 2015 and requires firms with more than 50 workers to pay a penalty if they do not offer affordable coverage and an employee purchases subsidized coverage through the Marketplace, would be nullified.9
Outreach and Enrollment in 2014
Like many other states, before open enrollment for 2014 coverage began, the Missouri General Assembly passed legislation creating requirements for outreach and enrollment workers, known as navigators. While these requirements were struck down by a Federal judge in January 2014, the legislature has continued to propose or pass legislation that navigators must pass exams, secure bonds, and pass background checks.10 Despite this climate and limited funding, advocates and other state organizations worked to enroll those eligible for coverage.11
On October 1, 2013, open enrollment for 2014 coverage began, but in the first few months, people experienced numerous technical difficulties with the Federal Marketplace website. By the end of open enrollment in 2014, 152,335 people had enrolled in Marketplace coverage in Missouri, accounting for 24% of the Missouri Marketplace eligible, a little below the national average of 28% of Marketplace eligible enrolling.12 Enrollment rates varied within the state, tending to be higher in urban and suburban areas than in rural areas.13
The federal government sends applications for enrollees ineligible for Marketplace enrollment to the state to determine Medicaid eligibility. However, in 2014, there were problems synchronizing the two websites. The Missouri Department of Social Services reported receiving 56,000 applications for MO HealthNet in PDF form that needed to be entered by hand. Most of these applications were deemed ineligible for MO HealthNet, but this influx of applications led in part to a backlog.14 In July of 2014, CMS announced that they would be monitoring the backlog of Medicaid applications in Missouri as well as five other states.15 Missouri has worked to resolve these issues, and as of February 2015, the state reported that there were 14,000 applications waiting to be reviewed, which Missouri Social Services deems to be close to an acceptable case-load.16 Regardless, monthly MO HealthNet enrollment has remained relatively low, increasing by 3.5 percent since before the ACA, as of February 2015.17 It is possible that some of this slow enrollment growth is explained by the recovering economy.18
Who are the low-income uninsured in Missouri?
Because coverage options for the low-income uninsured in Missouri are largely the same as before the ACA, few people gained coverage in 2014, and the profile of the low-income population without coverage is largely the same as it was before the ACA. As in the past, being uninsured is a long-term problem: seven in ten of the low-income uninsured report having been uninsured for more than one year. The majority of the low-income uninsured are non-Hispanic White, about half are male, and the majority are under 35. About four in ten low-income uninsured have dependent children, as does about four in ten low-income privately insured, but the children of the low-income privately insured are more likely to be insured.
The uninsured have been without coverage for long periods of time. While some people experience short spells of uninsurance due to job changes or other changes in life circumstances, as was the case before the ACA,1 lack of coverage is a chronic problem for most low-income uninsured adults. Only about a quarter of the low-income uninsured (27%) was uninsured for less than one year. Three in ten were uninsured for one to five years, about three in ten (29%) were uninsured for more than five years but have had coverage in the past, and about one in ten had never been insured (see Additional Table A1). As discussed below, most low-income adults have few options for affordable coverage.
Reflecting the general demographics of the state, the majority of the low-income uninsured population is non-Hispanic and White. About 70 percent of the low-income uninsured are non-Hispanic Whites. Similarly, about 70 percent of MO HealthNet enrollees and of the low-income privately insured are non-Hispanic Whites. Though non-Hispanic Black adults account for about 11% of the overall adult population in the state, about 20% of each of the coverage groups is comprised of non-Hispanic Blacks (Figure 1). This pattern reflects the link between race and income, since Black adults in the state are more likely to be low-income than adults of other race/ethnicities (data not shown).
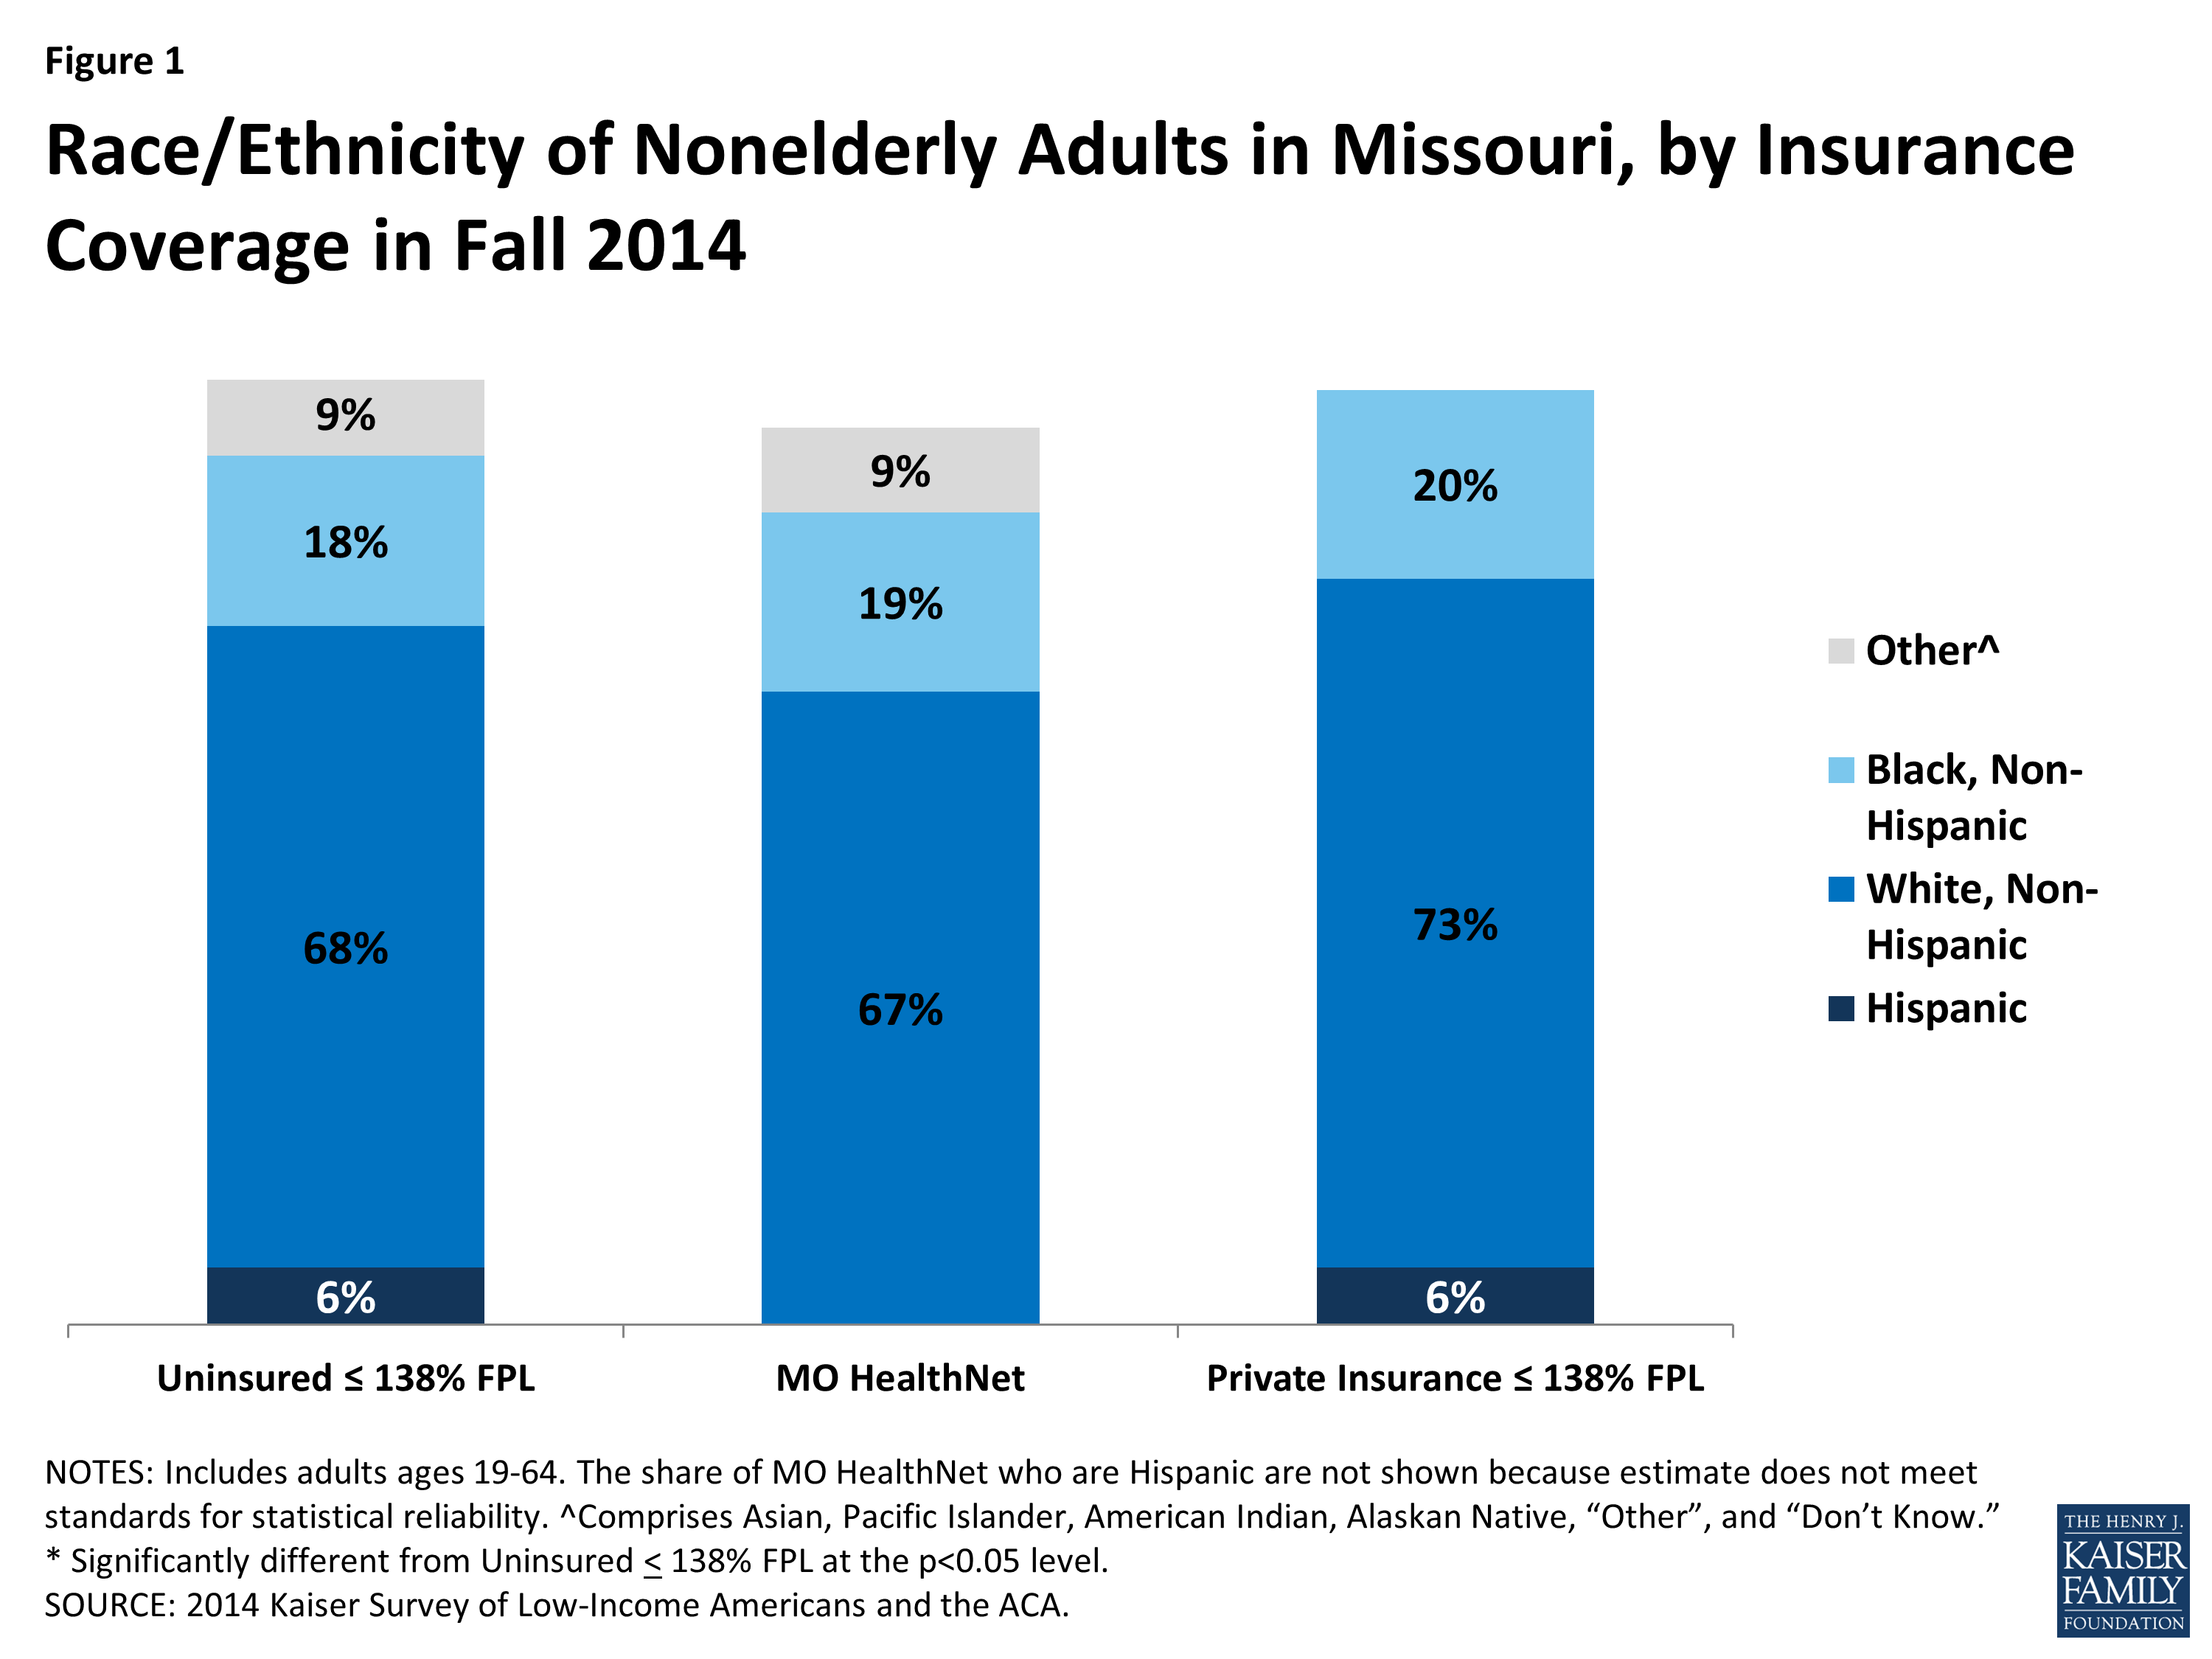
Figure 1: Race/Ethnicity of Nonelderly Adults in Missouri, by Insurance Coverage in Fall 2014
About half of the low-income uninsured are male. A slight majority (52%) of the low-income uninsured are male. In contrast, only a third (32%) of MO HealthNet enrollees are male, as women are more likely to meet family-related eligibility criteria such as being pregnant or being a caretaker parent (Figure 2). Male adults without children may obtain MO HealthNet eligibility through a disability pathway. Women make up about six in ten (61%) of the low-income privately insured, but this share is not significantly different from the uninsured.
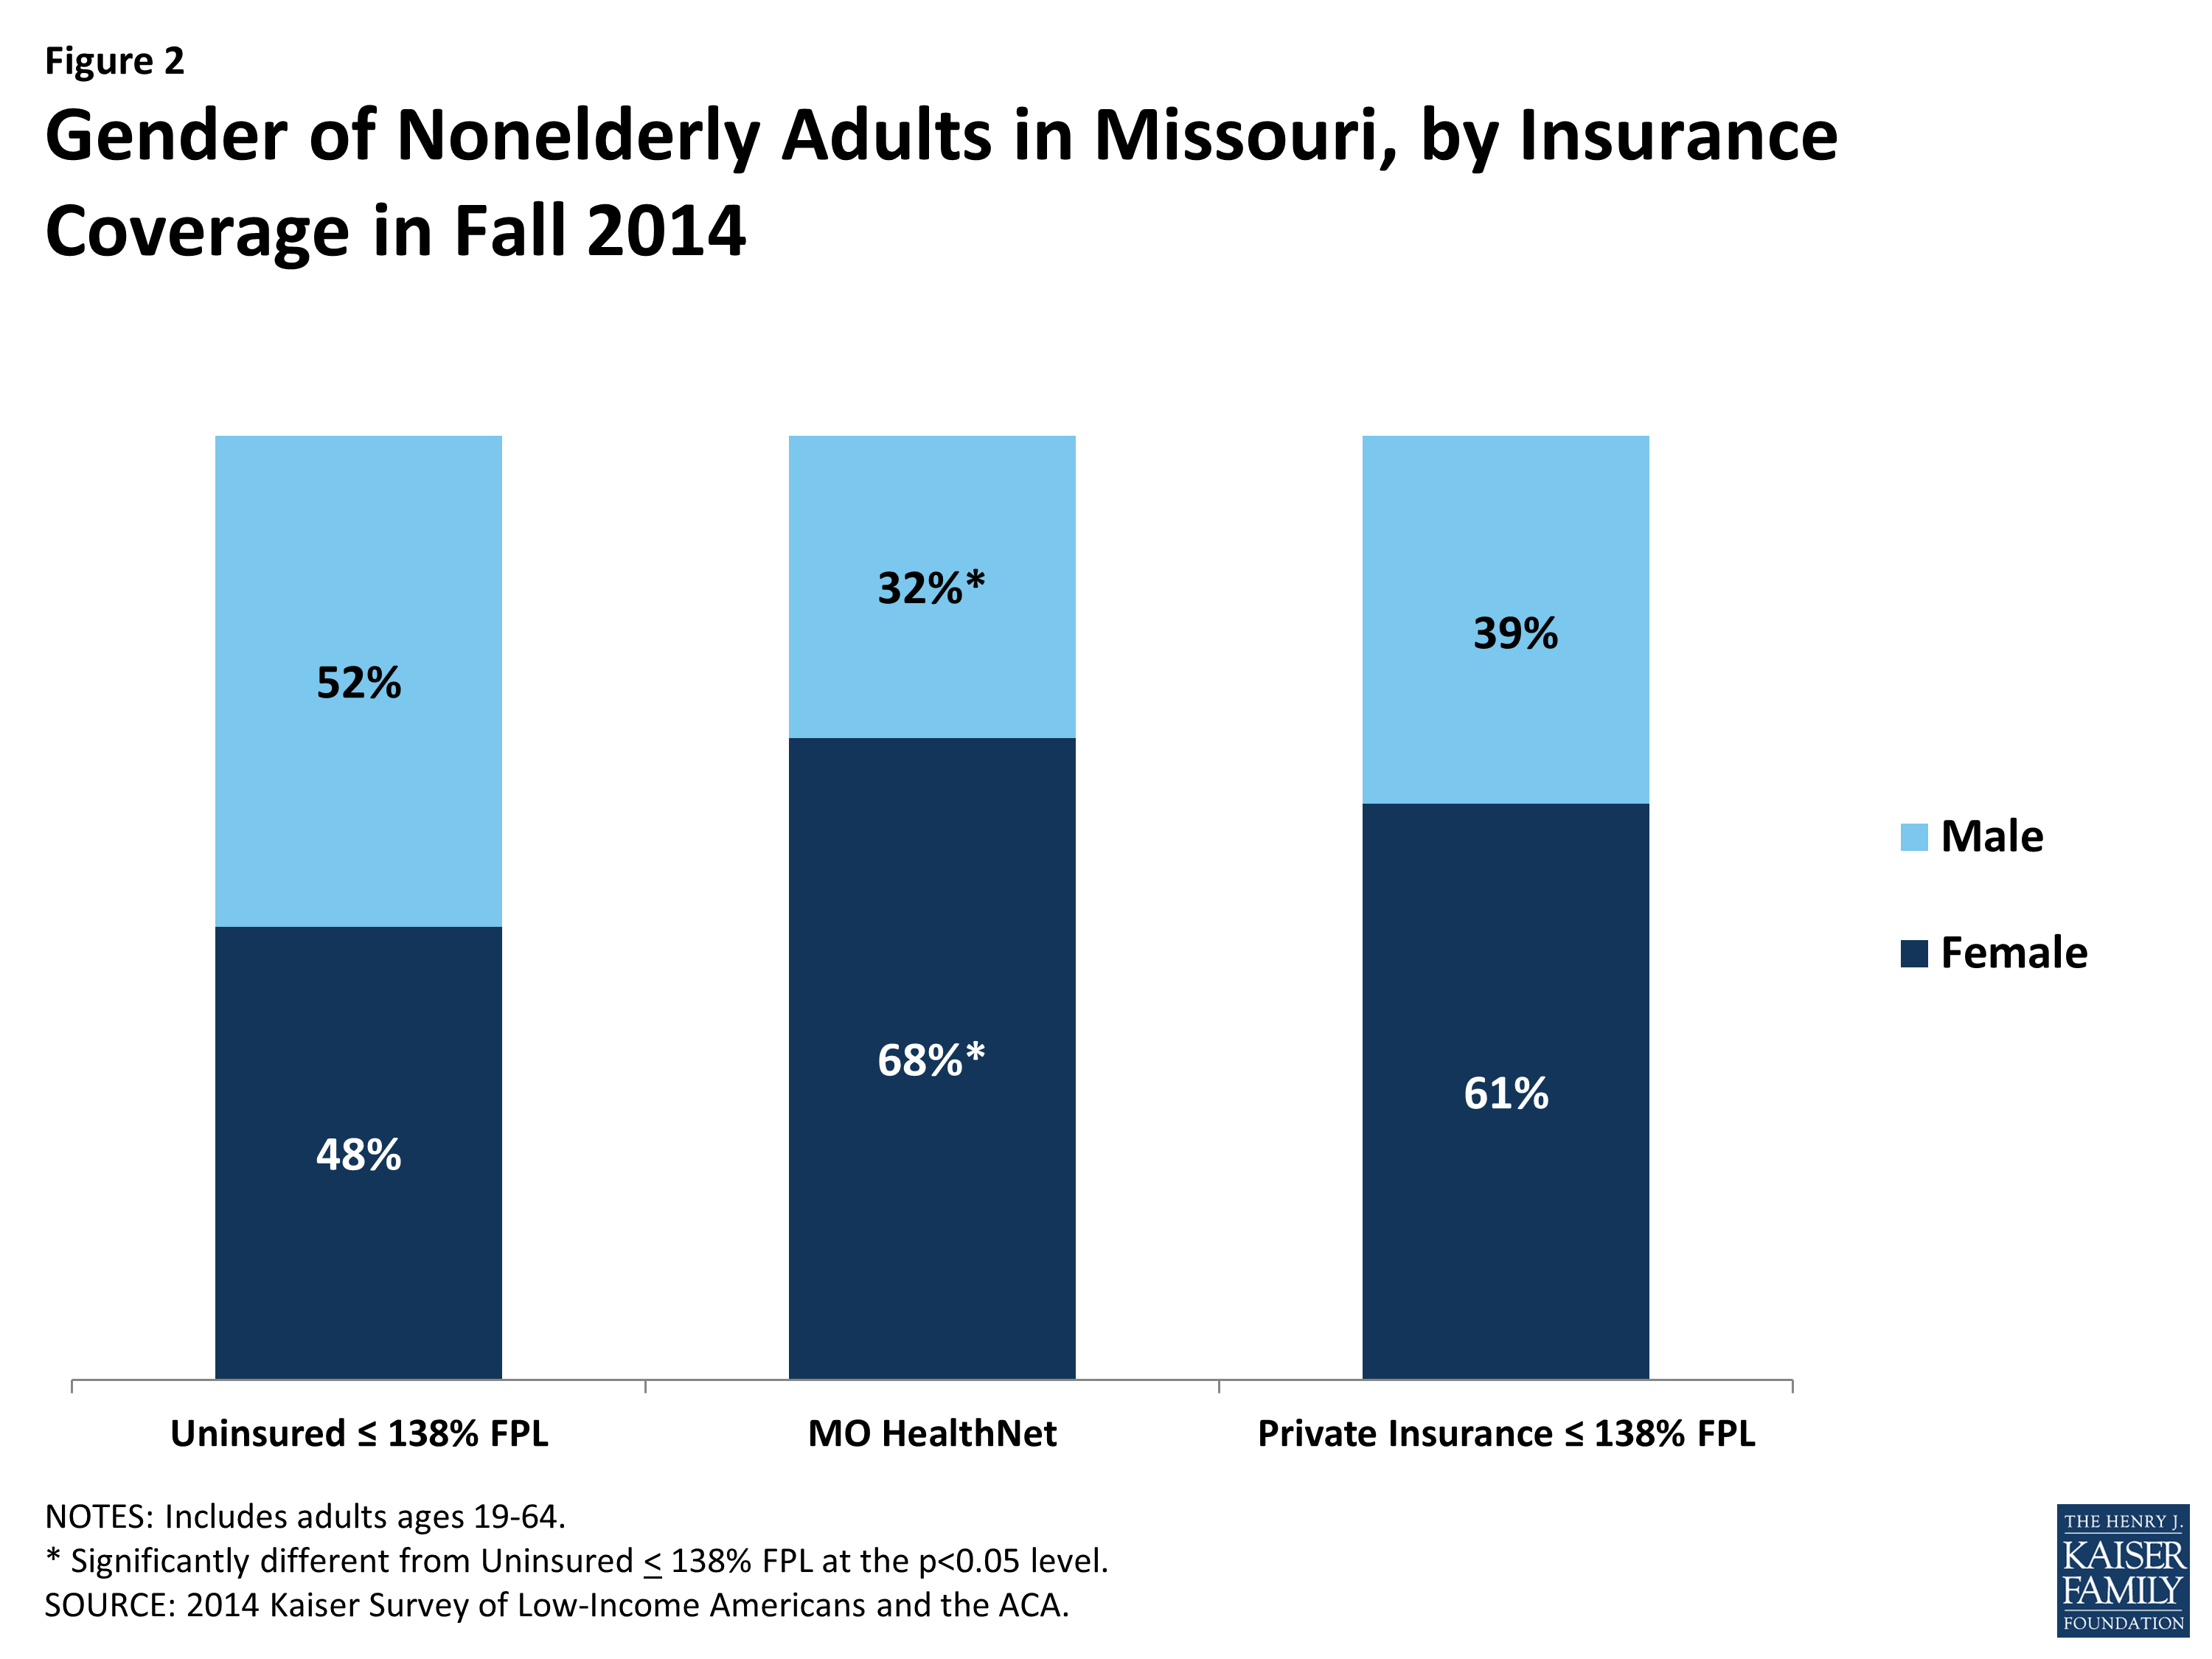
Figure 2: Gender of Nonelderly Adults in Missouri, by Insurance Coverage in Fall 2014
The majority (62%) of low-income uninsured are under the age of 35. Only 22 percent of the low-income uninsured are ages 45-64, compared with 60 percent of those enrolled in MO HealthNet (Figure 3). Although not statistically different from the low-income uninsured, nearly a third of the low-income privately insured are ages 45-64. Younger adults have looser ties to employment than older adults and thus are more likely to be low-income or in jobs with limited benefits. Additionally, though the uninsured tend to be thought of as the “young invincibles,” the majority (60%) of the mid-income uninsured, most of whom are eligible for subsidies, are over 35 (see Additional Table A1).
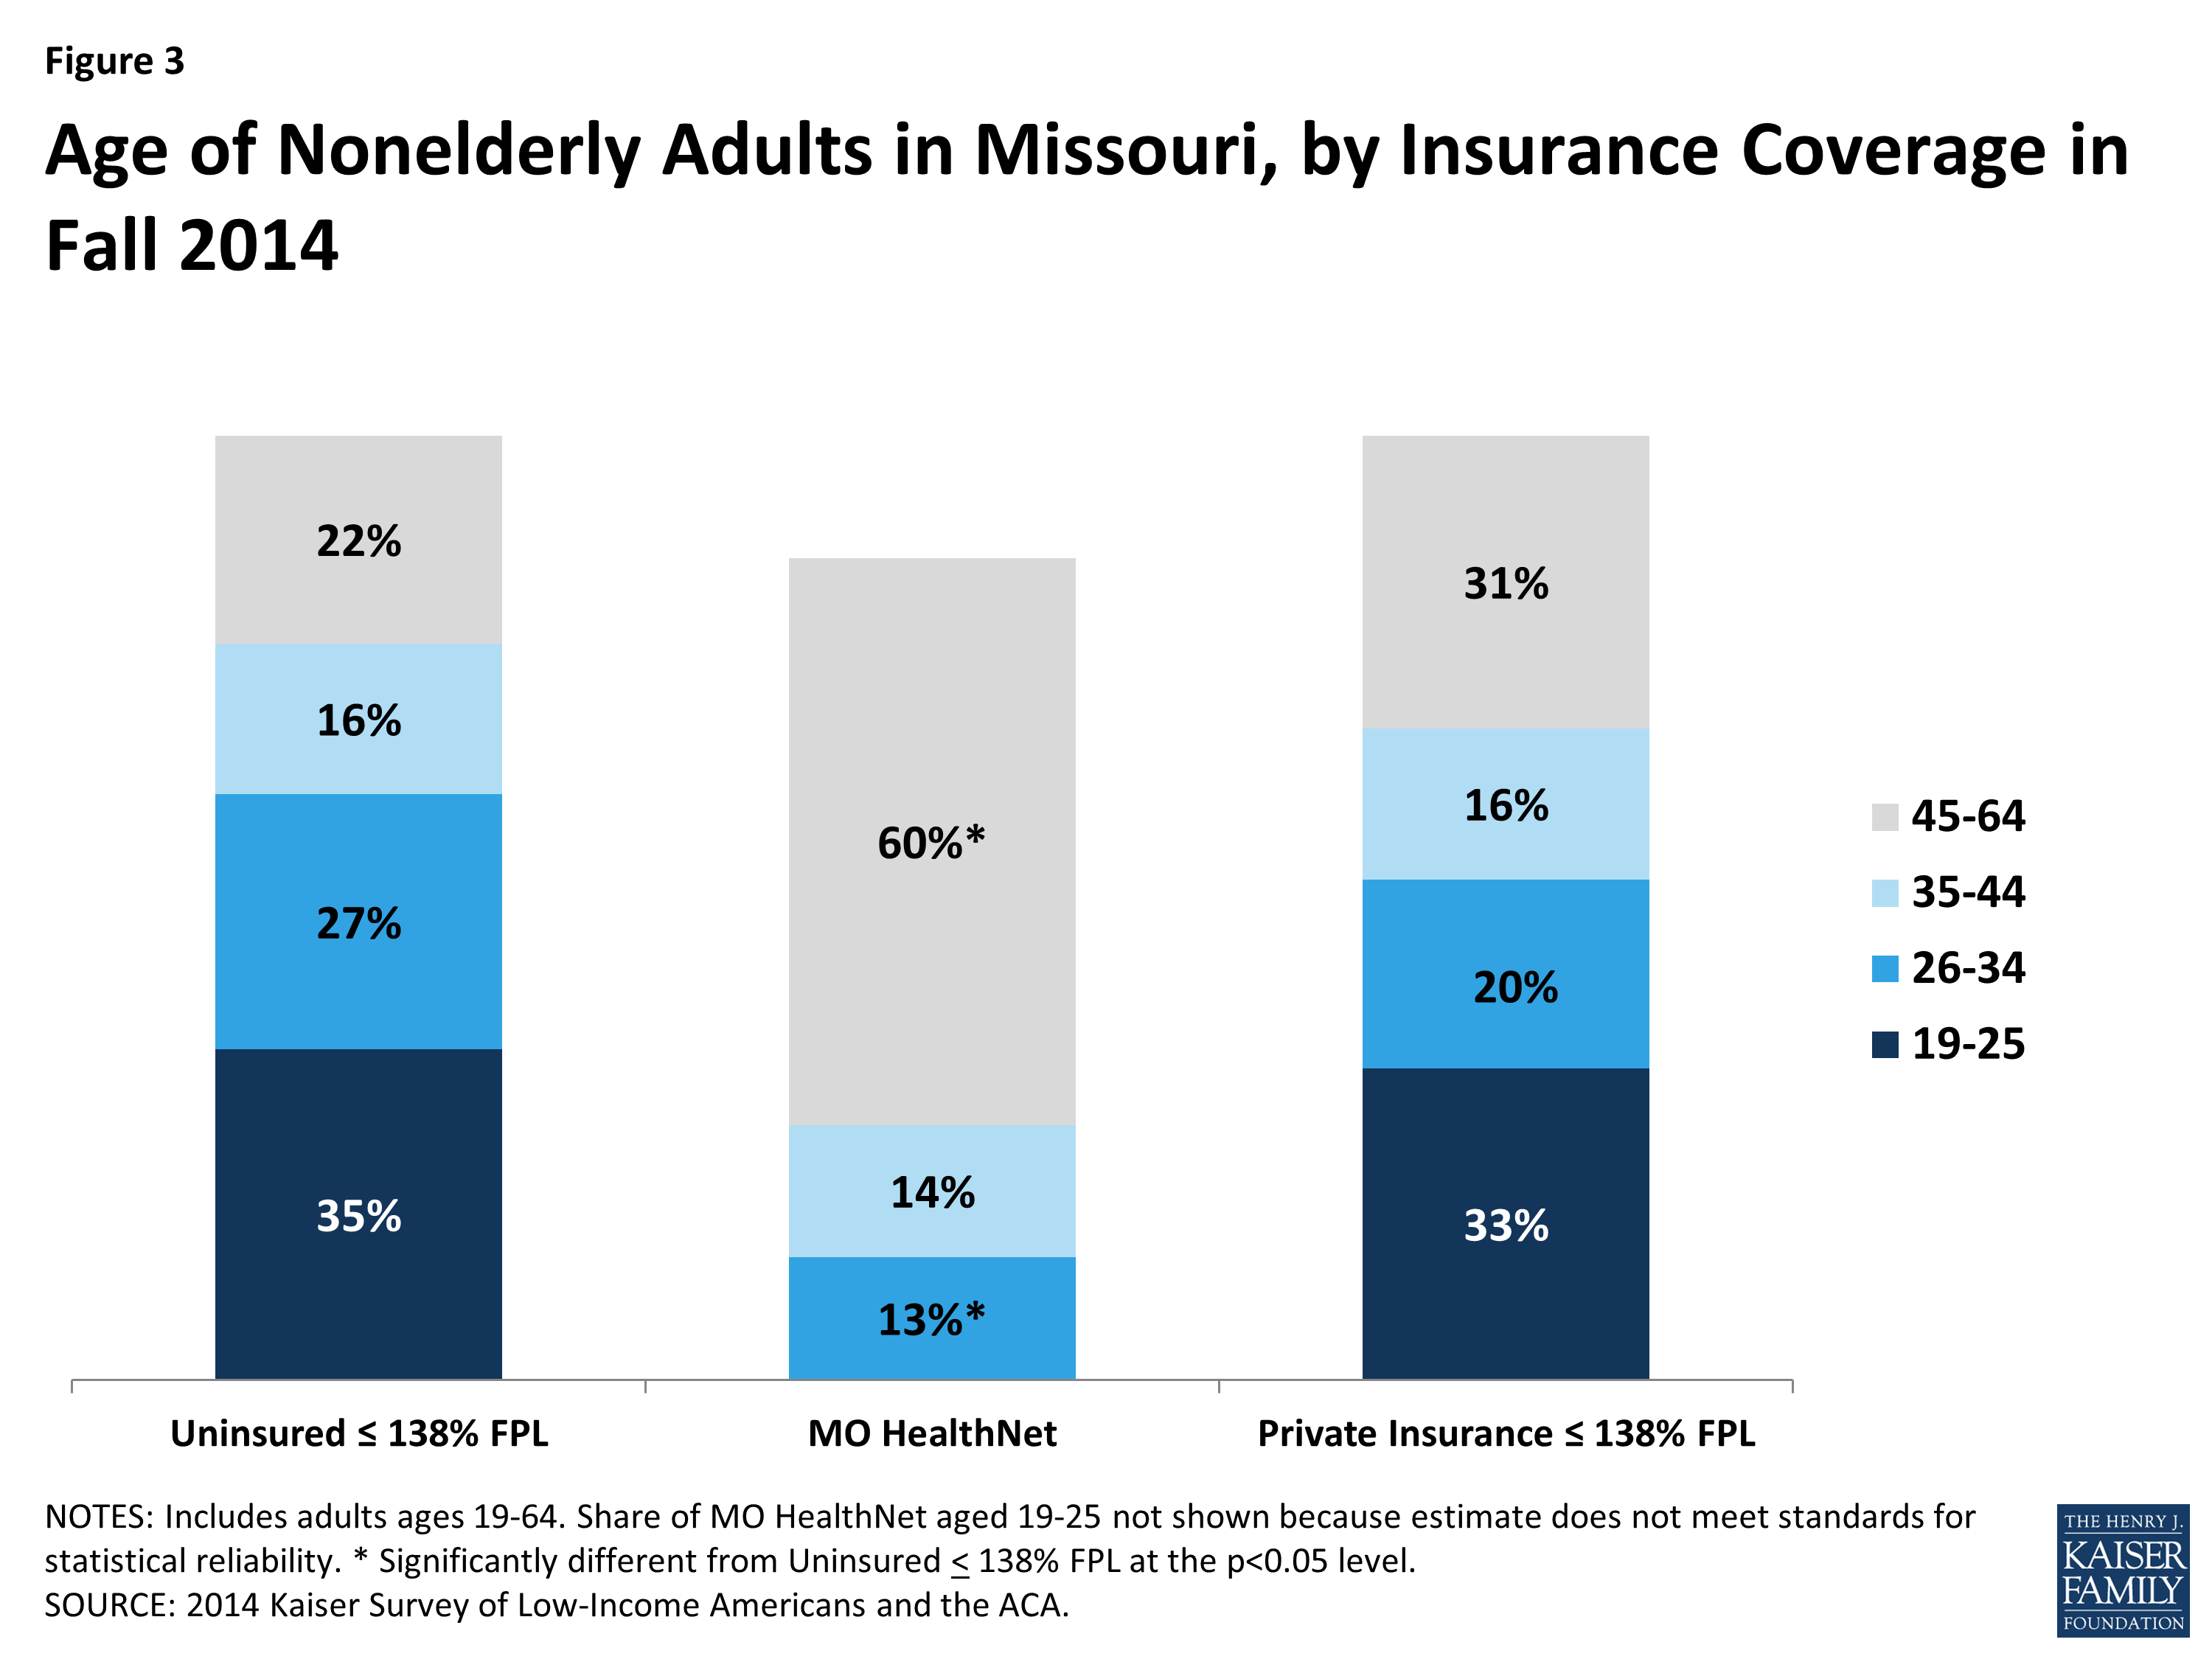
Figure 3: Age of Nonelderly Adults in Missouri, by Insurance Coverage in Fall 2014
Although the patterns of marriage and having children are similar between the low-income uninsured and the low-income privately insured, the latter’s children are more likely to all have health insurance. About three quarters (78%) of the low-income uninsured are not married, and nearly four in ten (38%) have dependent children. Similarly over two thirds (68%) of low-income privately insured are not married, and over four in ten (41%) report having dependent children (Figure 4). Nearly three quarters (73%) of those enrolled in MO HealthNet say they do not have children, likely reflecting Missouri’s low income eligibility limit for adults with dependent children. Many adults enrolled in MO HealthNet do so because they have a disability, handicap, or chronic disease (data not shown). Other women without children may qualify through their pregnancy.
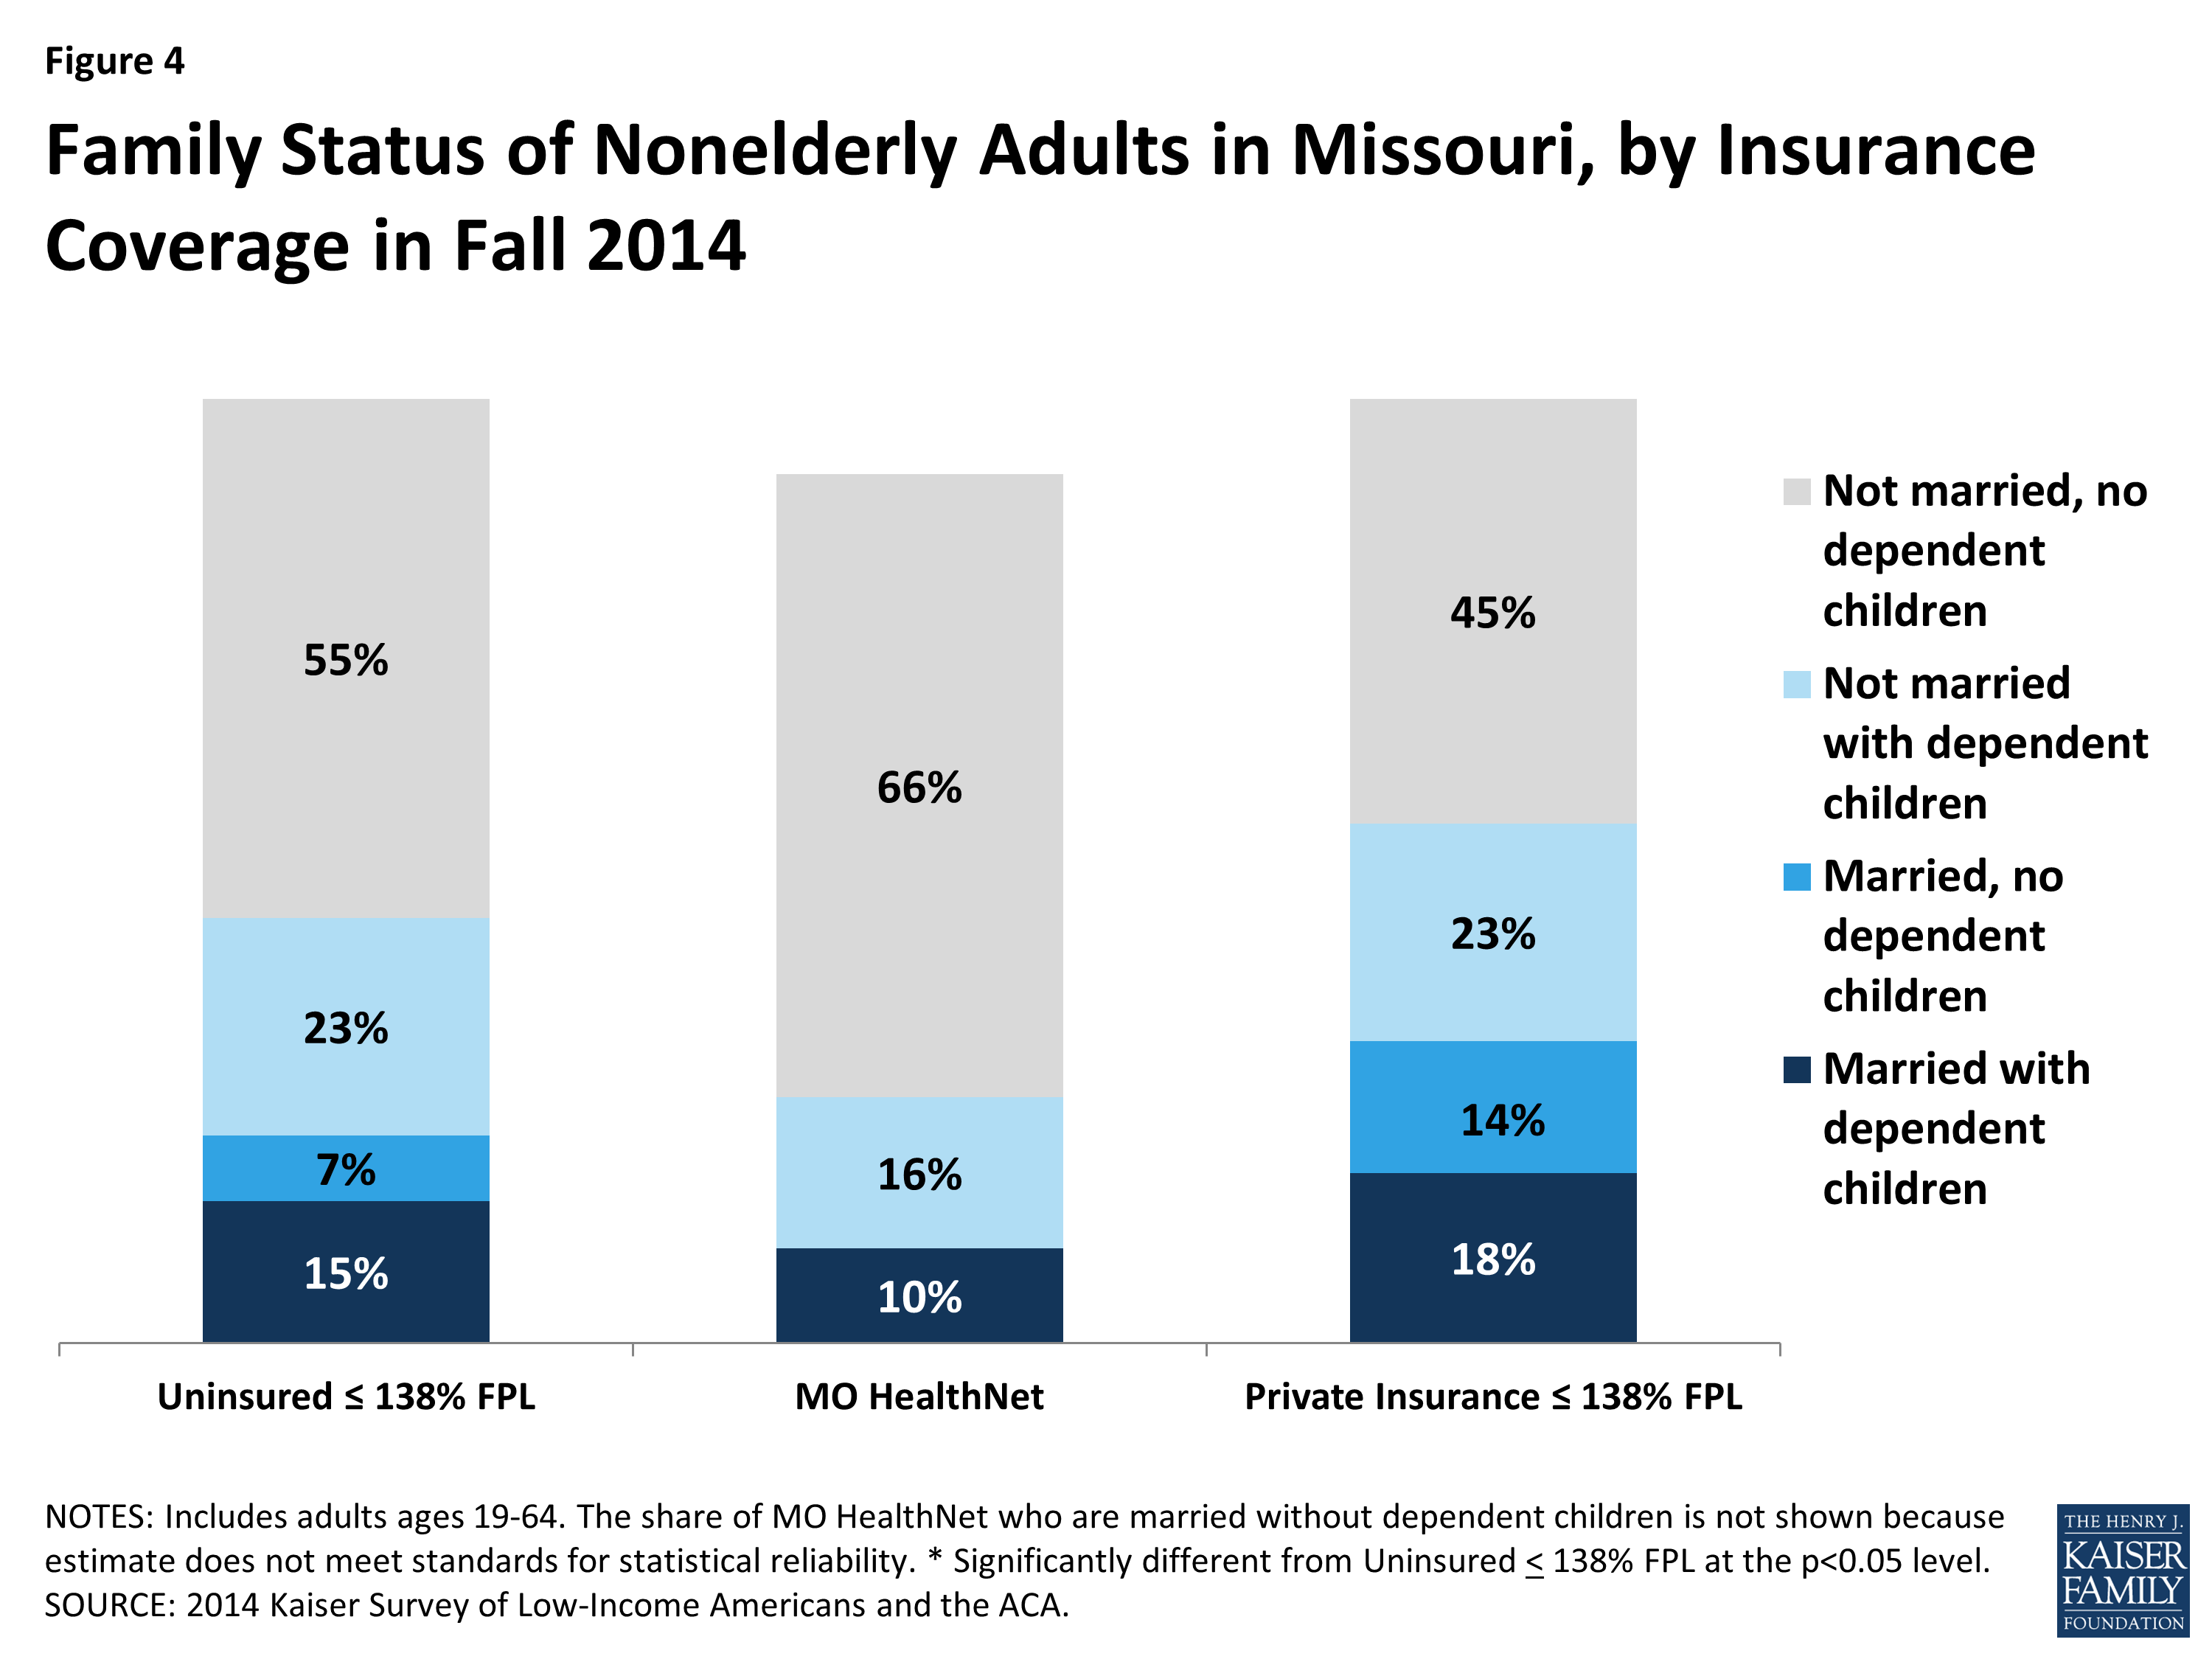
Figure 4: Family Status of Nonelderly Adults in Missouri, by Insurance Coverage in Fall 2014
Of those enrolled in MO HealthNet who have children, nearly all have health insurance provided to their children. Similarly, nearly all low-income parents with private coverage have insured children. However, about a third of the low-income uninsured who have children do not have insurance provided to all of their children (Figure 5). Given children’s eligibility levels for MO HealthNet, most of these children are likely eligible for public coverage. This finding supports the generally known pattern that children whose parents have health insurance are more likely to be covered themselves. Additionally, research has shown that among children who are already insured, those whose parents are also insured are more likely to be linked to the health care system and receive needed care.2
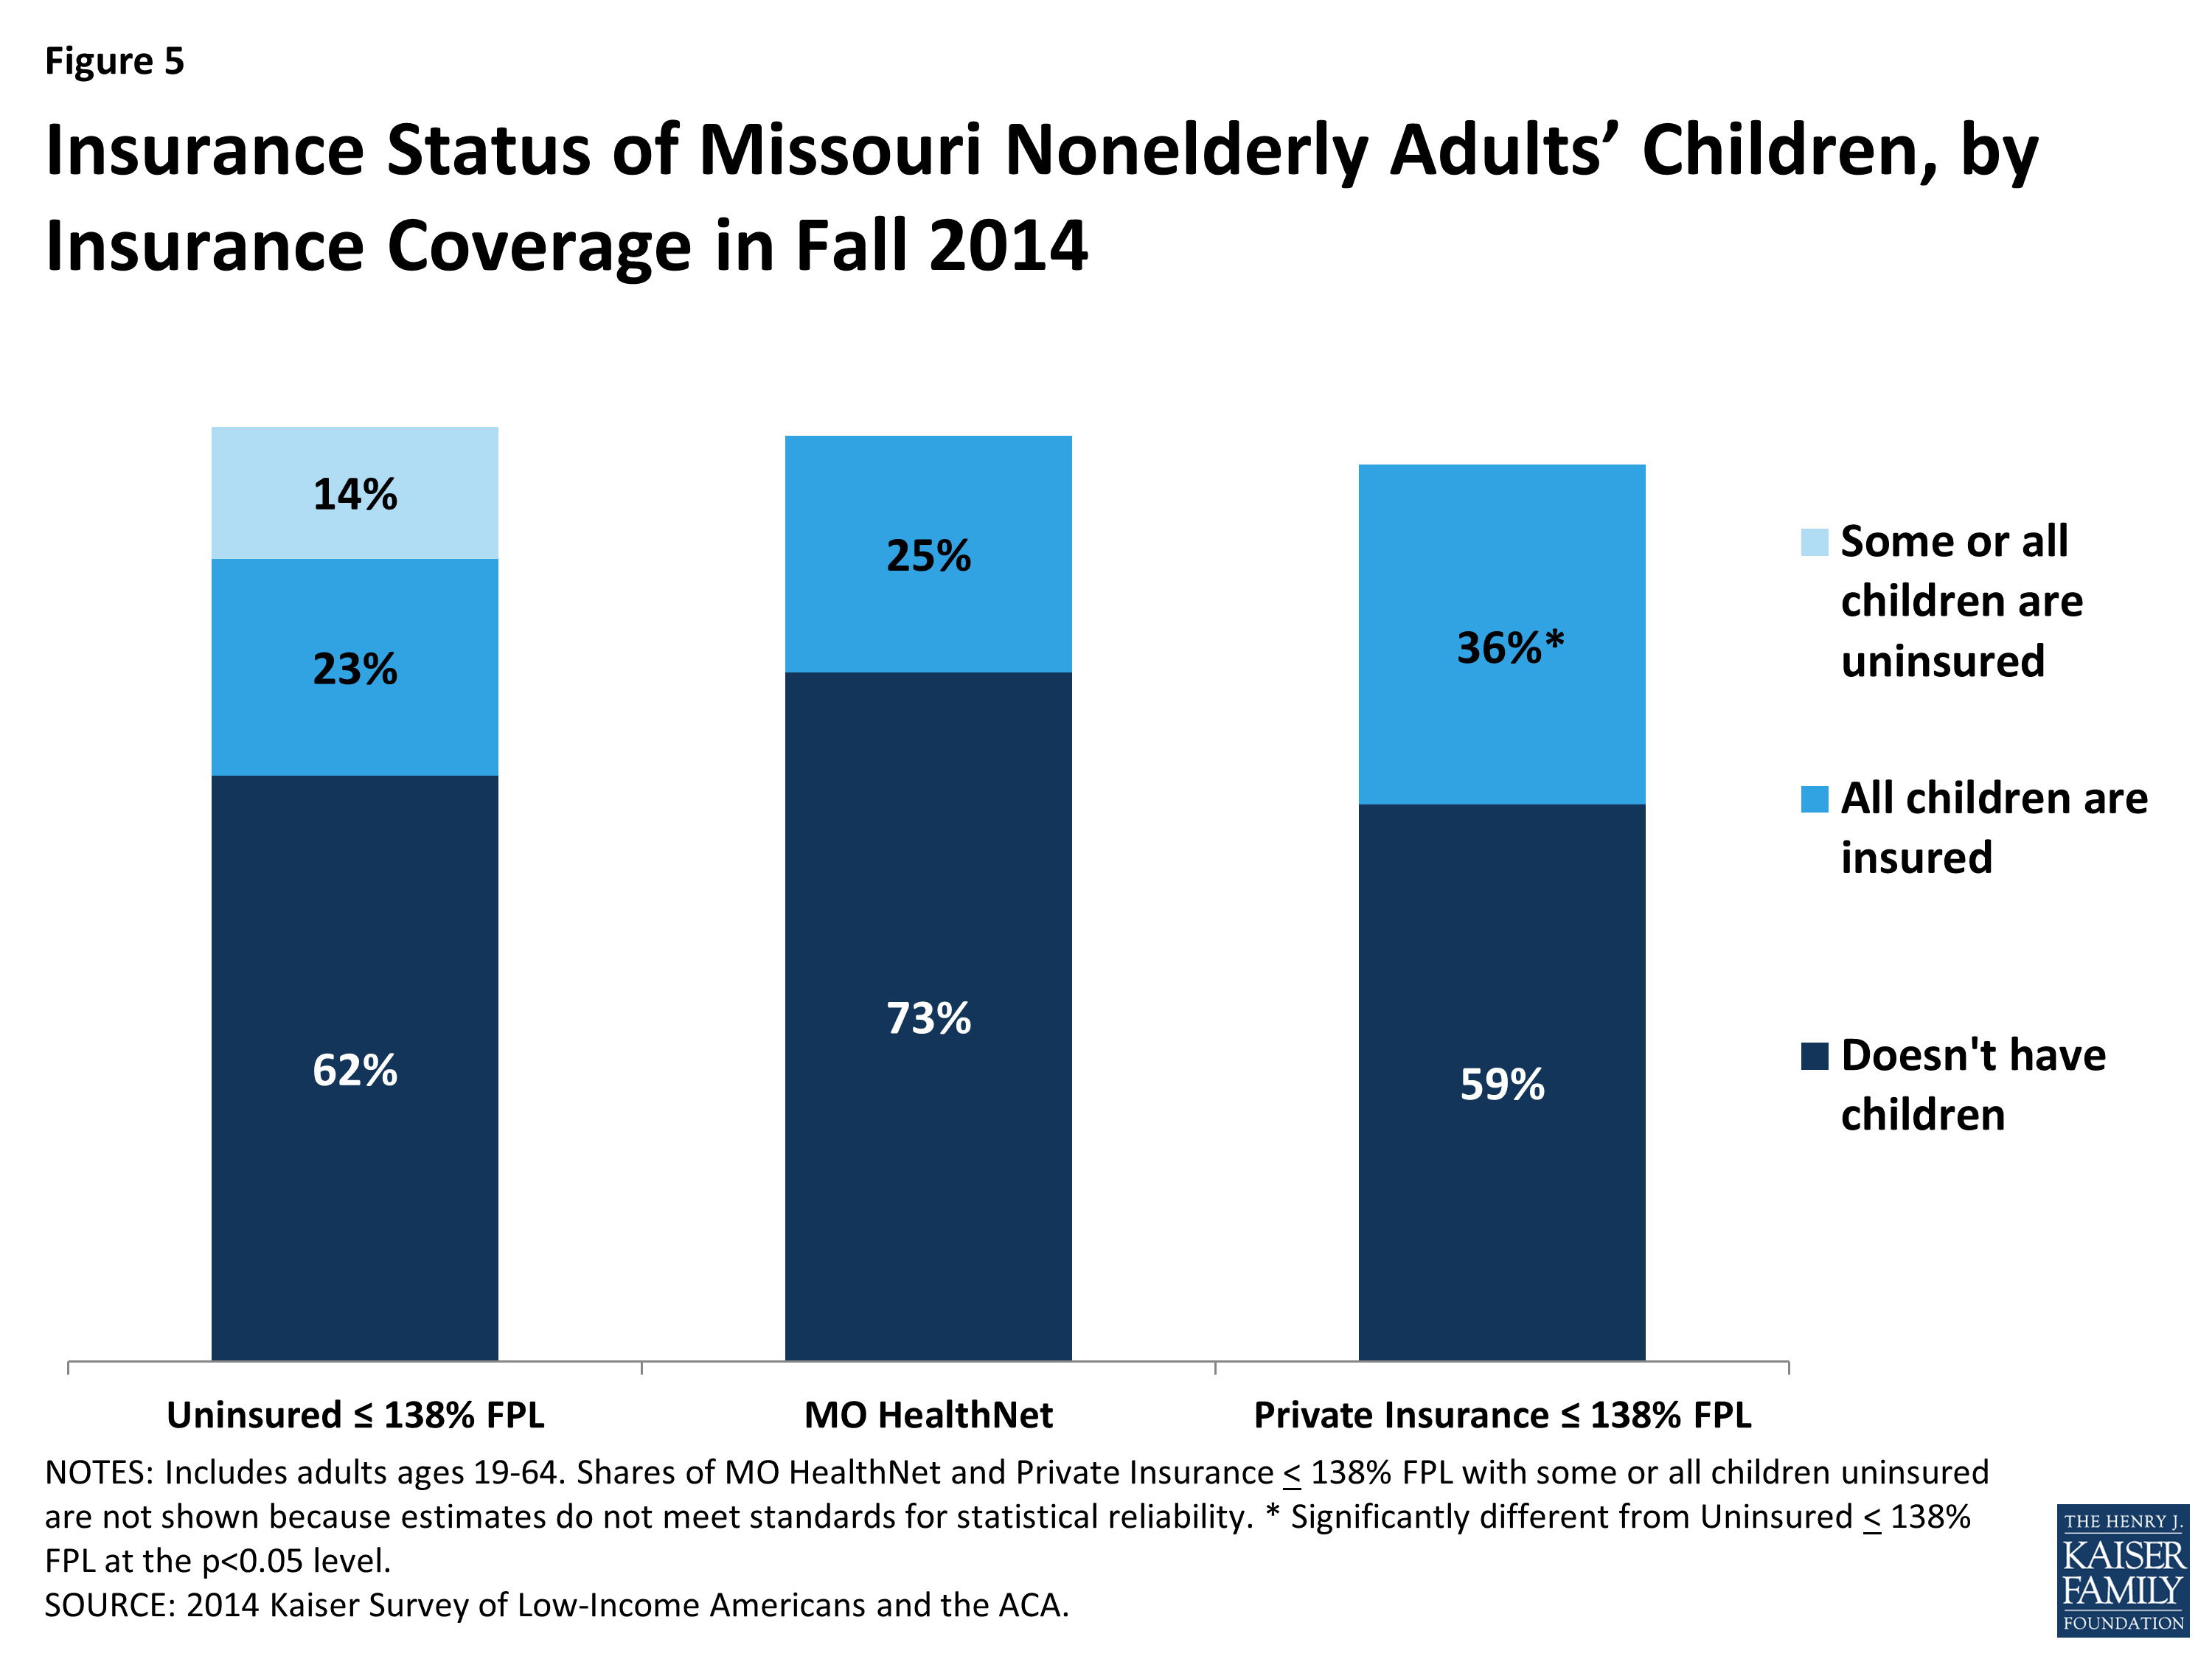
Figure 5: Insurance Status of Missouri Nonelderly Adults’ Children, by Insurance Coverage in Fall 2014
Over half of the low-income uninsured live in families with at least one person working full or part-time. One third of the low-income uninsured either works full-time or has a spouse who works full-time. Nearly a quarter (24%) of the low-income uninsured works part-time or their spouse works part-time. In contrast, nearly seven in ten low-income privately insured is in a family where they or their spouse works full-time, and about a seventh (14%) of the low-income privately insured works part-time or their spouse works part time. Health insurance is more frequently provided as a fringe benefit to full-time workers than to part-time workers, as reflected in the higher share of full-time workers within the low-income privately insured. At 80 percent, a far larger share of MO HealthNet enrollees report neither working nor having a working spouse compared to the low-income uninsured, of whom 43 percent report not having a worker in the family (Figure 6). This pattern reflects high disability rates among the adult MO HealthNet population, which may prevent many from working. It also reflects the very low Missouri Medicaid eligibility level for non-elderly adults with dependent children. In Missouri, a non-elderly adult with dependent children can earn no more than 23% of poverty, or about $4,600 a year or $380 a month for a family of three and still be eligible for Medicaid.
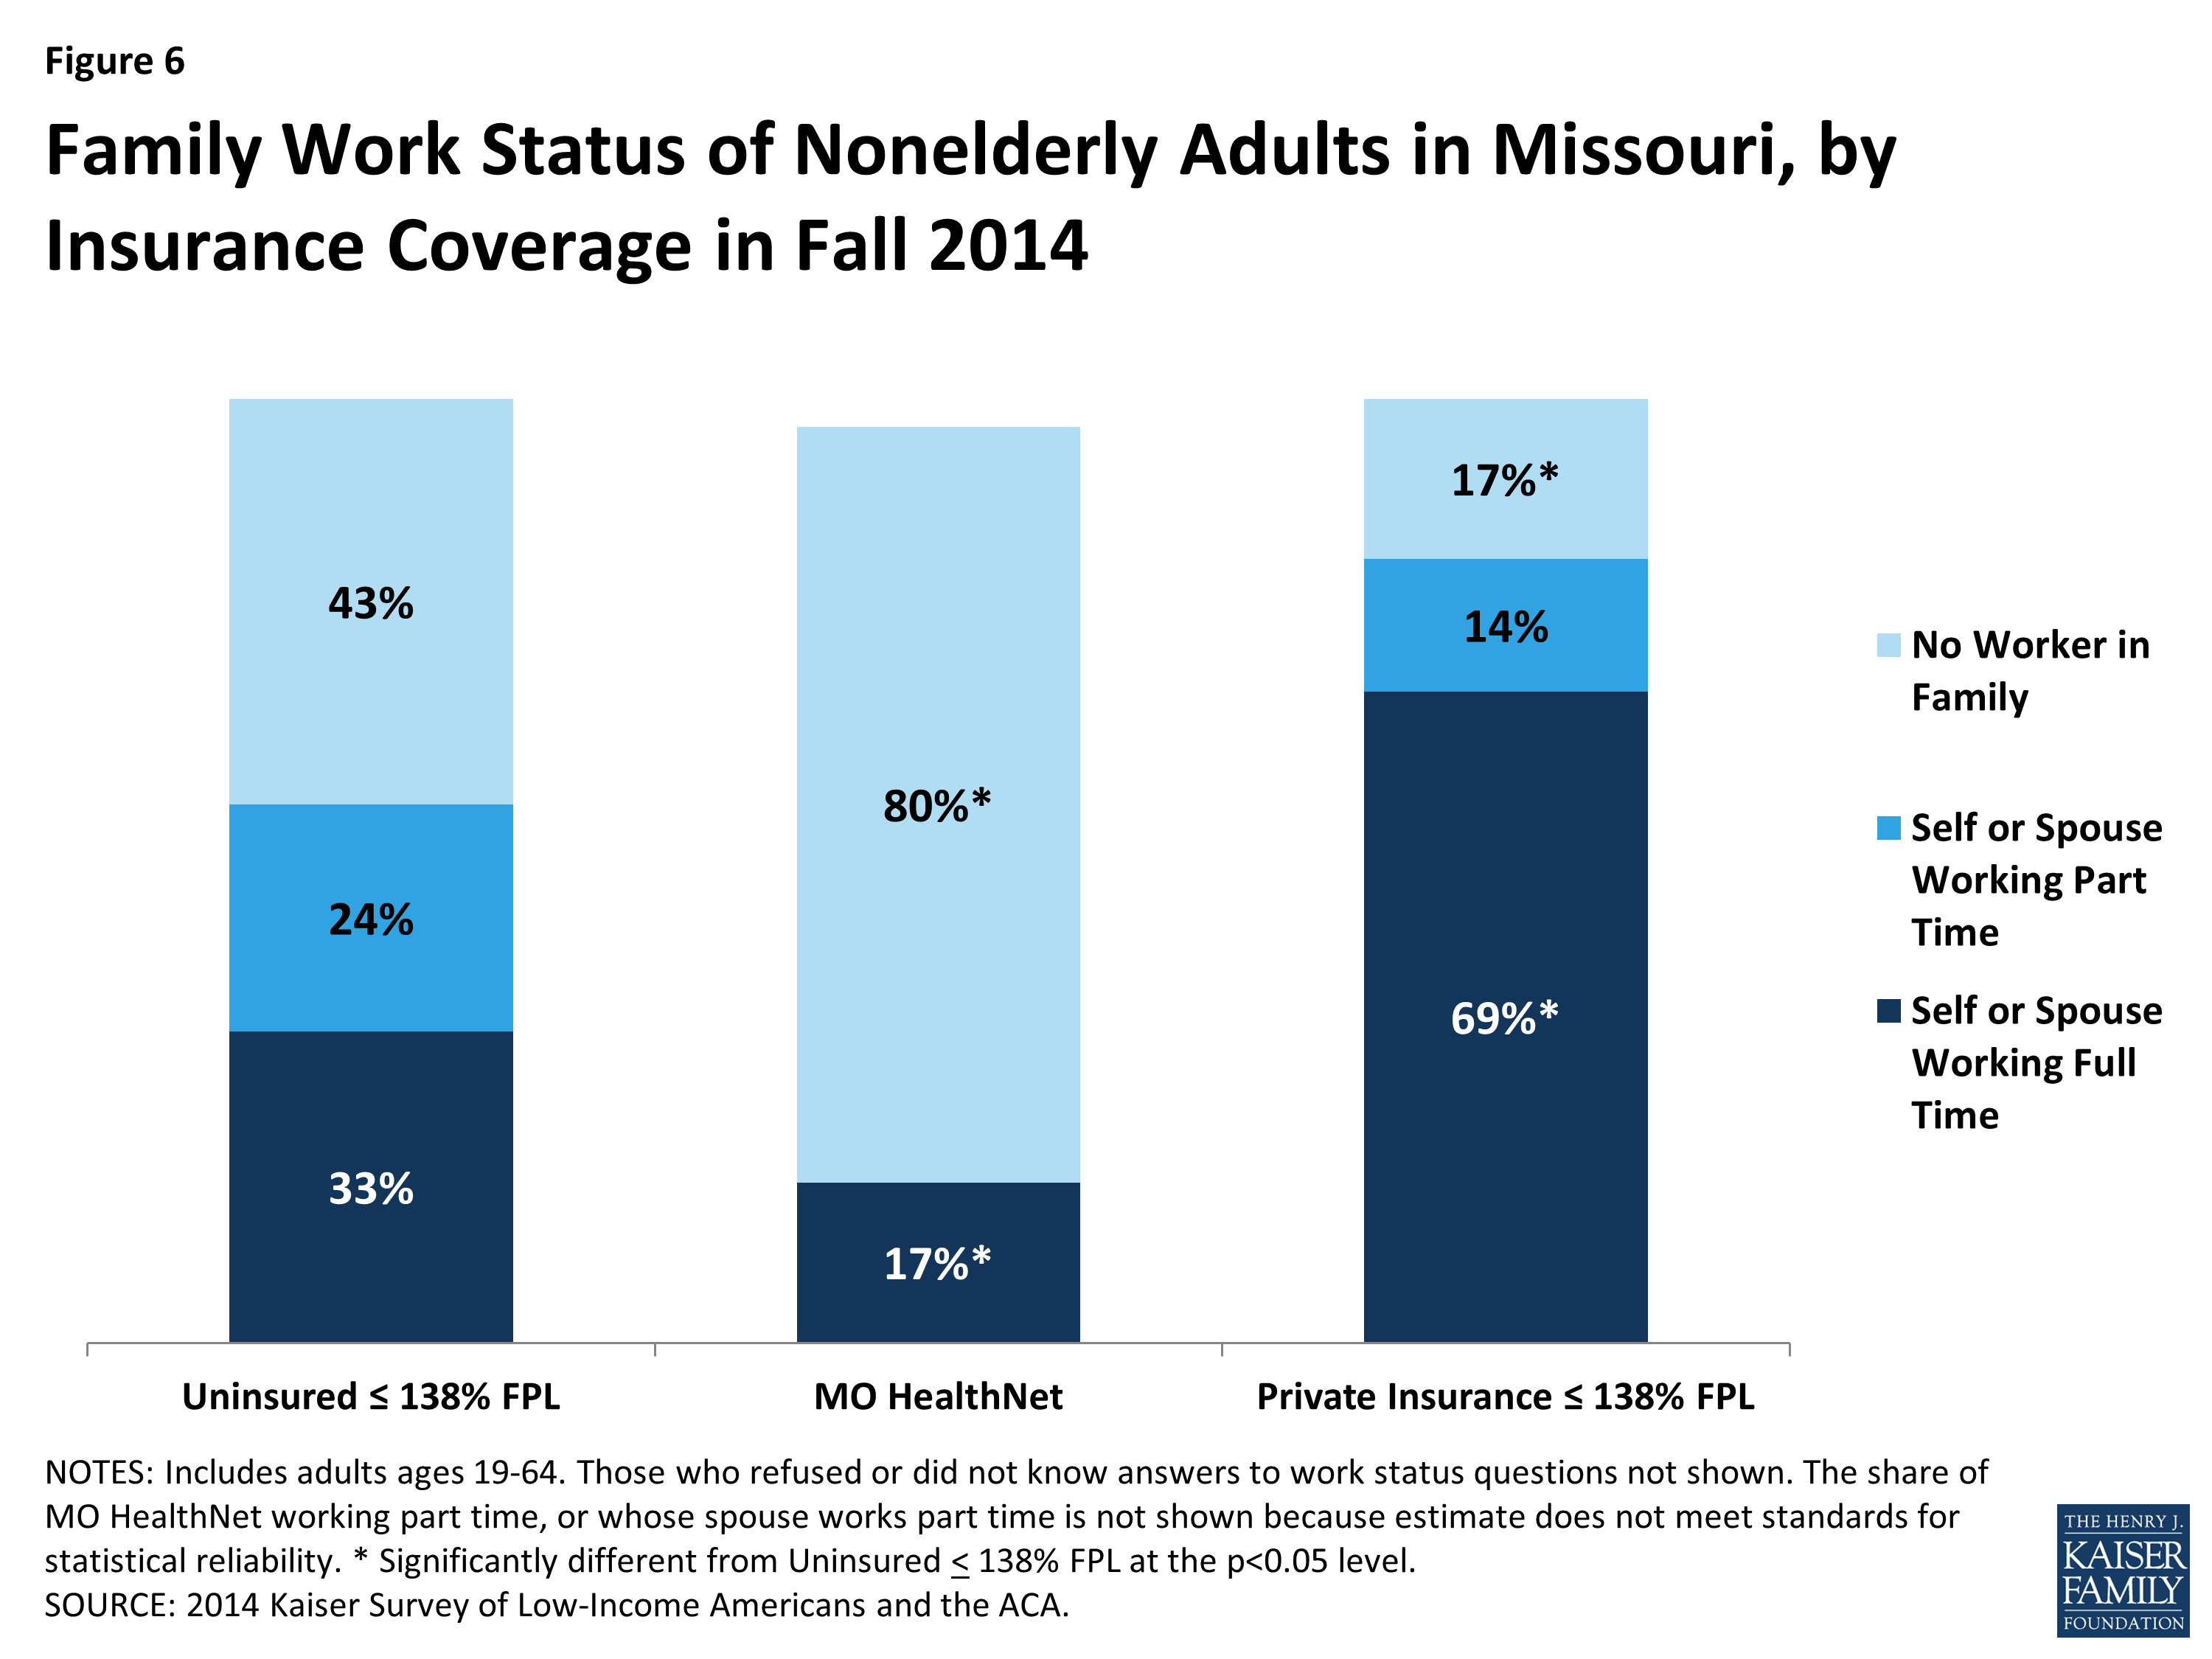
Figure 6: Family Work Status of Nonelderly Adults in Missouri, by Insurance Coverage in Fall 2014
Reflecting Medicaid’s role in caring for people with substantial health needs, MO HealthNet enrollees report having poorer health status than other adults. However, the low-income uninsured likely have unmet health needs. Over six in ten (63%) of MO HealthNet enrollees have fair to poor health, compared with four in ten (41%) low-income uninsured and two in ten (20%) low-income privately insured. While 37 percent of the low-income uninsured report having an ongoing condition, only 30 percent take a prescription. In contrast, a greater share of people who are enrolled in MO HealthNet report taking prescriptions than report having an ongoing condition when enrolled in MO HealthNet. The same is true of those who are low-income privately insured (Figure 7). This suggests the possibility that the low-income uninsured have known unmet needs, as well as undiagnosed conditions.3 Notably, middle-income uninsured adults were more likely than low-income uninsured adults to report excellent or very good health and less likely to report ongoing conditions (Additional Table A1).
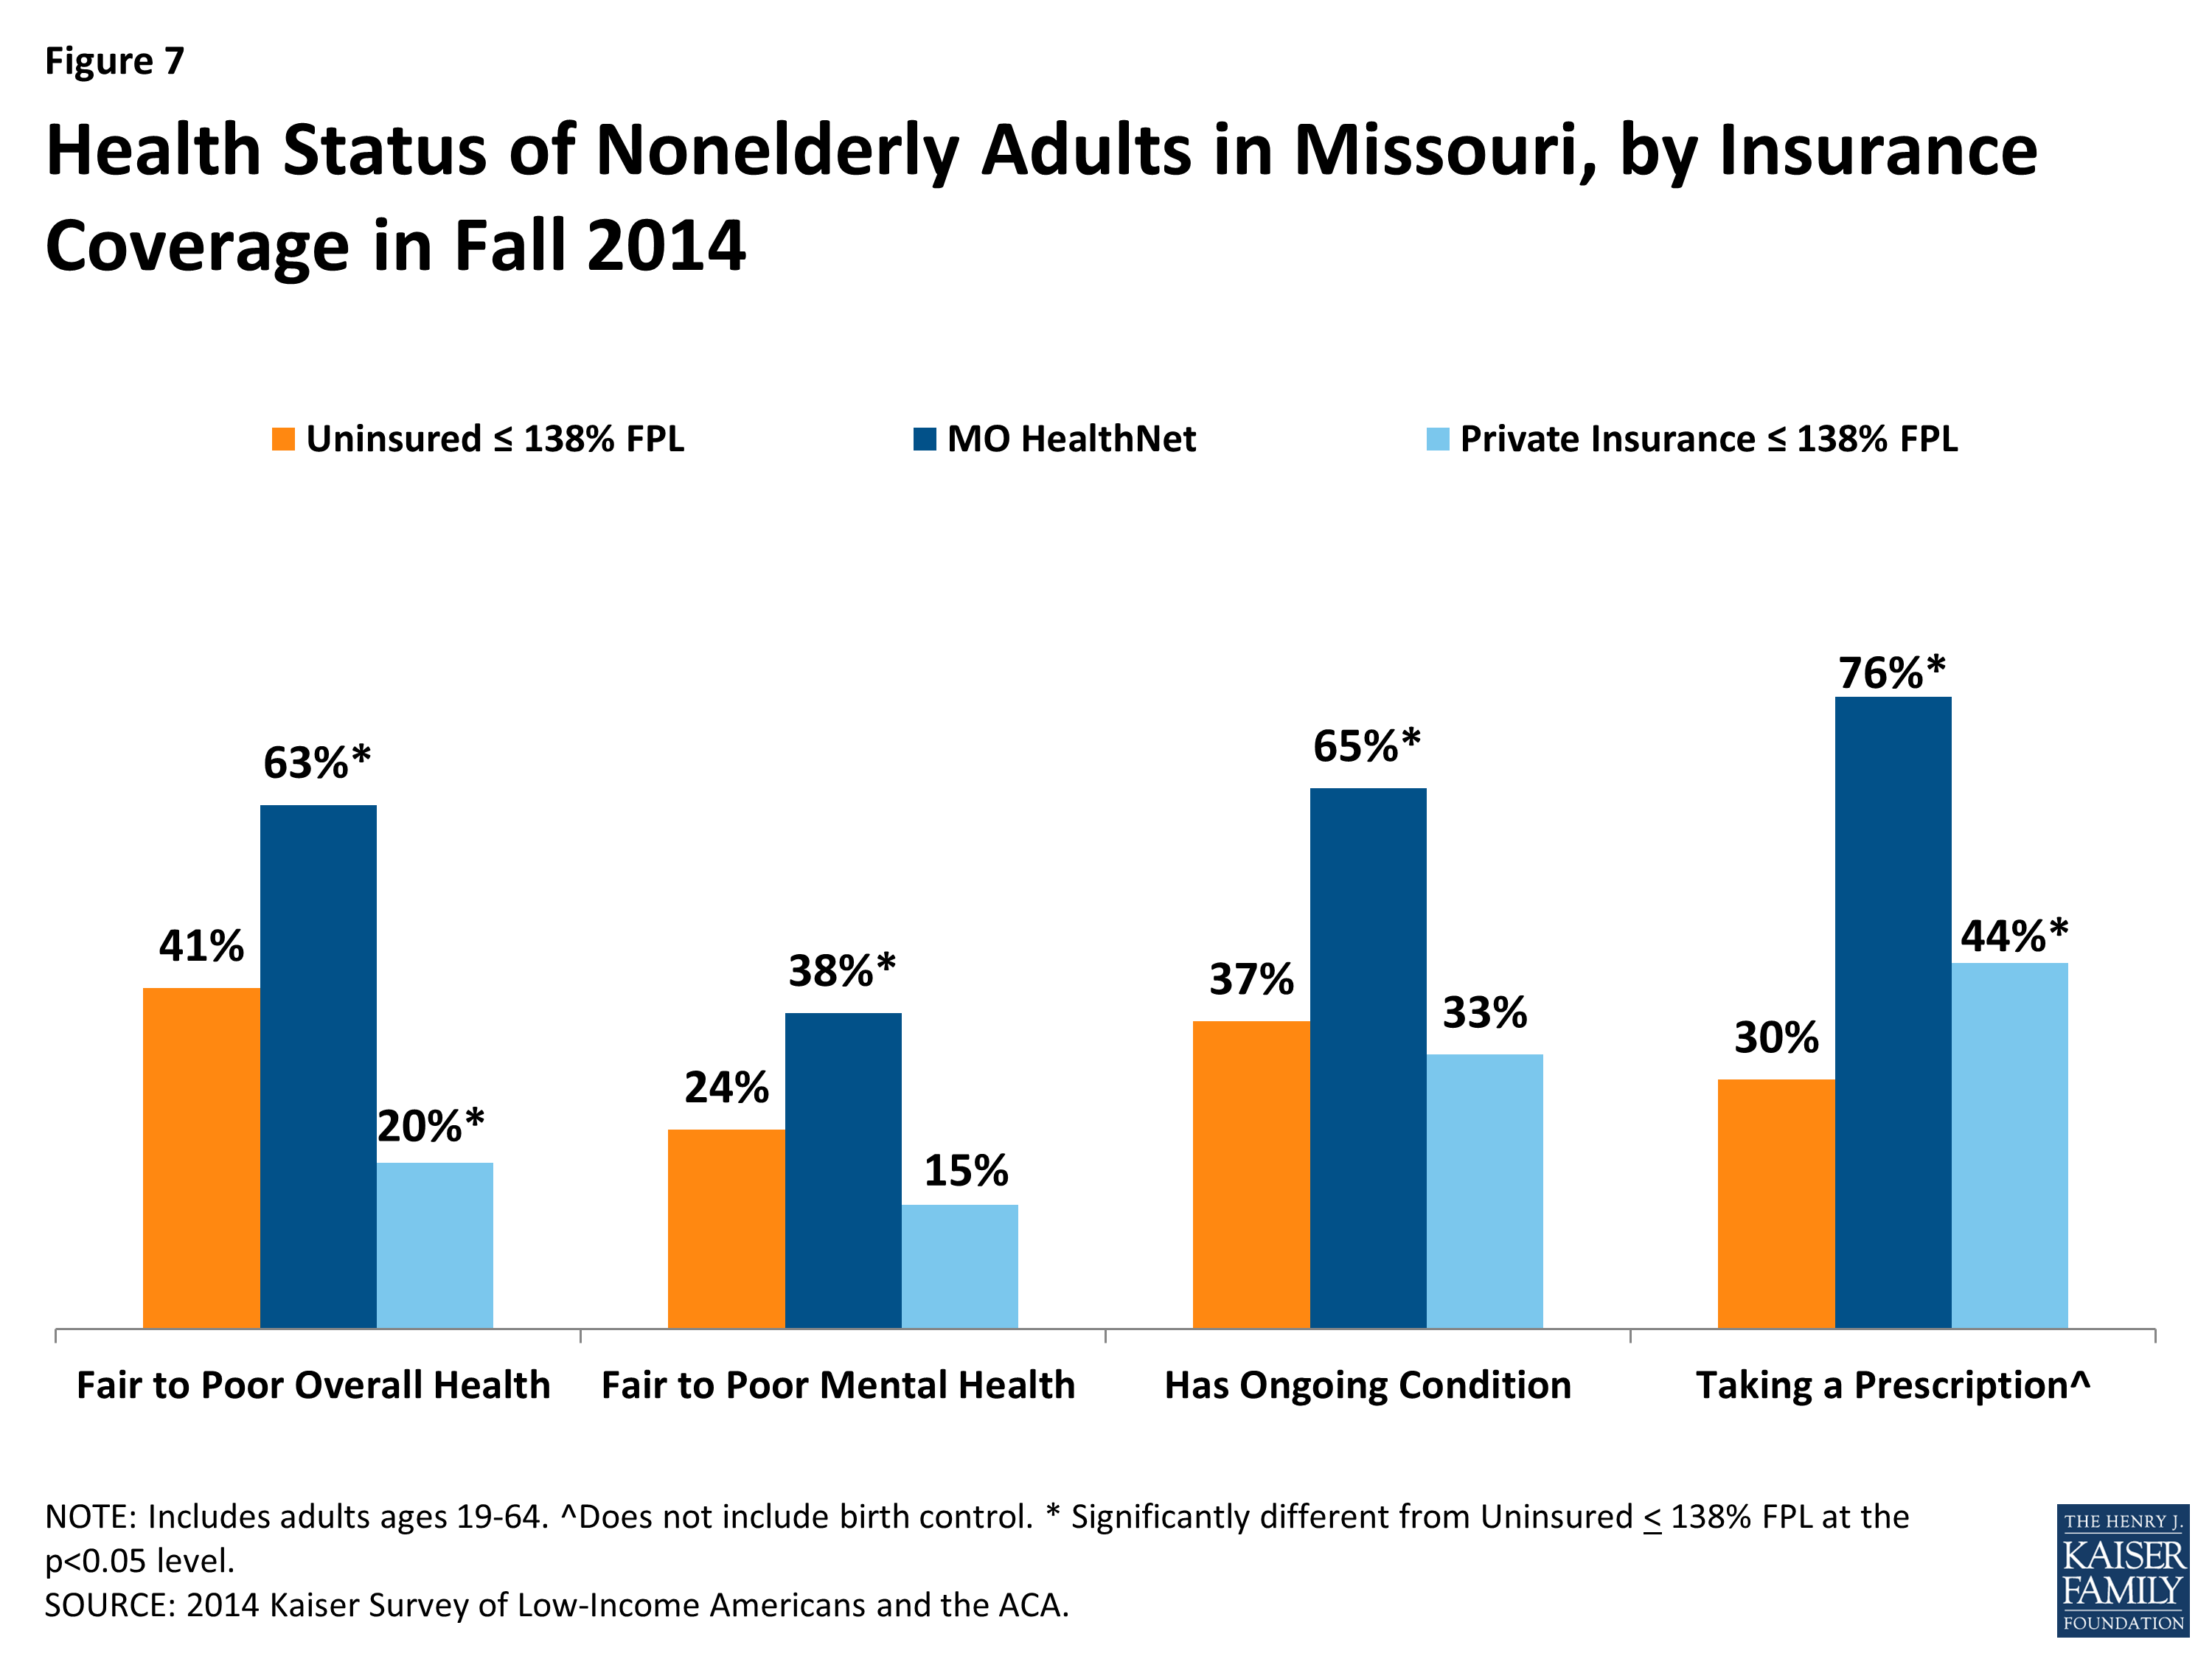
Figure 7: Health Status of Nonelderly Adults in Missouri, by Insurance Coverage in Fall 2014
How do the low-income uninsured access care?
The ultimate goal of expanding health insurance coverage is to help people access the medical services that they need. A large body of literature has documented that people with insurance are more likely than those without to be linked to regular care, are less likely to postpone care when they need it, and have an easier time accessing services. As in the past, where we found that low-income adults without coverage in Missouri continue to lag behind their insured counterparts in access to care,1 this year’s survey findings continue to support the literature, indicating that the low-income uninsured are less likely to have a usual source of care than those enrolled in MO HealthNet or the low-income privately insured. The low-income uninsured also use medical care at lower rates, and ultimately go without care more frequently than those enrolled in MO HealthNet or the low-income privately insured.
The uninsured are less likely to report being linked to care than those with coverage. The low-income uninsured are less likely than those enrolled in MO HealthNet or those who are low-income and enrolled in private coverage to have usual source of care or a place to go when they are sick or need advice about their health (not counting the emergency room); they were also less likely to have a regular doctor at their usual source of care (Figure 8). Having a usual source of care or regular doctor is an indicator of being linked to the health care system and having regular access to services. These patterns reinforce a large body of research that finds that having coverage is associated with improved access to care.
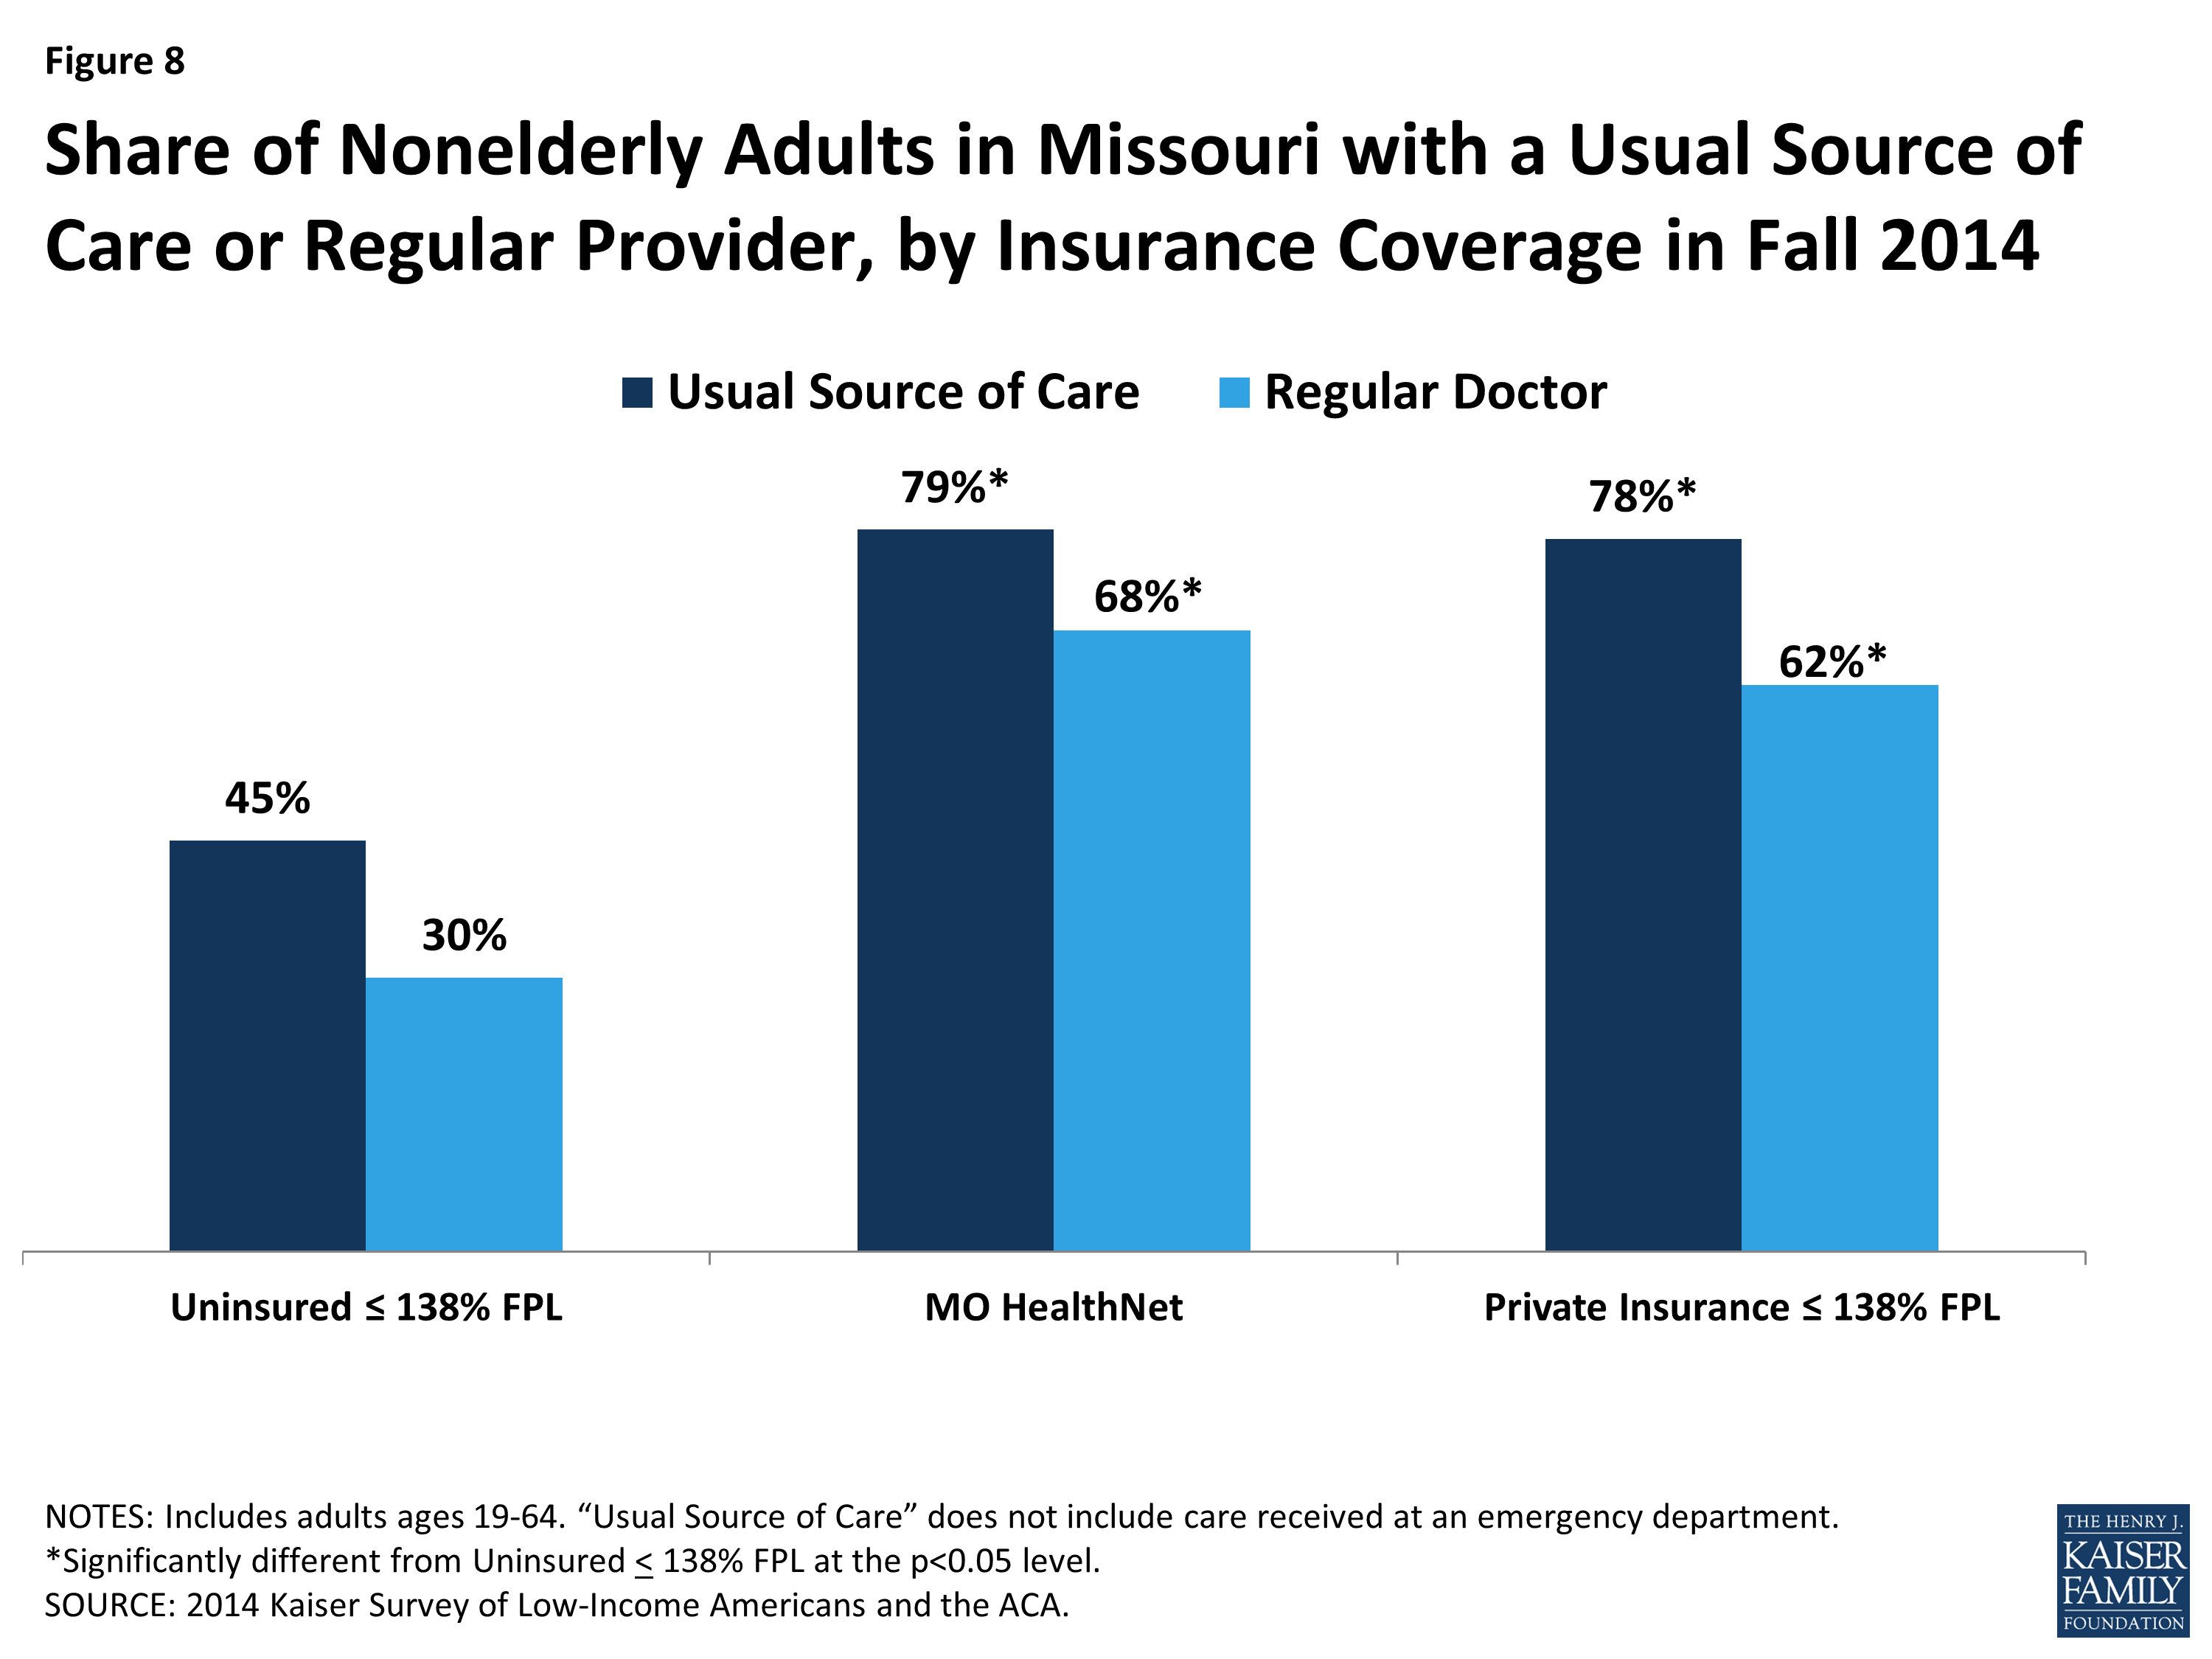
Figure 8: Share of Nonelderly Adults in Missouri with a Usual Source of Care or Regular Provider, by Insurance Coverage in Fall 2014
Clinics and health centers remain an important source of care for the low-income uninsured. Among those who have a usual source of care, the low-income uninsured are less likely than the low-income privately insured to say they received care in a physician’s office. Four in ten of the low-income uninsured who have a usual source of care receive care there, as opposed to nearly six in ten (59%) of the low-income privately insured. Over half of those enrolled in MO HealthNet say they receive care in a physician’s office, although this result is not statistically different from the low-income uninsured. While a physician’s office is the most common location for receiving care amongst the low-income uninsured with a usual source of care, it is closely followed by clinics and health centers (38%) (Figure 9). Although low-income adults across the board are most likely to say they chose their usual source of care because their preferred provider is there (Additional Table A2), about a fifth of uninsured low-income adults say they chose their site of care because of affordability. Most clinics and health centers offer care on a reduced fee or sliding scale basis, making them an important source of care for low-income people without insurance.
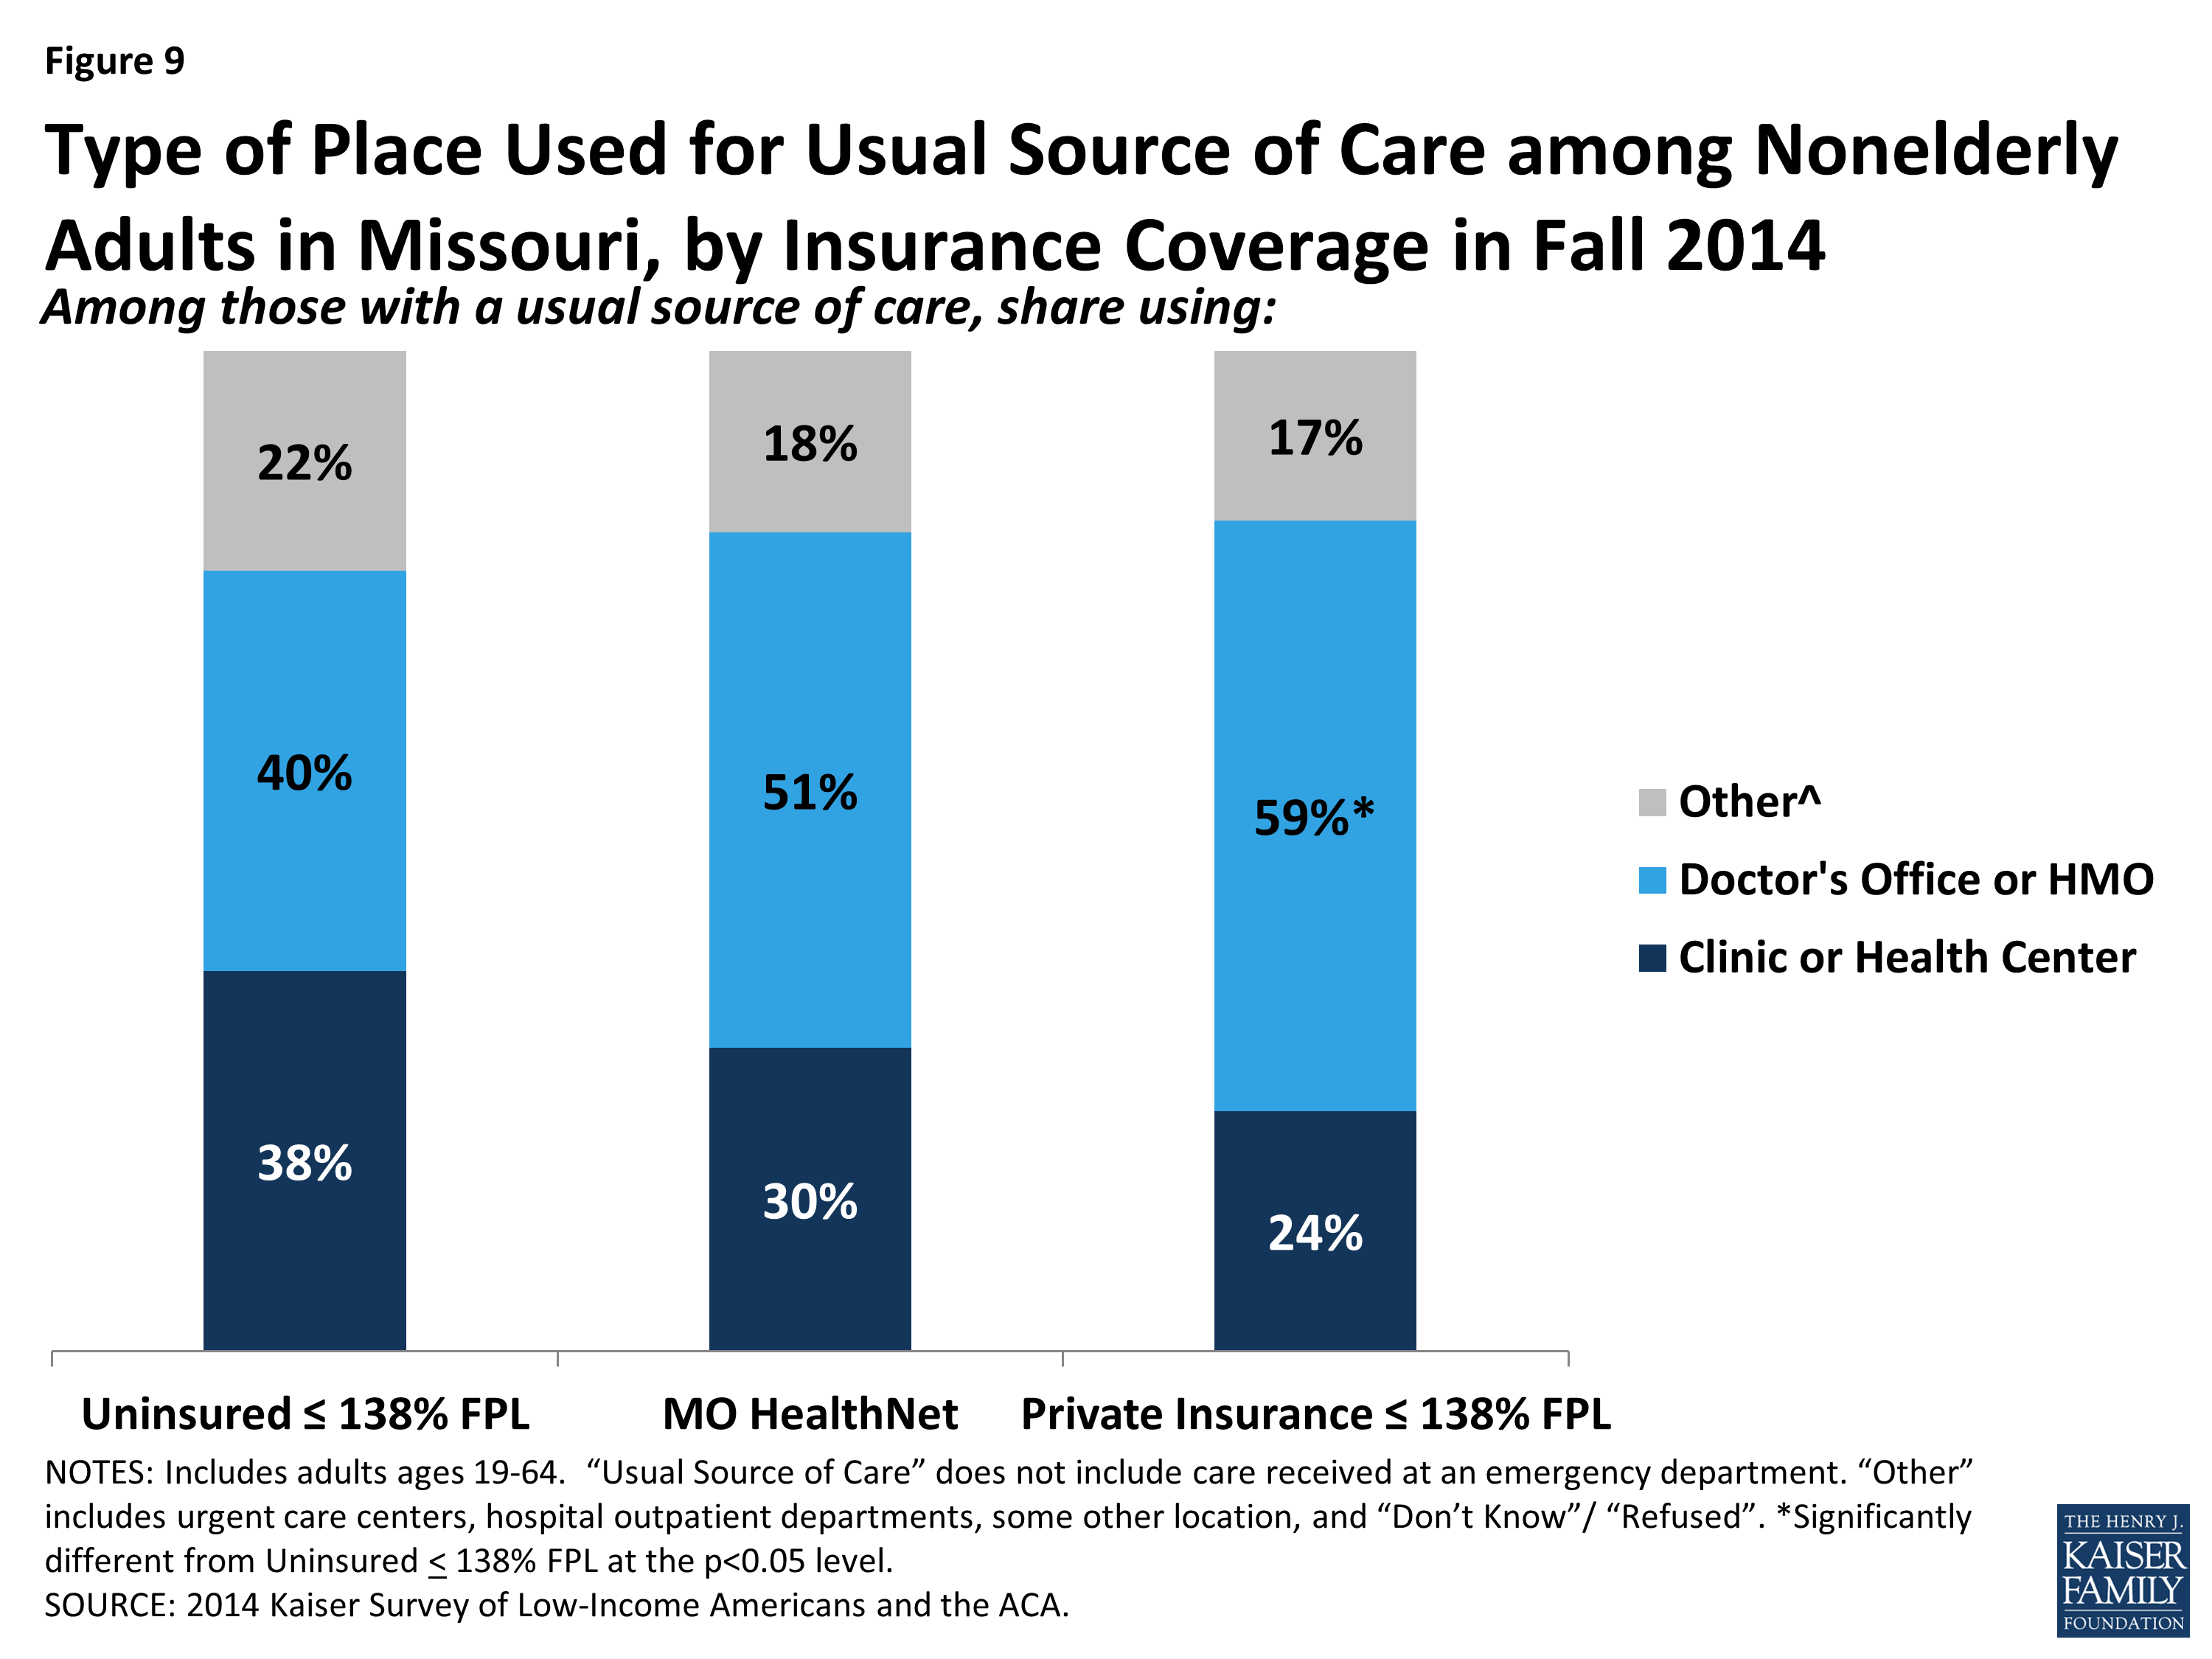
Figure 9: Type of Place Used for Usual Source of Care among Nonelderly Adults in Missouri, by Insurance Coverage in Fall 2014
Low-income uninsured adults are less likely than other low-income adults to report using medical services and are more likely to go without needed care. Only fifty-five percent of the low-income uninsured used any medical services compared with over 90 percent (91%) of those enrolled in MO HealthNet and over 70 percent (73%) of the low-income privately insured.2 Only about a quarter of the low-income uninsured had a check-up or other preventive care visit since January 2014, compared 70 percent of those enrolled in MO HealthNet and a little over half (52%) of the low-income privately insured (Figure 10).
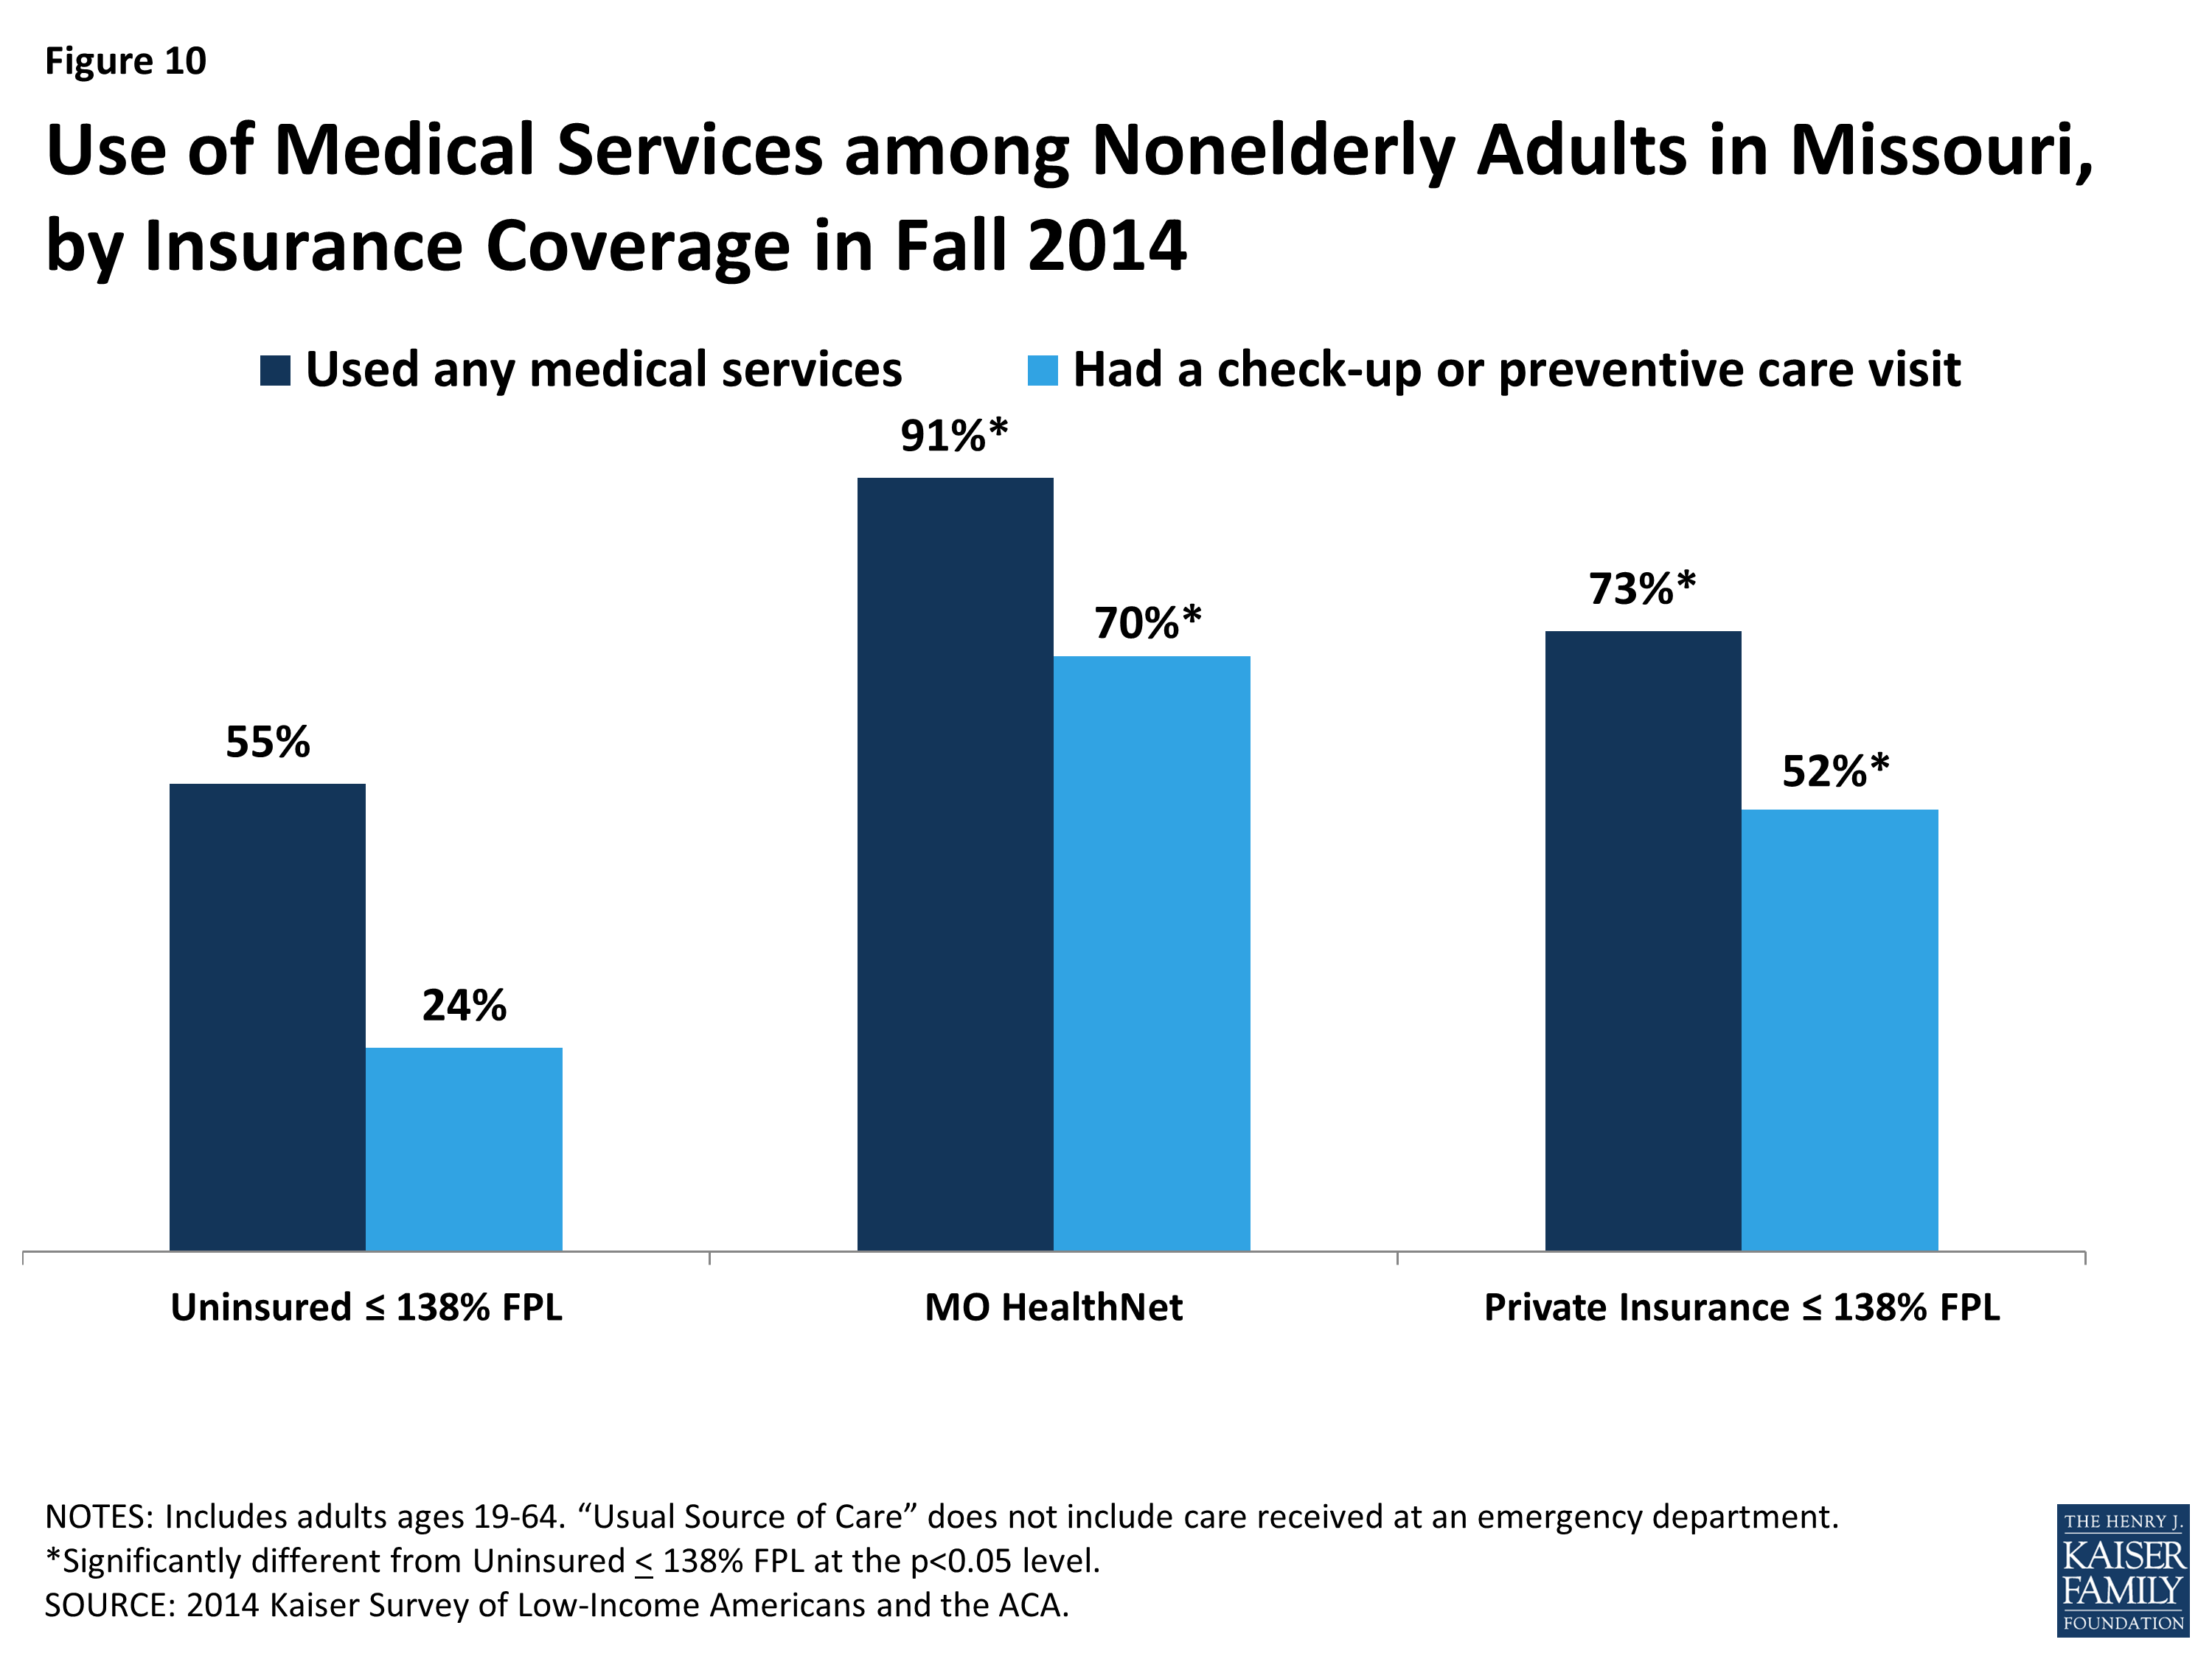
Figure 10: Use of Medical Services among Nonelderly Adults in Missouri, by Insurance Coverage in Fall 2014
Over twice as many low-income uninsured postponed or went without care as those who were low-income and privately insured (55% versus 25%), and about four times as many low-income uninsured never got their needed care as the low-income privately insured (41% versus 11%). Although there was no significant difference between the share of low-income uninsured adults and MO HealthNet enrollees who postponed or went without care, nearly twice as many low-income uninsured never got their needed care compared to MO HealthNet enrollees (41% versus 21%) (Figure 11). Postponing care can have major negative implications: about a quarter (26%) of the low-income uninsured postponed care, and consequently lost significant time at work, school, or other important life activities, 28% had their condition worsen, and 42% had their stress level seriously increased. These rates of serious consequences due to postponing care were higher among the uninsured population than among their publicly or privately insured counterparts.

Figure 11: Unmet Need for Care among Nonelderly Adults in Missouri, by Insurance Coverage in Fall 2014
The low-income uninsured were also more likely to go without needed care than the mid-income uninsured. Over half (55%) of the former postponed or went without care, compared with about 40 percent (39%) of the latter (Additional Table A2). This pattern could reflect lower levels of need for health care than those in the low- income range who remained uninsured or could reflect increased ability to meet need due to access to more financial resources.
Although overall, a majority of people reported effective communication with their providers, the low-income uninsured experience more difficulty effectively communicating with their providers than do the low-income privately insured and those enrolled in MO HealthNet. Once people get into care, health literacy—or “patients’ ability to obtain, process, and understand the basic health information and services they need to make appropriate health decisions”3—plays an important role in how that care affects health outcomes. Health literacy depends on a range of factors related to patients (e.g., engagement in care), providers (e.g., how the information is communicated), service setting (e.g., the length of time of the interaction), and the nature of the visit (e.g., the complexity of health information). About six in ten (64%) of the low-income uninsured got all the information they wanted from their doctor or nurse, about six in ten (63%) felt encouraged to ask health questions, and about two thirds (65%) understood test results all or most of the time. However, these are lower rates compared to those enrolled in MO HealthNet and the low-income privately insured: nearly 90 percent of those enrolled in MO HealthNet and of the low-income privately insured got all the information they wanted from their provider, over 80 percent of each felt encouraged to ask questions, and about 80 percent of each understood their test results all or most of the time (Figure 12). While it’s not clear based on survey findings why these differences exist, it is possible that they are linked to uninsured adults’ lower likelihood of having a regular provider with whom they have an established rapport.
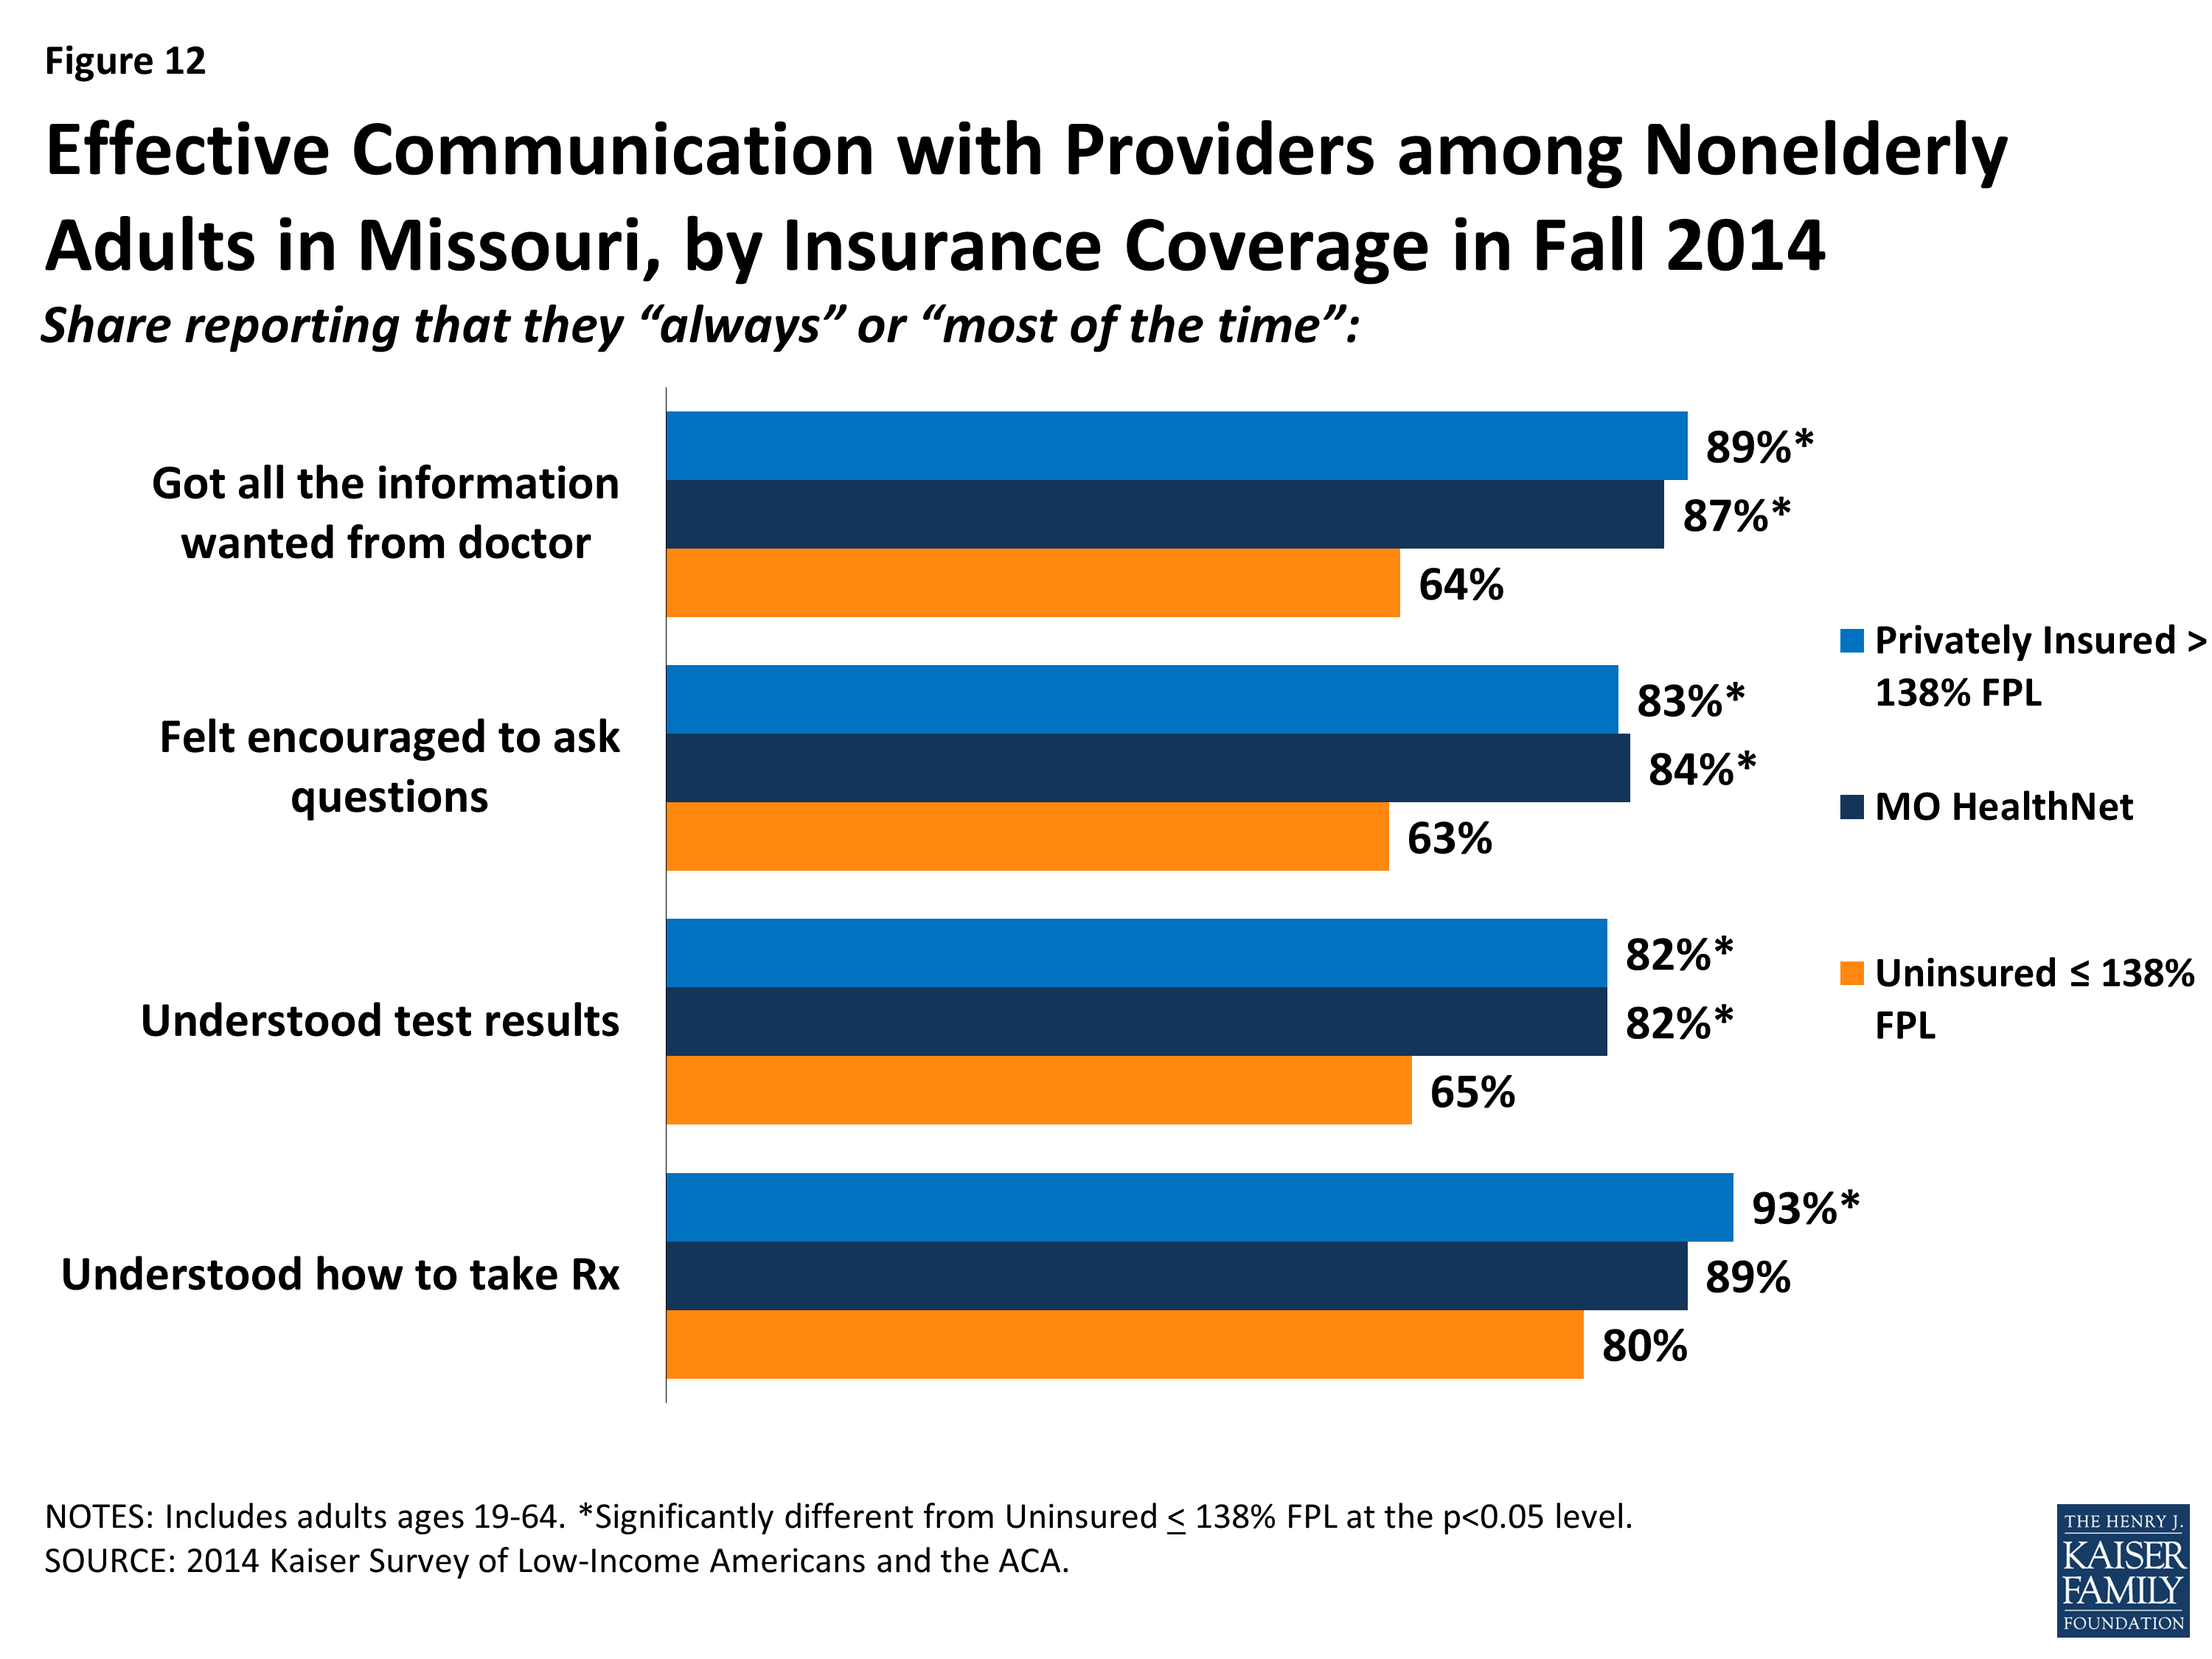
Figure 12: Effective Communication with Providers among Nonelderly Adults in Missouri, by Insurance Coverage in Fall 2014
How does coverage affect financial security?
Although all low-income adults face financial insecurity, having health insurance eases the concern about medical expenses. Those enrolled in MO HealthNet demonstrate the “peace-of-mind” value of health insurance. Although over half of those enrolled in MO HealthNet are financially insecure in general, only about a third are not confident that they can afford major medical costs. In contrast, low-income uninsured adults live with worry about medical costs in addition to their general financial instability.
Medical bills lead to an array of financial problems for the low-income uninsured that those with MO HealthNet or private insurance do not encounter as frequently. Despite being less likely to use services, over half (53%) of the low-income uninsured report a problem paying their medical bills. The low-income uninsured were also more likely than low-income adults with either MO HealthNet or private coverage to report serious consequences from medical bills, such as using up their savings, having difficulty paying for necessities, borrowing money, or being sent to collection (Figure 13).
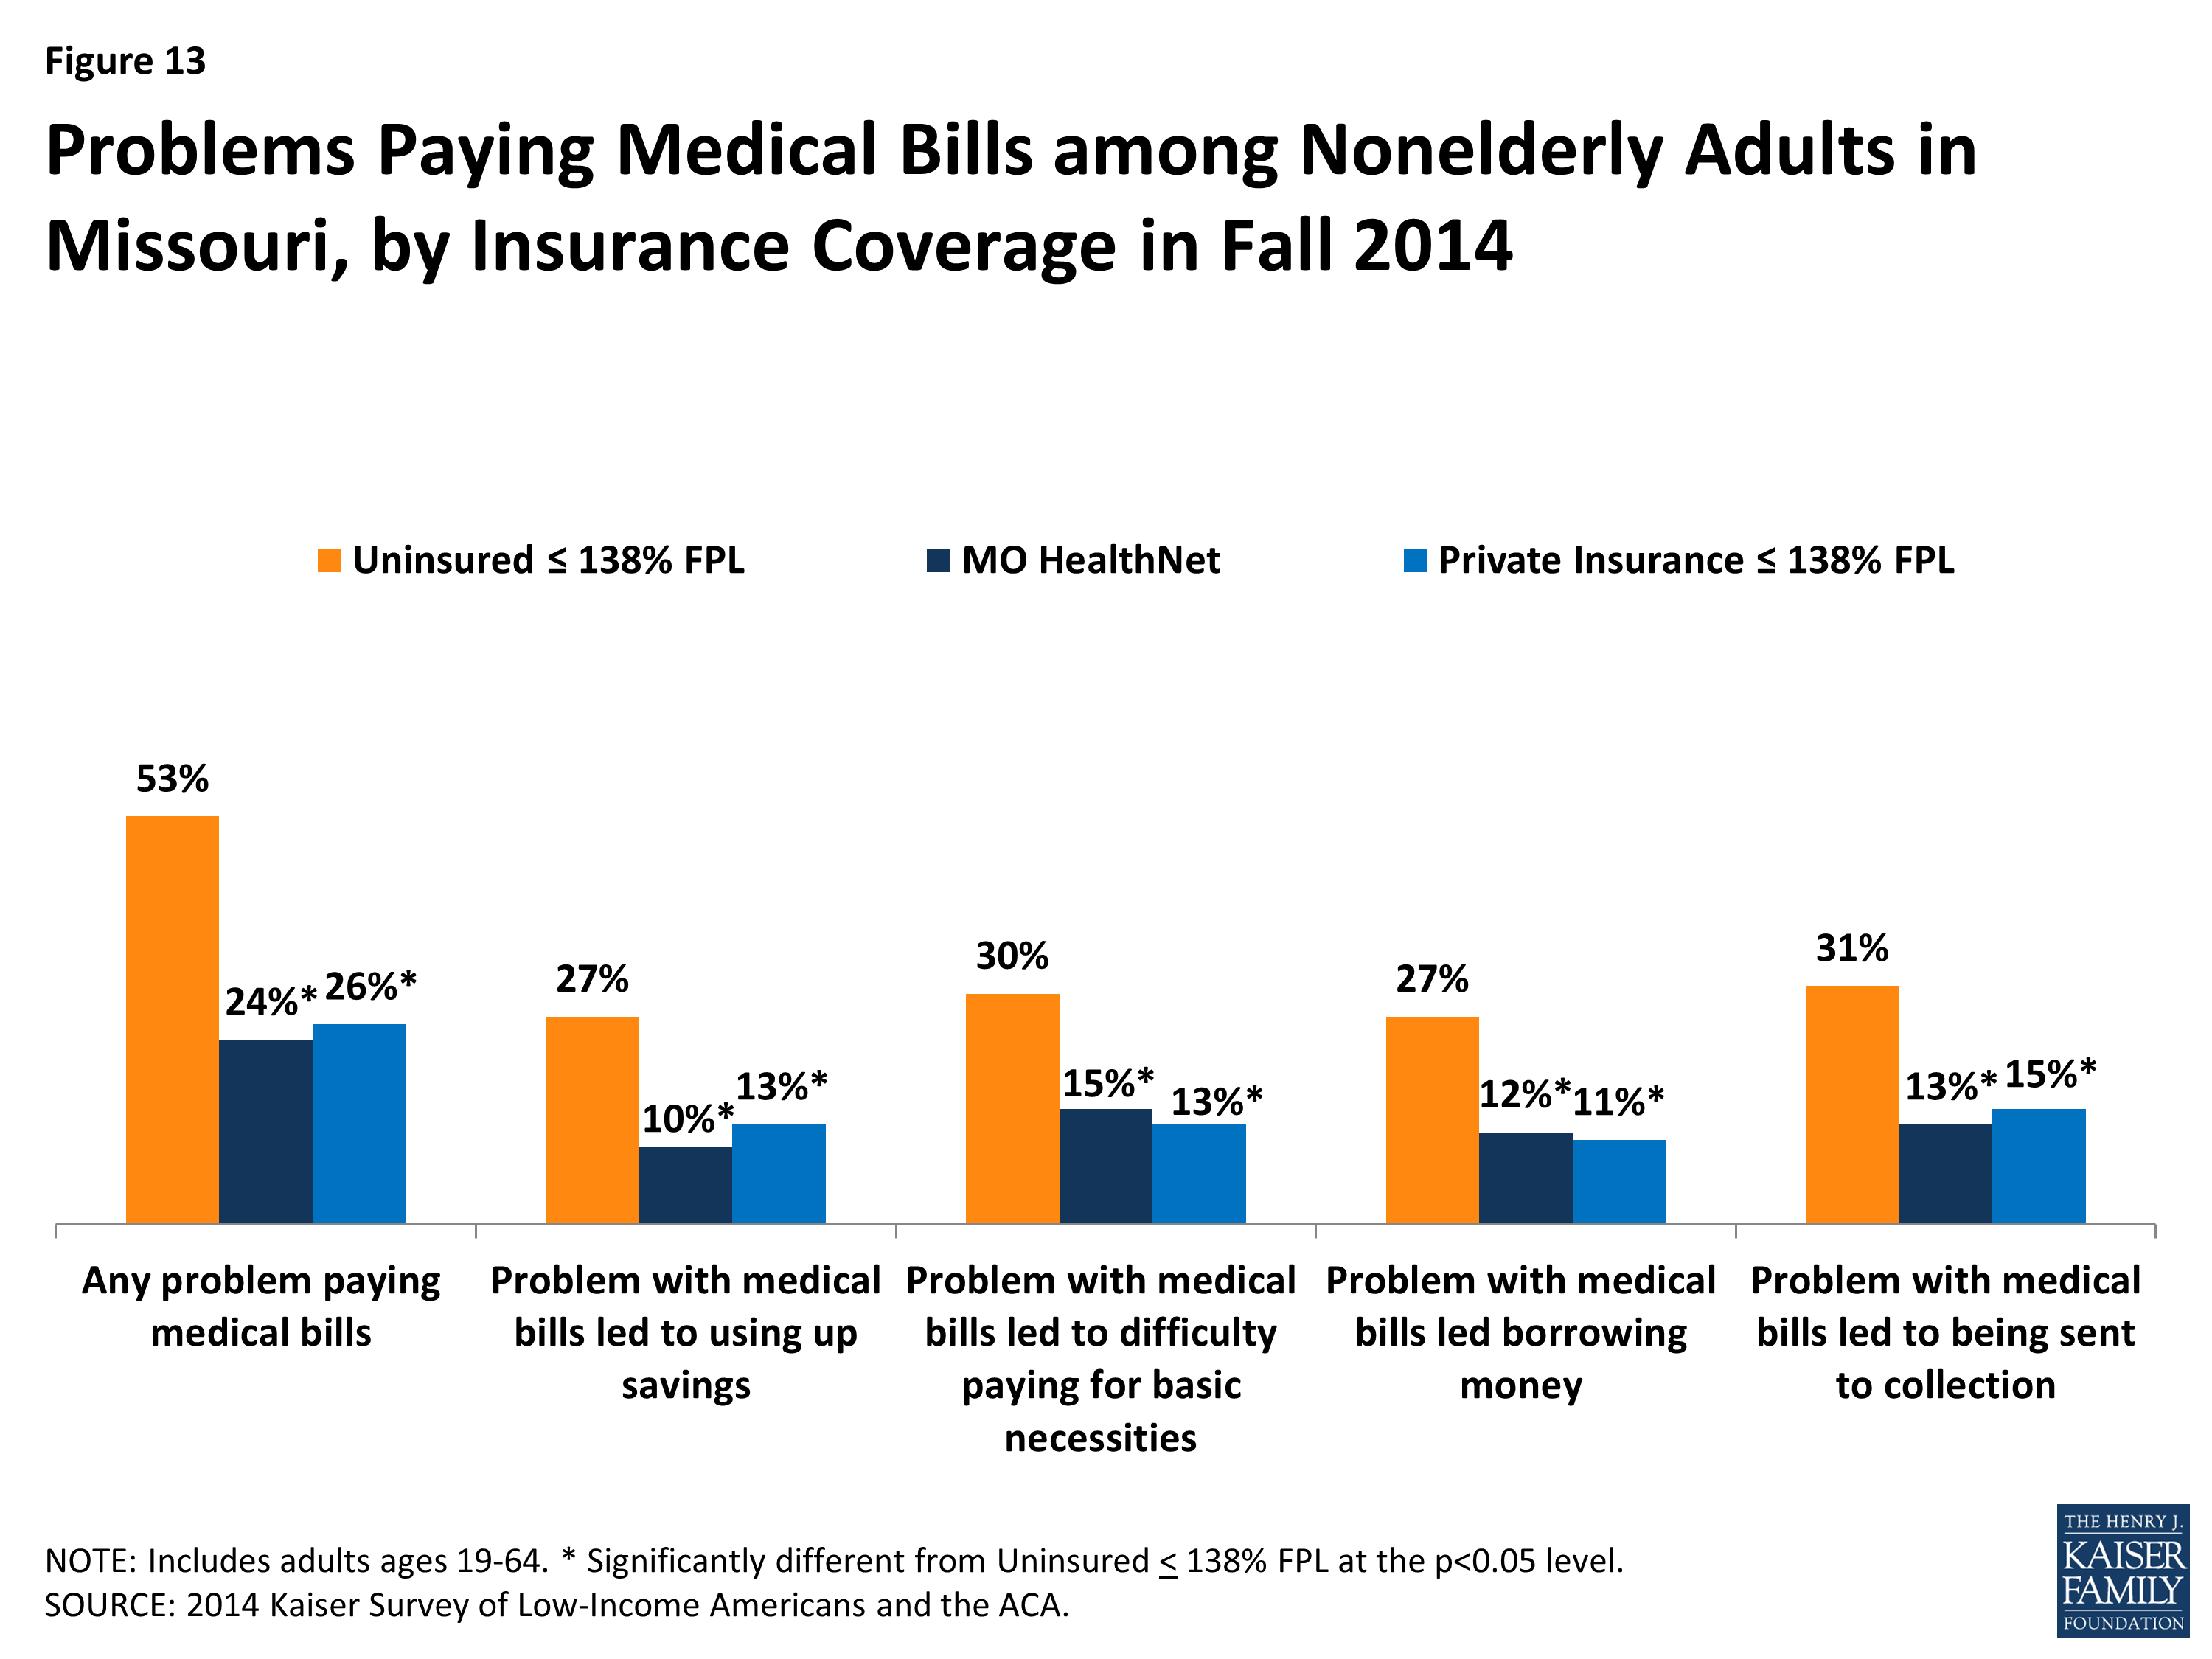
Figure 13: Problems Paying Medical Bills among Nonelderly Adults in Missouri, by Insurance Coverage in Fall 2014
In addition to being more likely to report experiencing financial strain due to medical bills, the low-income uninsured are more likely than others to report living with worry about their ability to afford medical care in the future. As we found in the 2013 survey, the uninsured are much more likely than those with MO HealthNet or the privately insured to lack confidence that they can afford health care costs for usual circumstances or major illnesses.1 In 2014, over three quarters (78%) of the low-income uninsured are not confident they can afford usual medical costs, and close to nine in ten (86%) are not confident they can afford major medical costs. This is in stark contrast to the low-income privately insured, and especially to those enrolled in MO HealthNet. Although more low-income privately insured are not confident that they can afford major medical costs than the share of low-income privately insured who are not confident they can afford usual medical costs, we do not detect a difference between the share of those enrolled in MO HealthNet that are not confident that they can afford usual medical costs and those that are not confident they can afford major medical costs.
Just as higher rates of postponing care among the low-income uninsured affect these persons’ engagement in work, school, and other activities (discussed above), the worry about medical costs also affects low-income uninsured adults’ job performance, family relationships, or ability to sleep at a higher rate (36%) compared to the mid-income uninsured (17%), those enrolled in MO HealthNet (18%), and the low-income privately insured (13%) (Figure 14 and Additional Table A3).
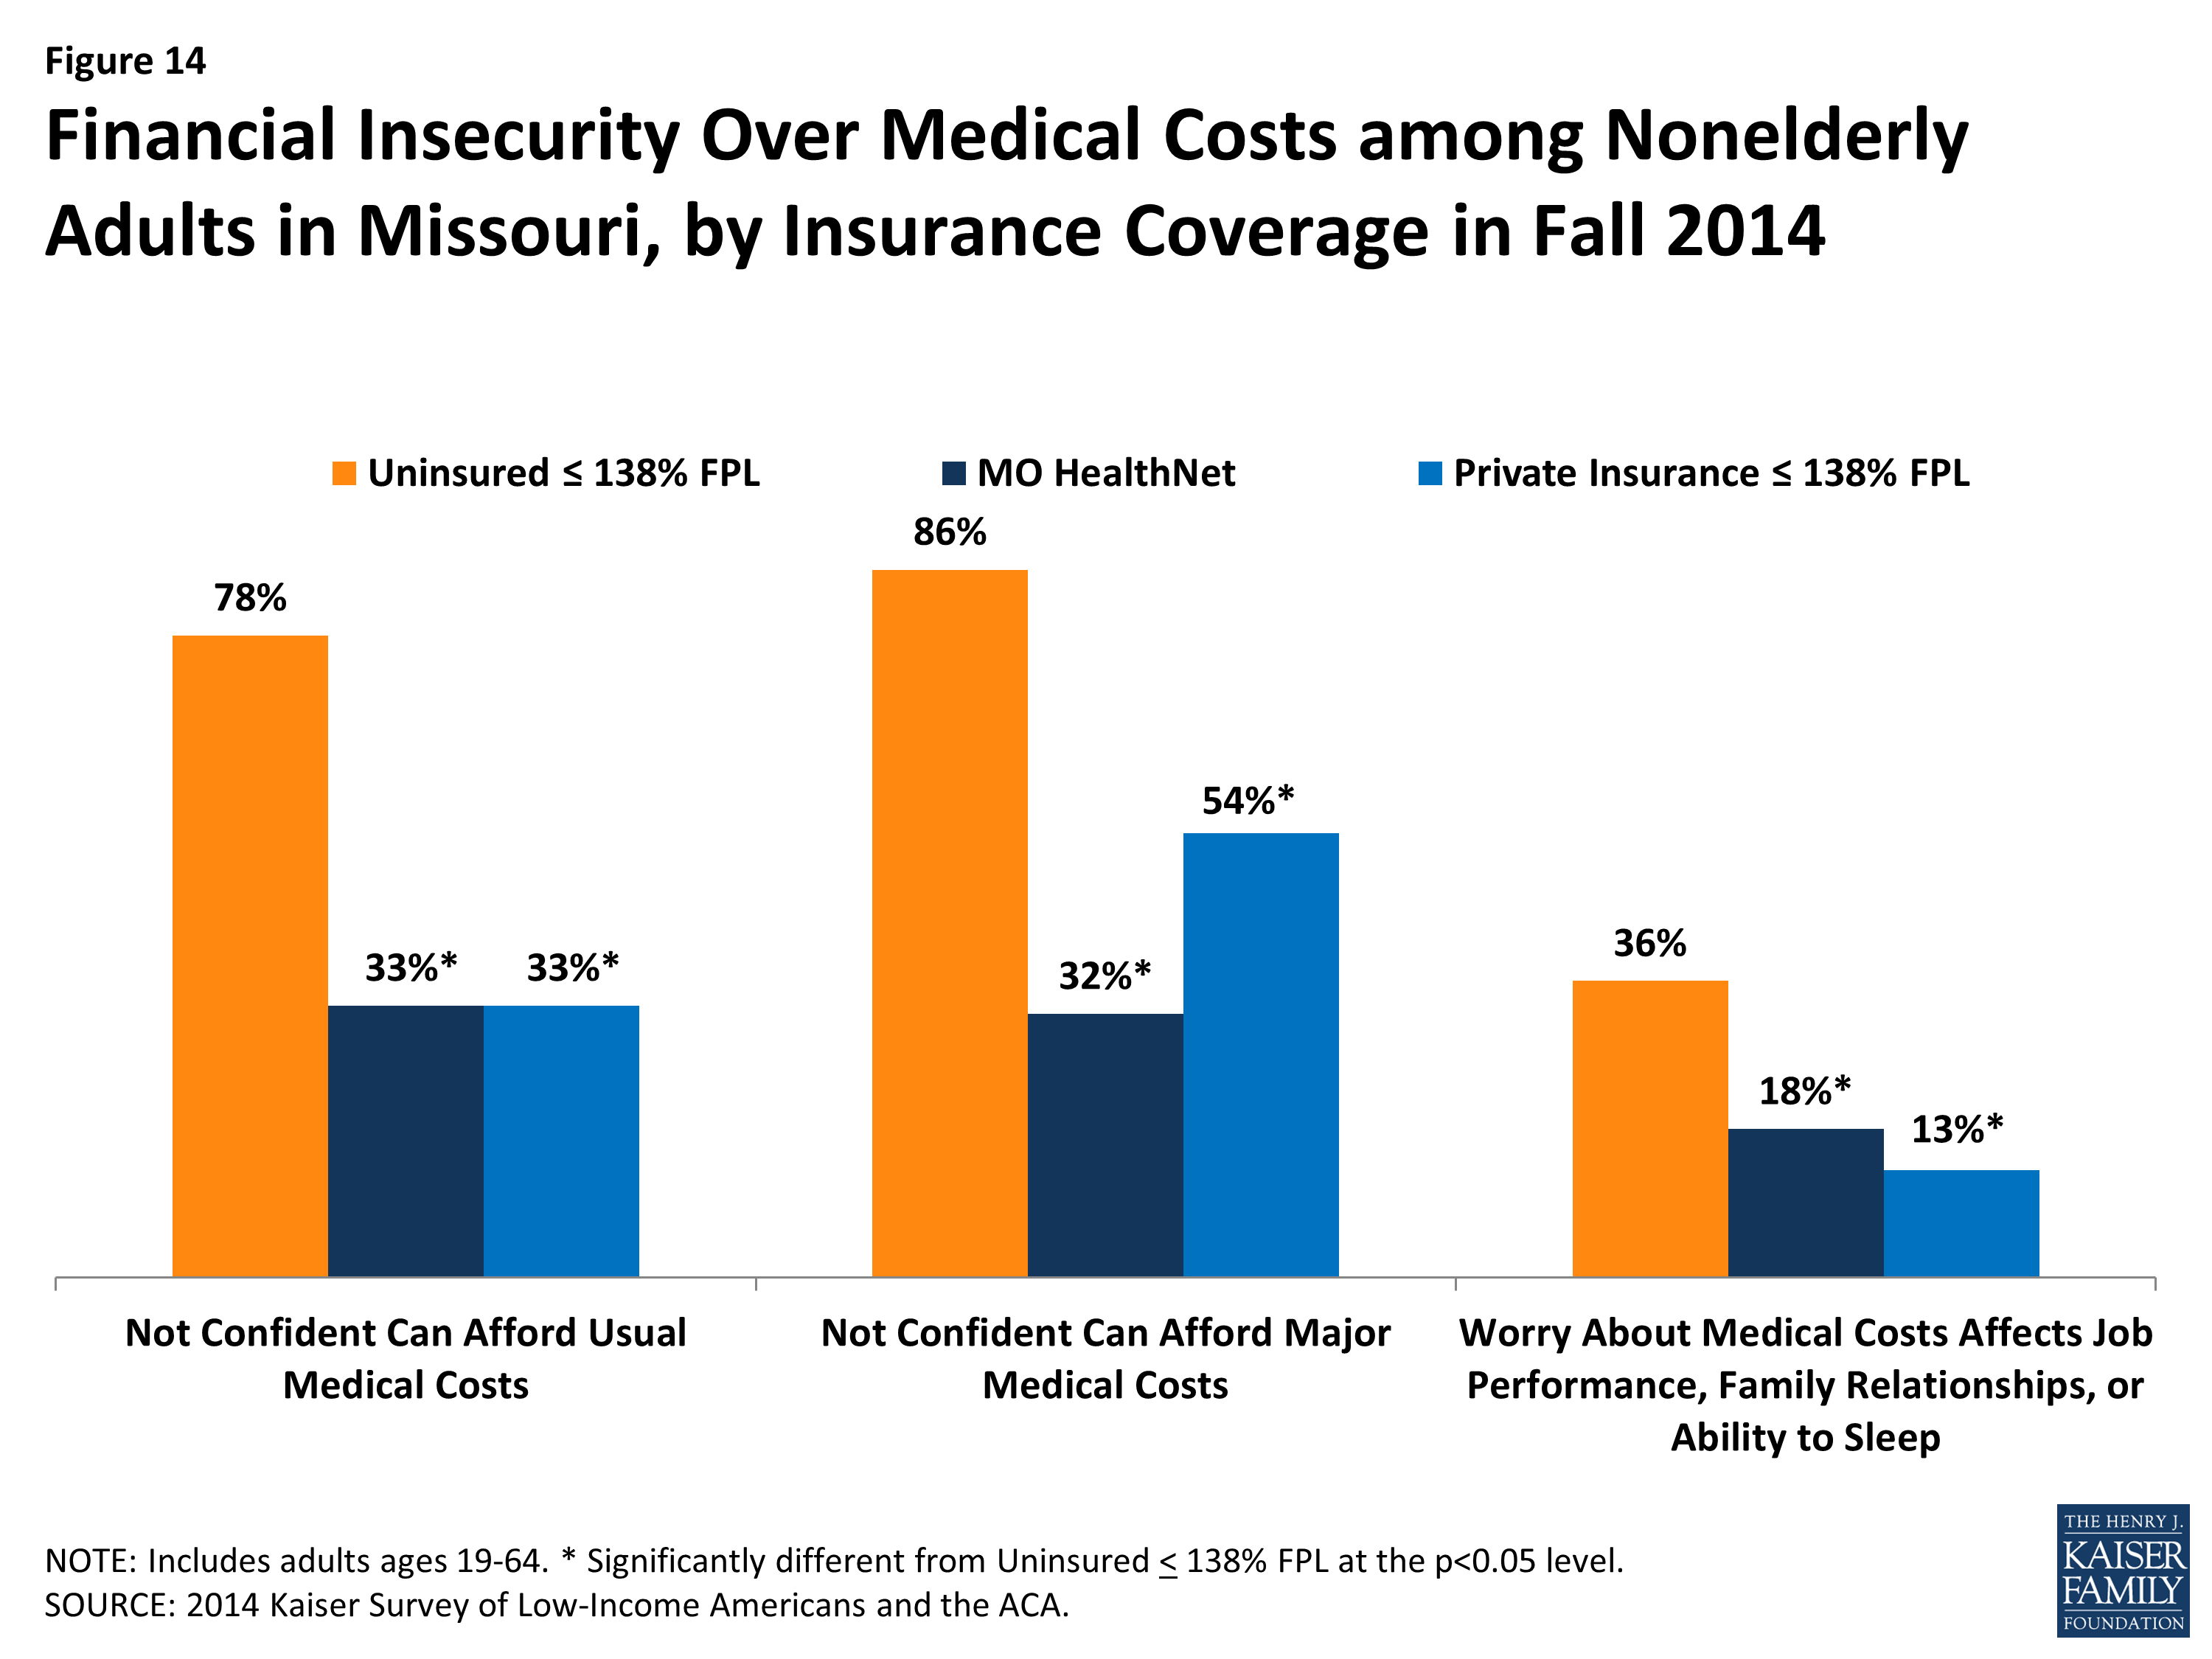
Figure 14: Financial Insecurity Over Medical Costs among Nonelderly Adults in Missouri, by Insurance Coverage in Fall 2014
These differences in problems and worry from medical cost exist even though there are few differences in overall financial stability between the low-income uninsured adults and those enrolled in MO HealthNet. Like low-income uninsured adults, over half of adults with MO HealthNet are generally financially insecure (Figure 15). They also report similar rates of financial difficulty in paying for necessities, saving money, or paying off debt. In contrast, even though low-income adults with private insurance are similarly low-income, they are more financially secure, perhaps reflecting stability due to ties to full-time employment or connections to other resources or support.
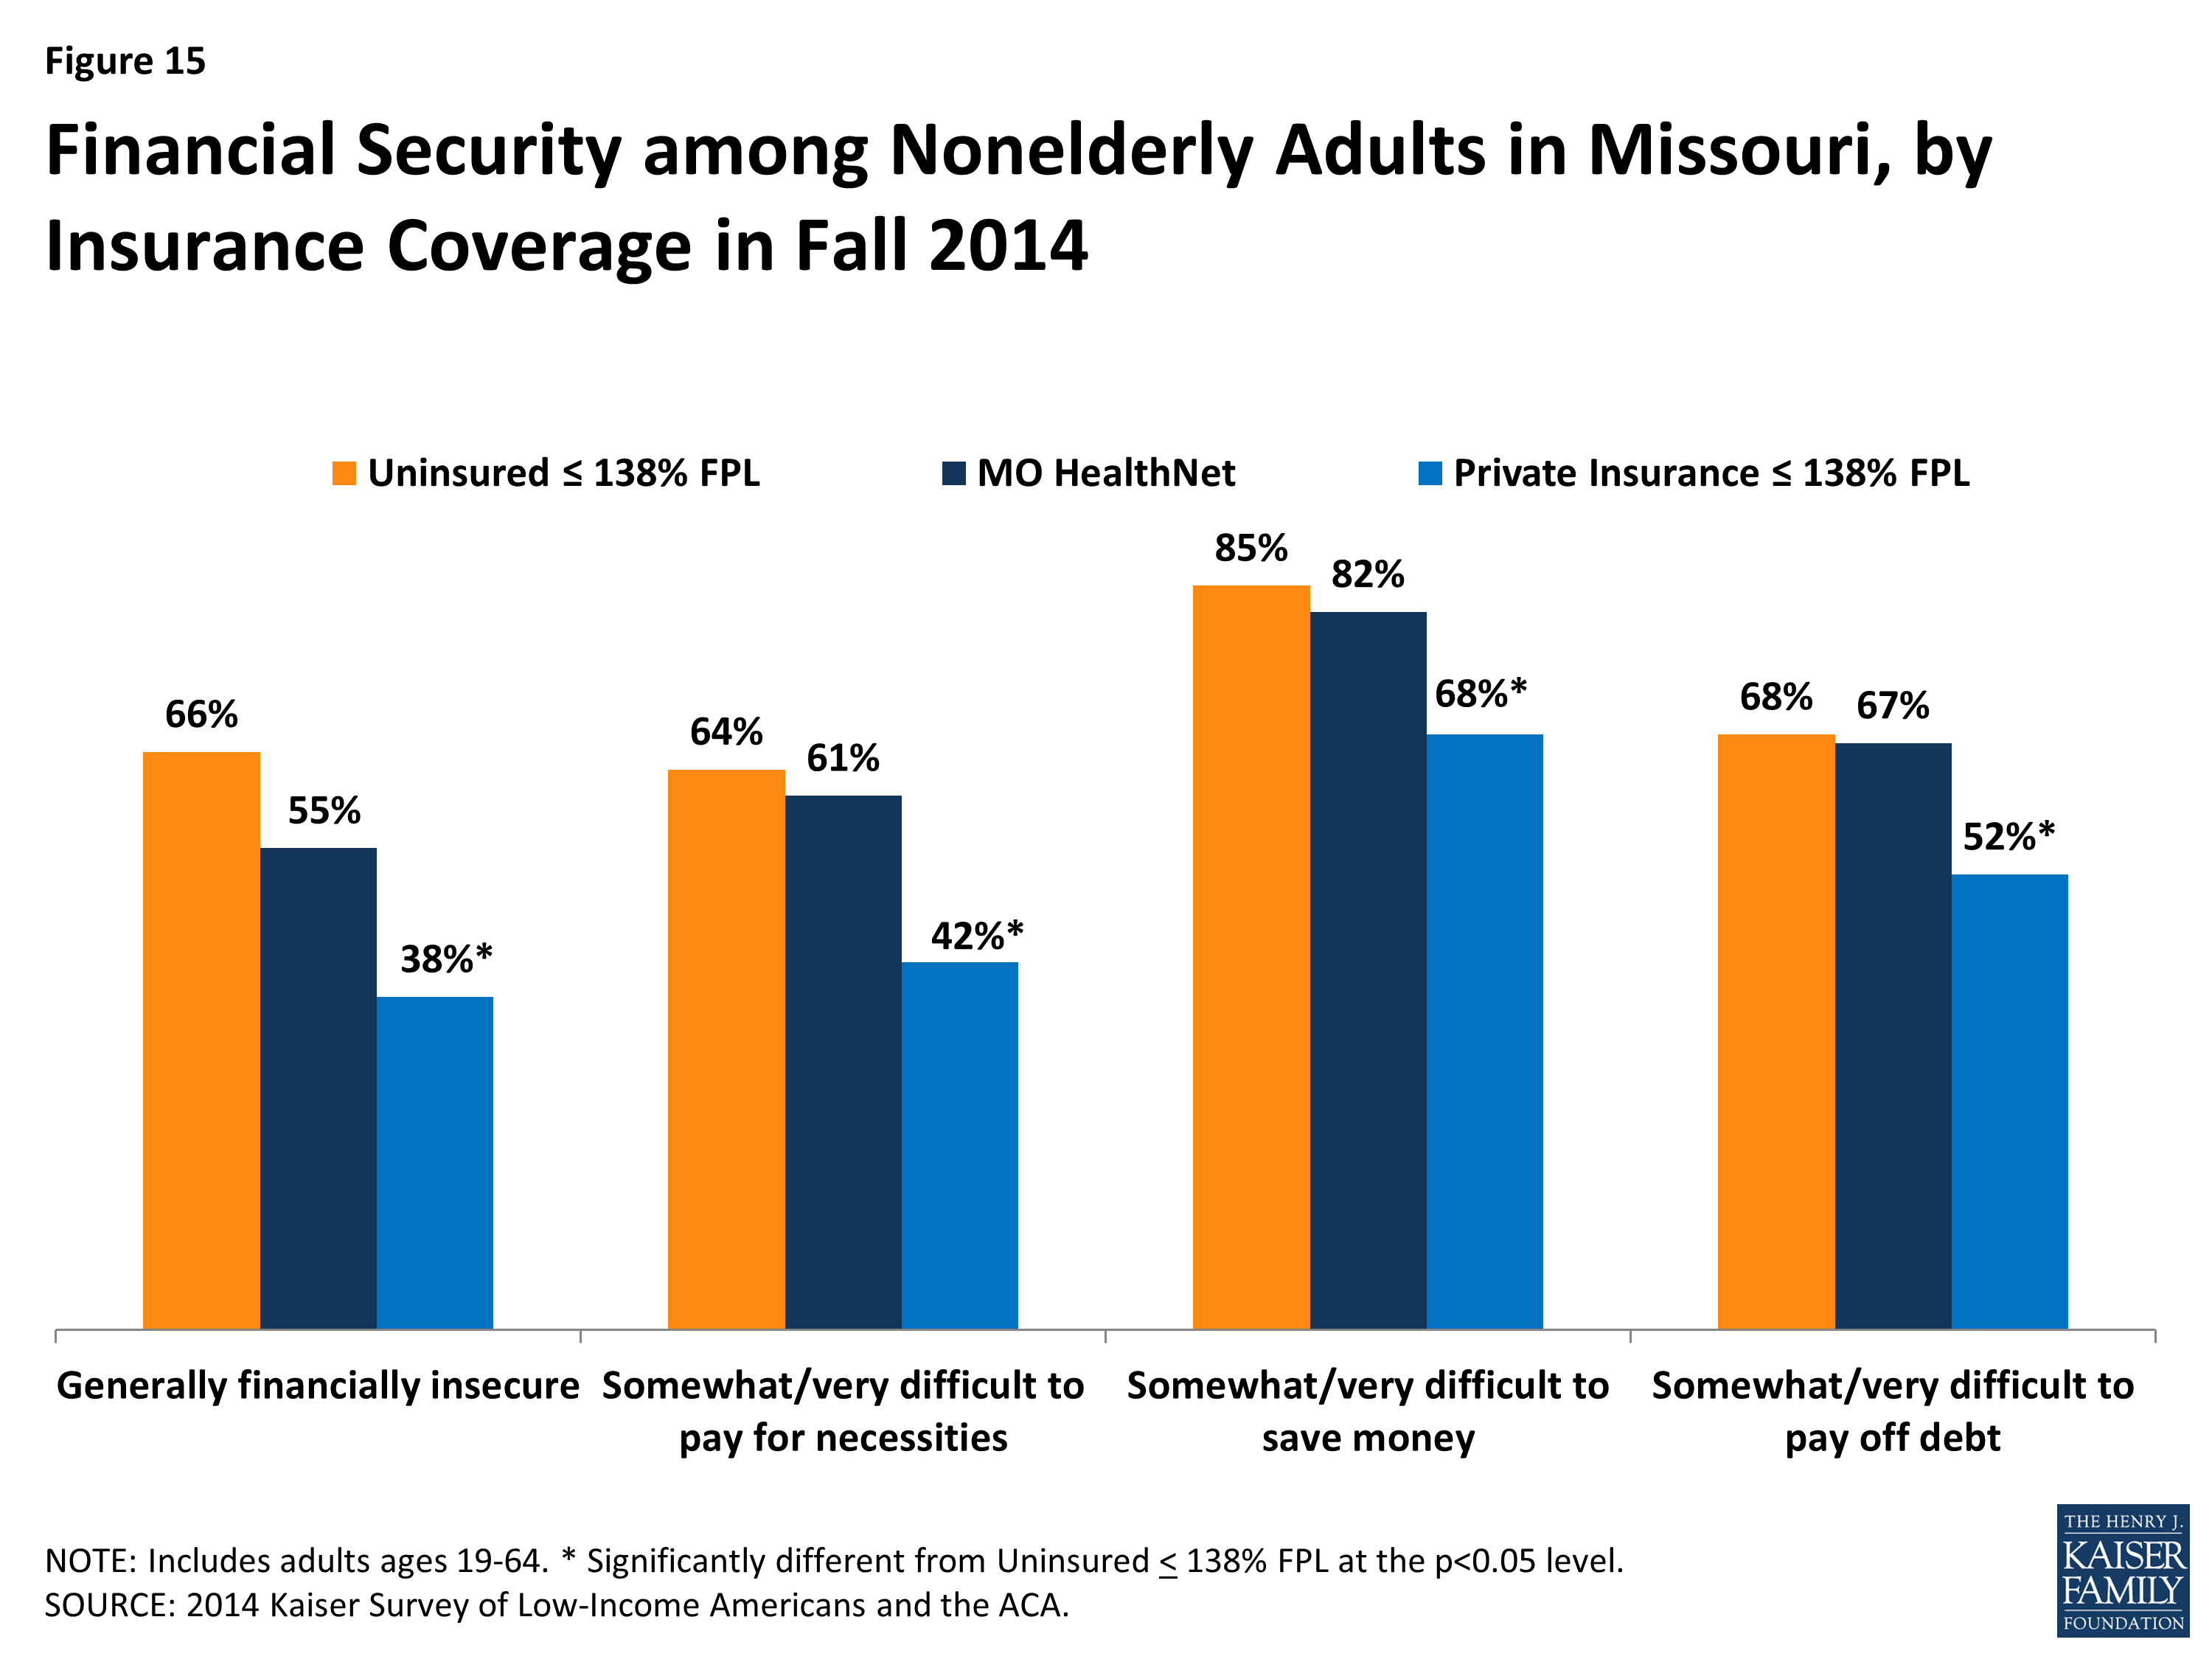
Figure 15: Financial Security among Nonelderly Adults in Missouri, by Insurance Coverage in Fall 2014
Why are people still uninsured and what are their coverage options?
About half of the low-income uninsured report trying to obtain health insurance under the ACA in 2014, demonstrating that many in this population desire to be insured. The majority of this group is ineligible for coverage through their employer. Without Medicaid expansion, the only remaining option for many low-income uninsured is purchasing insurance without any subsidies to offset the cost. Consequently, it is not surprising that cost is the major reason that the low-income uninsured remain uninsured.
The majority of the low-income uninsured remain uninsured because they find coverage to be too expensive. The ACA aimed to make coverage more affordable, but Medicaid expansion was a major part of the intended design. Without Medicaid expansion or subsidies for the Marketplace, the majority (65%) of low-income uninsured report that they are without insurance because of cost. A small share (7%) report that they are uninsured because they either opposed the ACA, prefer to pay the penalty, or feel they do not need insurance (Figure 16). Notably, low-income uninsured adults in Missouri were less likely to name a job-related reason for lacking coverage in 2014 compared to 2013: 10 percent cited a job-related reason for lack of insurance in 2014 compared to 26 percent in 2013 (data not shown).
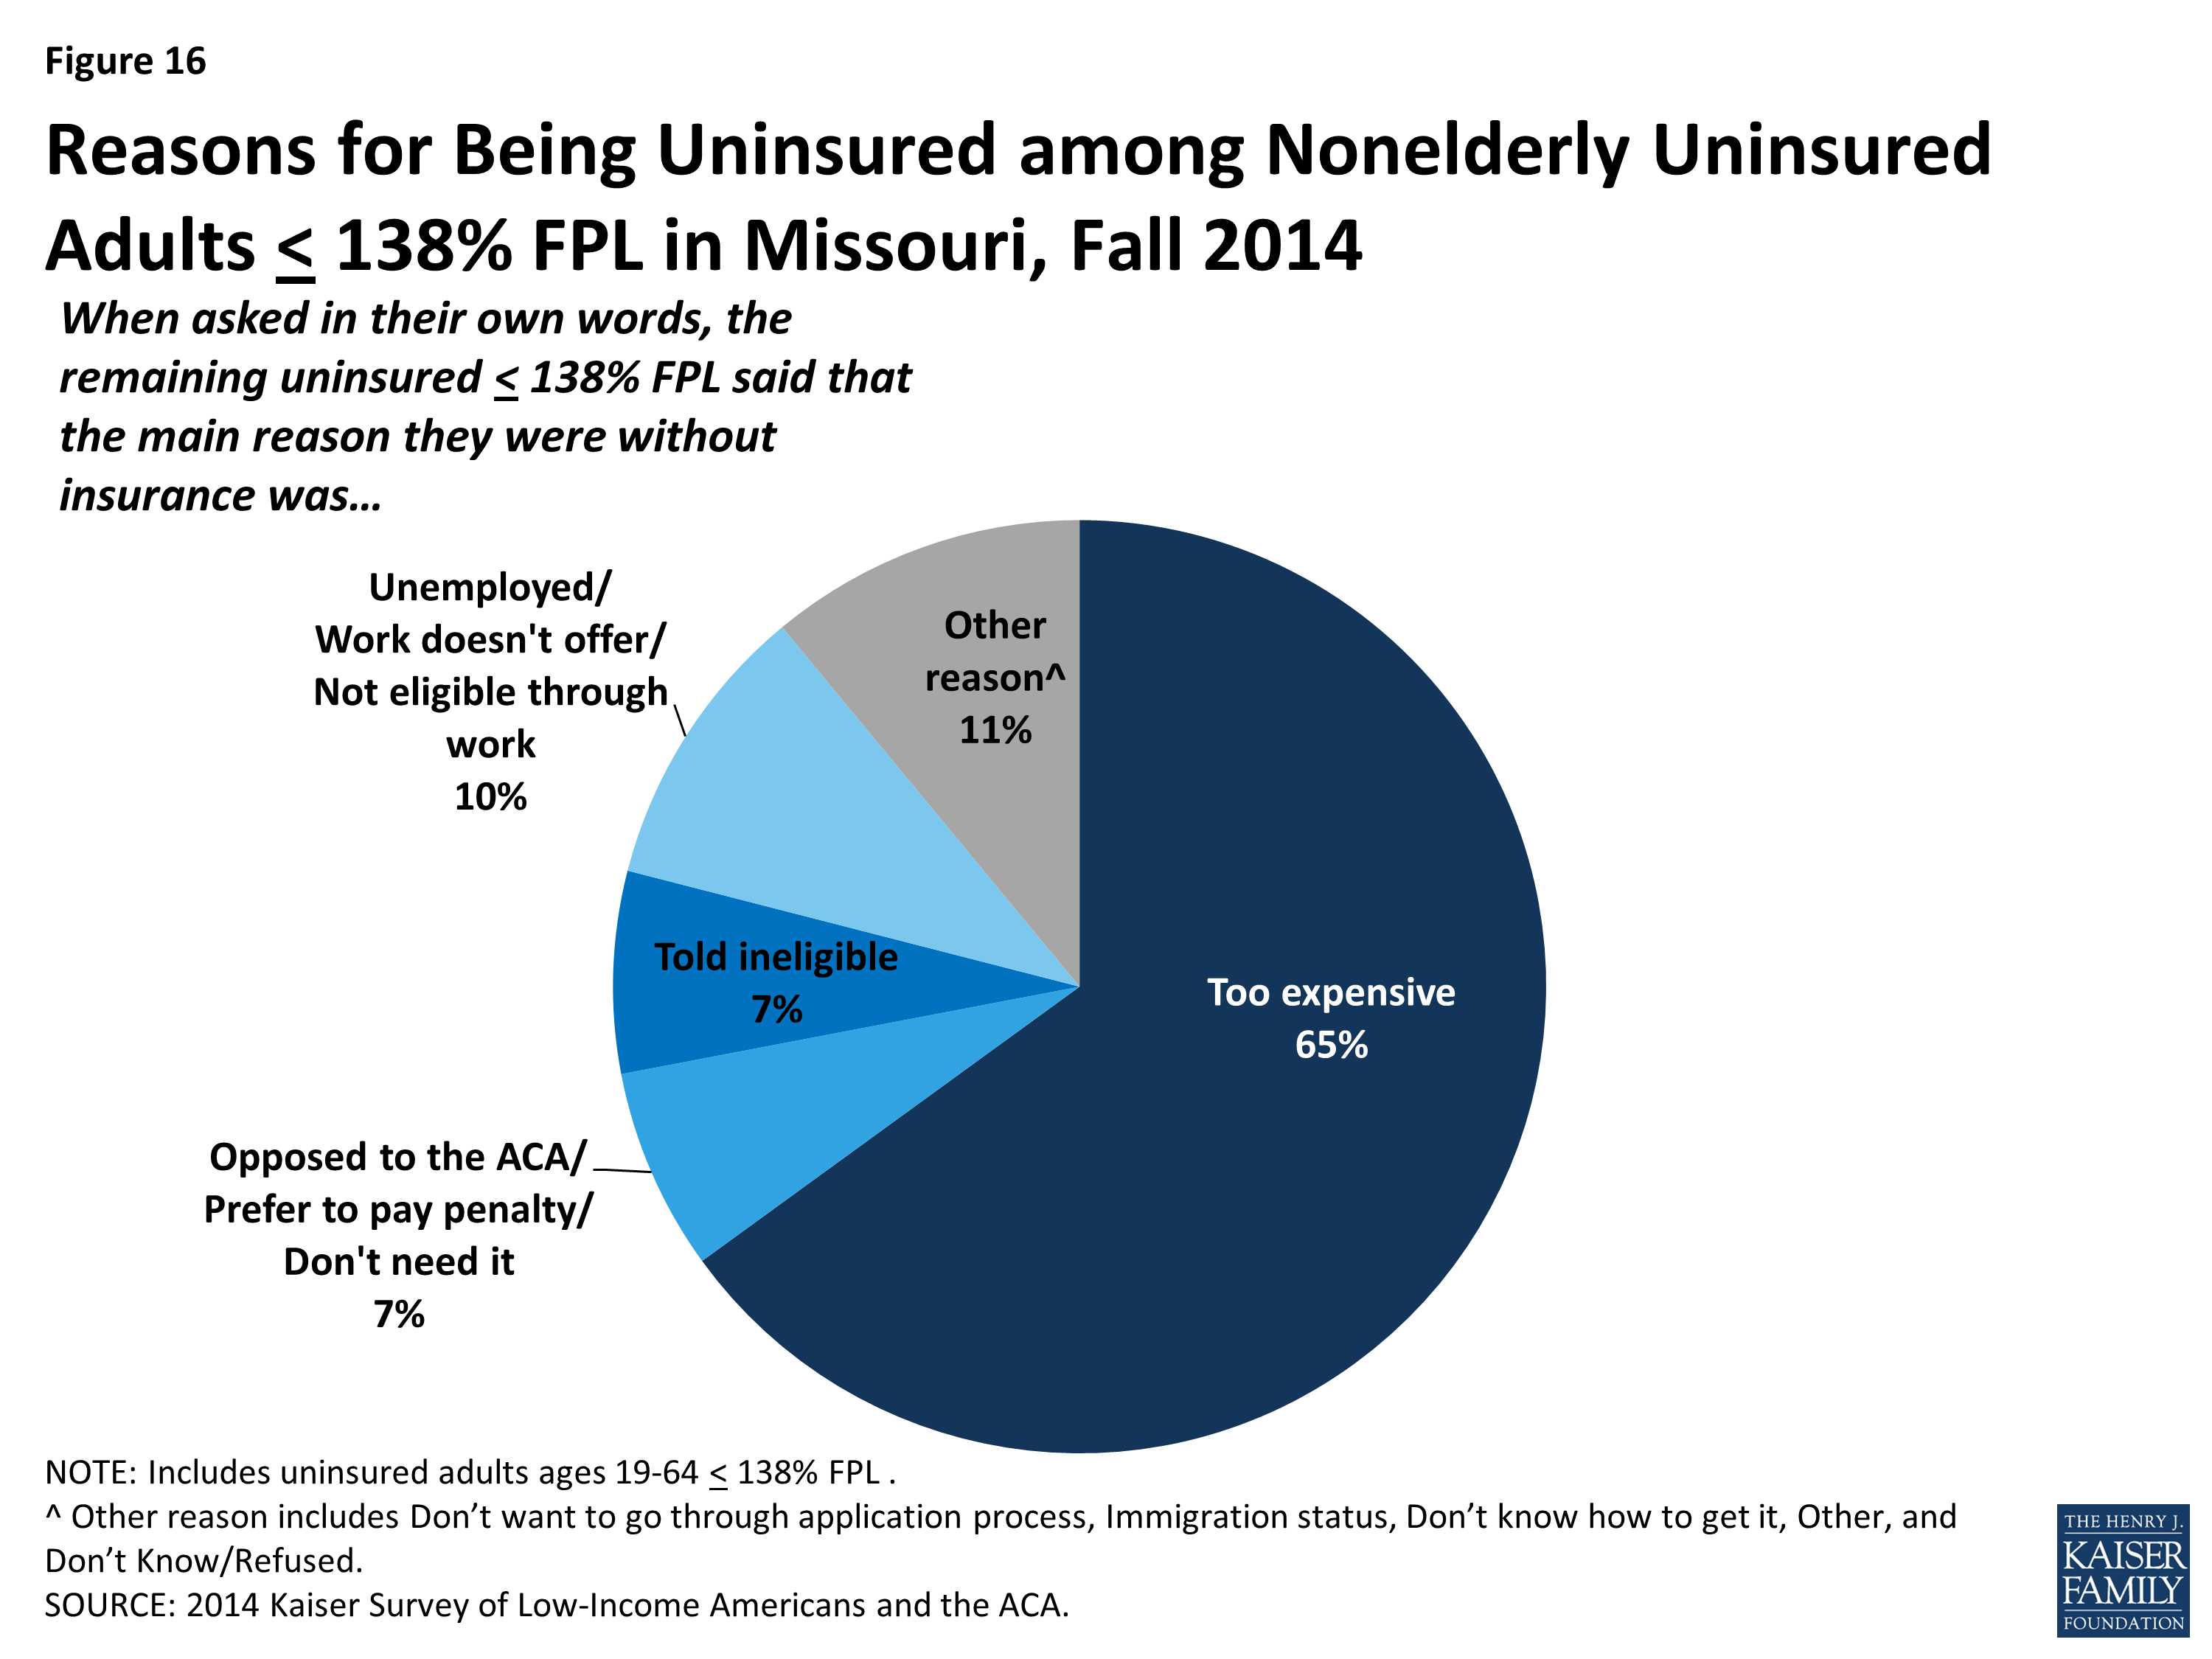
Figure 16: Reasons for Being Uninsured among Nonelderly Uninsured Adults ≤ 138% FPL in Missouri, Fall 2014
Many low-income uninsured tried to obtain ACA insurance but either encountered difficulty or were told they were ineligible. Forty-six percent of the low-income uninsured tried to obtain Medicaid or Marketplace insurance, but many encountered difficulties. About seven in ten (71%) encountered difficulty with at least one aspect of applying (Figure 17). About two-thirds (67%) tried to apply using more than one pathway. About half (46%) tried to sign up using the healthcare.gov website, about half (46%) called the Marketplace 1-800 number, and more than half (57%) visited the MO HealthNet agency (Figure 18). Ultimately, however, these people remained uninsured, saying that they were told they were ineligible and that coverage was too expensive. Interestingly, one in six (16%) of those who did apply said that their coverage was pending (Figure 19). Missouri has been working to resolve the backlog of Medicaid applications that accrued in 2014.1
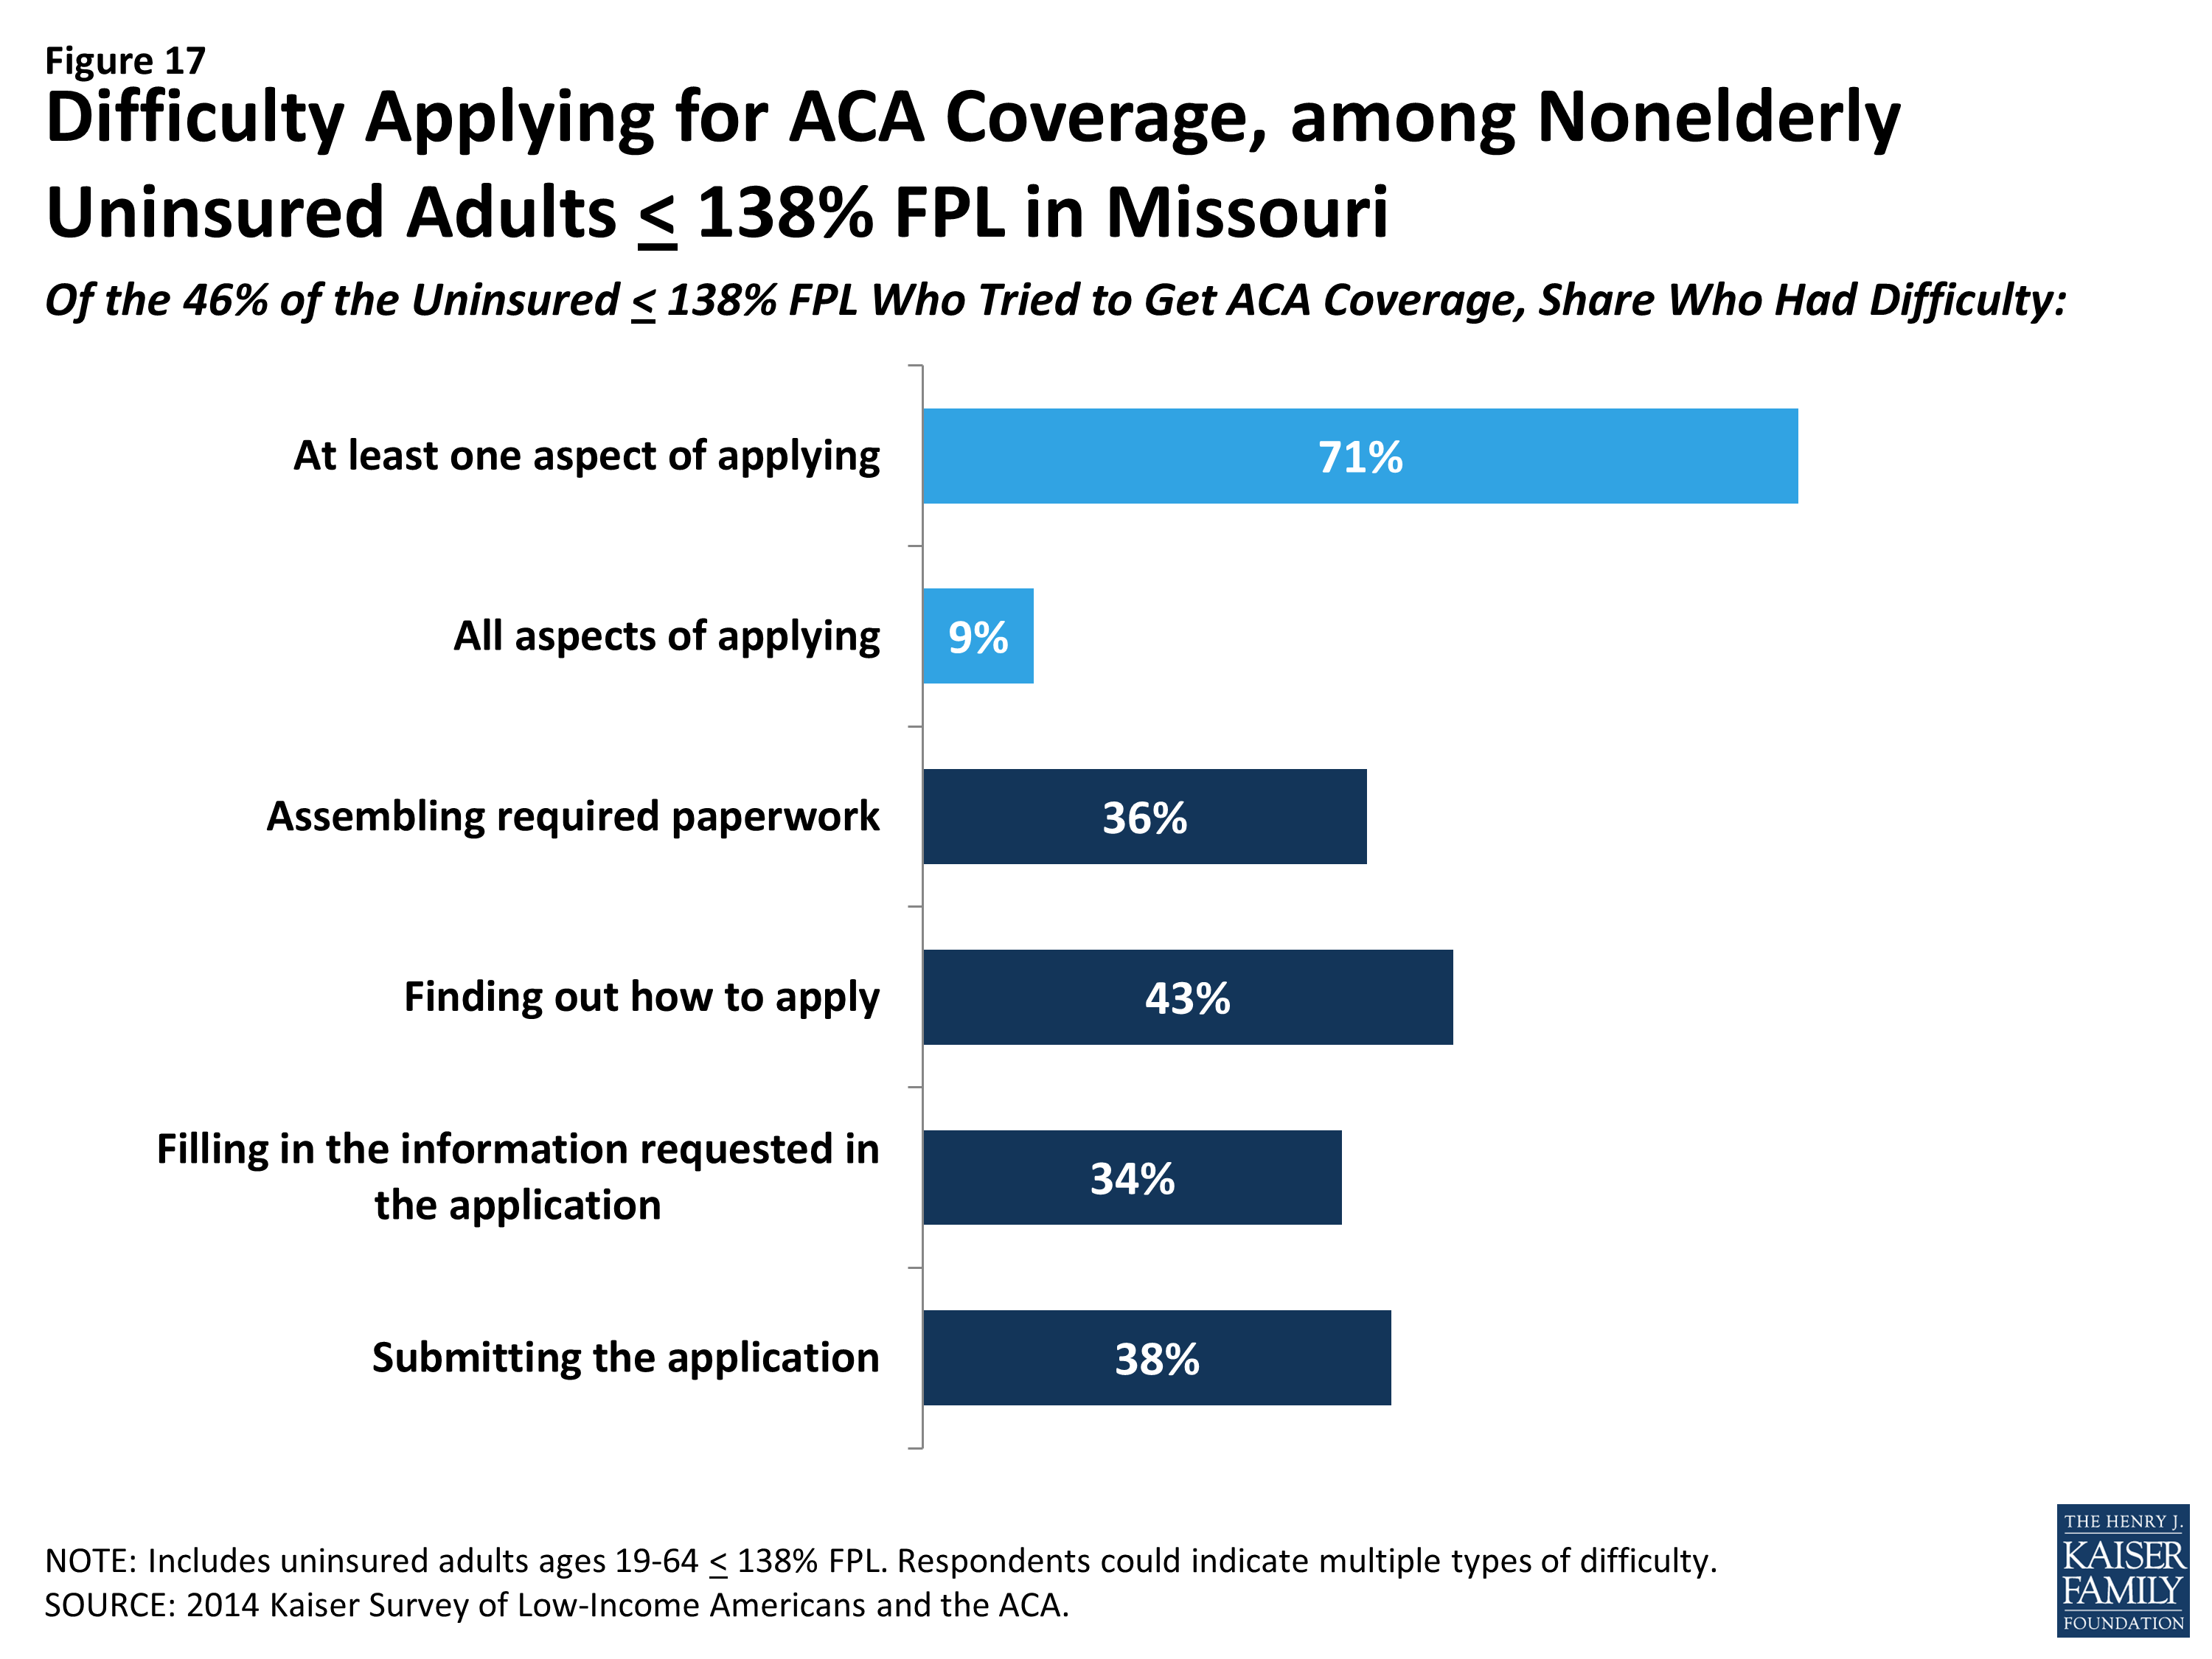
Figure 17: Difficulty Applying for ACA Coverage, among Nonelderly Uninsured Adults ≤ 138% FPL in Missouri
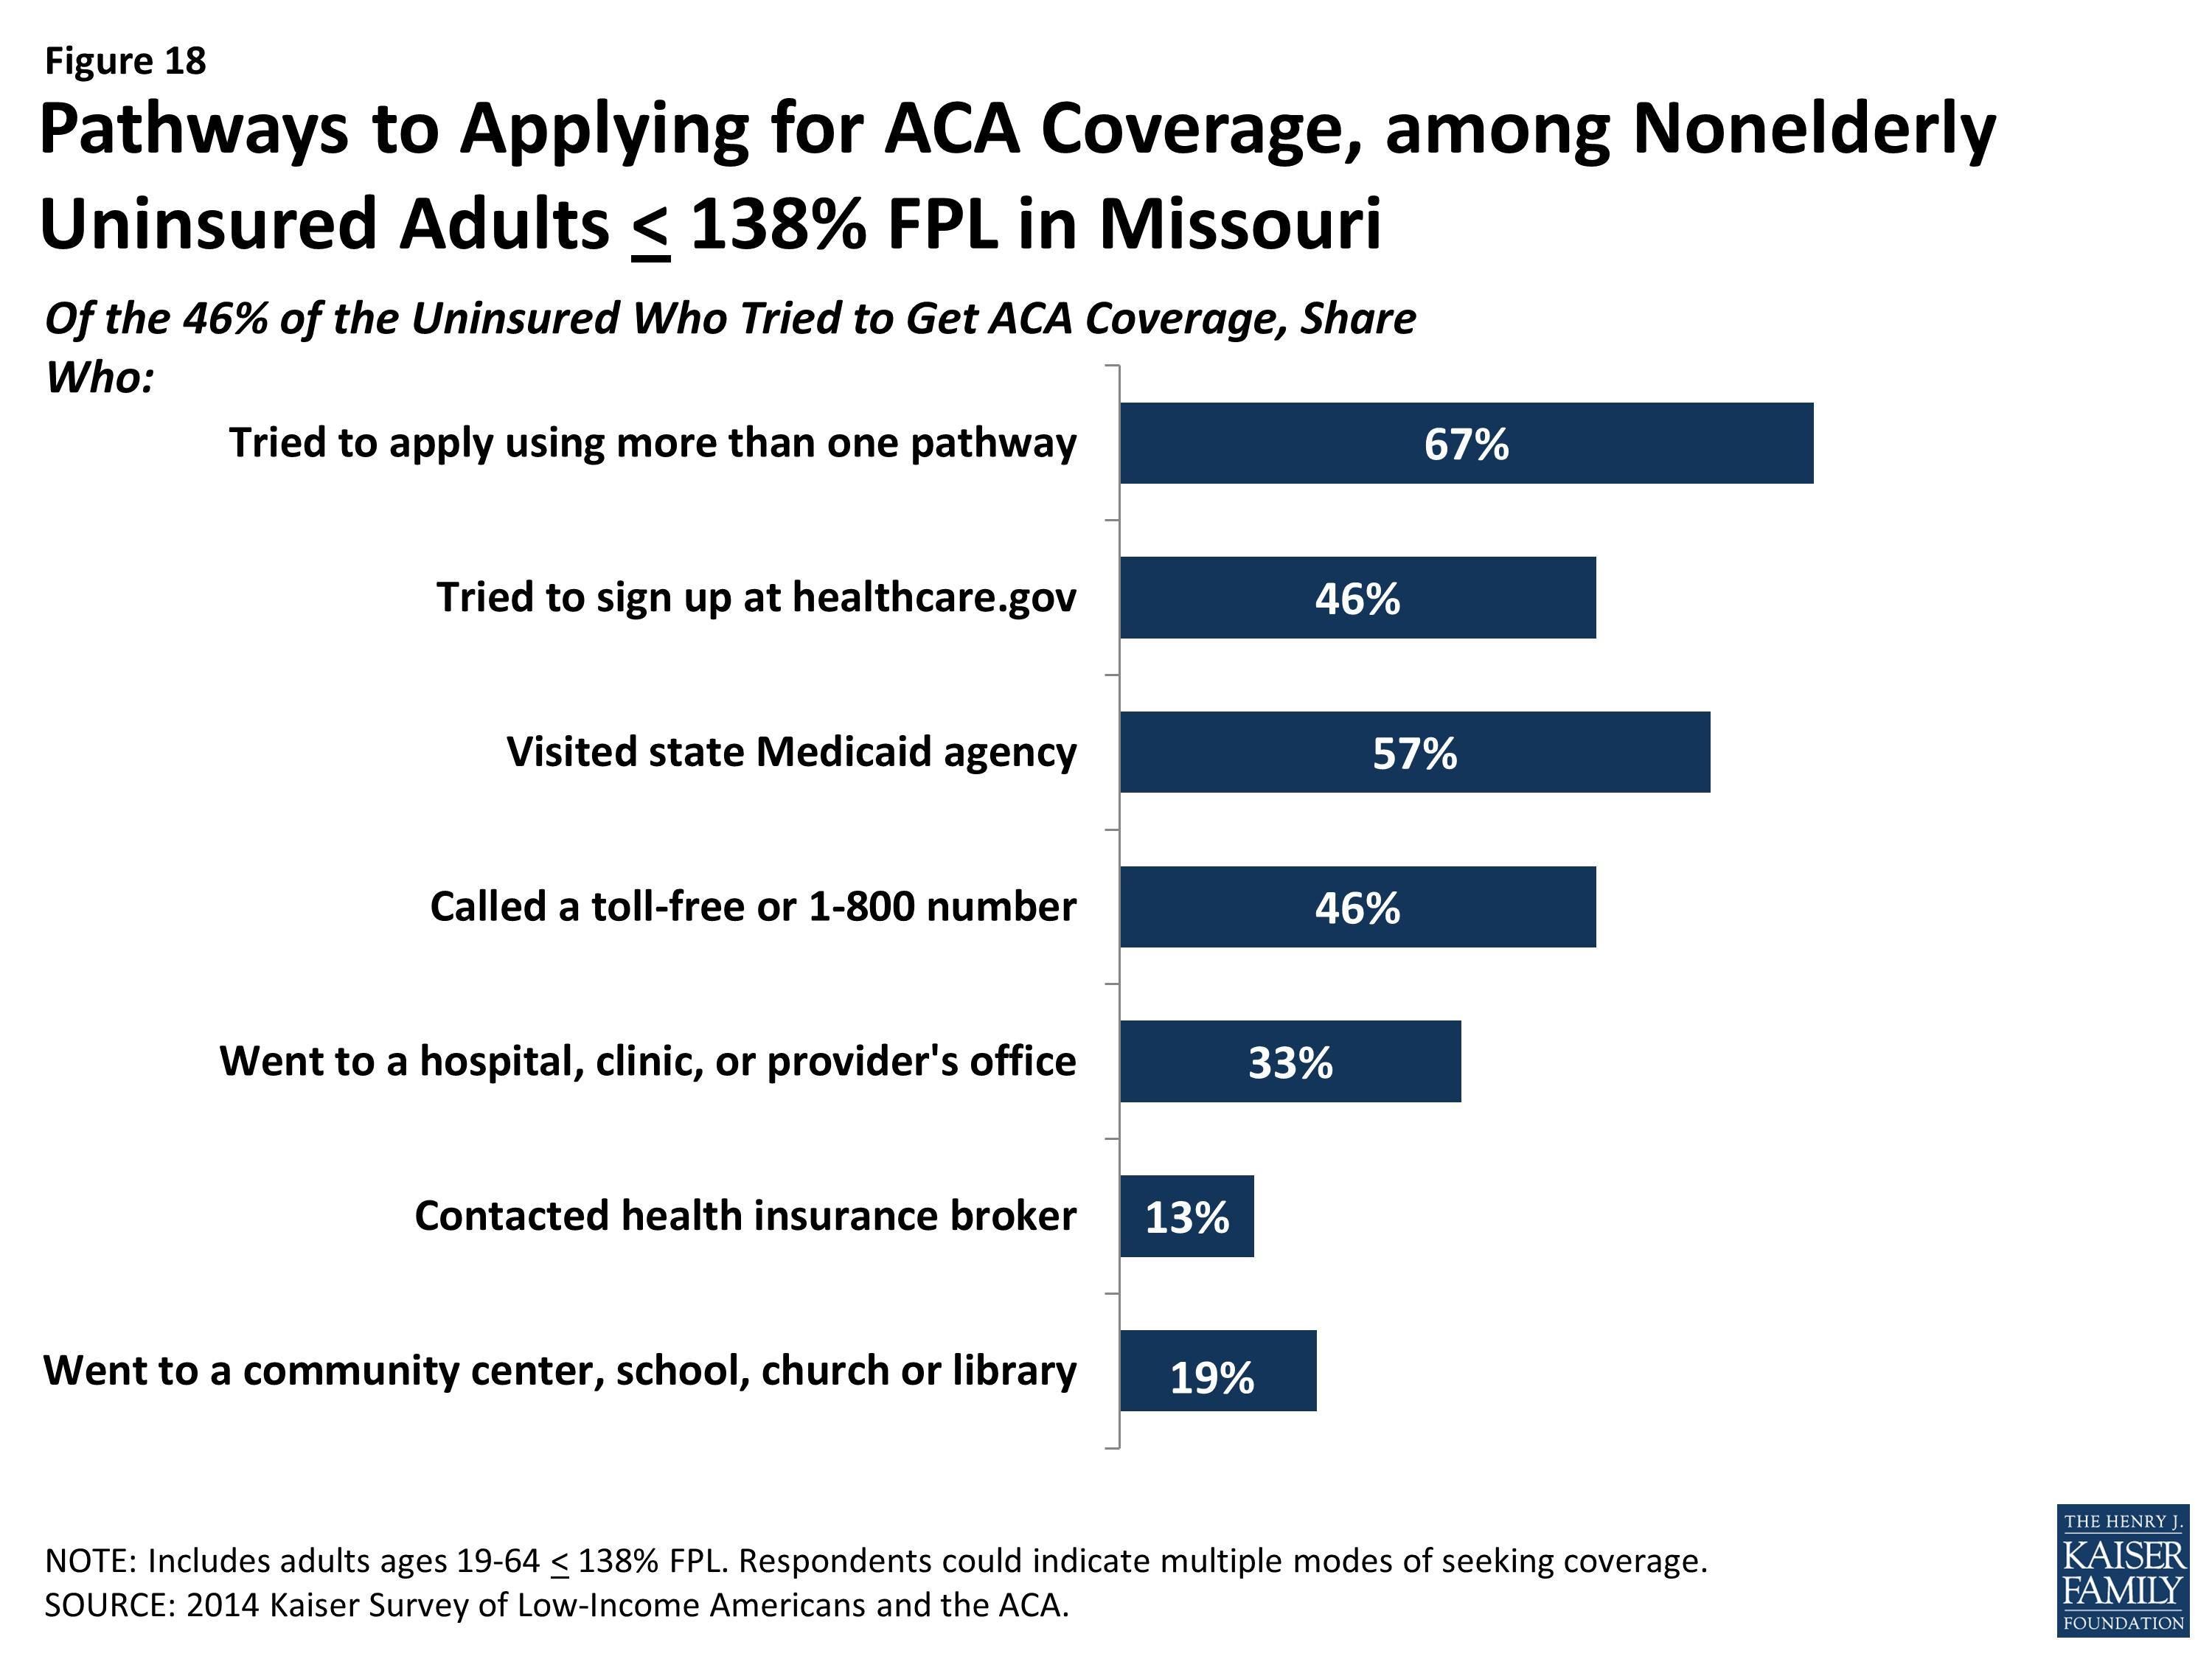
Figure 18: Pathways to Applying for ACA Coverage, among Nonelderly Uninsured Adults ≤ 138% FPL in Missouri
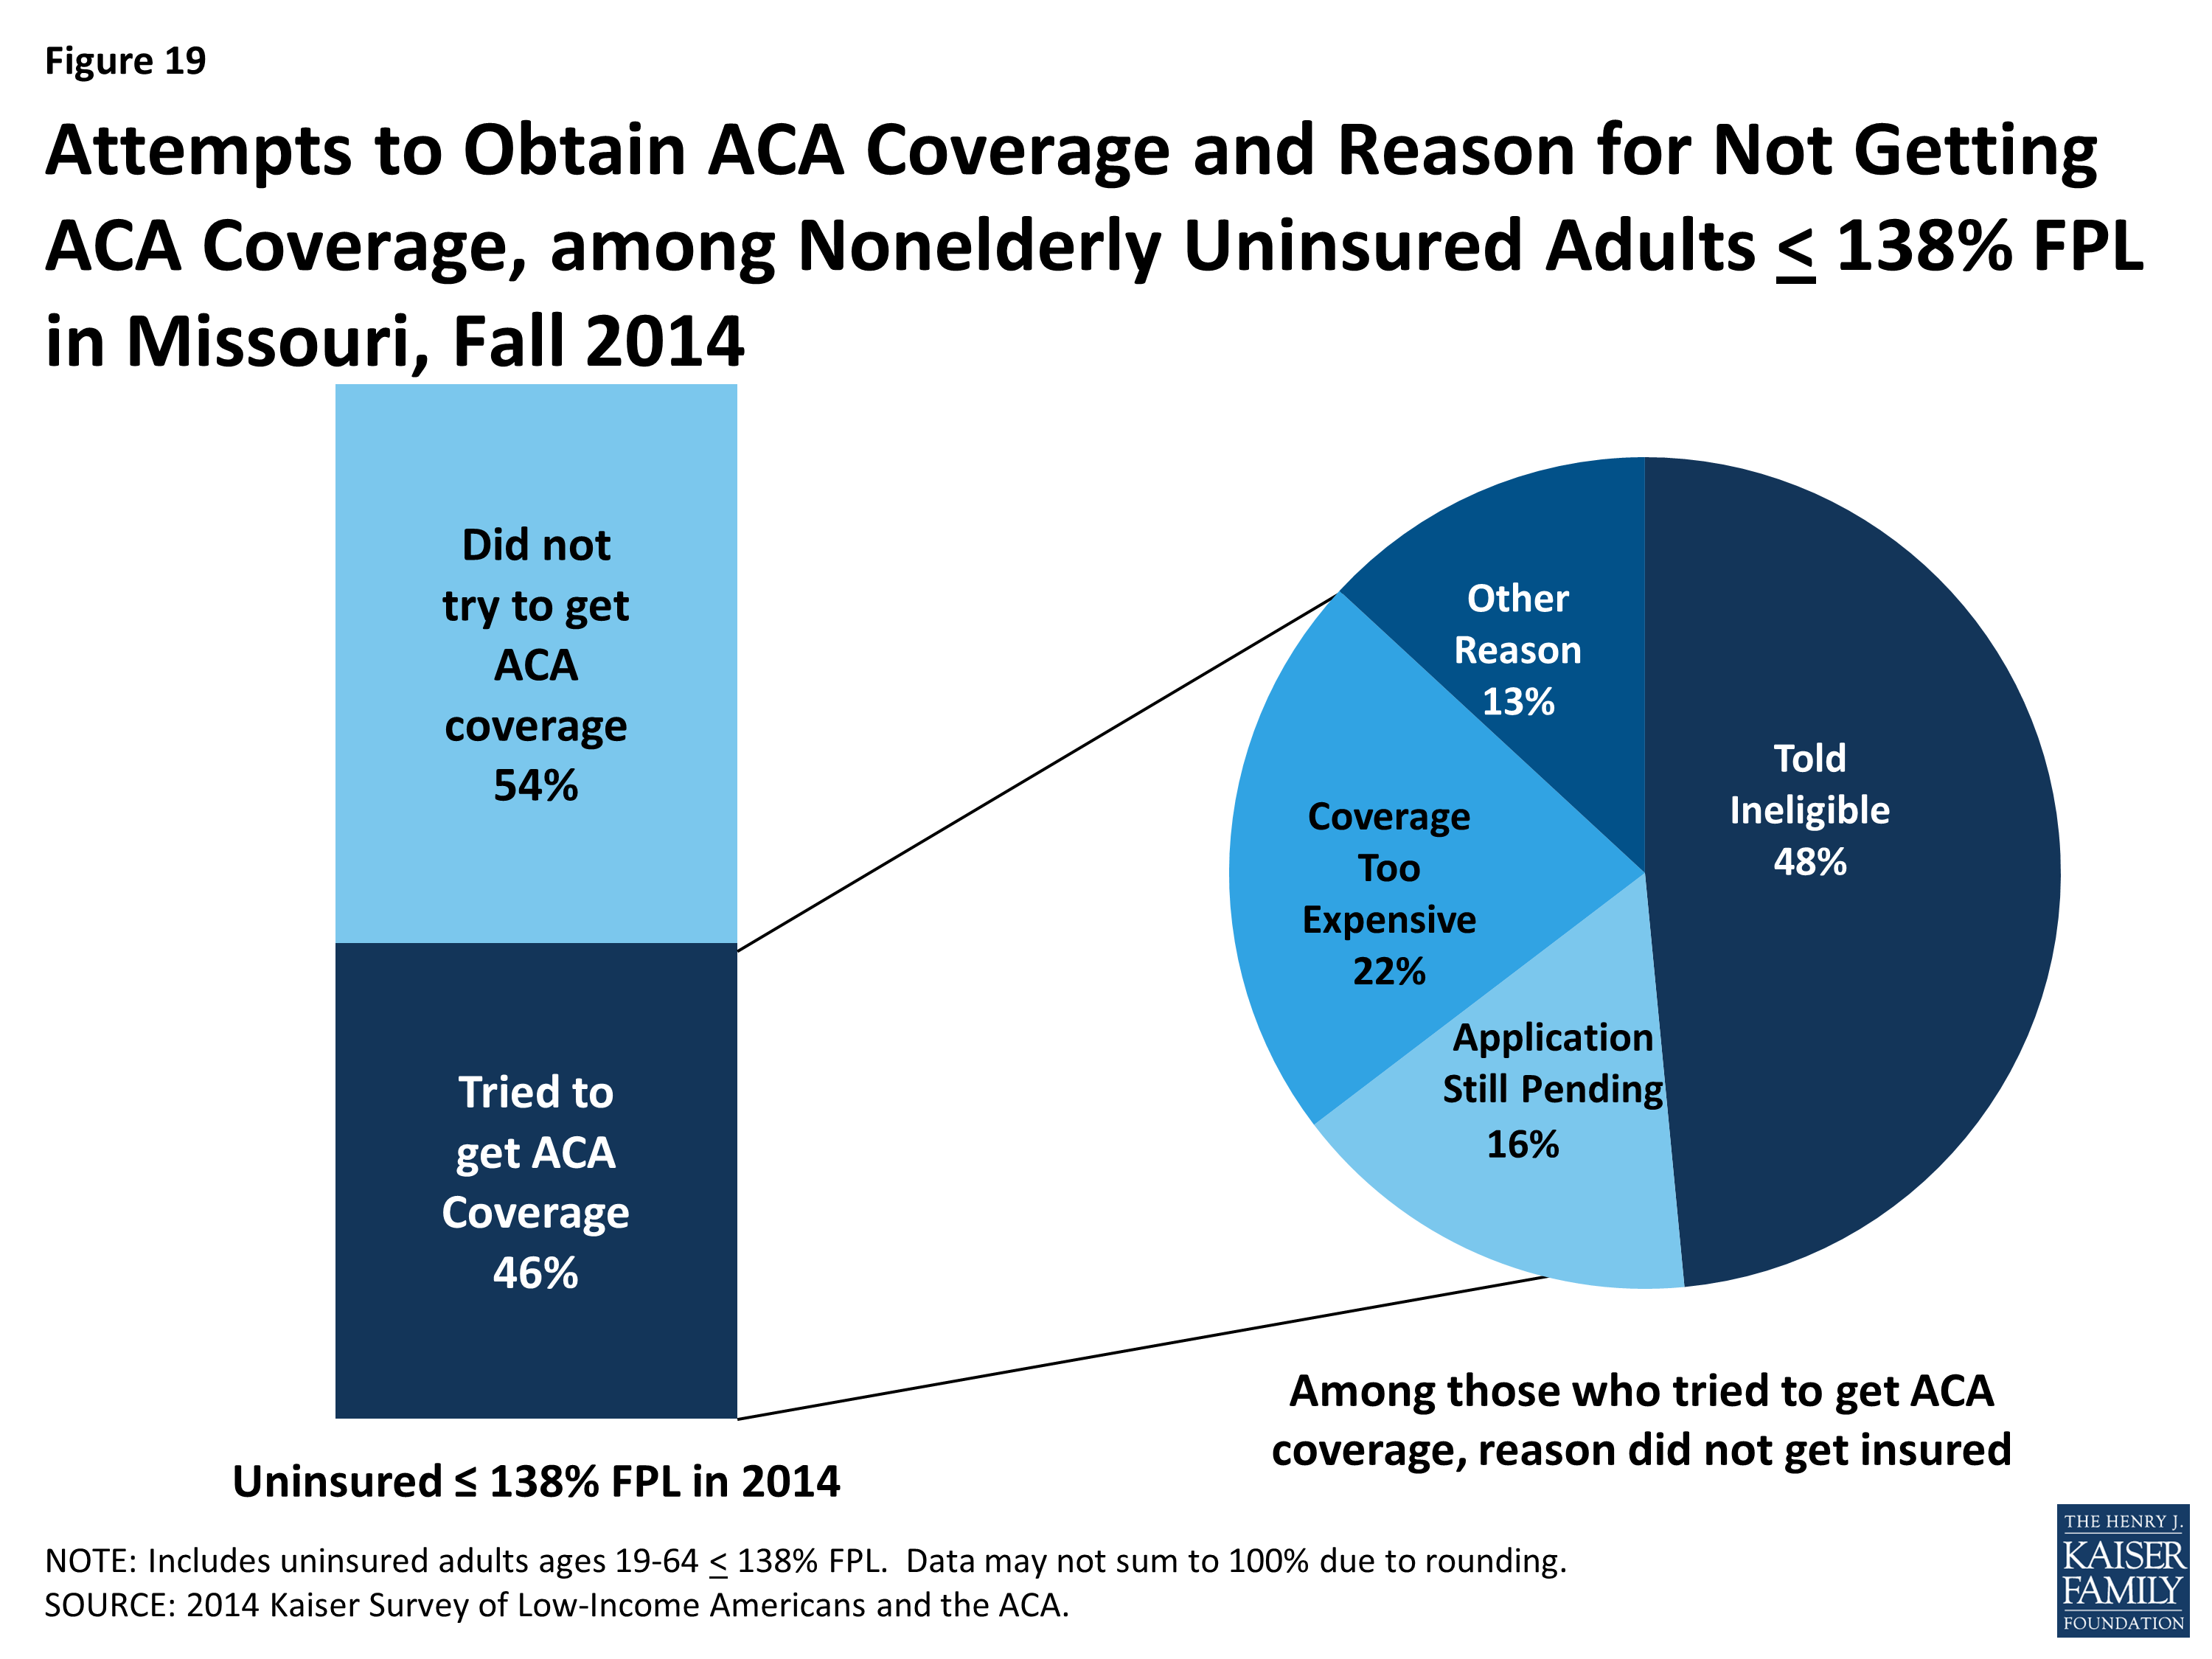
Figure 19: Attempts to Obtain ACA Coverage and Reason for Not Getting ACA Coverage, among Nonelderly Uninsured Adults ≤ 138% FPL in Missouri, Fall 2014
The majority of low-income uninsured report not having access to employer coverage and a plurality do not think they will gain coverage in 2015. Eight in ten (82%) of the low-income uninsured are ineligible for health insurance through their employer, either because they are unemployed, their employer does not offer coverage, or because they are ineligible for coverage. Only one in six (16%) were eligible for coverage through their employer, but remained uninsured (Figure 20). The low-income uninsured population’s inability to obtain coverage through an employer is reflected in their response to whether or not they were planning on obtaining coverage in 2015: only eight percent said they were planning on getting coverage through their employer. The plurality of low-income uninsured (42%) were not planning on obtaining coverage in 2015 (Figure 21). Open enrollment for 2015 Marketplace coverage ended February 15th; while enrollment for Medicaid is ongoing, it remains limited to the levels in place before the ACA was enacted.
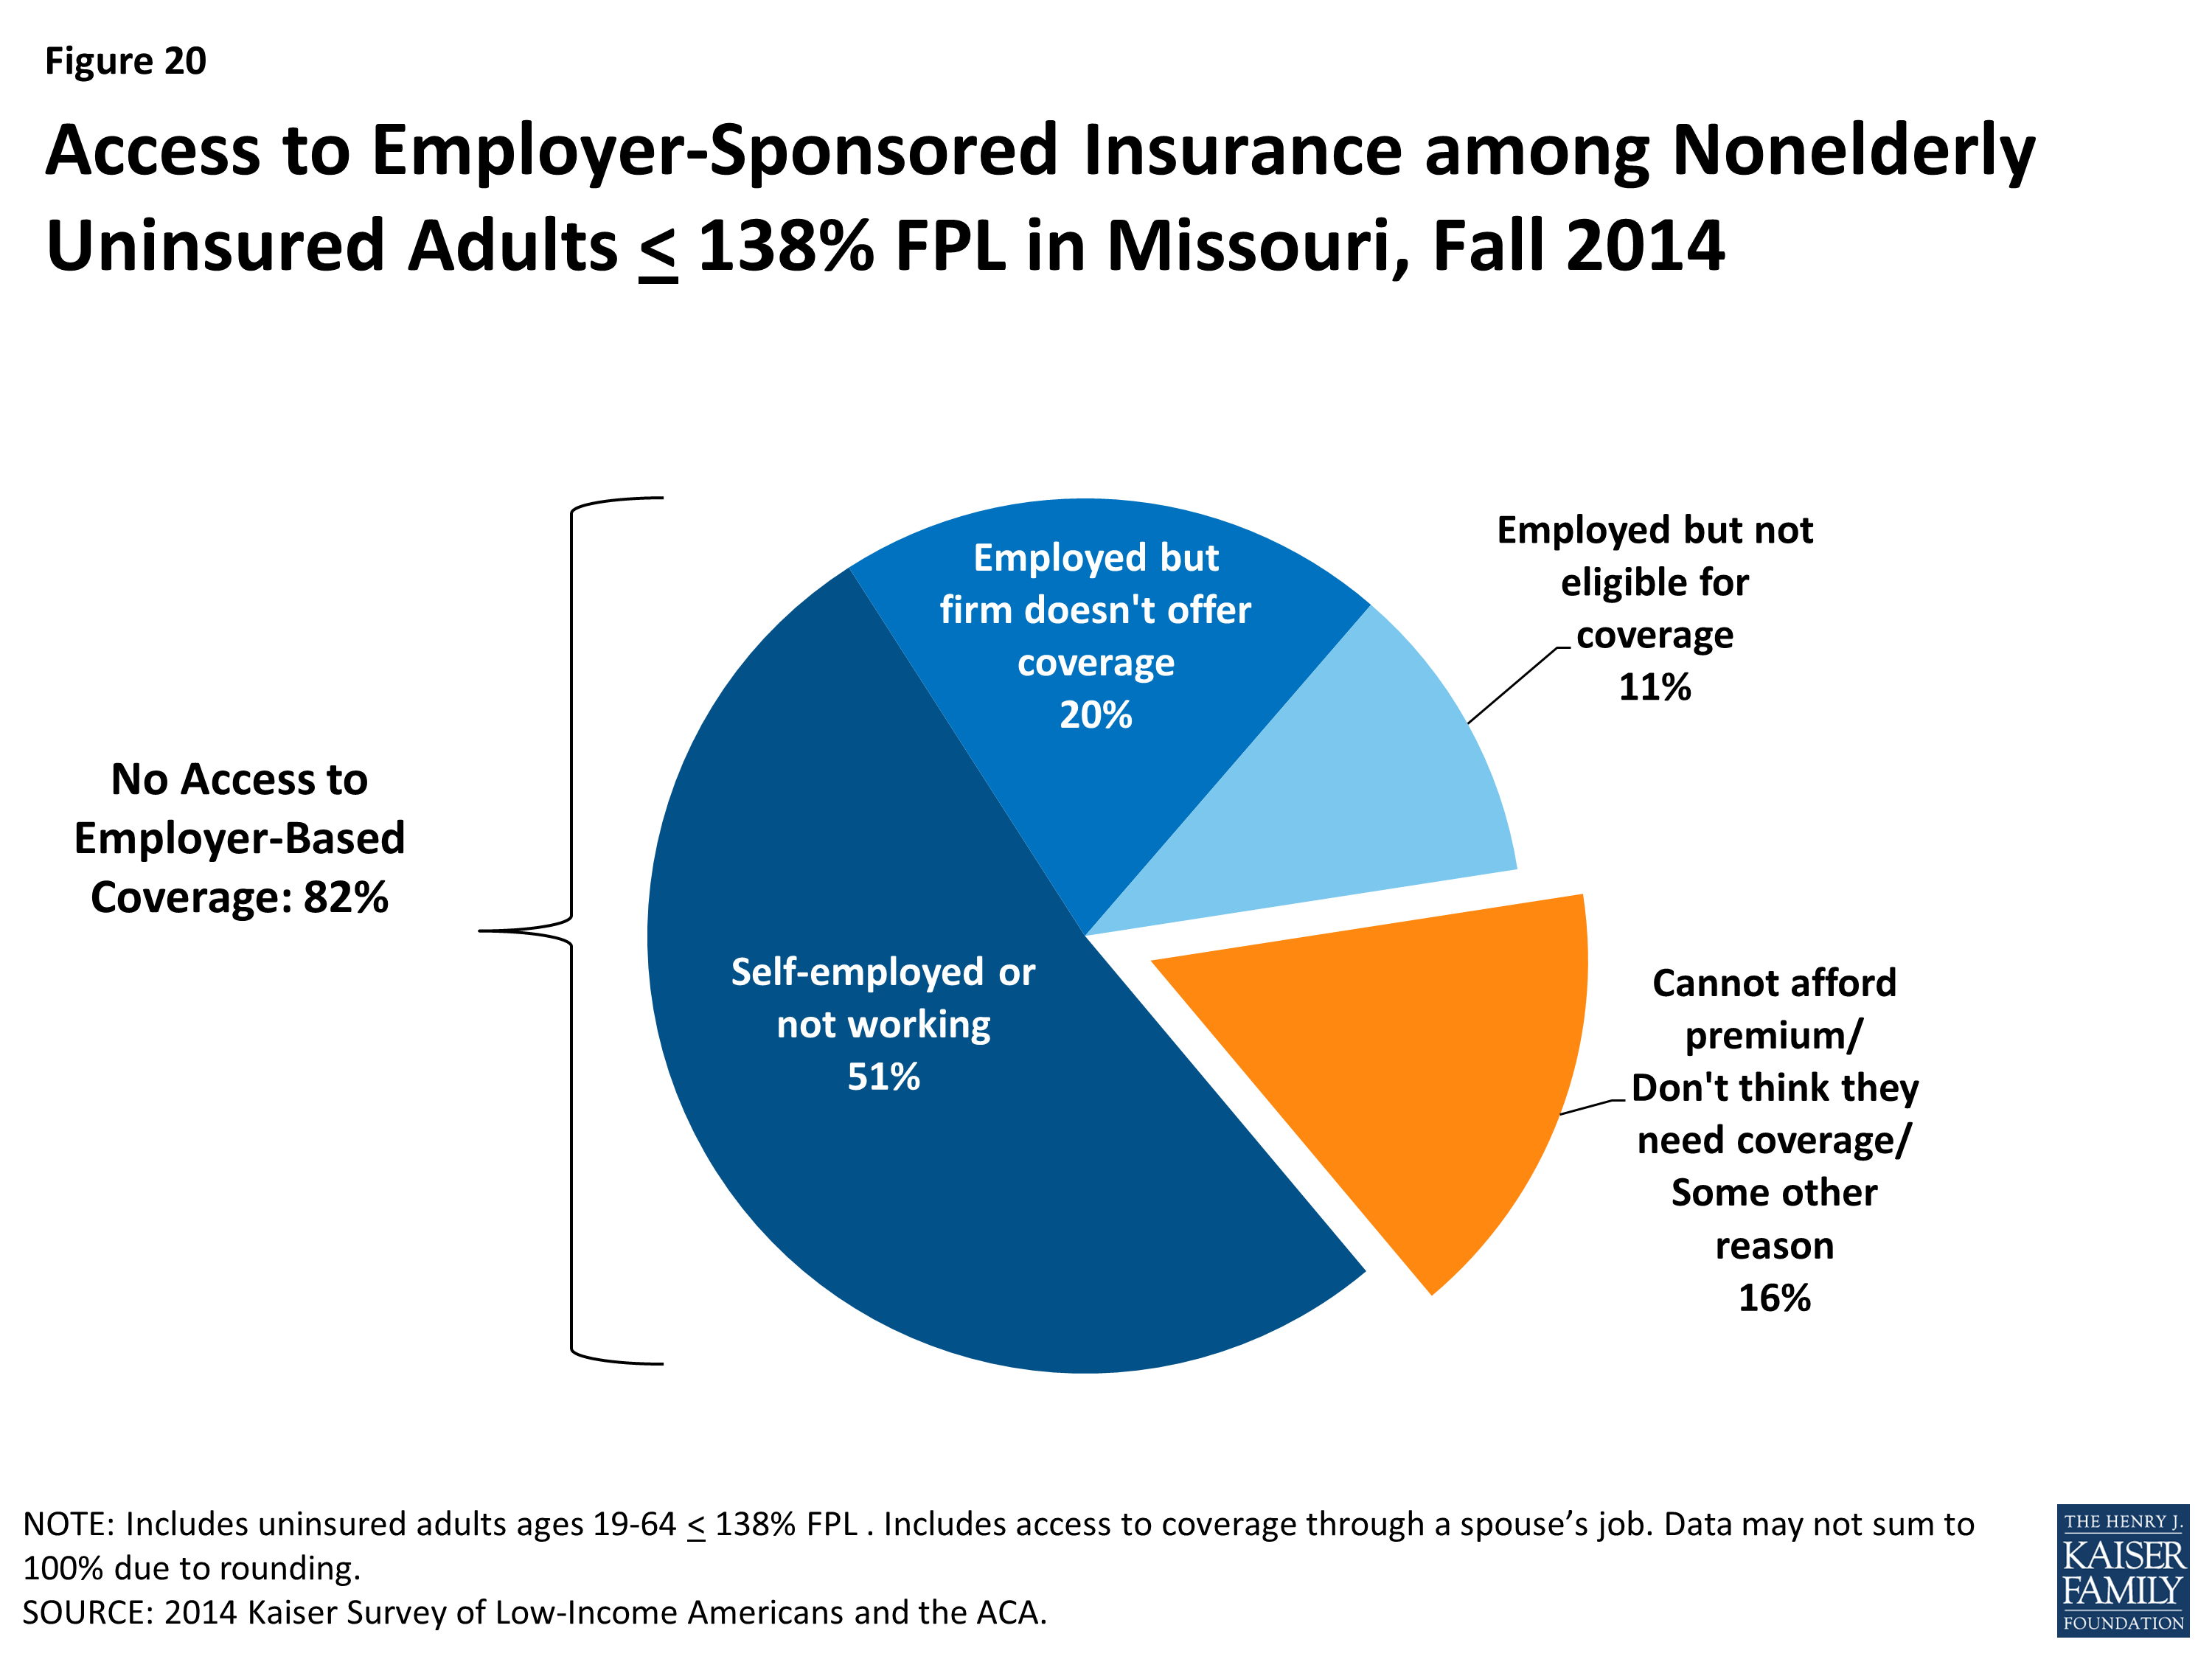
Figure 20: Access to Employer-Sponsored Insurance among Nonelderly Uninsured Adults ≤ 138% FPL in Missouri, Fall 2014
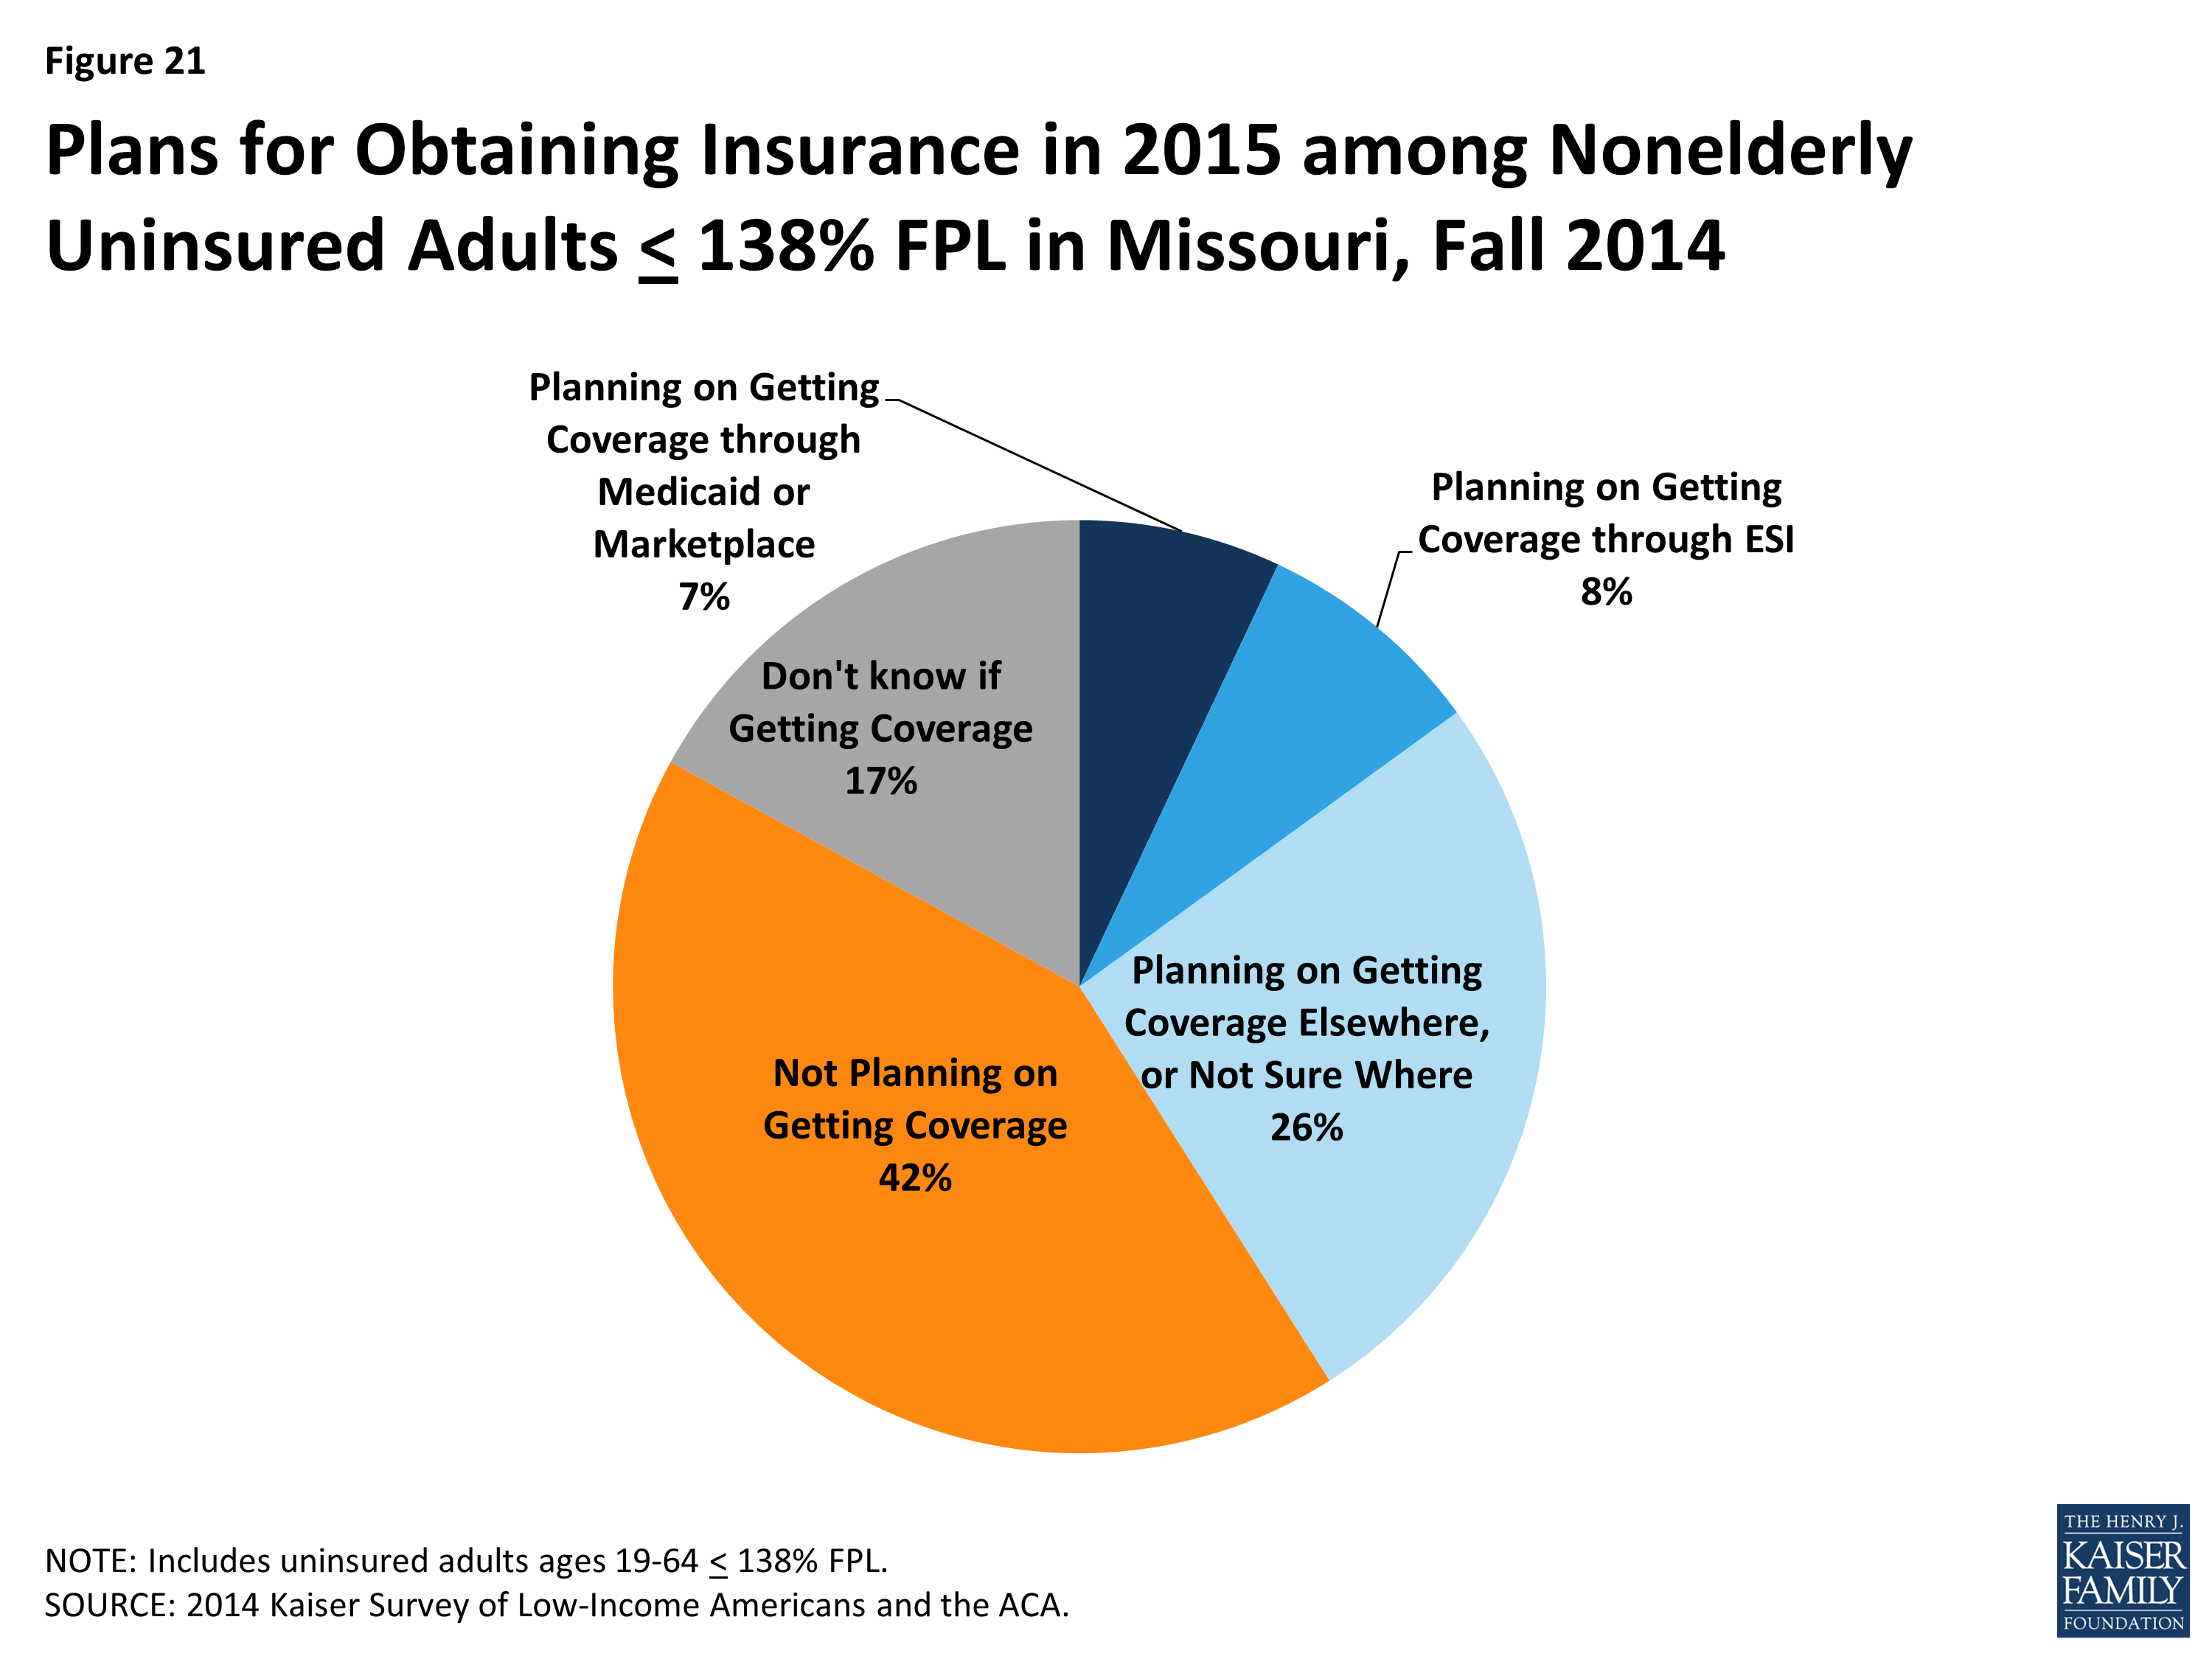
Figure 21: Plans for Obtaining Insurance in 2015 among Nonelderly Uninsured Adults ≤ 138% FPL in Missouri, Fall 2014
Policy Implications
Though the Affordable Care Act was signed into law five years ago, the state is still debating whether to expand Medicaid to cover low-income uninsured adults. As a result, many low-income Missourians remain uninsured and without an affordable coverage option. These individuals face substantial barriers to accessing needed care and financial hardship as a result of remaining without coverage.
Without Medicaid expansion, most uninsured adults are likely to remain uninsured. The low-income uninsured in Missouri have been uninsured for a long time: seven in ten have been uninsured for more than one year. Many low-income uninsured tried to obtain health insurance in 2014; however, cost ultimately is the major barrier preventing obtaining insurance. Without significant financial assistance, most uninsured adults are likely to remain without coverage. Further, few are likely to gain coverage through a job. The majority of the low-income uninsured are not eligible for health insurance through their employer, even though most are in a working family. Additionally, a lack of health insurance can affect a person’s ability to work: the survey showed that about a quarter of the low-income uninsured postponed care and as a result lost time at work, school, or other life activities. This finding suggests that for many in Missouri, being low-income and uninsured can lead to a cycle of being low-income and uninsured. Last, while some low-income uninsured in the state are eligible for tax credits for private coverage through the Marketplace, take-up in Missouri has lagged that of other states, and many who have sought or purchased Marketplace coverage indicate that they continue to face affordability challenges.1
The safety net of clinics and health centers continues to play a pivotal role in serving the uninsured population in the state. With nearly four in ten of the low-income uninsured who have a usual source of care identifying health centers or clinics as that source of care, there is a demonstrated continued need for the health care safety net. While federally qualified heath centers (FQHCs) in states that expanded Medicaid are encountering increased revenues as Medicaid pays for a larger share of their patients’ services,2 health centers in Missouri are not seeing an infusion of revenues due to coverage gains. If the Supreme Court decides in King v. Burwell that subsidies are to be made available only to those that obtained insurance in a state-based marketplace, Missouri FQHCs will also lose revenue from patients who can no longer afford their private coverage purchased through the Marketplace.3 In addition to the strain placed on FQHCs, hospitals that received DSH funding will encounter cuts to their funding starting in 2018,4 without the expected balance of an increase in the number of Medicaid patients. This strain is may affect hospital financial viability, especially those in rural areas. In 2014, two of Missouri’s 74 rural hospitals shut down, further contributing to Missouri’s already known problem of primary care health professional shortages. If coverage options remain limited for low-income individuals in the state, it will be important to continue to monitor the ability of the uninsured to access services and the capacity and fiscal stability of the providers that serve them.
Enrollment simplification and patient navigation may improve enrollment and use of services for adults in MO HealthNet. The survey indicates that some uninsured people are waiting to know if they are eligible for coverage or not. About one in six of the low-income uninsured who tried to obtain insurance reported that their application was still pending. In July 2014, CMS began monitoring the MO HealthNet application backlog, as at one point in 2014, there were over 50,000 MO HealthNet applications that were waiting to be reviewed. Missouri reports that they have worked out many of the issues causing this, and have reduced the backlog substantially,5 but this finding is a reminder of the effect of a backlog, and the importance of coordination between the federally-facilitated Marketplace and MO HealthNet application systems.
Once people who are eligible for MO HealthNet are able to obtain insurance, they may encounter access to care issues. The survey findings indicate that nearly half of those enrolled in MO HealthNet said they postponed or went without needed care in 2014. Although four out of five MO HealthNet enrollees did eventually get all needed care, this finding suggests a potential for improving patient navigation within the MO HealthNet program. MO HealthNet enrollees may experience delays in care for several reasons, including difficulty finding a provider, challenges in traveling to providers or getting time off work to see providers, or difficulty navigating plan networks. Future work that investigates what drives these challenges will be important to ensuring timely access to needed services and that Medicaid works for the people it covers.
The authors would like to thank independent consultant Anthony Damico for his help in analyzing the survey data.
Tables
| Table A1: Demographics of Adults in Missouri, by Insurance Coverage | |||||||||
| Uninsured ≤138% FPL | MO HealthNet (Medicaid) | Private Insurance ≤138% FPL | Uninsured ≥138% FPL | Other Insured ≥138% FPL | |||||
| Work Status | |||||||||
| Full Time Working Family | 33% | 17%* | 69%* | 67%* | 82%* | ||||
| Part Time Working Family | 24% | — | 14% | — | 5%* | ||||
| Unemployed Family | 43% | 80%* | 17%* | 19%* | 13%* | ||||
| Race/Ethnicity | |||||||||
| Hispanic | 6% | — | 6% | — | 3%* | ||||
| White, Non-Hispanic | 68% | 67% | 73% | 70% | 85%* | ||||
| Black, Non-Hispanic | 18% | 19% | 20% | 20% | 7%* | ||||
| Other | 9% | 9% | — | — | 5% | ||||
| Gender | |||||||||
| Female | 48% | 68%* | 61% | 37% | 50% | ||||
| Male | 52% | 32%* | 39% | 63% | 50% | ||||
| Citizenship | |||||||||
| Citizen | 97% | 100%* | 97% | 99% | 98% | ||||
| Age | |||||||||
| 19-25 | 35% | — | 33% | 21% | 10%* | ||||
| 26-34 | 27% | 13%* | 20% | 19% | 15%* | ||||
| 35-44 | 16% | 14% | 16% | 25% | 23% | ||||
| 45-64 | 22% | 60%* | 31% | 35% | 52%* | ||||
| Family Status | |||||||||
| Married with dependent children | 15% | 10% | 18% | 19% | 34%* | ||||
| Married, no dependent children | 7% | — | 14% | 21%* | 31%* | ||||
| Not married with dependent children | 23% | 16% | 23% | — | 8%* | ||||
| Not married, no dependent children | 55% | 66% | 45% | 42% | 27%* | ||||
| Insurance Status of Participants’ Children | |||||||||
| Doesn’t have Children | 62% | 73% | 59% | 63% | 58% | ||||
| All Children are insured | 23% | 25% | 36%* | 19% | 40%* | ||||
| Some or all children are uninsured | 14% | — | — | 18% | — | ||||
| Health Status | |||||||||
| Excellent/Good Health | 59% | 37%* | 80%* | 90%* | 84%* | ||||
| Fair/Poor Health | 41% | 63%* | 20%* | — | 15%* | ||||
| Excellent/Good Mental Health | 76% | 61%* | 85% | 92%* | 92%* | ||||
| Fair/Poor Mental Health | 24% | 38%* | 15% | — | 8%* | ||||
| Has Ongoing Condition | 37% | 65%* | 33% | 19%* | 37% | ||||
| Taking Rx | 30% | 76%* | 44%* | — | 49%* | ||||
| Rural/Urban | |||||||||
| Rural | 29% | 39% | 29% | 37% | 23% | ||||
| Urban or Suburban | 65% | 58% | 67% | 55% | 74%* | ||||
| Length of Time Uninsured | |||||||||
| Uninsured less than 1 year | 27% | NA | NA | 25% | NA | ||||
| Uninsured 1-5 years | 30% | NA | NA | 36% | NA | ||||
| Uninsured 5+ years | 29% | NA | NA | 21% | NA | ||||
| Never had coverage | 11% | NA | NA | — | NA | ||||
|
NOTES: Don’t Know and Refused responses are not shown. The “Other Insured ≥ 138% FPL” category is predominantly privately insured people with incomes greater than 138% of poverty, but also includes Medicare enrollees, those who don’t know if they are insured, those who are insured, but refused to answer with what, those waiting for coverage, and other categories of insurance.
NA: Not applicable.
“–“: Estimates with relative standard errors greater than 30% or with cell sizes less than 100 are not provided. * Estimate statistically significantly different from uninsured estimate at the 95% confidence level.
SOURCE: 2014 Kaiser Survey of Low-Income Americans and the ACA. |
|||||||||
| Table A2: Access to Care and Health Literacy Among Adults in Missouri, by Insurance Coverage | |||||||||
| Uninsured ≤ 138% FPL | MO HealthNet (Medicaid) | Private Insurance ≤ 138% FPL | Uninsured ≥138% FPL | Other Insured≥ 138% FPL | |||||
| Usual source of care | |||||||||
| Has a USC that is not ED | 45% | 79%* | 78%* | 40% | 84%* | ||||
| Of those with a USC, it is a clinic | 38% | 30% | 24% | — | 16%* | ||||
| Of those with a USC, it is a doctor’s office | 40% | 51% | 59%* | — | 72%* | ||||
| Of those with a USC, it is some other place | 22% | 18% | 17% | — | 12%* | ||||
| Of those with USC, has regular doctor at USC | 66% | 86%* | 79% | — | 89%* | ||||
| Of those with USC, changed USC | 20% | — | — | — | 8%* | ||||
| Of those with USC, changed USC & did so because of insurance | — | — | — | — | — | ||||
| Of those with USC, somewhat to very easy to travel to USC | 76% | 69% | 91%* | — | 95%* | ||||
| Of those with USC, reason chose USC | |||||||||
| Convenient | — | 24% | 29% | — | 22% | ||||
| Affordable | 21% | — | — | — | 5%* | ||||
| Only place available | 15% | 7% | — | — | 3%* | ||||
| Preferred doc is there | 37% | 52% | 52% | — | 59%* | ||||
| Good reputation | — | 10% | — | — | 9% | ||||
| Problems getting appointments | |||||||||
| Told could not get appt with a provider | 12% | 11% | — | — | 4%* | ||||
| Told could not get appt b/c did not take their coverage | — | — | — | — | — | ||||
| Had to wait longer than reasonable for any appt. | 19% | 18% | 8%* | — | 12% | ||||
| Had to wait longer than reasonable for primary care | — | — | — | 0% | 5% | ||||
| Had to wait longer than reasonable for specialty care | — | 5% | — | — | 4% | ||||
| Utilization | |||||||||
| Used any medical services | 55% | 91%* | 73%* | 45% | 81%* | ||||
| Had Checkup or Preventive Care Visit | 24% | 70%* | 52%* | 15% | 69%* | ||||
| Postponed needed care | |||||||||
| Postponed or went without care | 55% | 46% | 25%* | 39%* | 24%* | ||||
| Never ended up getting needed care | 41% | 21%* | 11%* | 24%* | 9%* | ||||
| Postponed care & as a result… | |||||||||
| Condition worsened | 28% | 16%* | 10%* | — | 7%* | ||||
| Significant loss of time at work, school or other important life activity | 26% | 15%* | 9%* | — | 4%* | ||||
| Stress level seriously increased | 42% | 27%* | 12%* | 20%* | 11%* | ||||
| Health literacy | |||||||||
| Always/most of the time got all the info wanted from doc | 64% | 87%* | 89%* | — | 95%* | ||||
| Always/most of the time felt encouraged to ask questions | 63% | 84%* | 83%* | — | 89%* | ||||
| Always/most of the time understood test results | 65% | 82%* | 82%* | — | 91%* | ||||
| Always/most of the time understood how to take Rx | 80% | 89% | 93%* | — | 94%* | ||||
|
NOTES: Don’t Know and Refused responses are not shown. The “Other Insured ≥ 138% FPL” category is predominantly privately insured people with incomes greater than 138% of poverty, but also includes Medicare enrollees, those who don’t know if they are insured, those who are insured, but refused to answer with what, those waiting for coverage, and other categories of insurance.
NA: Not applicable.
“–“: Estimates with relative standard errors greater than 30% or with cell sizes less than 100 are not provided. * Estimate statistically significantly different from uninsured estimate at the 95% confidence level.
SOURCE: 2014 Kaiser Survey of Low-Income Americans and the ACA.
|
|||||||||
| Table A3: Financial Security Among Adults in Missouri, by Insurance Coverage | |||||||||
| Uninsured ≤138% FPL | MO HealthNet (Medicaid) | Private Insurance ≤138% FPL | Uninsured ≥138% FPL | Other Insured ≥138% FPL | |||||
| Confidence can afford usual medical costs | |||||||||
| Confident | 22% | 65%* | 66%* | 39%* | 84%* | ||||
| Not confident | 78% | 33%* | 33%* | 58%* | 15%* | ||||
| Confidence can afford major medical costs | |||||||||
| Confident | 12% | 65%* | 45%* | 27%* | 67%* | ||||
| Not confident | 86% | 32%* | 54%* | 72%* | 32%* | ||||
| Worry over health care costs have had major effect on… | |||||||||
| Family relationships | 21% | 13% | — | — | 3%* | ||||
| Ability to sleep | 24% | 16% | — | — | 5%* | ||||
| Job performance, family relationships, or ability to sleep | 36% | 18%* | 13%* | 17%* | 6%* | ||||
| Medical Bill Outcomes | |||||||||
| Has outstanding medical bills | 45% | 23%* | 31%* | 37% | 22%* | ||||
| Any problem paying medical bills | 53% | 24%* | 26%* | 36%* | 16%* | ||||
| Problem with medical bills led to using up savings | 27% | 10%* | 13%* | — | 9%* | ||||
| Problem with medical bills led to difficulty paying for basic necessities | 30% | 15%* | 13%* | — | 6%* | ||||
| Problem with medical bills led borrowing money | 27% | 12%* | 11%* | — | 5%* | ||||
| Problem with medical bills led to being sent to collection | 31% | 13%* | 15%* | 24% | 8%* | ||||
| General financial security | |||||||||
| Generally financial insecure | 66% | 55% | 38%* | 43%* | 19%* | ||||
| Somewhat/very difficult to pay for necessities | 64% | 61% | 42%* | 53% | 22%* | ||||
| Somewhat/very difficult to save money | 85% | 82% | 68%* | 69%* | 47%* | ||||
| Somewhat/very difficult to pay off debt | 68% | 67% | 52%* | 61% | 36%* | ||||
| Moved in past year to save money | 38% | 17%* | 28% | 25% | 7%* | ||||
| Increased debt in past year to pay bills | 29% | 31% | 27% | 29% | 16%* | ||||
| Used savings in past year to pay bills | 44% | 25%* | 44% | 30% | 31%* | ||||
| NOTES: Don’t Know and Refused responses are not shown. The “Other Insured ≥ 138% FPL” category is predominantly privately insured people with incomes greater than 138% of poverty, but also includes Medicare enrollees, those who don’t know if they are insured, those who are insured, but refused to answer with what, those waiting for coverage, and other categories of insurance. NA: Not applicable. “–“: Estimates with relative standard errors greater than 30% or with cell sizes less than 100 are not provided. * Estimate statistically significantly different from uninsured estimate at the 95% confidence level. SOURCE: 2014 Kaiser Survey of Low-Income Americans and the ACA. |
|||||||||
| Table A4: Reasons Why Uninsured Adults in Missouri Lack Coverage and Plans to Obtain Coverage | |||
| Uninsured ≤ 138% FPL | Uninsured ≥ 138% FPL | ||
| Reasons why uninsured | |||
| Too Expensive | 65% | 58% | |
| Opposed to ACA/Prefer to pay penalty/Don’t need it | 7% | 19% | |
| Told ineligible | 7% | — | |
| Unemployed/Work doesn’t offer/not eligible through work | 10% | — | |
| Other/Immigration status/Don’t know how to get it | 11% | — | |
| Attempts at obtaining insurance | |||
| Tried to get Medicaid or Marketplace coverage | 46% | 35% | |
| Did not try to get Medicaid or Marketplace coverage | 54% | 64% | |
| Of those who tried to obtain Medicaid or Marketplace Insurance, did so by… | |||
| Signing up on healthcare.gov or state HIM website | 46% | — | |
| Visiting a state Medicaid agency | 57% | — | |
| Calling a toll-free or 1-800 number for help | 46% | — | |
| Going to a community agency, school, church, or library | 19% | — | |
| Going to a hospital, clinic, or doctor, or other health care provider’s office for help applying | 33% | — | |
| Contacting a health insurance broker | 13% | — | |
| Tried to apply using more than one pathway | 67% | — | |
| Of those who tried to obtain Medicaid or Marketplace Insurance, found difficulty… | |||
| Finding out where to apply | 43% | — | |
| Filling in the information requested in the application | 34% | — | |
| Assembling all the required paperwork | 36% | — | |
| Submitting the application | 38% | — | |
| At least one aspect of the applying was difficult | 71% | — | |
| All aspects of applying were difficult | 9% | — | |
| Tried to obtain Medicaid or Marketplace Insurance, but could not because… | |||
| Told ineligible | 48% | — | |
| The application is still pending | 16% | — | |
| Coverage is too expensive | 22% | — | |
| Other reason | 13% | — | |
| Future Coverage | |||
| Planning on getting coverage in 2015 | 41% | 43% | |
| Not planning on getting coverage in 2015 | 42% | 46% | |
| Don’t know if getting coverage in 2015 | 17% | — | |
| Planning on getting coverage in 2015 through | |||
| Medicaid/Marketplace | 7% | — | |
| ESI | 8% | — | |
| Elsewhere/Not sure | 26% | 27% | |
| Don’t know where getting coverage | 0% | 0% | |
| Other coverage options | |||
| ESI Eligibility | |||
| Not part of working family | 51% | 38% | |
| Firm doesn’t offer coverage | 20% | 24% | |
| Not eligible for coverage | 11% | — | |
| Cannot afford to pay premium/Don’t think they need coverage/Some other reason | 16% | 22% | |
| NOTES: Don’t Know and Refused responses are not shown. “–“: Estimates with relative standard errors greater than 30% or with cell sizes less than 100 are not provided. * Estimate statistically significantly different from uninsured estimate at the 95% confidence level. SOURCE: 2014 Kaiser Survey of Low-Income Americans and the ACA. |
|||
Endnotes
Executive Summary
A Health Maintenance Organization, or “HMO”, is an organization that provides comprehensive health services using a fixed payment structure or capitated rates.
Report
Introduction
Licata R and Garfield R. The Uninsured at the Starting Line in Missouri: Missouri findings from the 2013 Kaiser Survey of Low-Income Americans and the ACA, Kaiser Family Foundation, 2014. Available at https://www.kff.org/uninsured/report/the-uninsured-at-the-starting-line-in-missouri-missouri-findings-from-the-2013-kaiser-survey-of-low-income-americans-and-the-aca/.
Background: ACA Implementation in Missouri
Majerol M, Newkirk V, Garfield R. The Uninsured: A Primer – Key Facts About Health Insurance and the Uninsured in America. Kaiser Family Foundation, 2015. Available at https://www.kff.org/report-section/the-uninsured-a-primer-what-was-happening-to-insurance-coverage-leading-up-to-the-aca/.
Licata R and Garfield R. The Uninsured at the Starting Line in Missouri: Missouri findings from the 2013 Kaiser Survey of Low-Income Americans and the ACA. Kaiser Family Foundation, 2014. Available at https://www.kff.org/uninsured/report/the-uninsured-at-the-starting-line-in-missouri-missouri-findings-from-the-2013-kaiser-survey-of-low-income-americans-and-the-aca/.
Washington University of St. Louis and Saint Louis University, For the Sake of All: A report on the health and well-being of African Americans in St. Louis and why it matters for everyone. 2014. Available at http://forthesakeofall.org/publications/.
Zuckerman S, Miller D, Shelton Pape E, “Missouri’s 2006 Medicaid Cuts: How Did They Affect Enrollees and Providers?” Health Affairs 28(2), 2009. Available at http://content.healthaffairs.org/content/28/2/w335.full.pdf+html.
Ku L, et al. “Coordinating and Integrating Care for Safety Net Patients: Lessons from Six Communities,” George Washington University, Washington, DC (May 2012). U.S. Census Bureau, 2010 Census. Available at https://publichealth.gwu.edu/departments/healthpolicy/DHP_Publications/pub_uploads/dhpPublication_618A2D24-5056-9D20-3D475D756ACE11FB.pdf.
Regan E, “Medicaid expansion in Missouri continues to look unlikely”, Southeast Missourian, January 7, 2015, available at http://www.semissourian.com/story/2153650.html.
Disproportionate Share Hospitals are hospitals that receive federal funding for providing care to high numbers of uninsured patients. See Rudowitz R, “How do Medicaid Disproportionate Share Hospital (DSH) Payments Change Under the ACA?” Kaiser Family Foundation, November 2013. Available at https://www.kff.org/medicaid/issue-brief/how-do-medicaid-disproportionate-share-hospital-dsh-payments-change-under-the-aca/.
See Kaiser Family Foundation, “State Exchange Profiles: Missouri,” Updated December 2012. Available at https://www.kff.org/health-reform/state-profile/state-exchange-profiles-missouri/.
See Musumeci M, “Are Premium Subsidies Available in States with a Federally-run Marketplace? A Guide to the Supreme Court Argument in King v. Burwell,” Kaiser Family Foundation, February 2015. Available at https://www.kff.org/health-reform/issue-brief/are-premium-subsidies-available-in-states-with-a-federally-run-marketplace-a-guide-to-the-supreme-court-argument-in-king-v-burwell/. See also Levitt L and Claxton G, “The Potential Side Effects of Halbig,” Kaiser Family Foundation, July 2014. Available at https://www.kff.org/health-reform/perspective/the-potential-side-effects-of-halbig/.
Missouri HB 1243. Full text available http://www.house.mo.gov/billtracking/bills151/billpdf/intro/HB1243I.PDF.
Licata and Garfield.
Kaiser Family Foundation, “Marketplace Enrollment as a Share of the Potential Marketplace Population, April 2014.” Available at https://www.kff.org/health-reform/state-indicator/marketplace-enrollment-as-a-share-of-the-potential-marketplace-population-2014/.
Shapiro J, “Analysis of health plan sign-ups shows success, challenges,” St. Louis Post-Dispatch, October 12, 2014. Available at http://www.stltoday.com/news/special-reports/mohealth/analysis-of-health-plan-sign-ups-shows-success-challenges/article_036afa47-27d9-5495-83a5-28e2042a8f4c.html.
Liss A, “Missouri still processing Medicaid applications from HealthCare.gov,” St. Louis Post-Dispatch, October 14, 2014. Available at http://www.stltoday.com/news/local/govt-and-politics/missouri-still-processing-medicaid-applications-from-healthcare-gov/article_bb172e79-00e8-5125-9b7a-893315b5ccd8.html.
Galewitz P, “Feds demand Medicaid backlog fix from Missouri,” St. Louis Post-Dispatch, July 10, 2014. Available at http://www.stltoday.com/news/special-reports/mohealth/feds-demand-medicaid-backlog-fix-from-missouri/article_f07075fa-ea6c-5cbe-94ed-829a7f9a6f61.html.
Young V, “Missouri’s Medicaid enrollment system improving, officials say,” St. Louis Post-Dispatch, February 3, 2015. Available at http://www.stltoday.com/news/local/govt-and-politics/virginia-young/missouri-s-medicaid-enrollment-system-improving-officials-say/article_c49d049c-ee14-5ae7-b443-1fbf8f6da55d.html.
Kaiser Family Foundation, “Total Monthly Medicaid and CHIP Enrollment.” Available at https://www.kff.org/health-reform/state-indicator/total-monthly-medicaid-and-chip-enrollment/.
Young V, “Medicaid enrollment is actually dropping in 6 states,” MedCity News, June 2, 2014. Available at http://medcitynews.com/2014/06/states-seeing-fewer-medicaid-cases/.
Who are the low-income uninsured in Missouri?
Licata and Garfield.
See Ku L and Broaddus M, “Coverage of Parents Helps Children, Too.” Center on Budget and Policy Priorities, October 20, 2006. Available at http://www.cbpp.org/files/10-20-06health.pdf. See also Sommers B, “Insuring children or insuring families: do parental and sibling coverage lead to improved retention of children in Medicaid and CHIP?” Journal of Health Economics, November 2006, Vol. 25 No. 6.
See Decker S, Kostova D, Kenney G, and Long S, “Health Status, Risk Factors, and Medical Conditions Among Persons Enrolled in Medicaid vs Uninsured Low-Income Adults Potentially Eligible for Medicaid Under the Affordable Care Act.” JAMA, June 26, 2013. Available at http://jama.jamanetwork.com/article.aspx?articleid=1699906.
How do the low-income uninsured access care?
Licata and Garfield.
For those who have been uninsured, or enrolled in MO HealthNet, or privately insured for all of 2014, the time period for this is “since January 2014.” For those who became uninsured, enrolled in MO HealthNet or became privately insured during 2014, the time period for this is “since becoming uninsured” or “since gaining your current coverage.”
Agency for Healthcare Quality and Research. CAHPS Item Set for Addressing Health Literacy. Available at: https://cahps.ahrq.gov/surveys-guidance/item-sets/literacy/index.html.
How does coverage affect financial security?
Licata and Garfield.
Why are people still uninsured and what are their coverage options?
Young V, February 3, 2015.
Policy Implications
Garfield R and Young K. People Who Gained Coverage in 2014: Implications to Access to Care and Financial Security, Kaiser Family Foundation, Forthcoming.
Shin P, Sharac J, Barber Z, Rosenbaum S, and Paradise J, “Community Health Centers: A 2013 Profile and Prospects as ACA Implementation Proceeds.” Kaiser Family Foundation, March 2015. Available at https://www.kff.org/medicaid/issue-brief/community-health-centers-a-2013-profile-and-prospects-as-aca-implementation-proceeds/.
Ibid.
Medicare Access and CHIP Reauthorization Act of 2015, H.R. 2, 114th Cong. (2015).
Young V, February 3, 2015.