Assessing the Impact of the Affordable Care Act on Health Insurance Coverage of People with HIV
A new analysis in conjunction with researchers at the Centers for Disease Control and Prevention (CDC) provides the first national estimates of the expected impact of the Affordable Care Act’s coverage expansions on people with HIV.
The brief finds that close to 70,000 uninsured people with HIV who are in care could gain new coverage. This group includes almost 47,000 who could gain coverage through Medicaid if all states were to expand under the law and almost 23,000 who could gain coverage through the health insurance marketplaces, most of whom would get financial assistance.
Currently, 25 states are not planning to expand their Medicaid programs under the law, reducing the number of people with HIV who could gain Medicaid coverage. The analysis estimates that state decisions not to expand Medicaid would reduce the number eligible for Medicaid by more than 15,000, leaving them without affordable insurance.
For individuals left out of coverage expansions, the Ryan White HIV/AIDS Program will continue to be a critical source of support. The program will also likely continue to remain critical in helping wrap around insurance coverage for many insured people with HIV, as it does today.
Executive Summary
The Affordable Care Act (ACA), signed into law in 2010, is expected to expand insurance coverage for millions of people in the United States, including people with HIV infection. While several provisions of the ACA have implications for people with HIV, two are expected to have the most far reaching effects on coverage – the expansion of Medicaid eligibility and the creation of new Health Insurance Marketplaces where individuals can purchase private coverage. This issue brief, based on analysis of nationally representative data from the Centers for Disease Control and Prevention’s (CDC’s) Medical Monitoring Project (MMP), provides the first national estimates of how many people with HIV who are receiving medical care may gain new insurance coverage due to the ACA through both Medicaid expansion and the state Marketplaces. It finds that of the approximately 407,000 people with HIV between the ages of 19-64 in care, most (87%) have incomes below 400% FPL. While Medicaid is their single largest source of coverage (covering about 4 in 10), close to 70,000 (17%) are currently uninsured. Of these, almost 23,000 would gain coverage through the Marketplace (most of whom would be eligible for financial assistance), and approximately 46,910 would be eligible for Medicaid, if all states were to expand Medicaid. However, only 26 states plan to expand their Medicaid programs as of October 2013, which could reduce the number gaining coverage through Medicaid expansion by more than 40%. For individuals left out of coverage expansions, the Ryan White HIV/AIDS Program will continue to be critical; it will also likely continue to remain critical in filling the gaps in insurance coverage for HIV care for many insured people with HIV, as it does today. Lastly, while this analysis focuses on the approximately 407,000 people with HIV between the ages of 19-64 who are already in care, more than 700,000 people with HIV are not yet in care. Based on the findings presented here, an additional 124,000 could gain new coverage due to the ACA, removing one obstacle to care seeking and bringing the total estimated number of people with HIV who could gain new coverage close to 200,000.
Issue Brief
INTRODUCTION
The Affordable Care Act (ACA), signed into law in 2010, is expected to expand insurance coverage for millions of people in the United States, including people with HIV. While several provisions of the ACA have implications for people with HIV,1 two are expected the have the most far reaching effects on coverage – the expansion of Medicaid eligibility to include most Americans with incomes up to 138% of the federal poverty level (FPL) (although the Supreme Court’s 2012 ruling effectively made the Medicaid expansion optional for states) and the creation of new Health Insurance Marketplaces where individuals can purchase private coverage, including subsidized coverage for those with lower incomes.
Despite the importance of these provisions for people with HIV, there are currently no national estimates of the number of people with HIV likely to gain new insurance coverage due to the ACA.2 This issue brief, based on analysis of nationally representative data from the Centers for Disease Control and Prevention’s (CDC’s) Medical Monitoring Project (MMP), provides the first such estimates, looking at how many uninsured people with HIV in care could gain new Medicaid coverage, as well as how many could be eligible for subsidized coverage in state Marketplaces. We estimate the impact of state decisions about expanding Medicaid on the reach of the ACA for people with HIV. We also discuss the current and estimated future role of the Ryan White HIV/AIDS Program, which provides care to people with HIV who are uninsured or underinsured. Finally, while our analysis focuses on those who are already in regular care (an estimated 37% of all people living with HIV in the United States, or 45% of those who have been diagnosed with HIV), we also discuss the implications of the ACA for the more than 700,000 people with HIV who remain either undiagnosed or not in regular HIV care.3 A detailed description of our methods can be found in Appendix A.
BACKGROUND ON KEY ACA INSURANCE EXPANSION PROVISIONS FOR PEOPLE WITH HIV
This issue brief analyzes the potential impact of two key ACA-related provisions for people with HIV – the expansion of Medicaid eligibility and the creation of new Health Insurance Marketplaces in each state.1
Medicaid Expansion
One of the most important components of the ACA for people with HIV is the expansion of Medicaid eligibility. Medicaid is the largest payer of HIV care in the United States and a critical source of care and services, including antiretroviral therapy (ART), for people with HIV.4 However, under current Medicaid eligibility rules, to qualify for the program, one has to meet financial eligibility criteria and belong to a group that is “categorically eligible” for Medicaid (such as children, parents with dependent children, pregnant women, and individuals with disabilities). Federal law categorically excludes non-disabled adults without dependent children, unless a state has obtained a waiver or uses state-only dollars to cover them. Medicaid eligibility rules have presented a “catch-22” for many low-income people with HIV who cannot qualify for Medicaid until they are already quite sick and disabled (usually having progressed to an AIDS diagnosis), despite the fact that early access to ART could help stave off disability and progression of HIV disease as well as prevent further HIV transmission. Because of the benefits of treatment, current national HIV treatment guidelines recommend initiation of ART as soon as one is diagnosed with HIV.5
Yet current Medicaid eligibility for low income childless adults is quite limited. Only nine states, which account for 22% of people diagnosed with HIV, provide Medicaid benefits to this population. An additional 16 states, accounting for 30% of people diagnosed with HIV, provide coverage that is more limited than Medicaid (e.g., more limited benefits). Almost half (48%) of people with HIV live in the twenty-six states that provide no coverage at all for low-income childless adults.6 ,7
The ACA established a new minimum Medicaid income eligibility level of 138% FPL (about $16,000 for an individual in 2013) for most citizens and legal residents and removed the categorical eligibility requirement. The law requires all states to expand eligibility as of 2014. However, a Supreme Court ruling in June 2012, while upholding the ACA, effectively made Medicaid expansion a state option, and it is uncertain how many states will expand. As of October 22, 2013, 26 states have indicated they will expand Medicaid (57% of people with HIV live in these states), while 25 are not planning to expand Medicaid at this time (43% of people with HIV live in these states).8 (See Figure 1).

Health Insurance Marketplaces (Exchanges)
The ACA requires most U.S. citizens and legal residents to have qualifying health insurance as of 2014. To help people access affordable coverage, the ACA creates new Health Insurance Marketplaces (also called “exchanges”) in every state as of 2014. Health Insurance Marketplaces are intended to create a more competitive market for individuals and small businesses buying health insurance. They offer a choice of different health plans, certifying plans that participate and providing information to help consumers better understand their options by making it easier to compare benefits across plans. Importantly, the ACA provides financial assistance for people with low incomes to purchase insurance in the Marketplace. These include tax credits to offset premium costs for those with incomes between 100% FPL and 400% FPL and subsidies to reduce cost-sharing expenses for those with incomes between 100% and 250% FPL.
Other Key Provisions for People with HIV
The ACA also includes insurance protections to help individuals obtain coverage in the Marketplace and elsewhere, including: an end to pre-existing condition exclusions (which had allowed insurers to deny coverage for those with health conditions such as HIV), a ban on premium rate setting based on health status, and an end to annual and lifetime caps on coverage. These provisions address issues that have presented particular barriers to people with HIV (and others with pre-existing health conditions and/or high care costs).
FINDINGS
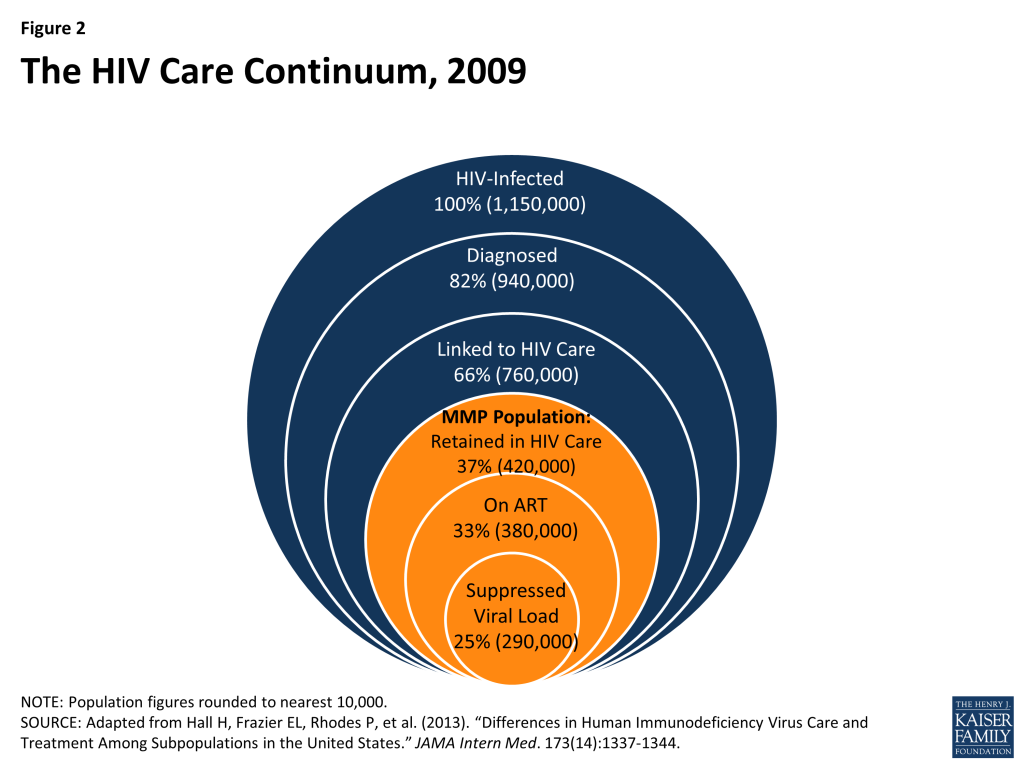
The findings below are based on analysis of data from CDC’s MMP, focusing on non-elderly adults (ages 19-64) with HIV who were in regular care in 2009 (see methodology for more detail). As mentioned above, MMP collects data representative of the 37% of all people with HIV in the United States (or 45% of those who have been diagnosed) who are in care. (See Figure 2).
Insurance Coverage and Income of Nonelderly Adults with HIV in Care
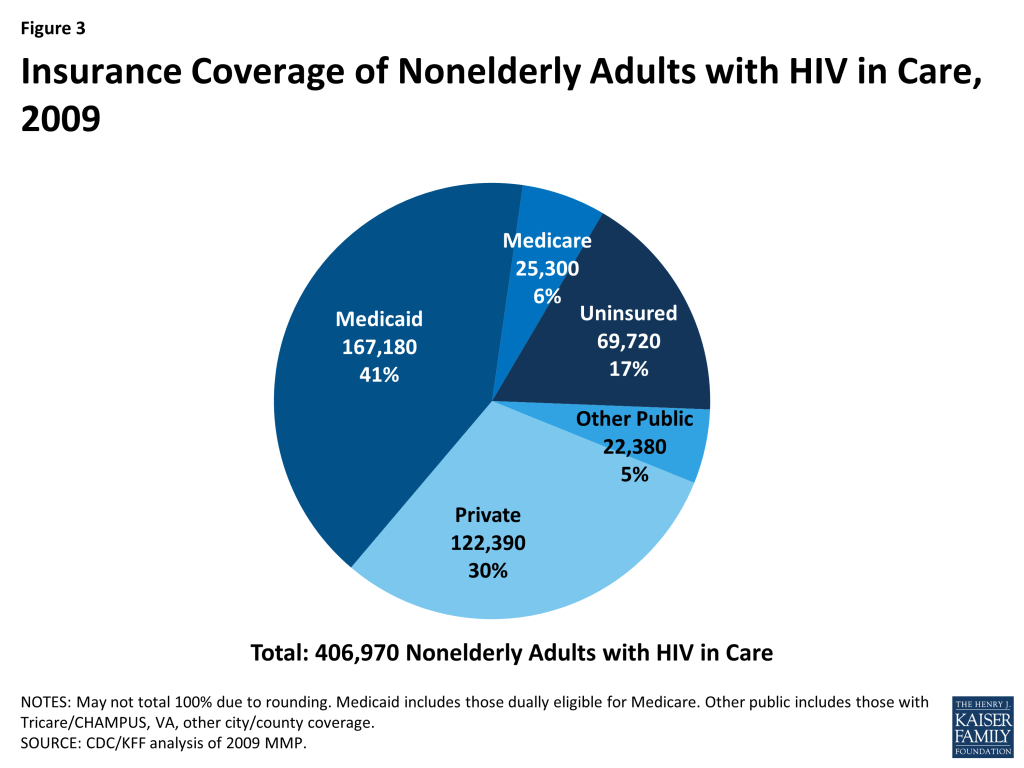
There were an estimated 406,970 non-elderly adults (ages 19-64) with HIV in care in January to April 2009. Medicaid was the largest source of insurance coverage (41%, including those dually covered by Medicare), followed by private insurance (30%). A much smaller share were covered by Medicare alone (6%), and 17% were uninsured. The remaining 5% were covered by other public sources. (See Figure 3).
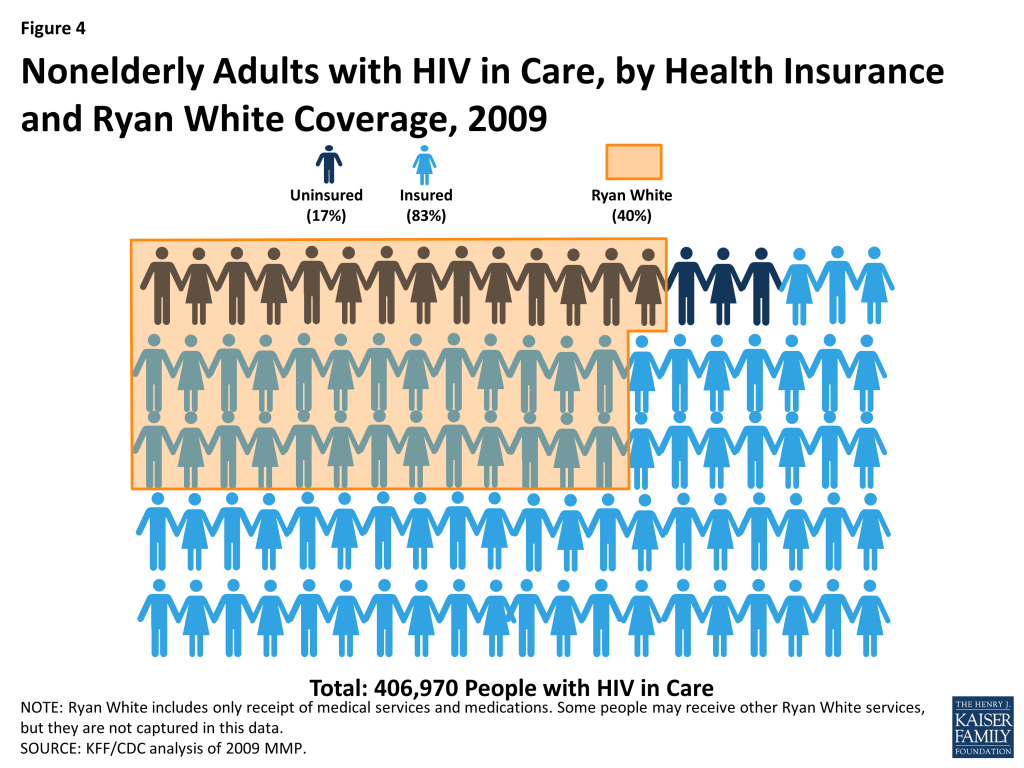
The Ryan White HIV/AIDS Program plays a significant role for people with HIV in care, including both those who have insurance and those who are uninsured. In 2009, 40% of all people with HIV in care received medical services, medications, or other services through the Ryan White HIV/AIDS Program. The program played a bigger role for those who were uninsured than those who were insured. Among the uninsured, 81% relied on the Ryan White HIV/AIDS Program. Almost a third (31%), however, of the insured also relied on the Ryan White Program, suggesting that a significant proportion of insured persons needed services that were not covered by their insurance. In fact, of those receiving services through the Ryan White HIV/AIDS Program, two thirds (65%) were insured (See Figure 4). Overall, it is likely that the Ryan White HIV/AIDS Program played an even bigger role for people with HIV than estimated here, since this analysis only included those who were aware of and self-reported receiving medical services, medications or other services through the program. As the Ryan White HIV/AIDS Program provides funds directly to service organizations, some persons might not have known that the services they received were paid for by the Ryan White HIV/AIDS Program.
Six in 10 (61%) nonelderly adults with HIV in care were low income, with incomes at or below 138% FPL; more than four in ten (44%) had incomes below 100% FPL ($10,830 for single person in 2009 and $11,490 in 2013). About a quarter (26%) had incomes between 139% FPL and 400% FPL. (See Table 1).
| Table 1: Income Distribution of Nonelderly Adults with HIV In Care, 2009 | ||
| Income Range | Number | % |
| <100% FPL | 179,130 | 44% |
| 100-138% FPL | 68,520 | 17% |
| 139-399% FPL | 104,510 | 26% |
| 400%+ FPL | 54,820 | 13% |
| Total | 406,970 | 100% |
| Totals may not sum due to rounding.FPL=Federal Poverty LevelThe FPL in 2009 was $10,830 for an individual.Source: CDC/KFF analysis of 2009 MMP. | ||
Looking at the distribution of people with HIV in care by both coverage type and income, those who were uninsured or covered by Medicaid had lower incomes than those with Medicare, private or other public coverage: more than half of those who were uninsured or covered by Medicaid had incomes less than 100% FPL. A higher proportion of the privately insured had incomes at or greater than 400% FPL (See Table 2).
| Table 2: Income Distribution of Nonelderly Adults with HIV in Care by Type Insurance Coverage, 2009 | ||||||||||
| Income Range | Uninsured | Medicaid* | Medicare | Private | Other** | |||||
| Number | Percent | Number | Percent | Number | Percent | Number | Percent | Number | Percent | |
| <100% FPL | 35,630 | 51% | 109,020 | 65% | 8,030 | 32% | 17,530 | 14% | 8,920 | 40% |
| 100-138% FPL | 11,280 | 16% | 34,450 | 21% | 7,250 | 29% | 10,650 | 9% | *** | 22% |
| 139-399% FPL | 20,290 | 29% | 20,730 | 12% | 8,450 | 33% | 47,380 | 39% | 7,650 | 34% |
| 400% FPL+ | 2,520 | 4% | *** | *** | 1,570 | 6% | 46,840 | 38% | *** | *** |
| 69,720 | 100% | 167,180 | 100% | 25,300 | 100% | 122,390 | 100% | 22,380 | 100% | |
| FPL=Federal Poverty Level*Includes those also covered by Medicare**Tricare/CHAMPUS, VA, other city/county*** Estimate does not meet standard for statistical reliability. Note: Numbers may not sum to totals due to rounding. Source: CDC/KFF analysis of 2009 MMP. | ||||||||||
Estimates of the Effects of ACA Insurance Expansions in 2014
Nearly 70,000 adults with HIV in care were uninsured. Given the income profile of the uninsured population with HIV in care, the vast majority (96%) would likely be eligible for free or subsidized coverage under the ACA’s Medicaid or Marketplace provisions if all states expanded Medicaid. If not all states expand, fewer will be eligible for Medicaid, and a small number of those who are ineligible because their state does not expand could obtain subsidized coverage in the Marketplace.
Medicaid Expansion
If all states were to expand Medicaid, almost 47,000 uninsured adults with HIV in care could gain Medicaid coverage. If this entire group enrolled, the share of people with HIV in care who are covered by Medicaid would increase from 41% to 53%. However, if only the 26 states currently planning to expand Medicaid do so, then fewer uninsured adults with HIV would be newly eligible for the program. As described above, 43% of people with HIV live in states that are currently not planning to expand Medicaid. Because data on the income and insurance distribution of people living with HIV at the state level were unavailable, we applied the national income and insurance distribution to states that are not planning to expand Medicaid. Assuming that the HIV population in states not planning to expand Medicaid has the same income and insurance distribution as people with HIV in care nationally, state decisions not to expand Medicaid could decrease the number of eligible uninsured with HIV by more than 20,000 people, to 26,560. An estimated 20,350 of those who could gain new Medicaid eligibility if their state expanded Medicaid live in states not planning to expand, with Texas and Florida alone accounting for about half. (See Table 3).
| Table 3: Potential Impact of State Decisions to Expand Medicaid on Medicaid Coverage of Nonelderly, Uninsured Adults with HIV in Care | ||
| Number of Uninsured Potentially Eligible for Medicaid | % | |
| States moving forward with expansion (26 states) | 26,560 | 57% |
| States NOT moving forward with expansion (25 states) | 20,350 | 43% |
| Total | 46,910 | 100% |
| *State Medicaid decisions as of October 22, 2013.Sources: CDC/KFF analysis of 2009 MMP; KFF State Health Facts, https://www.kff.org/health-reform/state-indicator/state-activity-around-expanding-medicaid-under-the-affordable-care-act/; 2010 NCHHSTP Atlas data, http://www.cdc.gov/nchhstp/atlas/. | ||
Health Insurance Marketplaces
As of 2014, almost 20,300 currently uninsured people with HIV in care could be newly eligible for subsidized coverage in Health Insurance Marketplaces, meaning their incomes are between 139% FPL and 400% FPL. Just over 2,500 uninsured adults with HIV in care who have incomes above 400% may also gain coverage under the ACA through Health Insurance Marketplaces, although they would not be eligible for financial assistance. It is possible that many people in this group cannot currently afford coverage due to their illness. While subsidies are not available for people in this income range, these individuals may benefit from new rules that cap annual and lifetime dollar limits on coverage, ban premium rate setting based on health status, and end pre-existing condition exclusions.
However, the number of people who would be eligible for and seek subsidized coverage through Marketplaces is dependent on whether or not states decide to expand Medicaid. In states that do not expand Medicaid, uninsured individuals with incomes between 100% FPL and 138% FPL may be eligible for subsidized coverage in Marketplaces. Thus, a small share of low-income people with HIV who would be left out of the Medicaid expansion due to their state’s decision not to expand could gain subsidized Marketplace coverage. We estimate that approximately 4,890 people with HIV in care have incomes between 100 and 138% FPL and live in states that are not expanding Medicaid. People with incomes below 100% FPL in states that do not expand Medicaid may be left without an ACA coverage option as they are neither eligible for Medicaid nor subsidized coverage. While they could purchase coverage through the Marketplaces, they are not eligible for subsidized coverage, and coverage is likely to be unaffordable. We estimate that approximately 15,460 people with HIV in care fall into this category. (See Figure 5). For these individuals, the Ryan White HIV/AIDS Program could play a significant role in helping them to purchase private coverage in the Marketplace.

Overall Impact
Taken together, the combination of Medicaid expansion and the ACA’s Health Insurance Marketplace could provide new coverage to the close to 70,000 people with HIV in care who are currently uninsured. If all states expanded Medicaid, 46,910 of these people would be eligible for Medicaid and 20,290 would be eligible for subsidized coverage in the Marketplace. If only the 26 states planning to expand Medicaid as of October 2013 do so, 26,560 would be eligible for Medicaid and more (25,190) would qualify for subsidized coverage in the Marketplace. However, 17,980 would remain ineligible for Medicaid and would not be eligible for financial assistance in the Marketplace. (See Table 4 and Figure 5). For these individuals, the Ryan White HIV/AIDS Program will be an important source of care and other HIV services.
| Table 4: Estimated Number of Nonelderly, Uninsured Adults with HIV in CareWho Could Gain New Coverage | ||||||
| New Coverage Source | If All States Expand Medicaid | If Only 26 States Expand Medicaid, and 25 Do Not* | Difference Between All States Expanding Medicaid and Only 26 Expanding | |||
| Number | % | Number | % | Difference | PercentChange | |
| Expanded Medicaid | 46,910 | 67% | 26,560 | 38% | -20,350 | -43% |
| Subsidized Marketplace Coverage | 20,290 | 29% | 25,190 | 36% | 4,900 | 24% |
| Unsubsidized Marketplace Coverage | 2,520 | 4% | 17,980 | 26% | 15,460 | 613% |
| Total | 69,720 | 100% | 69,720 | 100% | — | — |
| *State Medicaid decisions as of October 22, 2013.Note: Figures may not sum to total due to rounding.Sources: CDC/KFF analysis of 2009 MMP; KFF State Health Facts, https://www.kff.org/health-reform/state-indicator/state-activity-around-expanding-medicaid-under-the-affordable-care-act/; 2010 NCHHSTP Atlas data, http://www.cdc.gov/nchhstp/atlas/. | ||||||
In addition, while most people with HIV who already have insurance will not experience a change in their coverage after ACA implementation, it is possible that some may choose to change their coverage type. For example, some of those who currently have private coverage may purchase that coverage on their own directly from an insurer, rather than receiving it as a fringe benefit through a job. These individuals could choose to take advantage of the Marketplaces, as well as the subsidies available, where they may have lower premiums and broader benefits packages. We do not have estimates of the number or share of people with HIV in care who purchase coverage on their own (versus receive group coverage through an employer). However, the share of the general population with nongroup coverage is quite low (5%),9 and it is unlikely that a much higher share of people with HIV obtain nongroup coverage (particularly given the pre-existing condition exclusions that have been in place and did not end until January 1, 2014).
Further, some people with HIV in care who have private coverage may become newly-eligible for Medicaid (although research on the general population indicates that a very small share overall switches from private coverage to Medicaid when Medicaid is newly-available to them.)10
DISCUSSION
Key insurance expansion provisions of the Affordable Care Act will provide new health coverage for the approximately 70,000 uninsured individuals living with HIV in care today and may also provide new options to some who already have coverage. As this analysis finds, close to 47,000 people with HIV who are currently uninsured could be eligible for Medicaid if all states choose to expand Medicaid eligibility to 138% FPL; an additional 20,290 could be eligible for subsidized coverage in the new Health Insurance Marketplaces, and about 2,500 have incomes too high to be eligible for financial assistance but could purchase coverage in the Marketplace. However, if not all states expand Medicaid – and only 26 have indicated that they will as of October 2013– many fewer will be eligible for Medicaid. While some of these individuals will be able to obtain subsidized coverage in the Marketplace, the majority of uninsured people with HIV have incomes below 100% FPL, making them ineligible for subsidized coverage. For this subset, the Ryan White HIV/AIDS Program would remain a critical source of support. The Ryan White HIV/AIDS Program will also likely continue to be important for many who gain new coverage, given that two-thirds of current Ryan White HIV/AIDS Program clients already have insurance.
While this analysis focuses on people with HIV who are already in the care system, there are more than 700,000 who currently are not in care, either because they remain undiagnosed or are not receiving regular medical care. (See Figure 1). Many of these individuals are also likely to be eligible for new coverage. While little is known about their current health insurance and income status, to the extent that it matches that of people with HIV in care, an additional 124,000 people with HIV not receiving regular medical care could be newly eligible for coverage either through Medicaid or in the Marketplace. This would bring the total estimated number of people with HIV who could gain new coverage to close to 200,000.
It is important to note that although the ACA will significantly expand coverage for people with HIV, this newly insured population represents only a fraction (<1%) of the 25 million people expected to gain coverage overall and is therefore unlikely to substantially affect the risk pool of people gaining new coverage;11 currently, people with HIV on Medicaid represent less than 2% of total Medicaid costs and less than 1% of enrollees.12 The ACA represents an important opportunity to draw this high-need population into broader coverage and to address ongoing unmet needs for coverage and care. At the same time, the Ryan White HIV/AIDS Program will continue to be an important source of care and other HIV-related services for those who do not gain new coverage or need additional financial assistance to pay for their HIV care going forward.
Jennifer Kates, Rachel Garfield, and Katherine Young are with the Kaiser Family Foundation. Kelly Quinn, Emma Frazier, and Jacek Skarbinski are with the Centers for Disease Control and Prevention.
Appendices
APPENDIX A: METHODS
Data source:
This analysis relies on data from the Medical Monitoring Project (MMP), as recommended by the Institute of Medicine in a report commissioned by the White House to help identify data sources for monitoring the effects of the Affordable Care Act (ACA) on HIV care and coverage in the United States.13 MMP is a supplemental HIV surveillance system designed to produce nationally representative estimates of behavioral and clinical characteristics of HIV-infected adults receiving medical care in the United States.14 ,15 MMP is a complex-sample, cross-sectional survey. For the 2009 data collection cycle, first, U.S. states and territories were sampled, then, facilities providing HIV care, and finally adult persons aged 18 years or older receiving at least one medical care visit in participating facilities between January and April 2009. Data were collected via face-to-face interviews and medical record abstractions from June 2009 to May 2010. All sampled states and territories participated in MMP (California, Delaware, Florida, Georgia, Illinois, Indiana, Michigan, Mississippi, New Jersey, New York, North Carolina, Oregon, Pennsylvania, Puerto Rico, Texas, Virginia, and Washington). Of 603 sampled facilities within these states or territories, 461 participated in MMP (facility response rate 76%), and of 9,338 sampled persons, 4,217 completed both an interview and a linked medical record abstraction (adjusted patient-level response rate 51%) for a combined response rate of 39%. Data were weighted based on known probabilities of selection at state or territory, facility, and patient levels. In addition, data were weighted to adjust for non-response using predictors of patient-level response including facility size, race/ethnicity, time since HIV diagnosis, and age group. This analysis includes information on 4,067 participants, who, after weighting for probability of selection and non-response, are estimated to represent a population of 406,970 HIV-infected adults aged 19-64 years receiving medical care in the United States between January and April 2009.
Data for this analysis were collected in 2009 – prior to the passage of the ACA. They do not, therefore take into account increases in in the number of people living with HIV (estimated to increase by about 3% annually),16 and as such likely underestimate the number who may be newly eligible for coverage as of 2014. They also assume that the income and insurance profile of people with HIV remains the same between 2009 and 2013, just before the implementation of the major ACA coverage expansions examined here.
Analysis:
This analysis focuses on individuals between age 19 and 64, the age group targeted for coverage expansions by the ACA.17 For all respondents in MMP, we examined self-reported insurance coverage as well as payment source for antiretroviral medicines using responses to the following questions “During the past 12 months, what were all the kinds of health insurance or health coverage you had?” and “During the past 12 months, what were the ways your antiretroviral medicines were paid for?” Response options included insurance programs (Medicaid, Medicare, private insurance, Veteran’s Administration, Tricare or CHAMPUS coverage, other public insurance, and other unspecified insurance) as well as medical care, medications and other services paid for by the Ryan White HIV/AIDS Program (Ryan White or the AIDS Drug Assistance Program). It is important to note that HIV patients may not be aware of all the services they receive that are paid for by the Ryan White HIV/AIDS Program (the program provides funding directly to service organizations in many cases) and therefore, the estimates of the number of individuals who receive Ryan White HIV/AIDS Program services is likely an underestimate. Because respondents in MMP may indicate more than one type of coverage, we relied on a hierarchy to group people into mutually-exclusive coverage categories. Specifically, the hierarchy groups people into coverage types in the following order:
- Medicaid coverage, except for those dually eligible for Medicare
- Dually eligible for Medicaid and Medicare coverage
- Private coverage
- Medicare coverage only
- Other public coverage, including Tricare/CHAMPUS, Veteran’s Administration, or city/county coverage
In most cases, this hierarchy classifies individuals according to the coverage source that serves as their primary payer. The exception is Medicaid, which captures anyone with Medicaid coverage (even if Medicaid is not the primary payer) in order to account for the undercount of Medicaid coverage in population-based surveys.18 People who do not report any of the sources of insurance coverage above are classified as uninsured. As noted above, we separately assess whether each respondent received assistance through the Ryan White HIV/AIDS Program.
Lastly, we examine income for each respondent as a share of the federal poverty level (FPL). MMP captures income in terms of either monthly or annual dollar income, and it also measures how many people are supported by that income. We use these two variables to translate dollar income to corresponding share of FPL, using 2008 HHS Federal Poverty Guidelines for persons interviewed in 2009 and 2009 HHS Federal Poverty Guidelines for persons interviewed in 2010. Because the income measure in MMP is categorical, rather than continuous, we assign each respondent the mid-point of the category for their income. We conducted a sensitivity analysis (explained below) to assess to what extent using the mid-point could lead us to over or under-estimate the number gaining coverage under the ACA. We group individuals into income categories that correspond with income eligibility for coverage under the ACA: less than 100% FPL, between 100 and 138% FPL, between 139 and 399% FPL, and greater than or equal to 400% FPL.
Respondents for whom income or insurance coverage information were missing (3.2% and 0.2% of the unweighted sample, respectively) were excluded. However, in reporting total number of people with HIV in care in each group, we assumed that the insurance and income profile of those with missing data was the same as for those with complete data. In reporting estimates, we exclude point estimates where the relative standard error is greater than 30% or where the unweighted cell size was less than 5. These restrictions affected some of the estimates for the population at or above 400% FPL.
Limitations:
MMP is nationally representative only of those with HIV who are in care. The survey does not include those who are diagnosed but not in care, nor does it capture people with HIV who are not diagnosed (see Figure 2). People with HIV who are not in care or who have not been diagnosed also will be affected by ACA coverage provisions and are likely to come into care as a result of outreach efforts. However, we have limited information on the basis of which to extrapolate MMP findings to this population. Although we do not attempt to estimate coverage changes for people with HIV not in care, we do discuss the potential impact of the ACA on the population of all people infected with HIV regardless of diagnosis or care status, using CDC estimates of that population.
MMP also only allows for analysis at the national level. Because not all states are moving forward with the Medicaid expansion, our national estimates of the impact of ACA coverage provisions will over-estimate the number affected. We conducted a secondary analysis to account for states not expanding Medicaid by scaling the national findings to the share of people in treatment for HIV who live in states that are expanding Medicaid. Specifically, using the NCHHSTP Atlas and the Kaiser Family Foundation’s health reform resources, we calculated the shares of people living with diagnosed HIV in the states expanding and in the states not expanding Medicaid. We then multiplied these shares by the MMP findings to estimate the number of people in care for HIV who will be eligible for Medicaid coverage and Marketplace subsidies, given the current state decisions regarding Medicaid expansion. In doing this, we make the assumption that the national income and insurance distribution is equal to the income and insurance distribution in the expansion states as well as the non-expansion states. Since actual coverage patterns and income distributions are likely to vary across states, the state-level analysis should be interpreted with caution. While imprecise, the state-level analysis still provides a better approximation of the current landscape than using only the national data, given that all states are not expanding Medicaid. Although Puerto Rico is included in our national estimates, we do not account for it when conducting this secondary analysis. However, the effect is minimal, as Puerto Rico accounts for only 2% of people living with diagnosed HIV in the United States, according to the NCHHSTP Atlas data.
As described above, MMP does not collect data on the actual income amount for each individual but rather categorizes the respondent’s annual income into categories at intervals of $5,000. We assigned the middle point of the income category to the individual in calculating where they fall with respect to the FPL, which could incorrectly estimate their potential eligibility for Medicaid or Marketplace subsidies. For example, an individual who is just above 138% of the poverty level ($14,945 in 2009) would be classified as at or below 138% FPL using the mid-point of income ($12,250) for their category ($10,000 to $14,999). We conducted sensitivity analysis of our approach by assigning both the minimums and maximums of the income categories in calculating income with respect to the FPL; we then compared how the population redistributed itself using both the minimum and maximum levels. We found that if we had used the lower bound of the income category, we would have estimated the share of the population falling into the Medicaid eligibility group to be 2 percentage points higher than we estimated using the midpoint. Had we used the upper bound, the share of the population falling into the Medicaid eligibility group would be 11 percentage points lower than what we estimated using the midpoint. Thus, while we are likely capturing most people who would fall into the Medicaid eligibility group, we may be capturing some people whose income would in fact be above Medicaid eligibility. These individuals would still be eligible for new coverage under the ACA via Marketplace subsidies.
We are also unable to identify which individuals are undocumented residents in the US and consequently ineligible for Medicaid or enrollment in the Health Insurance Marketplaces in 2014. In 2009, 12.3 percent of respondents in MMP were not born in the US, though many of these individuals are likely lawfully present (or subsequently gained citizenship) and would be eligible for coverage. Lawfully present noncitizens who have been in the country for less than five years are also barred from Medicaid coverage. Of the foreign born in MMP, only 5 percent have been in the country for less than five years, and these individuals account for less than one percent of the total sample. Thus, inclusion of foreign-born individuals is unlikely to substantially affect our estimates of eligibility for Medicaid coverage.
Our estimates do not account for participation rates in coverage. Not everyone who is newly-eligible for Medicaid or Marketplace subsidies will enroll in coverage, and some people who are currently uninsured may already be eligible for Medicaid or other coverage. Uptake is dependent on several factors, including ease of applying, knowledge of coverage options, other coverage options available, personal utility of insurance coverage, and a host of other factors. Other analyses that have used micro-simulation models to predict coverage changes under the ACA estimate that approximately 60% of newly-eligible individuals will enroll in Medicaid;10 given the high need for medical services among the population with HIV, it is likely that uptake among this group would be much higher.
Endnotes
- For a comprehensive overview of the provisions of the ACA that are of particular importance to people with HIV, see: Crowley J, Kates J (2012), The Affordable Care Act, the Supreme Court, and HIV: What Are the Implications? Washington, DC: Kaiser Family Foundation. Available at: https://modern.kff.org/health-reform/report/the-affordable-care-act-the-supreme-court-and-hiv-what-are-the-implications/. ↩︎
- An analysis conducted by the Center for Health Law and Policy Innovation at Harvard Law School and the Treatment Access Expansion Project used data from the Ryan White AIDS Drug Assistance Program to estimate the number of ADAP clients who might be newly eligible for coverage by state. See: Estimating the Transition of People Living with HIV/AIDS to Medicaid or Subsidized Private Health Insurance through the Patient Protection and Affordable Care Act, 2012. ↩︎
- Hall H, Frazier EL, Rhodes P, et al. (2013). “Differences in Human Immunodeficiency Virus Care and Treatment Among Subpopulations in the United States.” JAMA Intern Med. 173(14):1337-1344. ↩︎
- Kates J (2011), Medicaid and HIV: A National Analysis. Washington, DC: Kaiser Family Foundation. Available at: https://modern.kff.org/hivaids/report/medicaid-and-hiv-a-national-analysis/. ↩︎
- Department of Health and Human Services, Panel on Antiretroviral Guidelines for Adults and Adolescents (2013). Guidelines for the use of antiretroviral agents in HIV-1-infected adults and adolescents, February 12, 2013. Available at: http://aidsinfo.nih.gov/guidelines/html/1/adult-and-adolescent-treatment-guidelines/0/. ↩︎
- For a list of these states and their eligibility requirements, see Kaiser Family Foundation, State Health Facts, “Adult Income Eligibility Limits at Application as a Percent of the Federal Poverty Level (FPL), January 2013”. Available at: https://modern.kff.org/medicaid/state-indicator/income-eligibility-low-income-adults/. ↩︎
- KFF analysis of data from the CDC NCHHSTP Atlas on the number of people living with an HIV diagnosis by state. See: http://gis.cdc.gov/GRASP/NCHHSTPAtlas/main.html. ↩︎
- For a list of the current status of state Medicaid expansion decisions, see Kaiser Family Foundation, State Health Facts, “Status of State Action on the Medicaid Expansion Decision, as of September 16, 2013”. Available at: https://modern.kff.org/health-reform/state-indicator/state-activity-around-expanding-medicaid-under-the-affordable-care-act/ ↩︎
- Urban Institute and Kaiser Commission on Medicaid and the Uninsured estimates based on the Census Bureau’s March 2012 Current Population Survey (CPS: Annual Social and Economic Supplements). ↩︎
- Holahan J, Buettgens M, Carroll C, Dorn S. The Cost and Coverage Implications of the ACA Medicaid Expansion: National and State-by-State Analysis. (Washington, DC: The Kaiser Commission on Medicaid and the Uninsured), November 2012. Available at: http://modern.kff.org/health-reform/report/the-cost-and-coverage-implications-of-the/. ↩︎
- Congressional Budget Office. Effects on Health Insurance and the Federal Budget for the Insurance Coverage Provisions in the Affordable Care Act—May 2013 Baseline. Available at: http://www.cbo.gov/publication/44190. ↩︎
- KCMU and Urban Institute estimates based on data from FY 2010 MSIS and CMS-64 reports, available at http://modern.kff.org/hivaids/state-indicator/enrollment-spending-on-hiv/. ↩︎
- IOM (Institute of Medicine). 2012. Monitoring HIV care in the United States: A strategy for generating national estimates of HIV care and coverage. Washington, DC: The National Academies Press. ↩︎
- CDC Medical Monitoring Project (MMP): http://www.cdc.gov/hiv/prevention/ongoing/mmp/index.html. ↩︎
- McNaghten, Wolfe et al. 2007; Blair, McNaghten et al. 2011; Frankel, McNaghten et al. 2012. ↩︎
- Analysis of data from Centers for Disease Control and Prevention, HIV Surveillance Report, 2011; vol. 23. http://www.cdc.gov/hiv/topics/surveillance/resources/reports/. Published February 2013.. ↩︎
- Current Medicaid eligibility extends through age 18 (and in some states, through age 20), and Medicare covers most people starting at age 65; thus, in examining new coverage options available to adults, we focus on the population age 19 through 64. ↩︎
- For more information on the Medicaid undercount, see: http://www.census.gov/did/www/snacc/. ↩︎