Individual Insurance Market Performance in 2017
NEW: Individual Insurance Market Performance in 2018 now available
Concerns about the stability of the individual insurance market under the Affordable Care Act (ACA) have been raised in the past year following exits of several insurers from the exchange markets for 2017, and again last year during the debate over repeal of the health law.
In this brief, we look at recently-released annual financial data from 2017 to examine whether recent premium increases were sufficient to bring insurer performance back to pre-2014 levels, when new ACA insurance market rules took effect. These new data from 2017 offer further evidence that insurers in the individual market are regaining profitability, even as political and policy uncertainty, repeal of the individual mandate penalty as part of tax reform legislation, and proposed regulations to expand loosely-regulated short-term insurance plans cloud expectations for the future.
Annual financial data reflects insurer performance in 2017 through December of last year. The Administration ceased payments for cost-sharing subsidies effective October 12, 2017. The loss of these payments during the fourth quarter of 2017 diminished insurer profits, but nonetheless, insurers saw better financial results in 2017 than they did in earlier years of the ACA. Markets in parts of the country remain fragile, with little competition and an insufficient number of healthy enrollees to balance those who are sick. However, absent any policy changes, it is likely that insurers would generally have required only modest premium increases in 2018 and in 2019 as well. Insurers are now beginning to file proposed rates for 2019.
We use financial data reported by insurance companies to the National Association of Insurance Commissioners and compiled by Mark Farrah Associates to look at the average premiums, claims, medical loss ratios, gross margins, and enrollee utilization from 2011 through 2017 in the individual insurance market.1 These figures include coverage purchased through the ACA’s exchange marketplaces and ACA-compliant plans purchased directly from insurers outside the marketplaces (which are part of the same risk pool), as well as individual plans originally purchased before the ACA went into effect.
Medical Loss Ratios
As we found in our previous analysis, insurer financial performance as measured by loss ratios (the share of health premiums paid out as claims) worsened in the earliest years of the Affordable Care Act, but began to improve more recently. This is to be expected, as the market had just undergone significant regulatory changes in 2014 and insurers had very little information to work with in setting their premiums, even going into the second year of the exchange markets.
Loss ratios began to decline in 2016, suggesting improved financial performance. In 2017, following relatively large premium increases, individual market insurers saw significant improvement in loss ratios, averaging 82%. Though 2017 annual loss ratios are impacted by the loss of cost-sharing subsidy payments during the last three months of the year, this is nevertheless a sign that individual market insurers on average were beginning to stabilize in 2017, better matching premium revenues to claims costs.
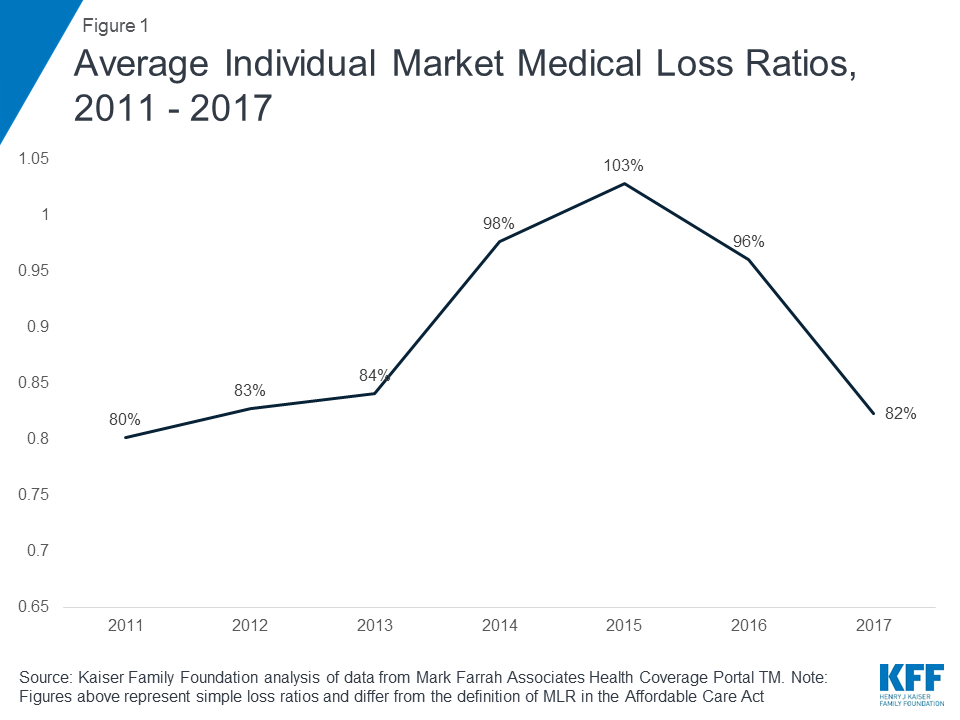
Figure 1: Average Individual Market Medical Loss Ratios, 2011 – 2017
Margins
Another way to look at individual market financial performance is to examine average gross margins per member per month, or the average amount by which premium income exceeds claims costs per enrollee in a given month. Gross margins are an indicator of performance, but positive margins do not necessarily translate into profitability since they do not account for administrative expenses.
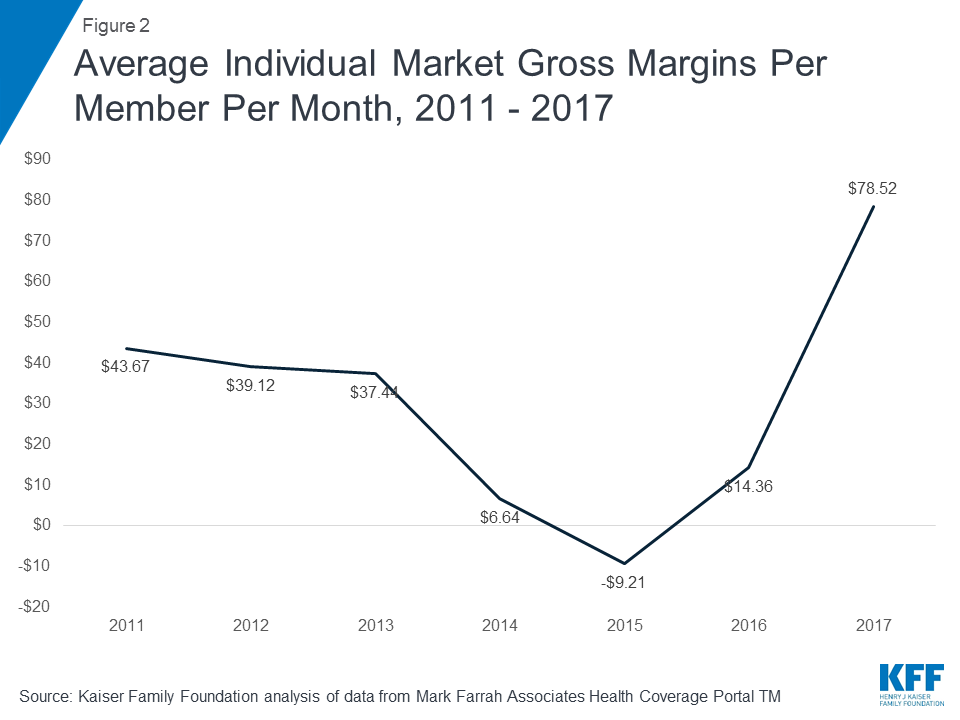
Figure 2: Average Individual Market Gross Margins Per Member Per Month, 2011 – 2017
Looking at gross margins, we see a similar pattern as we did looking at loss ratios, where insurer financial performance improved dramatically through 2017 (increasing to $79 per enrollee, from a recent annual low of -$9 in 2015). These data suggest that insurers in this market are on track to reach pre-ACA individual market performance levels, and that insurers are generally now earning a profit in the individual market.
Underlying Trends
Driving recent improvements in individual market insurer financial performance are the premium increases in 2017 and simultaneous slow growth in claims for medical expenses. On average, premiums per enrollee grew 22% from 2016 to 2017, while per person claims grew only 5%.
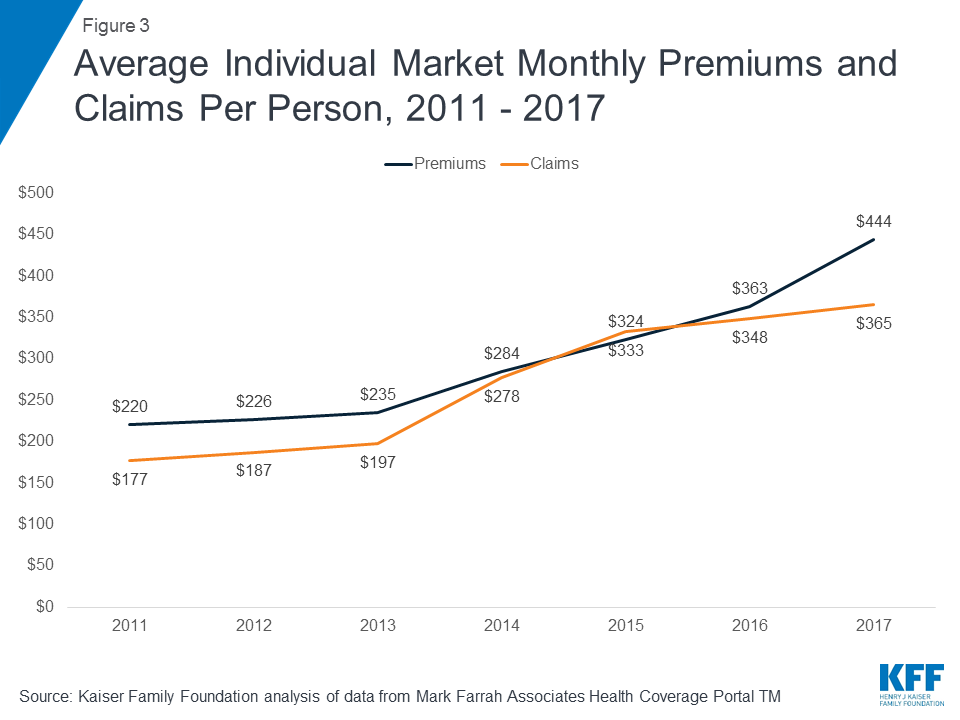
Figure 3: Average Individual Market Monthly Premiums and Claims Per Person, 2011 – 2017
One concern about rising premiums in the individual market was whether healthy enrollees would drop out of the market in large numbers rather than pay higher rates. While the vast majority of exchange enrollees are subsidized and sheltered from paying premium increases, those enrolling off-exchange would have to pay the full increase. As average claims costs grew very slowly through 2017, it does not appear that the enrollees in the market last year were noticeably sicker than in the early years of ACA implementation.
On average, the number of days individual market enrollees spent in a hospital in 2017 was similar to inpatient days in the previous two years.
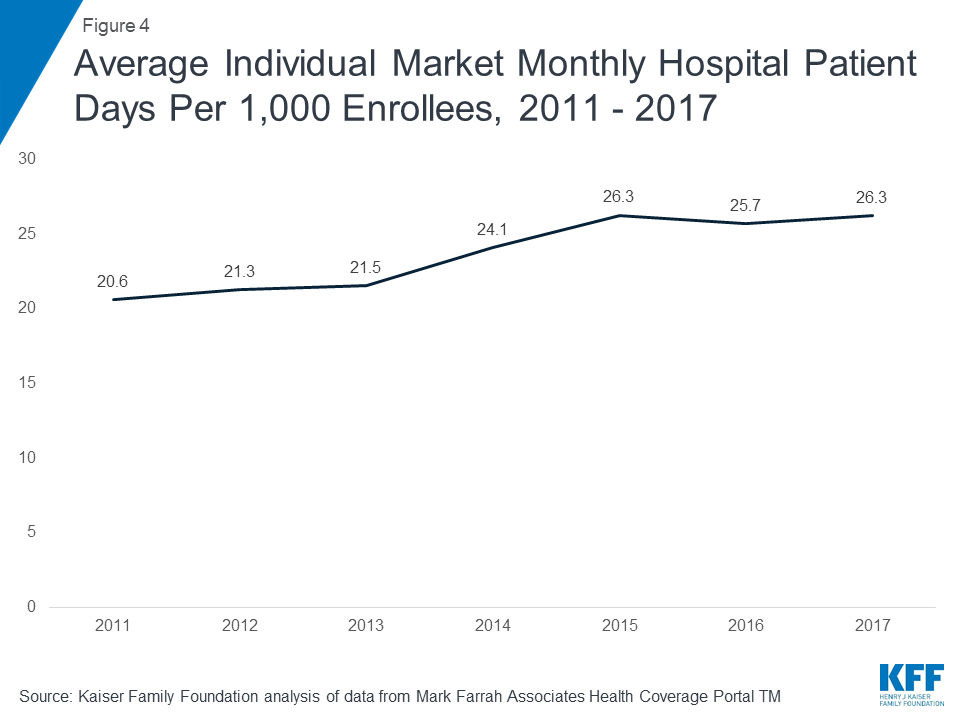
Figure 4: Average Individual Market Monthly Hospital Patient Days Per 1,000 Enrollees, 2011 – 2017
Taken together, these data on claims and utilization suggest that the individual market risk pool is relatively stable, though sicker on average than the pre-ACA market, which is to be expected since people with pre-existing conditions have guaranteed access to coverage under the ACA.
Discussion
Annual results from 2017 suggest the individual market was stabilizing and insurers in this market were regaining profitability. Insurer financial results through 2017 – after the Administration’s decision to stop making cost-sharing subsidy payments and before the repeal of the individual mandate penalty in the tax overhaul goes into effect – showed no sign of a market collapse. Annual premium and claims data from 2017 support the notion that 2017 premium increases were necessary as a one-time market correction to adjust for a sicker-than-expected risk pool. Although individual market enrollees appear on average to be sicker than the market pre-ACA — which is to be expected once people with pre-existing conditions were guaranteed access to insurance — data on hospitalizations in this market suggest that the risk pool was stable on average and was not getting progressively sicker. Some insurers have exited the market in recent years, but others have been successful and expanded their footprints, as would be expected in a competitive marketplace.
While the market on average was stabilizing, there remain some areas of the country that are more fragile. In addition, policy changes have the potential to destabilize the individual market generally. The decision by the Administration to cease cost-sharing subsidy payments led some insurers to leave the market or request larger premium increases than they would otherwise. A few parts of the country were thought to be at risk of having no insurer on exchange in 2018, though new entrants or expanding insurers have since moved in to cover all areas previously at risk of being bare. Signups through the federal marketplace during the recently completed open enrollment period declined somewhat, but were higher than many expected, which could help to keep the market stable. However, repeal of the individual mandate as part of tax reform legislation will take effect in 2019, combined with the likely expansion of loosely-regulated short-term insurance plans that could siphon off healthy enrollees from the ACA-regulated individual market. These changes will increase uncertainty for insurers and likely push premiums higher.
Methods
We analyzed insurer-reported financial data from Health Coverage Portal TM, a market database maintained by Mark Farrah Associates, which includes information from the National Association of Insurance Commissioners. The dataset analyzed in this report does not include NAIC plans licensed as life insurance or California HMOs regulated by California’s Department of Managed Health Care; in total, the plans in this dataset represent at least 80% of the individual market. All figures in this data note are for the individual health insurance market as a whole, which includes major medical insurance plans sold both on and off exchange. We excluded some plans that filed negative enrollment, premiums, or claims and corrected for plans that did not file “member months” in the annual statement but did file current year membership.
To calculate the weighted average loss ratio across the individual market, we divided the market-wide sum of total incurred claims by the sum of all unadjusted health premiums earned. Medical loss ratios in this analysis are simple loss ratios and do not adjust for quality improvement expenses, taxes, or risk program payments. Gross margins were calculated by subtracting the sum of total incurred claims from the sum of unadjusted health premiums earned and dividing by the total number of member months (average monthly enrollment) in the individual insurance market. Using earned premiums adjusted for taxes and fees to calculate loss ratios and gross margins increases the MLR by 5 percentage points and decreases the gross margin per member by $23 in 2017. On average across all years, using earned premiums adjusted for taxes and fees increases the MLR by 3 percentage points and decreases the gross margin per member by $10.