Insurer Financial Performance in the Early Years of the Affordable Care Act
Although insurers have generally remained profitable overall since implementation of the Affordable Care Act, many companies participating in the individual market – where most of the major market reforms took place in 2014 – experienced substantial losses in this market in the early years of reform. The individual market is where just 7% of the U.S. population gets their insurance (and thus also represents a small share of most health insurers’ business), but the stability of the market and willingness of insurers to continue to participate is essential to the ACA’s success. Going into 2017, there were a number of high-profile exits and premium increases, raising concerns over the stability of the individual market. Although some local markets are likely fragile, the Congressional Budget Office expects the ACA individual market to remain stable across most part of the country.
This data note looks at trends in insurer financial performance in the individual market over the past few years, finding that the market is showing signs of stabilizing. The success of the ACA is dependent on the participation of private insurers in the marketplaces, who will need to be profitable over the long-term to remain in the market.
We use financial data reported by insurance companies to the National Association of Insurance Commissioners and compiled by Mark Farrah Associates to look at the average medical loss ratio (the share of health premiums paid out as claims) from 2011 through 2016 in the individual insurance market. The figures include coverage purchased through the ACA’s marketplaces and ACA-compliant plans purchased directly from insurers outside the marketplaces (which are part of the same risk pool), as well as individual plans originally purchased before the ACA went into effect. When medical loss ratios (MLRs) are higher, insurers are paying out more of their premium income on claims and – considering the relatively high cost of administering individual market plans – it is unlikely insurers can be profitable when MLRs exceed 85 – 90%. The loss ratios shown in this data note differ from the definition of MLR in the ACA, which makes some adjustments for quality improvement and taxes, and also do not account for reinsurance, risk corridors, or risk adjustment payments. Reinsurance payments, in particular, helped offset some losses insurers would have otherwise experienced. However, the ACA’s reinsurance program was temporary, ending in 2016, so loss ratio calculations excluding reinsurance payments are a good indicator of financial stability going forward. We also look at average monthly margins per enrollee over the same period.
In 2014, when the exchanges opened and the bulk of the ACA’s market reforms took effect, individual market insurer financial performance worsened, with individual market MLRs averaging 98% compared to 84% a year prior. The individual market underwent a number of changes in 2014, and insurers had very little information to work with in setting their premiums. On average, insurers set premiums too low to cover their costs in the individual market. This mispricing is likely due to a combination of fewer young or healthy enrollees than initially anticipated, which was augmented by the late regulatory decision to permit some non-compliant plans to be retained, as well as some competitors apparently underpricing in an attempt to be competitive (low-cost silver premiums for 2014 came in substantially lower than CBO projections).
In 2015, as claims growth continued to outpace premiums, individual market MLRs increased again, to an average of 103%. On the exchange markets, premiums remained relatively flat from 2014 to 2015, likely because insurers had not yet gathered enough data on their enrollees’ health care utilization to be able to set premiums more appropriately, and carriers were competing to be the low-cost option. Individual market insurers submitted their 2015 premiums to state and federal regulators in spring of 2014, shortly after the first ACA exchange open enrollment had ended.
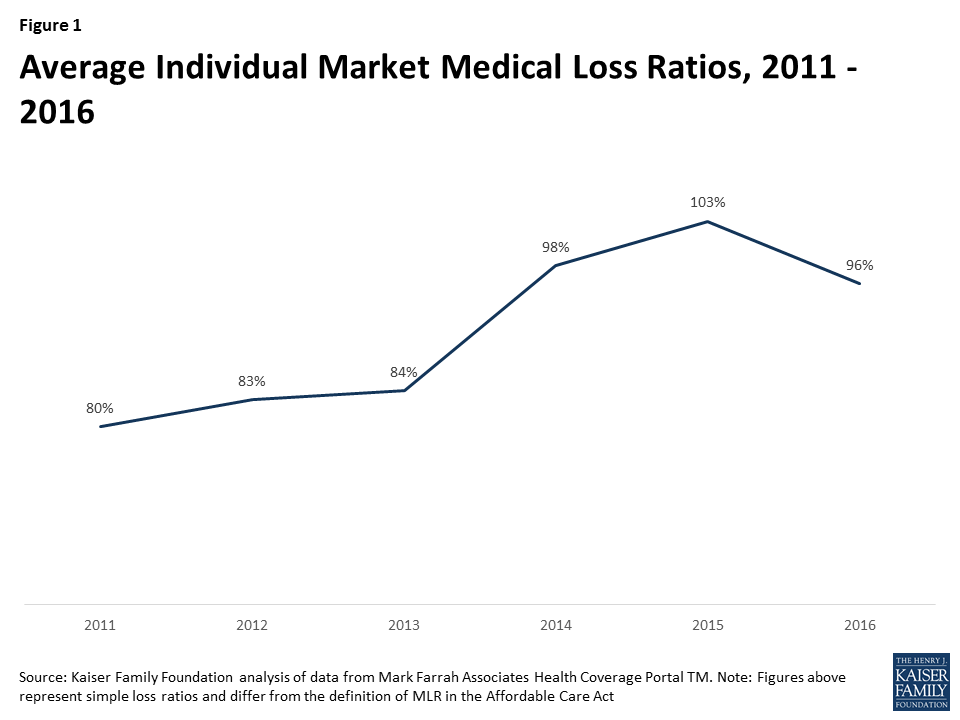
It was not until last year that individual market loss ratios began to fall as insurers raised premiums faster than the rate of claims cost growth. 2016 was the first year that insurers had any meaningful data with which to work, though they were still setting premiums with only a partial year of experience (as 2014 open enrollment extended well into the year and insurers had to submit their 2016 premium in spring of 2015). Although insurers’ individual market performance improved on average in 2016, loss ratios remained relatively high. On average, MLRs fell by 7 percentage points from 2015 to 2016 to 96%, but remained higher than 2013 levels and would need to fall further for the industry as a whole to be profitable in this market. (A recent S&P analysis looking at a subset of Blue Cross Blue Shield plans showed a similar pattern.)
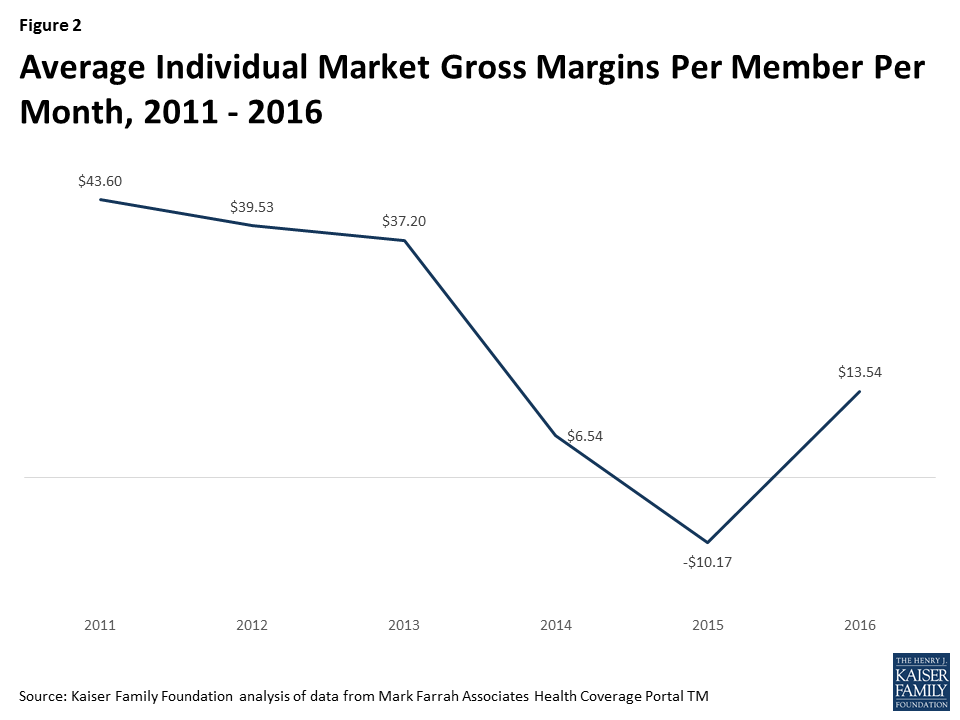
Another way to look at individual market financial performance is to examine average gross margins per member per month, or the average amount by which premium income exceeds claims costs per enrollee in a given month. Gross margins are an indicator of performance, but positive margins do not necessarily translate into profitability since they do not account for administrative expenses. Although medical loss ratios are higher now than they were pre-ACA, the total amount of premium income is also higher as many more people are enrolled in this market than before the exchanges opened. Again, we see a similar pattern, where monthly insurer margins in this market worsened in 2014 (dropping from about $37 to $7 per enrollee) and again in 2015 (to a loss of $10 per enrollee), but began to improve in 2016 (increasing by about $24 to $14 per enrollee). However, insurers would need to see a similar rate of improvement in 2017 to reach pre-exchange (2013) margins.
What does this mean for the exchanges and broader individual market this year and next? On average, we do know that insurers participating in ACA marketplaces raised premiums substantially from 2016 to 2017, with benchmark premiums rising an average of 22%. Marketplace enrollment has held mostly steady, with open enrollment signups totaling 12.2 million for 2017, about half a million below 2016 levels. Assuming claims expenses do not rise unexpectedly, insures may significantly improve their financial performance in this market in 2017.
Though this can be taken as a sign that the market is stabilizing, health insurers still face tremendous uncertainty going forward. Mixed signals from the Administration and Congress over the direction and timing of ACA repeal efforts, and a lack of clarity on individual mandate enforcement and payments for cost-sharing subsidies, could make insurers hesitant to continue to participate, even if the market is showing signs of improving otherwise.
Methods
We analyzed insurer-reported financial data from Health Coverage Portal TM, a market database maintained by Mark Farrah Associates, which includes information from the National Association of Insurance Commissioners. All figures in this data note are for the individual health insurance market as a whole, which includes major medical insurance plans sold both on and off exchange.
To calculate the weighted average loss ratio across the individual market, we divided the market-wide sum of total incurred claims by the sum of all health premiums earned across all 50 states plus DC (the dataset analyzed in this report does not include California HMOs, which report separately to California’s Department of Managed Health Care). Medical loss ratios in this analysis are simple loss ratios and do not adjust for quality improvement expenses, taxes, or risk program payments. Gross margins were calculated by subtracting the sum of total incurred claims from the sum of health premiums earned and dividing by the total number of member months (average monthly enrollment) in the individual insurance market.