Emergency Contraception

Published: Jan 28, 2025

Note: This brief was updated on January 29, 2025 to incorporate new data and policy changes on emergency contraception.

Emergency contraception (EC) is a form of backup birth control that can be used up to several days after unprotected intercourse or contraceptive failure and still prevent a pregnancy. In 1999, Plan B was the first oral product approved for use in the U.S. as an EC by the Food and Drug Administration (FDA). Since then, more EC products have been approved. Many have confused EC pills with mifepristone, the “abortion pill,” but EC pills do not cause abortion. EC pills prevent pregnancy by delaying or inhibiting ovulation and will not work if the pregnancy is established. This fact sheet reviews the methods of EC, known mechanisms of action, use of EC, and current national and state policies affecting EC access.

What is Emergency Contraception?

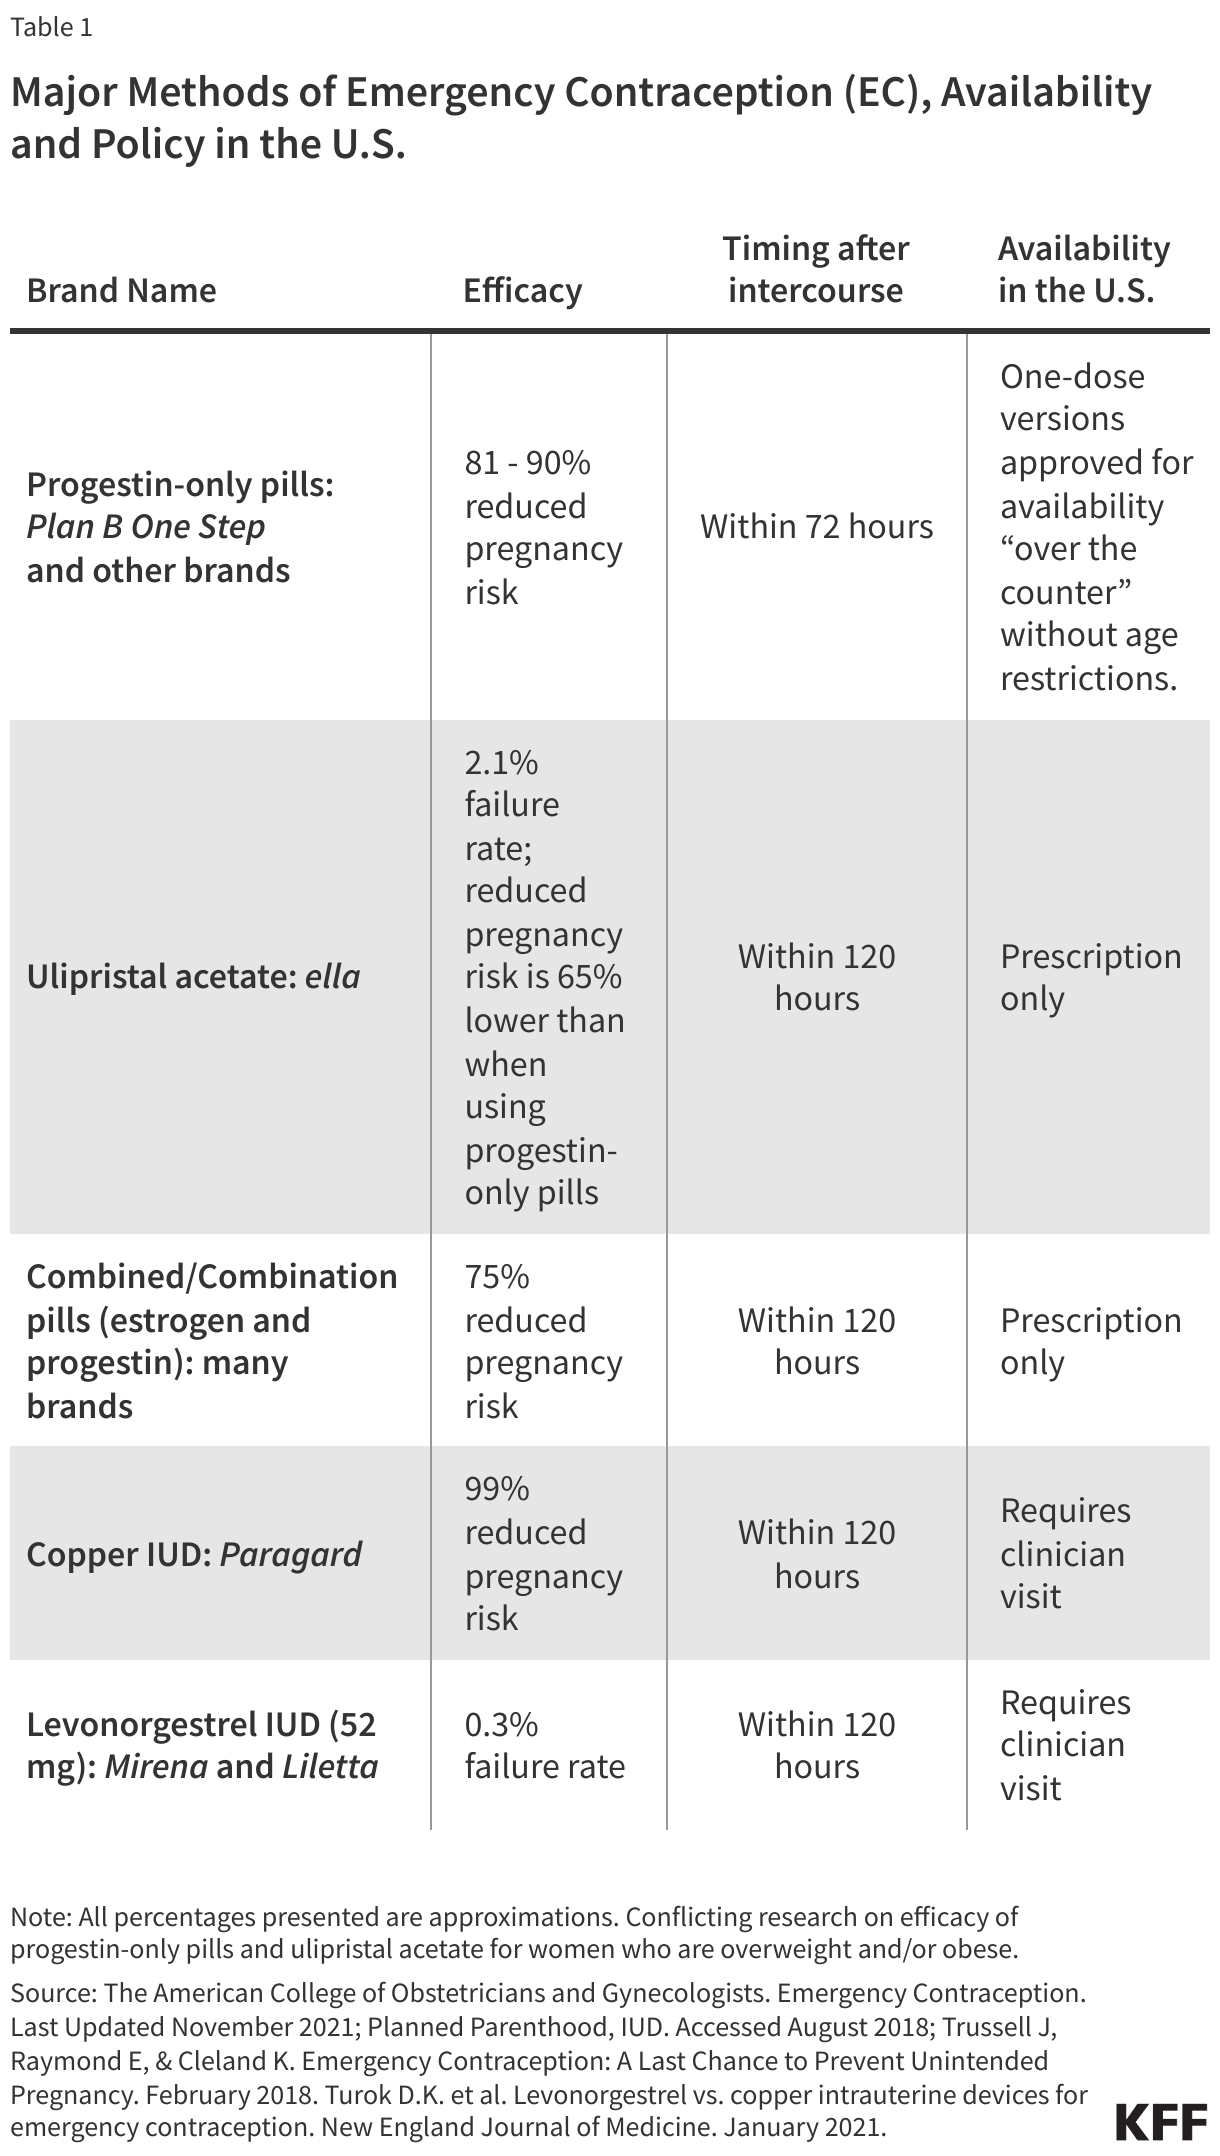
EC is used as a back-up birth control method to prevent pregnancy in the event of unprotected sex, sexual assault, or a contraceptive failure, such as a condom breaking. ECs do not terminate a pregnancy, stop the implantation of a fertilized egg, or affect a developing embryo. There are several methods of EC that are available in the U.S. including progestin-based pills, ulipristal acetate, and intrauterine devices (IUDs) (Table 1). The copper and levonorgestrel IUDs can be used after unprotected sex and as ongoing regular contraceptive methods. EC pills are only to be used after unprotected sex and are not intended for use as a regular method.

Major Methods of Emergency Contraception (EC), Availability and Policy in the U.S.

Progestin-Based Pills

  • Plan B was the first oral form of EC to be made available in the U.S. as a pre-packaged dose of pills containing the progestin, levonorgestrel. Now, there are generic alternatives available as well. Progestin-based EC pills use the same hormones found in daily oral contraceptives and are the most widely used form of EC. EC pills are marketed today under the brand name Plan B One-Step and generic names and are available over-the-counter, without a prescription/ (Table 1).
  • Progestin-based EC pills do not interrupt or adversely impact an established pregnancy, nor are they medical abortion drugs like mifepristone or methotrexate that end an established pregnancy. Plan B One-Step and the generic versions prevent pregnancy by inhibiting or delaying ovulation or by making it harder for sperm to reach an egg.
  • Progestin-based EC is to be taken within 72 hours of unprotected sex in order to be most effective and reduce the likelihood of pregnancy by 81% to 90% when taken in this timeframe.
  • There are no known serious side effects associated with progestin-based EC; side effects may include bleeding or spotting, headaches, nausea, and breast tenderness.
  • Some research has suggested that efficacy of progestin-based EC is lower among women with Body Mass Index (BMI) levels greater than 25. However, in May 2016 the FDA announced that it had reviewed the available scientific data regarding the effectiveness of EC pills in overweight and obese women, and that the data are inconclusive and did not recommend a labeling change.
  • Progestin-based pills can be stored for several years, with Plan B One Step having a shelf-life of four years when stored as directed. Consumers should always check the expiration date on the packaging prior to taking the pill.

Ulipristal acetate: ella

  • Ulipristal acetate, marketed as ella, was approved by the FDA in 2010 for sale and use in the U.S.
  • ella is a single-dose (30 mg) pill that is effective in preventing pregnancy up to five days after unprotected intercourse, giving women a longer timeframe to prevent unintended pregnancy than Plan B. Its mechanism of action is similar to that of progestin-based EC.
  • Study findings show that side effects for ella are comparable to those for Plan B, and some research suggests that its effectiveness appears to diminish at BMI thresholds above 35.
  • A 2025 study based on a small sample of women in Mexico suggests that when paired with misoprostol, one of the two drugs used in the FDA’s approved abortion medication regimen, higher doses of ulipristal acetate (60 mg) can terminate a pregnancy. It has already been demonstrated that misoprostol alone terminates early pregnancies. Prior research has shown that a 30 mg dose of ulipristal acetate alone, the dose that is used for emergency contraception in the U.S., does not disrupt an established pregnancy.

Combined/Combination Pills

  • Certain daily oral contraceptive pills can also act as EC when taken in doses four or five times higher than the daily dose, although they are not specifically sold as emergency contraception. Oral contraceptive pills contain progestin and estrogen and are taken in two doses 12 hours apart to be effective as EC.
  • Combined pills have been found to be safe and effective for preventing pregnancy within 5 days of intercourse.

Copper-T IUD: Paragard

  • Available to women since the 1970s, copper-T IUDs are the most effective forms of EC, reducing the risk of pregnancy by more than 99% when inserted within 5 days of unprotected intercourse. IUDs are inserted into the uterus by a health care provider and require a visit to a clinic or provider’s office. They also can be used to effectively prevent subsequent pregnancy for up to 10 years.
  • The hormone-free copper-T IUD works by interfering with egg fertilization by preventing sperm from reaching the egg. Previous research suggests the copper IUD inhibits implantation of a fertilized egg, but this mechanism of action has not been conclusively proven.
  • Efficacy of copper IUDs does not diminish in women who are overweight or obese.

Levonorgestrel IUD: Mirena and Liletta

  • Levonorgestrel IUDs are a type of hormonal IUD that contain the progestin levonorgestrel. To date, only levonorgestrel IUDs that contain 52 mg of levonorgestrel (LNG 52 mg IUDs) have been studied as a form of EC. LNG 52 mg IUDs are marketed under the brand names Mirena and Liletta.
  • Like copper-T IUDs, LNG IUDs are inserted into the uterus by a clinician and require a visit to a clinic. LNG IUDs can subsequently be used as a regular form of contraception for up to seven years.
  • Levonorgestrel IUDs recently started being used as a method of EC, and research has found that LNG 52 mg IUDs can be as effective as copper-T IUDs when inserted within five days after unprotected intercourse or contraceptive failure. The hormonal IUD prevents egg fertilization by making the cervical mucus impenetrable to sperm.
  • Efficacy of levonorgestrel IUDs does not diminish in women who are overweight or obese.

Women’s Use of EC Pills

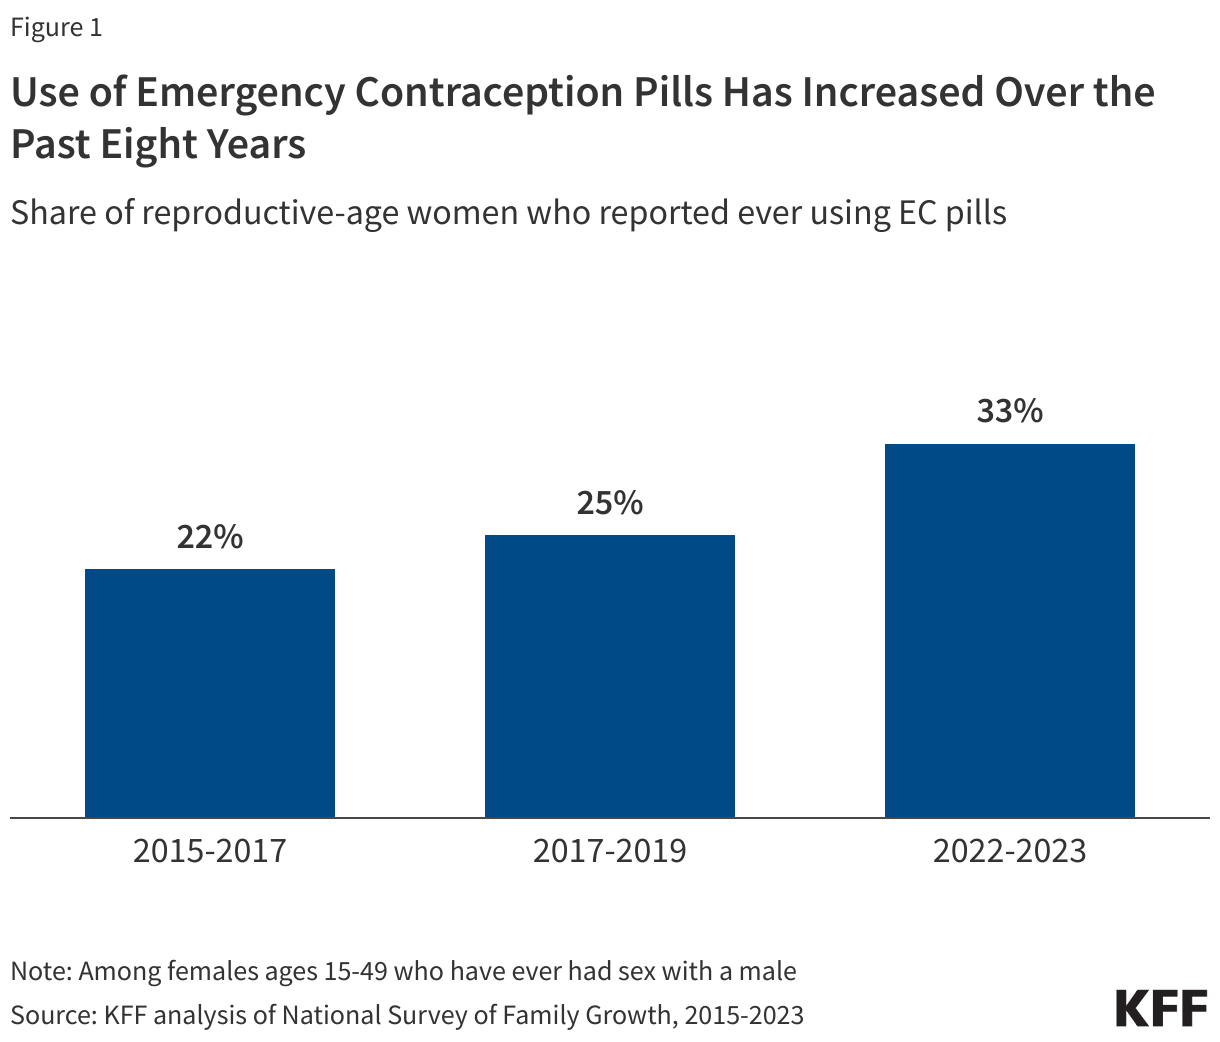
There have been numerous public health and educational initiatives to increase use of EC. Use of EC pills has increased over the past 20 years. Between 2022 and 2023, the most recent years for which data are currently available, 33% of women ages 15 to 49 who have ever had sex with a male reported they had used EC pills at least once in their lives, an increase from 22% in 2015-2017 (Figure 1).

Use of Emergency Contraception Pills Has Increased Over the Past Eight Years

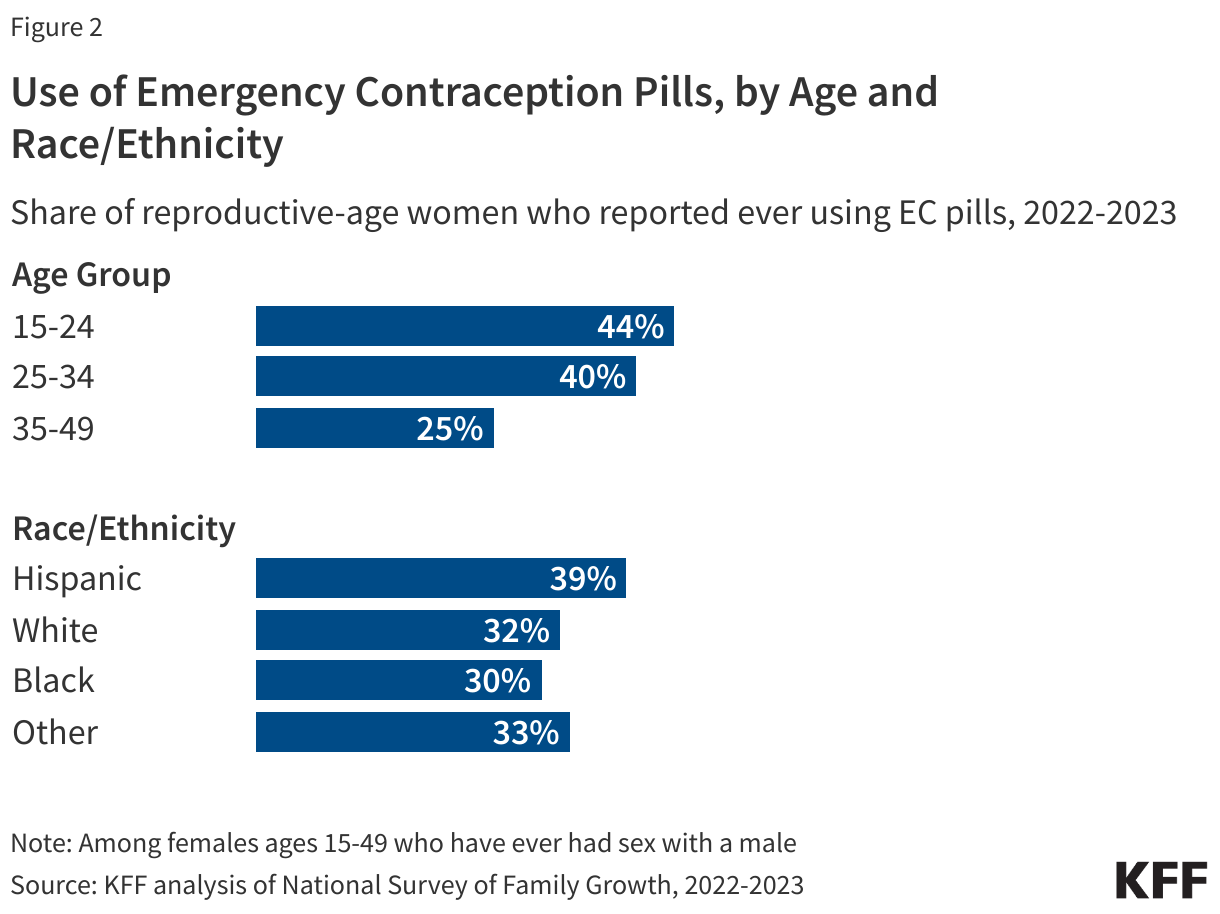
Younger women are more likely to report that they have ever used EC (Figure 2). More than four in ten women ages 15-24 (44%) and women ages 25-34 (40%) say they have taken EC pills, compared to 25% of women ages 35-49. One in four Hispanic women (40%) and approximately one in three Black and White women (30% and 33%, respectively) report ever taking EC.

Use of Emergency Contraception Pills, by Age and Race/Ethnicity

Access and Availability

At least one form of oral EC has been available in the U.S. for over a decade and there have been several efforts to broaden women’s access to EC, particularly since its effectiveness window is time-limited.

Over the Counter Access of EC Pills

  • Prior to 2006, a prescription was needed for all individuals seeking EC pills. Between 2006 and February 2014, Plan B and its generic equivalent were available without a prescription for men and women 17 and older, but adolescents under 17 needed a prescription.
  • In 2014, the FDA removed point-of-sale age requirements for Plan B obtained over the counter (OTC) and generic versions began to enter the OTC market. Currently, several generic brands of EC pills, including Next Choice One Dose, My Way, Fall Back Solo, Take Action, levonorgestrel tablet, and Aftera are available OTC to women of all ages.
  • A prescription is still required for ella for women of all ages.

Cost and Coverage

  • The Affordable Care Act (ACA) requires most new private health plans (individual and group) to cover without cost-sharing all FDA-approved contraceptive drugs and devices as prescribed, including emergency contraception. This means that although OTC formulations are available without a prescription, the pills are only required to be covered by insurance if they were prescribed. Private insurance plans must also cover the cost of IUDs, as well as services related to insertion, follow up and removal, without cost sharing. However, there have been numerous reports of individuals having to pay out-of-pocket for contraception that they believe should have been fully covered, including for services related to the insertion and removal of IUDs.
  • Seven states require private health insurance plans to cover some over-the-counter contraceptives, without any cost-sharing, including EC. For employer-sponsored plans, state coverage requirements generally apply only to fully-insured plans and not to self-funded plans.
  • Family planning services are a required benefit under Medicaid. The coverage requirements under Medicaid are different for states that have expanded eligibility under the ACA. These programs must cover all prescribed, FDA-approved contraceptives, meaning that they must cover EC pills if a woman has a prescription. States have discretion in deciding whether they include EC in their traditional full-scope Medicaid programs or family planning expansion programs. A 2021 survey of state Medicaid programs found that while all responding states cover at least one form of EC in their traditional Medicaid programs, some states impose quantity limits. To increase access to contraception, eight states have opted to use state-only funds to cover at least some methods of OTC contraception for their Medicaid enrollees, primarily emergency contraception, without a prescription.
  • Without a prescription or insurance, women in most states accessing EC OTC must pay the retail price. Plan B pills and the generic versions average can range from $10 to $50 when purchased OTC. Without insurance, the cost of IUDs can range from $500 to $1,300.
  • Individuals without health insurance or who are ineligible for Medicaid may be able to obtain free or low-cost EC (in addition to other reproductive health care services) through a clinic or community health center participating in the federal Title X family planning program. The Title X program may also be an option for lower-income individuals covered by employer-sponsored health insurance plans that are not required to cover contraception because they existed prior to the ACA (known as “grandfathered” plans) or because their employer excludes coverage of emergency contraception based on a religious or moral objection to it. Regardless of the pathway, eligibility for the program is based on the individual’s household income and costs are based on a sliding fee scale.

Online Contraceptive Platforms

  • New markets have emerged, particularly since the start of the COVID-19 pandemic, that allow people to obtain health care services without the need for an in-person visit, including several online reproductive health services platforms and smartphone apps where an individual can obtain hormonal contraceptives, including EC pills, outside of traditional health care settings. A 2023 KFF study on telecontraception found that 9% of survey respondents report getting a prescription for emergency contraception.
  • These online platforms and apps typically employ licensed medical professionals to determine a client’s eligibility and to prescribe contraception in a similar manner to a clinic. The patient is then either mailed their contraceptives or their prescription is sent to a nearby pharmacy for pick-up.
  • Some, but not all, of these platforms accept private insurance and/or Medicaid, and there is considerable variation in out-of-pocket costs for those who self-pay.

Provision of EC in Health Care Settings

  • Several major medical and public health organizations, such as the American Academy of Pediatrics, American College of Obstetricians and Gynecologists, and the American Public Health Association, endorse the use of EC and advocate for broader access to EC.
  • Counseling and coverage of EC is included as a standard of care in the federal requirements for providing Quality Family Planning Services (QFP). Providers are encouraged to discuss EC with their patients, inform them of its availability, and provide them with an advanced supply of EC pills if the patient requests them. Advance provision of EC can increase the chances that someone will have EC on hand and use it when needed, but research has found that few clinicians regularly provide advance provision of EC pills.
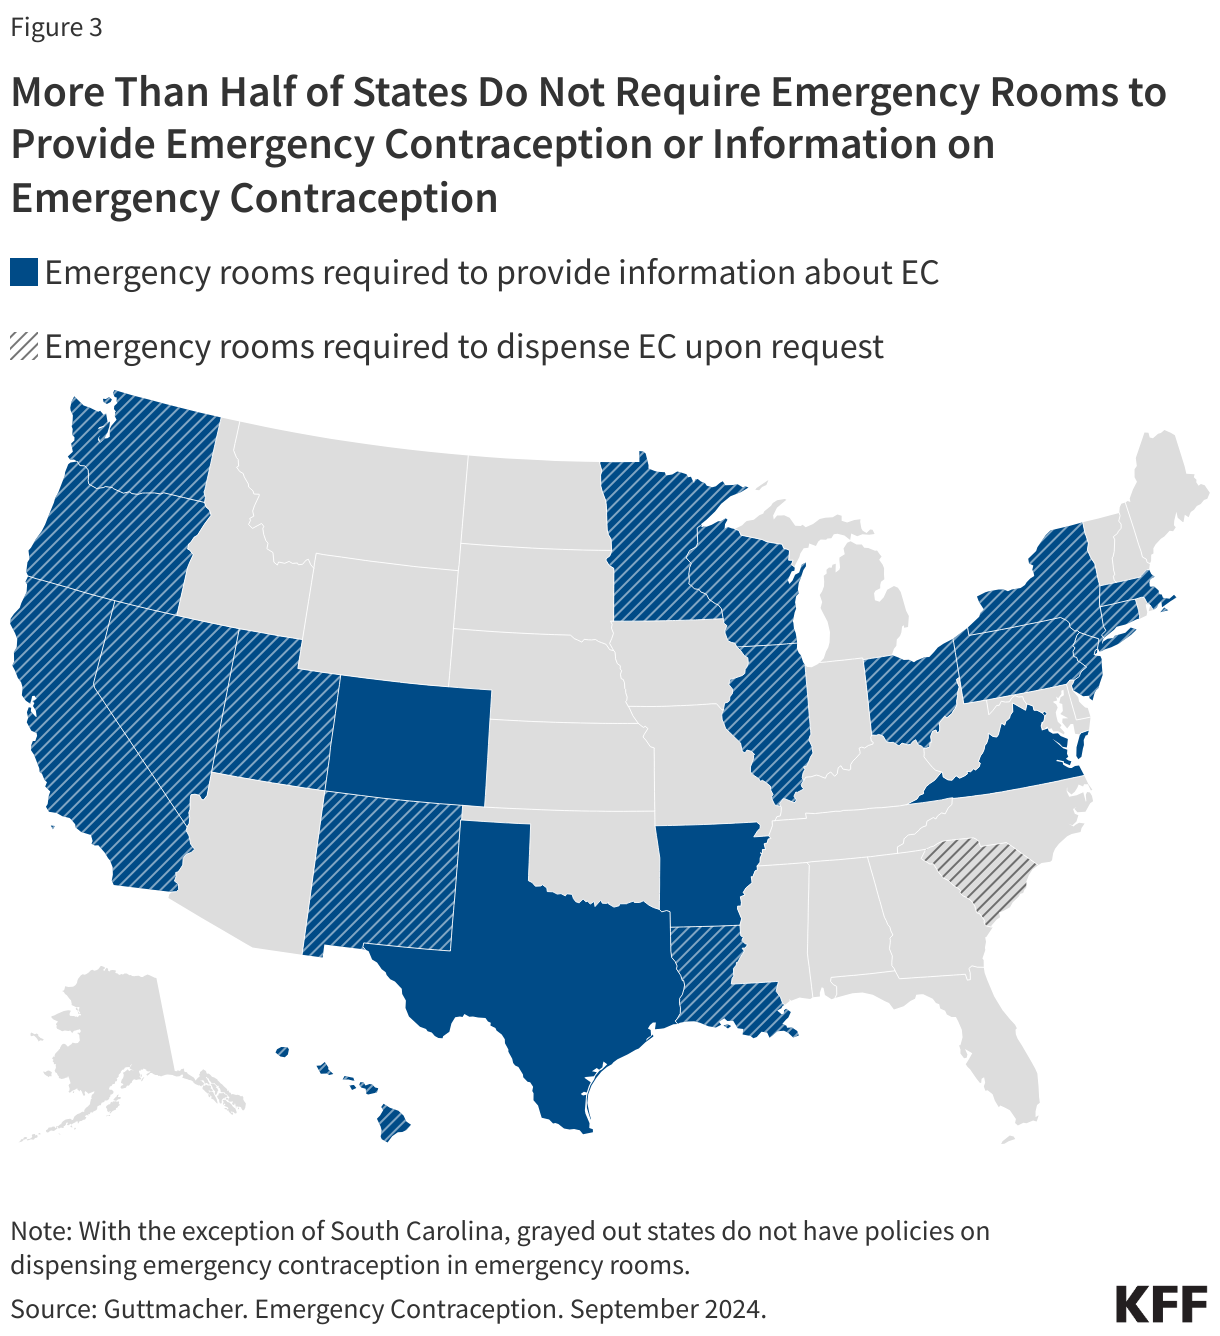
  • There have been ongoing efforts to make EC more readily available to survivors of sexual assault. Currently, 21 states and the District of Columbia require that emergency room staff provide EC to women after sexual assault (Figure 3). However, some studies have documented that a sizable share of clinicians are not fully informed about EC options, safety, and efficacy. Additionally, some community health centers have reported challenges stocking IUDs due to high costs.
  • In 2015, Indian Health Service (IHS) clarified its policy on access to the OC pill for Native American women, including that a prescription or age verification to access Plan B is not required.
More Than Half of States Do Not Require Emergency Rooms to Provide Emergency Contraception or Information on Emergency Contraception

Availability and Access in Pharmacies

  • Nine states have laws that allow pharmacists to directly prescribe and dispense EC to women of all ages without obtaining a clinician’s prescription.
  • Four states have measures that require pharmacies or pharmacists to fill all valid prescriptions. These policies have been enacted, in part, in response to reports of pharmacists refusing to fill prescriptions for EC pills because they oppose its use on moral or religious grounds.
  • Ten states have laws allowing pharmacies or pharmacists to refuse to dispense EC pills on the basis of moral or religious objections.
  • Pharmacies are not required to stock EC pills and some studies show that EC pills that may be sold OTC are not consistently stocked on store shelves and are sometimes kept behind the counter or in a locked display due to the high cost of the product. This report also documented misinformation regrading age and ID requirements among pharmacy staff and consumers.
Poll Finding

KFF Tracking Poll on Health Information and Trust: January 2025

Published: Jan 28, 2025

Findings

Key Takeaways

  • As Senate committee hearings begin for President Donald Trump’s nominees for key health positions, the latest KFF Tracking Poll on Health Information and Trust finds that public trust in government health agencies has fallen over the past 18 months, continuing a decline that began during the COVID-19 pandemic. The share who says they trust the U.S. Centers for Disease Control (CDC) “a great deal” or “a fair amount” to make the right recommendations on health dropped slightly from 66% in June 2023 to 61% now, while trust in the U.S. Food and Drug Administration (FDA) and state and local public health officials each dropped by double digits (from 65% to 53% and 64% to 54%, respectively). Individual doctors remain the most trusted source of health information, although the share saying they trust their own doctor “a great deal” or “a fair amount” to make the right health recommendations also declined from 93% to 85% over the same period.
  • Partisan differences in trust in government health agencies that emerged during the pandemic remain, as Democrats are about 30 percentage points more likely than Republicans to say they trust the U.S. Department of Health and Human Services (HHS) to make the right recommendations on health (73% vs. 42%), with similar partisan gaps in trust for agencies that fall under HHS including CDC, the FDA, the Centers for Medicare and Medicaid Services (CMS), and scientists working for the National Institutes of Health (NIH). The opposite pattern is true when it comes to trust in President Trump’s picks to run some of those agencies. Overall, about four in ten say they trust President Trump (42%), Robert F. Kennedy, Jr. (43%), and Dr. Mehmet Oz (43%) “a great deal” or “a fair amount” to make the right recommendations when it comes to health. This includes few Democrats (7%, 7%, and 14% respectively) compared to about eight in ten Republicans. In fact, similar shares of Republicans say they trust President Trump (84%), Dr. Oz (83%), and RFK Jr. (81%) as say they trust their own doctors (84%) to make the right recommendations on health issues.
  • While large shares of the public continue to express positive attitudes toward childhood vaccines and school vaccination requirements, some trends suggest the level of support may be eroding somewhat among Republicans and parents. About eight in ten (82%) parents say they normally keep their children up to date with recommended childhood vaccines like the MMR, while about one in six (17%) report delaying or skipping some shots, up from 10% in 2023. The change is most pronounced among Republican and Republican-leaning parents, about one in four (26%) of whom now report skipping or delaying some vaccines for their children, up from 13% in 2023.
  • The false claim that the MMR vaccines have been proven to cause autism continues to persist, with most adults – including parents – falling in the “malleable middle,” expressing some level of uncertainty about whether this claim is true or false. Parents who believe or are open to believing the falsehood that the MMR vaccines have been proven to cause autism are about four times more likely as those who say this myth is “definitely” or “probably false” to report delaying or skipping vaccines for their children (37% vs. 8%).
  • Despite some shifts in overall vaccine attitudes, the latest KFF Tracking Poll on Health Information and Trust finds strong support for public school vaccine requirements. Eight in ten (83%) U.S. adults say public schools should require some vaccines for students, allowing for health and religious exceptions, including large majorities of Democrats (93%), independents (85%), and Republicans (75%). At the same time, much of the public is confused about the federal government’s role in school vaccine requirements, with about a third correctly answering that the federal government makes recommendations for which vaccines schools should require. The remainder either incorrectly believe the federal government sets these requirements or say they are not sure.
  • Beyond childhood vaccines, myths about COVID-19 vaccines continue to persist and may be becoming entrenched among some Republicans. Four in ten Republicans now say it is “probably” or “definitely true” that “more people have died from COVID-19 vaccines than from the virus itself,” up from one quarter in 2023. In fact, the COVID-19 vaccine has been estimated to have prevented millions of hospitalizations and deaths in the U.S. alone.
  • When asked about the H5N1 bird flu in the U.S., most adults are not concerned about themselves or a family member getting sick, though 44% are “very” or “somewhat concerned” there will be a widespread outbreak in the U.S. Looking toward the future, four in ten adults say that compared to 2020, the U.S. government is now more prepared to deal with another pandemic or widespread health crisis, while about one in four (26%) say the U.S. is less prepared, and one-third (34%) say it is just as prepared as it was. Similar shares of adults across partisanship, age, race, and ethnicity say the government is more prepared than it was before.

Public Trust in Key Health Agencies Has Declined

At the start of President Trump’s second presidential term, the public is divided along partisan lines in their trust in key government health agencies. Over the past several months, President Trump and his political allies have publicly challenged these health-related agencies and discussed cutting some of their funding as part of an effort aimed at increasing government efficiency.

Trust in U.S. government health agencies declined during the COVID-19 pandemic, most notably following the rollout of the COVID-19 vaccines. KFF tracking polls between 2020 and 2022 showed declining trust, especially among Republicans, in the U.S. Centers for Disease Control (CDC), the U.S. Food and Drug Administration (FDA), local public health departments, and Dr. Anthony Fauci as sources of reliable information on COVID-19 and the vaccines. The latest KFF Tracking Poll on Health Information and Trust finds that when it comes to health information more generally, trust in the FDA, CDC, and state and local public health officials remains partisan and has continued to decline. The share who says they trust the CDC “a great deal” or “fair amount” has fallen slightly overall (from 66% in June 2023 to 61% in the latest poll), driven by a nine-percentage point drop among Republicans (from 48% to 39%). The public’s trust of the FDA to make the right recommendations on health has also fallen (from 65% to 53%), as has trust in state and local public health officials (from 64% to 54%), including similar decreases among Republicans, Democrats, and independents.

While large shares of adults continue to trust their own doctors to make the right recommendations when it comes to health issues, this share also decreased from June 2023 by eight percentage points overall (from 93% to 85%), driven by a drop among Republicans (from 94% to 84%) and independents (93% to 84%). Doctors continue to be the most trusted source of health information, but this decrease in trust may reflect a trend of declining trust in professions across industries.

Dot plot showing the share of people who say they have a great or fair amount of trust in the CDC, their state and local public health officials, and their doctor in June 2023 and January 2025. Results for each shown by total and party.

Despite some declining trust in government health agencies, two-thirds of adults say they trust scientists at the National Institutes of Health (NIH) (66%) to make the right recommendations on health, and about six in ten trust the CDC (61%). Slightly more than half say they trust the U.S. Department of Health and Human Services (HHS) (55%), the Centers for Medicare and Medicaid Services (CMS) (54%), their state and local public health officials (54%), and the FDA (53%) when it comes to health recommendations. Fewer – about four in ten – say they trust President Trump (42%) and his choices for key health-related positions, including Robert F. Kennedy, Jr., the nominee for Secretary of HHS (43%), and Dr. Mehmet Oz, President Trump’s choice to lead CMS (43%).

Notably, fewer than one in four U.S. adults say they trust any of these government agencies or individuals “a great deal” when it comes to making health recommendations.

Stacked bar chart showing percent who say they trust their doctor, NIH, CDC, HHS, CMS, the FDA, their public health officials, RFK Jr., Dr. Oz, and President Trump a great deal, a fair amount, not much, or not at all when it comes to making the right recommendations about health issues.

Apart from individual doctors, who garner trust from a large majority of Democrats, independents, and Republicans, there are stark partisan differences in trust in government agencies and individuals on health issues. Democrats are much more likely than Republicans to express trust in government institutions and federal agencies, including HHS (73% vs 42%), CMS (75% vs 38%), CDC (85% vs. 39%), and the FDA (71% vs. 39%). On the other hand, much larger shares of Republicans compared to Democrats say they trust President Trump and his health care nominees to oversee these agencies. While few Democrats trust President Trump or his nominees, similar shares of Republicans say they trust President Trump (84%), Dr. Oz (83%), and RFK Jr. (81%) as the shares that say they trust their own doctors (84%) to make the right recommendations on health issues.

Split bar chart showing percent who say they trust  their doctor, NIH, CDC, HHS, CMS, the FDA, their public health officials, RFK Jr., Dr. Oz, and President Trump a great deal or a fair amount when it comes to making the right recommendations about health issues broken down by total and party identification.

Shifting Attitudes Toward Childhood Vaccines, Particularly Among Republican Parents

While large shares of the public continue to express positive attitudes toward childhood vaccines and school vaccination requirements, some trends in the latest KFF Tracking Poll on Health Information and Trust suggest that support may be eroding somewhat among Republicans and parents. In the latest poll, about eight in ten (82%) parents say they normally keep their child up to date with recommended childhood vaccines like the MMR, while about one in six (17%) report delaying or skipping some shots. This marks a slight change from KFF polls fielded from 2021 to 2023, when about nine in ten parents consistently reported staying on schedule. The share of parents who report skipping or delaying some vaccines has increased by seven percentage points since September 2023, driven largely by Republican-leaning parents. Now, about one in four (26%) Republican and Republican-leaning parents report vaccine delays for their children, about twice the 13% who said the same in 2023. The rise in reported vaccination delays among Republican parents mirrors a growing partisan divide on attitudes toward childhood vaccinations among the general public, and is consistent with a KFF analysis of data from the CDC that found that parents are increasingly seeking non-medical exemptions from school vaccine requirements.

A line chart showing the trend from 2021 through 2025 of the share of parents, democratic parents, and republican parents who say they normally keep their children up to date on vaccinations and the percent who say they have ever skipped or delayed childhood vaccines for their children.

Most of the public continues to believe that the benefits of childhood vaccines for measles, mumps, and rubella (MMR) outweigh the risks, though this share has declined since 2019. Currently, eight in ten adults say, “The benefits of childhood vaccines for measles, mumps, and rubella (MMR) outweigh the risks,” while about one in five (18%) say the risks of these vaccines “outweigh the benefits.”

While large shares of adults continue to say the benefits outweigh the risks, there has been a widening partisan gap on this question. Consistently since 2019, about nine in ten Democrats and Democratic-leaning independents say the benefits of MMR vaccines outweigh the risks, while Republicans and Republican-leaning independents are now 15 percentage points less likely than in 2019 to share this view (74% now vs. 89% in 2019).

Line chart showing trend from 2019 to 2025 of the percent among total and party identification that say the benefits of childhood vaccines for MMR outweigh the risks or say the risks of childhood vaccines for MMR outweigh the benefits.

Among parents of children under age 18, the large majority say the benefits of the MMR vaccine outweigh the risks, but one in four now say the risks outweigh the benefits, up from 17% in 2022. Like the public overall, parents are divided along partisan lines when weighing the risks and benefits of childhood vaccines. Republican and Republican-leaning parents are about twice as likely as Democratic and Democratic-leaning parents to say, “the risks of childhood vaccines for MMR outweigh the benefits” (15% vs. 33%).

Bar chart showing trend by total parents and parents by party identification for the percent who say the benefits of childhood vaccines for MMR outweigh the risks vs. the share who say the risks outweigh the benefits.

Most Parents are Uncertain About MMR Autism Myth

Amid shifting attitudes toward childhood vaccines, many adults – including parents – continue to report hearing myths that MMR vaccines are linked to autism, and many are uncertain about whether to believe this false claim. About two-thirds (63%) of adults overall and parents (67%) say they have heard the false claim that the MMR vaccines have been proven to cause autism in children, a claim that began with a since-retracted study in the 1990s and has recently been associated with Robert F. Kennedy, Jr. The share reporting they have heard this claim remains unchanged since 2023.

As previous KFF polls have found when it comes to health misinformation on a range of topics, many adults fall in the “malleable middle,” expressing some level of uncertainty about this false health claim. Just three percent of adults say it is “definitely true” that the MMR vaccines have been proven to cause autism in children. A larger share (20%) is open to believing the myth, saying it is “probably true,” while many lean toward the correct answer but still express uncertainty, saying the claim is “probably false” (41%). One-third of adults say it is “definitely false.” Most Republicans and independents fall into this malleable middle category, with substantial shares saying the claim is “probably false,” while half of Democrats say this claim is “definitely false.” Notably, just about one in ten parents who identify or lean Republican (11%) say this claim is “definitely false.”

Bar chart showing the percent of U.S. adults who think the false claim that MMR vaccines have been proven to cause autism in children is true.

Belief in the myth that the MMR vaccine causes autism is correlated with parents’ decisions about their children’s vaccinations. Among parents who say it is “probably” or “definitely” true that the MMR vaccines have been proven to cause autism, nearly four in ten (37%) say they have delayed or skipped some childhood vaccines for their children, compared to just eight percent of parents who say this myth is “probably” or “definitely” false.

Bar chart showing the percent of parents who keep their child up to date on childhood vaccines among those who think the false claim that the MMR vaccines cause childhood autism is true or false.

COVID-19 Vaccine Myths Persist

In the five years since the start of the COVID-19 pandemic, myths related to the virus and the vaccine persist. First explored in the KFF Health Misinformation Tracking Poll, myths related to COVID-19 are widespread, and many adults are not confident in assessing their validity. The latest poll finds that nearly half (46%) of adults report hearing the falsehood that “more people have died from the COVID-19 vaccines than have died from the COVID-19 virus.” This share has increased slightly from about four in ten (41%) in 2023, driven by a large increase among Republicans. About half (52%) of Republicans say they have heard or read this false claim, up from about one in three (35%) in June 2023. Slightly more than four in ten Democrats reported hearing this myth in each poll.

Dot plot showing the share of people who say they have heard or read the false claim that more people have died from the COVID-19 vaccine than the virus itself in June 2023 and January 2025. Results for each shown by total and party.

Few adults (8%) say the false claim that “more people have died from COVID-19 vaccines than have died from the COVID-19 virus” is “definitely true,” but levels of certainty vary widely by partisanship, and an increasing share of Republicans is open to endorsing this false claim. About four in ten adults (43%) recognize this claim as “definitely false,” including one in five Republicans (20%) and more than three times as many Democrats (65%). While most Republicans lean toward this claim being false, four in ten say it is “definitely true” (13%) or “probably true” (27%), an increase from one in four in June 2023, when 7% of Republicans said this was “definitely true” and 18% said it was “probably true.”

Bar chart showing the percent of U.S. adults who think the false claim that more people have died from COVID-19 vaccines than from the virus itself is true or false.

Views of School Vaccine Requirements

Despite some shifts in overall vaccine attitudes, the latest KFF Tracking Poll on Health Information and Trust finds strong support for public school vaccine requirements. Eight in ten (83%) U.S. adults say public schools should require some vaccines for students, allowing for health and religious exceptions, including large majorities of Democrats (93%), independents (85%) and Republicans (75%). One in six adults say public schools should not require any vaccinations, rising to one in four Republicans. Like the general public, parents are divided on this issue along partisan lines. Three in four (75%) parents overall say public schools should have some vaccine requirements, while one in four say public schools should not have any vaccine requirements, rising to one in three Republican or Republican-leaning parents (34%). The vast majority of Democratic-leaning parents (93%) say public schools should require some vaccines.

Although President Trump said on the campaign trail that he would cut federal funding to schools with vaccine mandates, a previously released report from this KFF survey found that few adults across partisans say this should be a priority for the Trump administration.

Bar chart showing the percent who think public schools should require some vaccines for students, allowing for health and religious exceptions or not require any vaccines for students by total, party ID, parent status, and parents by party.

The Role of the Federal Government in School Vaccine Requirements

Despite strong support for school vaccine mandates, there are gaps in what the public understands about the role of the federal government in this arena. The public is split, with about one-third of adults aware the federal government makes recommendations for which vaccines school-age children should receive (36%), one-third incorrectly saying that the federal government currently sets requirements for which vaccines school-age children get (35%), and about three in ten unsure (28%). Parents and adults across partisans are similarly divided in their knowledge of the federal government’s role in providing vaccine recommendations for children.

Stacked bar chart showing the share who correctly say the federal government makes recommendations for which vaccines school-age children should get vs. the share who say the federal government makes requirements for vaccines among total, parents, and party ID.

While many are unsure about the federal government’s role in vaccine recommendations, a large majority of the public trust the CDC “a great deal” (30%) or “a fair amount” (39%) to make recommendations about childhood vaccines. As is the case with trust in government health agencies generally, partisans differ in how much they trust the CDC to make these recommendations, with nearly nine in ten Democrats saying they trust the CDC “a great deal” or “a fair amount” (87%) in this area, compared to just over half (54%) of Republicans.

Bar chart that shows trust in the CDC to make recommendations about childhood vaccine schedules by total, parent status, and party ID.

Pandemic Preparedness and Avian Flu

The COVID-19 pandemic illustrated the challenges that can arise when public health agencies are required to communicate rapidly evolving scientific information to a sometimes-skeptical public. Declining trust in government and health agencies, a trend that began during the COVID-19 pandemic and that this poll indicates is continuing today, suggests that these communication challenges are likely to continue and perhaps intensify the next time the U.S. is faced with a pandemic or widespread health crisis. Despite declining trust, larger shares of the public across partisans say the government is more prepared rather than less prepared for another pandemic than it was five years ago. Four in ten adults say that compared to 2020, the U.S. government is now more prepared to deal with another pandemic or widespread health crisis, while about one in four (26%) say the U.S. is less prepared and one-third (34%) say it is just as prepared as it was. Similar shares of adults across partisanship, age, race, and ethnicity say the government is more prepared than it was before.

Stacked bar chart showing what share think, compared to 2020, the U.S. government is now more prepared, less prepared, or just as prepared to deal with another pandemic or widespread health crisis by total and party ID.

Since the spring of 2024, H5N1 avian influenza has impacted people and animals in the U.S. and Canada. At the time of this survey, CDC indicated the current public health risk of bird flu is low. Although there have been some cases of people infected with bird flu, there has yet to be human-to-human transmission. As of early January 2025, about half (49%) of the public has heard at least “some” about recent human cases of bird flu in the U.S., including one in ten (11%) who has heard “a lot.” One-third (33%) of adults has heard “a little” and one in five (18%) has heard “nothing at all.” Awareness is low across most demographic groups, though Democrats and those ages 65 and over are among those most likely to say they’ve heard “a lot” (15% and 17%, respectively).

Forty-four percent of U.S. adults are “very” or “somewhat concerned” that there will be a widespread outbreak of bird flu in the U.S., while fewer (34%) say they are concerned that they or a family member will get sick. While most adults are not concerned about bird flu, majorities of Hispanic adults (64%), Democrats (58%), and adults in lower income households (54%) express concern about a widespread outbreak of bird flu. Each of these groups is also more likely than their counterparts to be concerned that they and their families will get sick.

Stacked bar chart showing the percent who say they are worried that they or someone in their family will get sick from the bird flu and worried that there will be a widespread outbreak of the bird flu in the U.S. by total, party ID, race/ethnicity, and income.

Methodology

This KFF Tracking Poll on Health Information and Trust was designed and analyzed by public opinion researchers at KFF. The survey was conducted January 7-14, 2025, online and by telephone among a nationally representative sample of 1,310 U.S. adults in English (1,233) and in Spanish (77). The sample includes 1,024 adults (n=48 in Spanish) reached through the SSRS Opinion Panel either online (n=999) or over the phone (n=25). The SSRS Opinion Panel is a nationally representative probability-based panel where panel members are recruited randomly in one of two ways: (a) Through invitations mailed to respondents randomly sampled from an Address-Based Sample (ABS) provided by Marketing Systems Groups (MSG) through the U.S. Postal Service’s Computerized Delivery Sequence (CDS); (b) from a dual-frame random digit dial (RDD) sample provided by MSG. For the online panel component, invitations were sent to panel members by email followed by up to three reminder emails.

Another 286 (n=29 in Spanish) interviews were conducted from a random digit dial telephone sample of prepaid cell phone numbers obtained through MSG. Phone numbers used for the prepaid cell phone component were randomly generated from a cell phone sampling frame with disproportionate stratification aimed at reaching Hispanic and non-Hispanic Black respondents. Stratification was based on incidence of the race/ethnicity groups within each frame.

Respondents in the phone samples received a $15 incentive via a check received by mail. SSRS Opinion panelists who completed the survey by phone were offered $10 via a mailed check and those who completed online received $5 via e-gift card. In order to ensure data quality, cases were removed if they failed two or more quality checks: (1) attention check questions in the online version of the questionnaire, (2) had over 30% item non-response, or (3) had a length less than one quarter of the mean length by mode. Based on this criterion, no cases were removed.

The combined cell phone and panel samples were weighted to match the sample’s demographics to the national U.S. adult population using data from the Census Bureau’s 2024 Current Population Survey (CPS), September 2023 Volunteering and Civic Life Supplement data from the CPS, and the 2024 KFF Benchmarking Survey with ABS and prepaid cell phone samples. The demographic variables included in weighting for the general population sample are sex, age, education, race/ethnicity, region, civic engagement, frequency of internet use, political party identification by race/ethnicity, and education. The weights account for differences in the probability of selection for each sample type (prepaid cell phone and panel). This includes adjustment for the sample design and geographic stratification of the cell phone sample, within household probability of selection, and the design of the panel-recruitment procedure.

The margin of sampling error including the design effect for the full sample is plus or minus 3 percentage points. Numbers of respondents and margins of sampling error for key subgroups are shown in the table below. For results based on other subgroups, the margin of sampling error may be higher. Sample sizes and margins of sampling error for other subgroups are available by request. Sampling error is only one of many potential sources of error and there may be other unmeasured error in this or any other public opinion poll. KFF public opinion and survey research is a charter member of the Transparency Initiative of the American Association for Public Opinion Research.

GroupN (unweighted)M.O.S.E.
Total1,310± 3 percentage points
Party ID
Democrats403± 6 percentage points
Independents383± 6 percentage points
Republicans383± 6 percentage points
Parents or guardians of a child under 18 years old396± 6 percentage points


News Release

Poll: Trust in Public Health Agencies and Vaccines Falls Amid Republican Skepticism

Share of Parents Who Say They Keep Their Children Up to Date on Their Vaccines Falls; 1 in 4 Republicans Parents Now Say They’ve Skipped or Delayed Some Childhood Vaccines

Published: Jan 28, 2025

As President Trump begins his second term, the public’s trust in health information from key health agencies has fallen over the past 18 months, continuing a decline that began during the COVID-19 pandemic, finds the new KFF Tracking Poll on Health Information and Trust. 

Just over half (53%) of the public now says they trust the Food and Drug Administration (FDA) to make the right recommendations on health issues at least “a fair amount,” down from nearly two-thirds (65%) in June 2023. The share who says they trust their state and local public health officials fell a similar amount (to 54% now from 64% in 2023). Trust in health recommendations from the Centers for Disease Control and Prevention (CDC) also dipped slightly from 66% in 2023 to 61% now. 

When asked about other health institutions, two-thirds (66%) of the public say they trust scientists at the National Institutes of Health, and just over half trust the Department of Health and Human Services (HHS) (55%) and the Centers for Medicare and Medicaid Services (CMS) (54%) to make the right recommendations on health issues. 

Republicans are far less trustful of each of these health institutions than Democrats, with independents in the middle.

An even larger partisan divide in the opposite direction exists in trust in health information from President Trump and Robert F. Kennedy Jr., his nominee to be HHS Secretary.

Less than half the public overall trust President Trump (42%) and Kennedy (43%) to make the right recommendations on health issues. Among Republicans, however, similar shares say they trust President Trump (84%) and Kennedy (81%) as say they trust their own doctors (84%). 

The public overall continues to place the most trust in their own doctors, though the share who say they trust their own doctors’ health recommendations “a great deal” or “a fair amount” is down from 93% in 2023 to 85% now, mostly due to declining trust among independents and Republicans.

Attitudes Toward Childhood Vaccines Remain Positive, Though Eroding Among Republicans

While large shares of the public continue to express positive attitudes toward childhood vaccines and school vaccination requirements, the poll reveals some erosion in support among Republicans and parents.

About eight in ten (82%) parents of children under age 18 now say they normally keep their child up to date with recommended childhood vaccines such as the one for measles, mumps, and rubella (MMR), down 8 percentage points from 2023.

About one in six (17%) now report delaying or skipping some shots, up from 10% in 2023. The shift is most pronounced among Republican parents: About one in four (26%) now report skipping or delaying some vaccines for their children, up from 13% in 2023.

A large majority of the public continues to believe that the benefits of the MMR vaccines outweigh the risks (80%), while about one in five (18%) say that the risks outweigh the benefits. Among parents, about seven in 10 (72%) say the vaccines’ benefits outweigh the risks, while a quarter (25%) say the risks outweigh the benefits. Republican-leaning parents are twice as likely as Democratic-leaning parents to say that the vaccines’ risks outweigh the benefits (33% vs. 15%), though large majorities of each group continue to say the benefits outweigh the risks.During his campaign, President Trump had vowed to cut federal funding to schools with vaccine mandates, though the poll suggests large majorities of the public and of parents across political parties support such requirements.

Among the public overall, 83% say public schools should require some vaccines for students, allowing for health and religious exceptions. This includes large majorities of Democrats (93%), independents (85%) and Republicans (75%).

Among parents, three-quarters (76%) say public schools should require vaccines, while one in four (24%) say they should not. Two-thirds (66%) of Republican and Republican-leaning parents favor schools requiring vaccines, while a third (34%) say that schools should not require any vaccines.

Other findings include:

  • About two-thirds (63%) of adults overall and parents (67%) say they have heard the false claim that the MMR vaccines have been proven to cause autism in children. Just 3% of adults say this false claim is “definitely true.” One-third (33%) say it is “definitely false.” The rest are somewhat uncertain what to believe, saying the claim is either “probably true” (20%) or “probably false” (41%).
  • Parents who say that the false claim that MMR vaccines are proven to cause autism is definitely or probably true are much more likely to say they have delayed or skipped some vaccines for their children than parents who say it definitely or probably false (37% and 8%, respectively).
  • When asked about the H5N1 bird flu in the U.S., about one in three (34%) say they are “very” or “somewhat” concerned that they or a family member will get sick. About four in 10 (44%) say they are “very” or “somewhat concerned” that there will be a widespread outbreak in the U.S.
  • Looking toward the future, a larger share of adults say the U.S. government is now more prepared (40%) rather than less prepared (26%) to deal with a pandemic or widespread health crisis than it was in 2020. Similar shares of adults across partisanship, age, race, and ethnicity say the government is more prepared than it was before.

Designed and analyzed by public opinion researchers at KFF, the survey was conducted Jan. 7-14, 2025, online and by telephone, among a nationally representative sample of 1,310 U.S. adults in English and in Spanish. The margin of sampling error is plus or minus 3 percentage points for the full sample. For results based on other subgroups, the margin of sampling error may be higher.

News Release

HealthCare.gov Insurers Denied Nearly 1 in 5 In-Network Claims in 2023, but Information About Reasons is Limited in Public Data

Enrollees Rarely Appeal Claims Denials; When They Do, Insurers Often Uphold the Original Denial

Published: Jan 27, 2025

HealthCare.gov insurers denied nearly one out of every five claims (19%) submitted for in-network services and an even larger share (37%) share of claims for out-of-network services in 2023, a new KFF analysis finds.

The analysis examines the main source of publicly available data on claims denials and appeals for individual-market plans available through the federal HealthCare.gov marketplace. The Affordable Care Act requires certain entities to report data about claims denials and appeals to encourage transparency about how insurance coverage works for enrollees. The publicly available data does not include marketplace plans sold on state-based marketplaces or employer health plans, the nation’s primary source of private health coverage.

The analysis finds a huge variation across HealthCare.gov insurers, which had in-network denial rates as low as 1% and as high as 54% in 2023 in some states. Nationwide, high-volume insurers with higher in-network denial rates across HealthCare.gov states included Blue Cross Blue Shield of Alabama (35% for its 12 plans in that state), UnitedHealth Group (33% across 274 plans in 20 states), Health Care Service Corporation (29% across 915 plans in four states), Molina Healthcare (26% across 72 plans in nine states), and Elevance Health (23% across 154 plans in seven states).

Of limited information available on in-network claims denial reasons, the most common reason for denial was a general “other” reason (34%), while 16% involved excluded services, 9% involved lack of prior authorization or referral, and 6% involved medical necessity. Other common reasons for denials included administrative issues (18%) and exceeding benefit limits (12%).

Consumers appealed about 1% of denied in-network claims in 2023. Following those appeals, insurers often upheld their initial denials (56%), and consumers rarely took the next step to file an external appeal.

The analysis examines data from the Centers for Medicare and Medicaid Services on 425 million claims submitted to 175 insurers selling marketplace coverage in 2023, the most recent year available. Additional data files with insurer- and state-specific information are available at kff.org.

Claims Denials and Appeals in ACA Marketplace Plans in 2023

Authors: Justin Lo, Michelle Long, Rayna Wallace, Meghan Salaga, and Kaye Pestaina
Published: Jan 27, 2025

Editorial Note: This brief and complementary working file were updated on March 24, 2026 to reflect corrected data published by the Centers for Medicare and Medicaid Services (CMS) in September 2025. An analysis based on 2024 data is now available.

The Affordable Care Act (ACA) requires insurers to report transparency data for all non-grandfathered health plans sold on and off the Marketplace, including fully-insured and self-insured employer group health plans. The law requires data to be available to federal and state insurance regulators and to the public. However, federal implementation of this requirement has so far been limited to qualified health plans (QHP) offered on the federally facilitated Marketplace (HealthCare.gov) and does not include QHPs offered on state-based Marketplaces or group health plans. This brief analyzes federal transparency data released by the Centers for Medicare and Medicaid Services (CMS) on claims denials and appeals for non-group qualified health plans (QHPs) offered on HealthCare.gov in 2023. A downloadable working file based on CMS’s public use file is available on the right-hand side of this brief.

Key Takeaways

  • Insurers of qualified health plans (QHPs) sold on HealthCare.gov denied 20% of in-network claims in 2023 and 36% of out-of-network claims for a combined average of 20% of all claims.
  • The in-network denial rate ranged from 1% to 54%. There was significant variation by insurer and by state.
  • Of limited information available on in-network claims denial reasons, the most common reason cited by insurers was “Other” at 34% followed by administrative reasons (21%), excluded service (14%), lack of prior authorization or referral (9%), and only 6% based on lack of medical necessity.
  • Consumers rarely appeal denied claims (fewer than 1% of denied claims were appealed) and when they do, insurers usually uphold their original decision (56% of appeals were upheld).
  • Marketplace enrollees filed 5,000 external appeals in 2023, or 3% of all upheld internal appeals. Due to the suppression of small values, the rate at which external appeals were upheld could not be calculated.

Introduction

The impact of claims denial is widely recognized by enrollees. The 2023 KFF Survey of Consumer Experiences with Health Insurance found that 58% of insured adults said they have experienced a problem using their health insurance, including denied claims. Four in ten (39%) of those who reported having trouble paying medical bills said that denied claims contributed to their problem.

As a part of the annual QHP certification process, issuers (referred to as insurers in this brief) must report certain denied claims information to CMS for plans that were offered in the previous year that they want to offer in the upcoming year. Data does not include information about denied requests for prior authorization (a claim decision made before a service is provided). The dataset only includes information about claims for benefits (medical and prescription drugs combined) made after a service was provided (post-service claims).

Insurers participating in the Marketplace in 2025 reported aggregated data on all HealthCare.gov QHPs they offered in 2023. Additionally, plan-level data from 2023 are reported for plans returning in 2025, including the number of in- and out-of-network claims submitted and denied, and reasons for claims denials. Among insurers participating in HealthCare.gov states in 2023, 43 are not participating in 2025 so they did not provide claims denial information. Among returning insurers, such denial information was only reported for 68% of their claims (the share of claims attributable to returning plans), as not all plans offered in 2025 were also offered in 2023. Additionally, only 55% of plans in the dataset were offered in 2023 and are included in the plan-level reporting for denial reasons. See the Methods and Data Limitations section for more details.

Claims Denials and Appeals in 2023

Insurer-level Claims Denials Data

Insurers reported receiving 471 million claims in 2023, with 93% (436 million claims) filed for in-network services. Of these in-network claims, 86 million were ultimately denied, resulting in an average in-network denial rate of 20% (Figure 1). Out-of-network claims totaled 35 million, with an overall higher denial rate of 36%. Claims that were initially denied then subsequently resubmitted and paid are not included as denied claims in the denial rate.

HealthCare.gov Insurers Denied 20% Of In-Network Claims In 2023 (Pie Chart)

Although the composition of HealthCare.gov states has continued to change since the inception of transparency reporting, the overall in-network denial rate in 2023 is similar to those from other analyses conducted by KFF (Figure 2).

Denial Rates For In-Network Claims By HealthCare.gov Insurers, 2015-2023 (Line chart)

Insurer denial rates for in-network claims received in 2023 varied widely, ranging from 1% to 54%. Twenty-two of the 175 reporting insurers had an in-network denial rate of less than 10% while twenty-four insurers had a denial rate of 30% or more (Figure 3).

Denial Rates For In-Network Claims By HealthCare.gov Insurers, 2023 (Column Chart)

Denial rates also varied geographically, as shown in Figure 4. The state with the highest average in-network denial rate for HealthCare.gov insurers was 34%, in Alabama, and the lowest was 6%, in South Dakota. Average denial rates have the potential to obscure variation. For example, while the average denial rate for insurers in Florida (21%) was slightly above the national average (20%), denial rates for insurers in Florida had more variability than any other state included in this analysis, ranging from 8% to 54% (the highest single insurer-level denial rate in the country).

Average Denial Rates For In-Network Claims By HealthCare.gov Insurers, By State, 2023 (Choropleth map)

Limited ACA transparency data collected by the federal government continue to show wide disparities in the rate at which Marketplace plans pay claims. While HealthCare.gov insurers denied an average of 20% of in-network claims in 2023, some insurers reported denying a much higher share. Table 1 shows denial rates for claims filed by parent companies that received more than 5 million claims within HealthCare.gov states in 2023. For in-network claims processed by these parent companies, the average in-network denial rate was 18%, ranging from 14% to 35% by parent company. (Blue Cross and Blue Shield parent companies from different states are separated in this table because they operate independently.)

Denial Rates For HealthCare.gov Parent Companies That Received More Than 5 Million Total Claims, 2023 (Table)

Plan-level Claims Denial Data

In all, insurers reported on 56 million denied in-network claims at the plan level for the 2023 coverage year. Denial rates varied only slightly between most plan metal levels. On average, in 2023, HealthCare.gov insurers denied 20% of in-network claims in their bronze plans, 19% in silver plans, 18% in gold plans, 19% in platinum plans, and 26% in catastrophic plans (Figure 5).

Plan-Level Denial Rates For In-Network Claims By HealthCare.gov Insurers, By Metal Level, 2023 (Column Chart)

CMS requires HealthCare.gov insurers to report the reasons for in-network claims denials at the plan level. Specified denial reason categories include:

  • Denials due to lack of prior authorization or referral
  • Denials due to an out-of-network provider
  • Denials due to an exclusion of a service
  • Denials based on medical necessity (reported separately for behavioral health and other services)
  • Denials due to enrollee benefit reached
  • Denials due to a member not being covered
  • Denials due to investigational, experimental, or cosmetic procedure
  • Denials for administrative reasons (which include claims that were duplicate, missing information, untimely, for an unapproved provider, or that met other criteria)
  • Denials for all other reasons not specified above.

Denials due to enrollee benefit reached (such as a limit on the number of physical therapy visits allowed per year); member not being covered at the time of service; investigational, experimental, or cosmetic procedure; and administrative reasons were reported on for the first time for 2022 data (in filings for application for the 2024 plan year).

A claim might be denied for more than one reason and on more than one submission. For example, if the initial submission of a claim misspelled a patient’s name and was denied because the patient could not be identified, the claim may be denied again after being corrected and resubmitted if the claim were for a service that was not covered. Additionally, denial reasons are also reported for claims that are ultimately paid if they are resubmitted to correct the deficit or are successfully appealed. Insurers reported about 78 million denial reasons for in-network claims that were denied at some point in the adjudication process. The adjudication process employed by the insurer may affect how denial reasons are reported. Although publicly reported data allow for multiple reasons throughout the life of a claim, in practice, insurers may file denial reasons sequentially and not capture all applicable reasons for denying claims, such as denying claims from an unidentifiable enrollee before determining whether the claim was for a medically necessary procedure.

The distribution of in-network denials by reason is shown in Table 2. Of in-network claims, 14% of denials were because the claim was for an excluded service, 9% due to lack of prior authorization or referral, and only about 6% based on medical necessity. The share of denial reasons related to administrative reasons is 21%, the most common reason aside from “other” (34%). The share of denial reasons attributed to “other” reasons in 2023 is significantly smaller compared to the 2021 data due to the reporting of new specific denial reasons, notably administrative reasons. Among all in-network claims filed, 6% required a resubmission (not necessarily for administrative reasons though). A resubmission may occur when the original claim was incomplete, contained errors, or was rejected for non-compliance with billing guidelines.

Reasons For In-Network Claims Denials Among HealthCare.gov Plans, 2023 (Table)

Insurers also had wide variability in their use of denial reasons. While about 6% of all in-network claims denials by HealthCare.gov plans were based on medical necessity, several plans reported much higher shares for medical necessity reasons. For example, 32% of denial reasons for Cigna HealthCare of Arizona were due to medical necessity. Similarly, while 9% of all in-network denials by HealthCare.gov plans were based on lack of prior authorization or referral, some plans reported a much larger share. For example, 97% of denial reasons for Blue Cross Blue Shield of Arizona were for lack of prior authorization or referral.

Plans may apply utilization review techniques differently. For example, individual insurer policies and practices may affect the balance between denials for failure to obtain referral/prior authorization and medical necessity denials, as greater use of prior authorization would shift utilization review to before a service is provided and possibly decrease the number of denials due to medical necessity. However, without more detail on the types of claims subject to these denials, it is not possible to discern the possible implications for patients. Recent federal regulations may provide further insight into the prior authorization process and what services typically require prior authorization for Healthcare.gov plans. Furthermore, denials captured in this data do not reflect the share or types of services covered by insurers.

Appeals Data

CMS requires insurers to report the total number of denied and internally appealed claims at the insurer level. Internal appeal is a process that allows a consumer to challenge a denied claim made by their health insurer. As in KFF’s previous analysis of federal claims denial data, we find that consumers rarely appeal denied claims and when they do, insurers usually uphold their original decision.

Appeal to Insurer (Internal Appeal). Of the 86 million in-network denied claims in 2023, HealthCare.gov consumers appealed 376,508 – an appeal rate of less than 1%. Insurers upheld 211,383 (56%) denials on appeal. Relatedly, the 2023 KFF Survey of Consumer Experiences with Health Insurance found that only one in ten insured adults who reported experiencing a problem with their insurance in the past year had filed a formal appeal.

Appeal to Third Party (External Appeal). Consumers whose denial is upheld at internal appeal may have the right to an independent external appeal (also called external review) for certain types of claims. Among insurers that reported at least 10 external appeals in 2023, Marketplace enrollees externally appealed at least 5,000 claims in 2023 (CMS suppresses reporting of observations lower than 10 so the number of externally appealed claims could be higher). Among insurers that reported at least 10 external appeals in 2023, 3% of upheld appeals were externally appealed. Due to the suppression of small values, the rate at which external appeals were upheld could not be calculated.

It is not well known that consumers can appeal claims denials through an external appeal process. KFF’s 2023 consumer survey found that just 40% of consumers believed they have a legal right to appeal to a government agency or independent medical expert, while 51% said they were unsure if they had appeal rights, and 9% did not believe they had this right. Furthermore, Marketplace enrollees (34%) were less likely to know they had external appeal rights compared to those with Medicare (58%) and Medicaid (45%).

Other Data Sources

Absent data on how often insurers in other markets deny claims, it is difficult to put ACA transparency data in context. Below are other sources of claims denial data.

Covered California

California requires insurers to report data on claims received and denied each year for both in- and out-of-network services, in a manner similar to HealthCare.gov insurers. Among insurers submitting complete 2023 claims data to Covered California, the in-network denial rate was 21%, similar to HealthCare.gov insurers. One insurer had a denial rate of 87%. When excluding this insurer from the analysis, the overall claims denial rate among Covered CA insurers was 19%.

Specified denial reason categories are the same for both Marketplaces. At the plan-level, about 14% of in-network denials were due to lack of prior authorization or a referral, followed by about 6% due to administrative reasons, and about 1% for lacking medical necessity.

The appeal rate for Covered CA insurers (1%) was similar to HealthCare.gov insurers. Among all Covered CA insurers with complete data, about 40% of internal appeals and 47% of external appeals filed were upheld, substantially lower than HealthCare.gov insurers. Like denials, one insurer also represented a large share of the appeals data reported. When excluding that insurer, the rate of internal appeals upheld by Covered CA insurers was 61%.

Connecticut Health Insurance Report Card

Connecticut law requires private health insurers in all market segments with at least 1,000 enrollees to report annual data on claims payment practices, prior authorization requests and denials, claims denial reasons, and several other metrics (Table 3). The state insurance department publishes the aggregated data at the insurer level in its annual Consumer Report Card, which includes data from the largest insurer and is intended to inform consumer decision-making. Claims denial data include the total number of claims received and the total number of claims denied by reason.

Insurers in Connecticut reported receiving more than 11.8 million claims and denying more than 2.7 million claims in 2023, for an overall denial rate of 23%. In 2023, the largest shares of claims denials were for reasons related to the benefit not being covered (11.4% of denials) and for other reasons not specified (62.4%).

Connecticut’s claims denial data are not directly comparable to those reported by Covered CA or HealthCare.gov insurers for several reasons, including that Connecticut’s data includes group health plans, denial reasons are reported at the insurer level rather than the plan level, and claims data in Connecticut are not separated by network status.

Connecticut Health Insurer Claims Denials And Reasons, 2023 (Table)

National Association of Insurance Commissioners

The National Association of Insurance Commissioners (NAIC), via the Market Conduct Annual Statement (MCAS), collects uniform data annually on claims denials, prior authorization requests, appeals, and more from many insurers in the individual and group markets in nearly every U.S. state. MCAS data are intended to help state insurance regulators monitor the market conduct of insurance companies, and insurers can use this information to identify areas to improve performance. However, full MCAS health insurance data are shared with state regulators only, not the general public or CMS. A limited national summary published by the NAIC shows that the average claims denial rate for both in- and out-of-network claims (excluding pharmacy) in 2023 was about 16%.

Medicare Advantage and Medicaid Managed Care

Medicare Advantage plans have come under scrutiny in recent years over concerns about policies and processes related to claims and prior authorization denials. According to a 2024 KFF analysis of federal data, Medicare Advantage plans denied (fully or partially) 3.4 million prior authorization requests for health care services in 2022, for an overall denial rate of about 7%, a share that has increased over the past few years. (Prior authorization is a process used by health insurers that requires providers to obtain approval before a service or other benefit is covered.) Additionally, a 2018 federal report found that 8% of claims and prior authorization requests (combined) submitted to Medicare Advantage plans between 2014 and 2016 were denied by insurers, which was less than half the denial rate reported, on average, by HealthCare.gov insurers during that period.

Medicaid managed care organizations (MCOs) also may require prior authorization. A 2023 federal report found that Medicaid MCOs denied more than 2 million prior authorization requests in 2019 for an overall prior authorization denial rate of nearly 13%–more than 2 times higher than the Medicare Advantage rate. However, these data are not directly comparable to the HealthCare.gov data being analyzed for this report, as the former pertains specifically to prior authorization denials while the latter covers post-service claims denials.

Looking Forward

Although research and investigations into health insurer practices have garnered attention from lawmakers and patient advocates over the past several years, the December 2024 killing of UnitedHealthcare’s CEO ignited broad public outrage over insurer claims denials. According to a January 2025 KFF public opinion poll asking about certain health care priorities for Congress and the Trump administration, most people (55%) say more closely regulating insurers’ decisions to approve or deny claims for health services or prescription drugs should be a “top priority.” While prospects for significant changes in response to the public outrage may be limited, interest in providing the public with more transparency about how insurer claims review and appeals operate could, in the same way as providing more accurate price transparency information, better enable consumers and employers to make more informed choices when purchasing private coverage. Efforts might include:

Including More Specific Information in Existing Datasets

Using the current data, the proportion of claims denied for a given reason cannot be calculated. For example, it is not possible to know the share of services that were denied due to a lack of medical necessity. Federal reporting on denials could be more useful when presented as claims ever denied for a given reason, instead of tallying the total reasons. Also, reporting that includes denial information about all claims from all insurers in the previous year, and not just those attributable to plans that are returning to the Marketplace next year, could be useful. Additionally, information about the types of services approved and denied (e.g., specialty of service and type of prescription drug) would give a more comprehensive picture of insurer practices and what type of care was actually covered by an insurer or employer. Information about appeals, especially external appeals, could provide insight into how this consumer protection mechanism is working for patients. Information about what services required prior authorization and how often the prior authorization itself is approved and denied is another data element not included in the CMS Marketplace public use file but is included in NAIC MCAS data not available to the public.

Providing Claims Denial Information About Employer Coverage

Employer-sponsored insurance covered 154 million people under 65 in 2023. Since most Americans have employer-sponsored coverage, efforts to provide more information to this group may be a way to begin to address concerns about insurer denials. A proposed regulation from 2016 that was never finalized would have added a claims denial metric to reporting required under the Employee Retirement Income Security Act of 1974 (ERISA). Also, in 2024, some members of Congress, urged the Department of Labor (DOL) to collect information on claims and claims denial, citing reports of “widespread denials of health benefits.” An outside advisory panel to DOL also recently issued recommendations for increased data collection, among other claims and appeal reforms in this area. Also, federal mental health parity regulations updated in 2024 will require employer plans (and non-group plans) to collect and evaluate certain data, including the number and percentage of certain claims denials.

State-level Initiatives

There has been some activity at the state level to provide more transparency into claims denials and prior authorization requests. For example, in addition to California’s and Connecticut’s requirements for reporting claims denial data, Vermont requires insurers of state-regulated plans to report certain pre- and post-service claims denial data to the state, including breakdowns by mental health, substance use disorder services, and prescription drugs. Insurers in Oregon are required to report to the state claims denial and appeals data for behavioral health services compared to certain medical and surgical services. Additionally, Washington state requires insurers to report certain data related to prior authorization requests to the state, issue prior authorization determinations within certain timeframes, and use a standardized and streamlined prior authorization process. All of these states make at least some of this information available to the public annually. Going forward, more states may act to enact similar initiatives at the state level. These state laws, however, do not apply to self-insured health plans sponsored by private employers, which cover most insured Americans under age 65. Absent more uniform and complete data at a national level, efforts to fully understand and address issues related to health insurance claims denials will remain limited.

Methods and Data Limitations

Our analysis of the CMS Transparency in Coverage 2025 (first published October 11, 2024, and updated September 30, 2025) Public Use File includes insurers with more than 1,000 claims submitted and excludes stand-alone dental plans and small group (SHOP) plans. Of the 206 major medical insurers offering plans in 2025 in HealthCare.gov states, 175 reported receiving more than 1,000 claims and show data on claims received and denied. Among insurers participating in HealthCare.gov states in 2023, 43 are not participating in 2025 so they did not provide claims denial information. Calculation of claims denial rates includes information provided by insurers on plans offered in 2023 but not in 2025. A claim may be initially denied, then resubmitted and approved; claims that are paid even after initial denial do not count as denied in the claims denial rate calculation.

Twenty-nine insurers offering plans in 2025 did not offer plans in 2023. Just under half (45%) of plans available in 2025 were not available in 2023 among states that offered plans on HealthCare.gov in both years; of the 6,126 plans offered in 2023, only 2,481 (40%) were offered in 2025 and are included in the plan-level reporting providing information on denial reasons. Half of returning insurers did not provide statistics on denial reasons for more than 21% of claims filed in 2023, as they were associated with plans not being offered in 2025.

Calculation of denial reasons excluded claims that were denied as out-of-network in all totals. Since out-of-network denials may depend more on plan type than insurer processes, the analysis focused on in-network claims. Claims that are denied do not necessarily indicate that services are not ultimately paid by the insurer, such as when a new claim is filed instead of resubmitted.

The external appeal rate assumes that all external appeals went through an internal appeal first and was calculated as the number of external appeals filed over the number of internal appeals upheld. CMS suppresses reporting of values under 10. When calculating statistics with suppressed values, they were assumed to be zero. Additional considerations for using CMS transparency public files can be found here. To obtain the parent company name, the 2025 Qualified Health Plan landscape file was merged with the Medical Loss Ratio Submission Template header using HIOS plan identification numbers to find NAIC company codes. The NAIC identifier was then mapped to a parent company name using the Enrollment by Segment Exhibit data from Mark Farrah Associates. A small number of insurers could not be mapped by this method and parent company names were entered manually. Statistics calculated at the parent company level do not include plans offered in segments other than on-exchange ACA plans offered in HealthCare.gov states.

Data from Covered California was compiled from reporting by insurer. Of the 11 insurers submitting data for the 2023 plan year, 8 submitted complete information and are included in our analysis. One insurer reported its plan-level claims data by benefit category (medical, pediatric vision and dental, and pharmacy) instead of by plan; from this data we calculated plan-level totals. We assume that other Covered CA insurers also included these four benefit categories when reporting their plan-level data as all four are considered Essential Health Benefits. Our analysis excludes stand-alone dental plans and small-group plans.

Medicaid Section 1115 Waivers: The Basics

Published: Jan 24, 2025

Section 1115 Medicaid demonstration waivers offer states an avenue to test new approaches in Medicaid that differ from what is required by federal statute, if [in the HHS Secretary’s view] the approach is likely to “promote the objectives of the Medicaid program.” They can provide states additional flexibility in how they operate their programs, beyond the considerable flexibility that is available under current law. Waivers generally reflect priorities identified by states as well as changing priorities from one presidential administration to another. Nearly all states have at least one active Section 1115 waiver and some states have multiple 1115 waivers. This brief explains what Section 1115 waivers are and how they are used, summarizes key waiver requirements, and outlines the application and approval process.

What are waivers and how are they used?

Authority & Purpose. Under Section 1115 of the Social Security Act, the Secretary of Health and Human Services (HHS) can waive certain federal Medicaid requirements.1  In addition, the Secretary may permit states to use federal Medicaid funds in ways that are not otherwise allowed. Each administration has some discretion over which waivers to approve and encourage (Table 1). While the Secretary’s waiver authority is broad, it is not unlimited. Section 1115 waivers have been challenged in court. The Secretary does not have authority to waive some elements of the program, such as the federal matching payment system for states, or requirements that are rooted in the Constitution, such as the right to a fair hearing.2 

Waiver Scope/Use. Waivers have been used to expand coverage or benefits, change policies for existing Medicaid populations (e.g., testing premiums or other eligibility requirements), modify delivery systems, restructure financing or authorize new payments (e.g., supplemental payments or incentive-based payments), as well as make other program changes. Waivers vary in size and scope. States can obtain “comprehensive” Section 1115 waivers that make broad program changes or narrow waivers focused on a specific population. Some policies introduced through 1115 waivers can only be implemented through Section 1115 authority while others could be implemented under other authorities (e.g., State Plan authority or 1915(c)). MACPAC analysis found about half of all Medicaid spending (in FY 2019) was authorized under Section 1115 demonstrations, but most of that spending could have been covered without an 1115 waiver. States may seek to include some populations or services in Section 1115 waivers that could be covered under other authorities to capture “budget neutrality” savings (discussed in more detail below). For example, although states can implement mandatory managed care for most populations under other authorities (e.g., State Plan or 1915(b)), states may implement managed care under 1115 authority to show budget neutrality savings, which can be used to finance other waiver costs that are not otherwise covered / allowed by Medicaid. In addition, many states have comprehensive waivers that make broad and intertwined program changes and may include both provisions that require 1115 authority as well as provisions that could be implemented without a waiver.

History Of Medicaid Section 1115 Waivers

What are the rules about waiver financing?

Financing. Under long-standing policy and practice (although not required by statute), waivers must be “budget neutral” to the federal government over the course of the waiver. In other words, federal costs under an 1115 waiver may not exceed what they would have been for that state without the waiver. Typically, budget neutrality calculations are determined on a per enrollee basis—so, per enrollee spending over the course of the waiver cannot exceed the projected per enrollee spending calculated in the “without-waiver baseline” (putting states at risk for the costs per individual but not for the number of individuals enrolled). Waiver budget neutrality—measured against the estimated without-waiver baseline over the entire demonstration period—is not the same as a federal per enrollee limit on spending set at rates lower than expected under current law to generate federal savings. Budget neutrality calculations and the use of “budget neutrality savings” (to fund the federal share of costs not otherwise allowed) are negotiated between states and CMS (and the Office of Management and Budget (OMB)).

Because Section 1115 budget neutrality is not defined in statute or regulations, CMS agency policy and guidance to states has changed over time. For example, the Trump administration made changes to 1115 waiver budget neutrality policy in 2018, limiting the amount of federal funds that could be used for waiver spending. Later, the Biden administration made changes to Section 1115 budget neutrality policies that could provide greater flexibility for states to design and implement 1115 demonstration programs, including health-related social needs initiatives.

What are waiver timelines and processes?

Waiver Timeframe. Section 1115 waivers generally are approved for an initial five-year period and can be renewed, typically for three-to-five-year periods. Some waivers have been continually renewed over many periods, allowing waiver operations to continue for many years. Under the Trump administration, in a departure from prior policy, CMS approved waiver extension requests for up to 10 years.

Incoming administrations may let waivers expire, choosing not to renew certain waiver provisions if they don’t align with the administration’s waiver priorities or if they determine the provisions do not promote the objectives of the Medicaid program. Additionally, outlined in waiver approval terms and conditions, CMS reserves the right to withdraw Section 1115 waiver or expenditure authorities at any time (including those already in operation under an active/approved waiver). The Biden administration withdrew Medicaid work requirement waivers in all states that had approvals, concluding that the provisions do not promote the objectives of the Medicaid program. States can appeal withdrawal decisions to the HHS Department Appeals Board and/or challenge recissions in court.

Transparency, Public Input, and Evaluation. The Affordable Care Act (ACA) made Section 1115 waivers subject to new rules about transparency, public input, and evaluation.3  Regulations require public notice and comment periods to occur at the state and federal levels before CMS approves new Section 1115 waivers and extensions of existing waivers. Although the final regulations on public notice do not require a state-level public comment period for amendments to existing/ongoing demonstrations, CMS has historically applied these regulations to amendments as well. The Trump administration did not enforce state-level public notice and comment procedures maintained by previous administrations for certain 1115 waiver requests, including waivers that proposed significant changes.

The ACA also implemented new evaluation requirements for Section 1115 waivers, including that states must have a publicly available, CMS-approved evaluation strategy. States have traditionally also been required to submit quarterly reports as well as an annual report to HHS that describes the changes occurring under the waiver and their impact on access, quality, and outcomes.

Waiver Application, Monitoring, and Evaluation Process. Medicaid policy changes, including through Section 1115 waivers, may require state legislative action or may be authorized at the direction of the governor. Once proposed policy changes have been formulated, a demonstration waiver proposal must be drafted. Key steps in the waiver process include (Figure 1):

  • State public notice and comment.4  Prior to submitting an 1115 waiver application (or extension request) for official federal review, states must provide a 30-day public notice and comment period and must hold at least two public hearings, sharing sufficient detail about the proposed waiver to allow for meaningful public input. The state must share waiver proposal materials on its website. Federal rules also require tribal consultation (with federally recognized tribes) prior to application submission.
  • Waiver application submission. State waiver applications must contain specific components including a comprehensive description of the demonstration, enrollment estimates (including for each category of beneficiaries impacted by the demonstration), a list of specific requested waiver and expenditure authorities, research hypotheses, and written documentation of the state’s compliance with public notice requirements, with a report of the issues raised and how the state considered those comments when developing the application.
  • Federal public notice and comment.5  The federal government conducts a review for application completeness and sends the state a notice of receipt, indicating the start date of a 30-day federal comment period. CMS will publish the waiver application on its website and must make the comments received publicly available. Rules require CMS to review and consider all comments submitted by the deadline.
  • Federal review and negotiation. CMS reviews the waiver application sometimes with the involvement of other HHS agencies and the Office of Management and Budget (which reviews the budget neutrality component). Significant negotiation may occur between the state and HHS.
  • Approval. If a waiver is approved, CMS issues an award letter to the state (also published on Medicaid.gov), listing the specific sections of the Social Security Act and applicable regulations that are being waived or modified and the types of expenditures allowed as well as the “terms and conditions” of approval, including a budget neutrality agreement. There has been significant variation in the length of time it takes to get final approval of a waiver. NAMD has noted the typical negotiation / approval timeframe ranges from 6 months to 2 years.
  • Implementation plans and protocols. For some waiver initiatives, CMS may require states to submit detailed implementation plans or protocol documents for review and approval.
  • Monitoring & Evaluation.6 ,7  Because Section 1115 authority is intended for research and demonstration purposes, states must have an approved evaluation strategy in place that is publicly available. States are required to submit an interim evaluation report (one year before a waiver’s expiration or with a renewal application) and a summative evaluation (due 18 months after a waiver period ends). States have traditionally also been required to submit quarterly reports as well as an annual report to HHS that describes the changes occurring under the waiver and their impact on access, quality, and outcomes. States must also hold public forums to solicit feedback following waiver approval / implementation.
  • Amendments & Renewals. States may submit “amendment” requests to CMS to alter existing / ongoing 1115 demonstrations. To ensure public transparency, CMS has historically required states to follow public notice and comment rules (even though final regulations left open the applicability of public notice requirements to proposed amendments). Extension / waiver renewal requests must contain specific components enumerated by CMS, including evaluation results.

*State waiver applications (including amendment and renewal requests), CMS issued approval documents, required implementation plans and protocols, and monitoring and evaluation reports are made publicly available on Medicaid.gov (search by state).


  1. 42 U.S.C. § 1315. ↩︎
  2. The Secretary’s waiver authority is limited to the provisions of 42 U.S.C. § 1396a, provided that waivers are demonstration projects that further Medicaid program objectives. 42 U.S.C. § 1315. ↩︎
  3. [3] §10201(i) of P.L. 111-148 added a new subsection (d) to Section 1115 of the Social Security Act. CMS issued final regulations implementing these provisions of the ACA (42 CFR Part 431 where a new Subpart G is added). ↩︎
  4. § 431.408 ↩︎
  5. §431.416 ↩︎
  6. §431.424 ↩︎
  7. §431.428 ↩︎

Medicaid: What to Watch in 2025

Published: Jan 23, 2025

At the start of 2025, many issues are at play that could affect Medicaid coverage, financing, and access to care. Medicaid is the primary program providing comprehensive health and long-term care to one in five people living in the U.S. While Medicaid was not discussed much on the campaign trail, there are expectations that big changes will likely be proposed through executive actions by the Trump administration and as part of a tax and spending debate in Congress. Even without Congressional action, the Trump administration can make significant programmatic changes through administrative action (including state demonstration waivers, regulations, and other guidance). Other areas to watch with Medicaid implications include state budgets and long-term care workforce challenges.

Federal Funding Cuts and Financing Reforms

The most significant changes to Medicaid in 2025 could include federal funding cuts and financing reforms. According to documents reported on by Politico, House Republicans are considering $2.3 trillion in Medicaid cuts from policy changes that include: imposing a per capita cap on federal Medicaid spending, reducing the federal government’s share of costs for the Affordable Care Act (ACA) expansion group, imposing Medicaid work requirements, reducing the minimum federal matching rate for Medicaid expenditures, changing the match rate for the District of Columbia, and repealing the incentive for states to newly adopt the Medicaid expansion that was passed in the American Rescue Plan Act. These policy changes would fundamentally alter how Medicaid financing works and federal spending reductions of this magnitude would put states at significant financial risk, likely forcing them to cut the number of people covered, cover fewer benefits, and cut payment rates for physicians, hospitals, and nursing homes. If the House and Senate pass a budget resolution with a $2.3 trillion target for Medicaid, Congress will need to come up with detailed legislative policy proposals to hit that target through the budget reconciliation process.

Under current law states are guaranteed federal matching dollars without a cap for qualified services provided to eligible enrollees. The match rate (the share that the federal government pays, known as the federal medical assistance percentage or “FMAP”) varies across states based on per capita income. States receive a higher match rate for some services and populations, most notably, the 90% enhanced match for the ACA expansion population, and sometimes, Congress adjusts the match rate upwards during economic downturns.

Work Requirements

With a second Trump administration and Republican control of Congress, work requirements are likely to be back on the agenda—through federal legislation or state Medicaid waivers. During the first Trump administration, 13 states received 1115 waiver approval to condition Medicaid coverage on meeting work and reporting requirements. Only Arkansas implemented work and reporting requirements with consequences for noncompliance; however, the waiver ended in 2019 when a federal court found the work requirement approval unlawful. 18,000 people lost coverage in Arkansas, primarily due to failure to regularly report the fact that they were working or document eligibility for an exemption. These approvals were either rescinded by the Biden administration or withdrawn by states, and Georgia is the only state with a work requirement waiver in place (following litigation over the Biden Administration’s attempt to stop it). Several states have continued to pursue work requirement waivers despite data showing that most Medicaid adults are working or face barriers to work. Among adults with Medicaid who are under age 65 and do not have Medicare or Supplemental Security Income (SSI), 91% are working, or are not working due to an illness, caregiving responsibilities, or school attendance. A Congressional Budget Office analysis of a recent work requirement proposal shows that the policy would reduce federal spending due to reductions in enrollment and increase the number of people without health insurance but would not increase employment.

Other Waivers and Administrative Changes

Beyond work requirements, the previous Trump administration’s Section 1115 waiver policy emphasized eligibility restrictions and capped financing. Eligibility restrictions included permitting states to charge premiums and lock out enrollees who are disenrolled for unpaid premiums. Waiver priorities shift across presidential administrations and the new Trump administration’s waiver priorities will likely differ significantly from those of the Biden administration; however, it is unclear how the Trump administration will treat certain waivers promoted and approved by the Biden administration, such as those focused on addressing health-related social needs, multi-year continuous eligibility primarily for children, and leveraging Medicaid to help individuals leaving incarceration transition to the community. The Trump administration could choose not to approve waivers that remain pending, rescind existing waiver guidance, and withdraw approved waivers, although some of these waivers, particularly those that are using Medicaid to assist with reentry from incarceration, have been pursued by both Republican and Democratic governors.

Trump administration could delay implementation of new regulations or issue new rules or guidance related to access, managed care, and enrollment processes. The Biden administration finalized a number of major Medicaid regulations designed to promote quality of care and advance access to care for Medicaid enrollees as well as to streamline eligibility and enrollment processes in Medicaid and the Children’s Health Insurance Program (CHIP). These rules are complex and are set to be implemented over several years. Congress may consider legislation to overturn these rules, without legislation, the Trump administration could delay implementation of certain provisions or could issue new regulations that would undo these final rules. (Rules related to long-term care are discussed below). Finally, the Trump administration could issue guidance and implement policy to make it more difficult for people to obtain and maintain coverage, which would reduce enrollment and spending. Previously, the Trump administration sought to reduce Medicaid enrollment by encouraging states to conduct eligibility verification processes in between annual renewal periods.

State Budget Constraints and Priorities

State fiscal conditions remained stable at the beginning of state FY 2025, but the longer term fiscal outlook is less certain. Heading into FY 2025, revenue collections had begun to stabilize and states were returning to more “normal” state budget environments, following multiple years of high revenue and spending growth as well as pandemic-related volatility and unpredictability. States appeared to be in a stable fiscal position, though there is variation across states. According to FY 2025 enacted budgets, most states anticipated revenue growth would continue to flatten and state general fund spending growth would slow. While states have made a number of Medicaid investments in recent years, including to expand access to behavioral health services, improve Medicaid reimbursement rates (particularly for long-term care), and to use Medicaid to help address social determinants of health, and reduce health disparities, expectations of reduced revenue collections beyond 2025 may dampen enthusiasm for further investments in Medicaid and could even prompt spending reductions. Reduced state revenues may be tied to implementation of state tax cuts, the expiration of pandemic-era federal funding, and other macroeconomic uncertainties Any reductions in federal Medicaid spending would put further pressure on state budgets and lead to program cuts.

The Long-Term Care Workforce

It is unknown whether new administrative actions will undermine efforts to bolster the long-term care workforce. There are also longstanding challenges finding enough workers to provide long-term care for people who need such services, and the COVID-19 pandemic exacerbated those issues considerably. As of February 2024, employment levels in most long-term care settings remained below pre-pandemic levels. The Biden Administration finalized two rules intended to address those challenges and increase access to services. The Administration finalized a rule that would create new staffing requirements in nursing facilities, require state Medicaid agencies to report on the percent of Medicaid payments for institutional long-term care that are spent on compensation for direct care workers and support staff, and provide funding for individuals to enter careers in nursing facilities. The rule will increase the number of staff in many nursing facilities, but also increase Medicaid spending. The Administration also finalized a rule aimed at ensuring access to Medicaid services, which included several provisions aimed specifically at home care, which is long-term care provided in home and community environments. The “access” rule requires states to spend least 80% of total payments for certain home care services on compensation for direct care workers. It’s unknown whether the Trump Administration will implement those rules or revise them, and it is possible Congress will overturn them.

Cuts to Medicaid and changes in immigration policy may exacerbate workforce challenges, reduce payment rates for long-term care workers, and erode supports to family caregivers. In response to workforce challenges, many states have adopted payment rate increases for nursing facilities and home care providers with the goal of boosting staffing levels. All states have also created supports for family caregivers, recognizing that caregiving can be very demanding, particularly when there are shortages of paid caregivers. Those initiatives may be impossible to sustain if federal support for Medicaid is reduced by one third. Beyond reducing Medicaid resources, President Trump’s planned crackdown on immigration may further strain the long-term care workforce, which relies heavily on foreign-born workers.

What to Watch

The issues identified in this policy watch could have major implications for Medicaid coverage, financing, and access to care. As these issues play out, the following key questions will be at the forefront:

  • Federal funding cuts and financing reforms: Will Congress enact major cuts to federal Medicaid funding and changes to how the Medicaid program is financed? What will federal cuts in Medicaid mean for people enrolled in the program, states, and providers? How will the impact of any federal policy and funding changes vary across states?
  • Work requirements: Will Congress pass legislation to allow or require work and reporting requirements in Medicaid? If Congress does not include work requirements in legislation, which states will pursue work and reporting requirement waivers under a second Trump administration? How will such policies affect coverage?
  • Other waivers and administrative changes: Beyond work requirements, what waivers will be encouraged and approved under the second Trump administration? Will the administration withdraw any approved waivers or rescind Biden administration waiver guidance? What will happen with major access and eligibility / enrollment regulations finalized under the Biden administration? How will other administrative guidance affect coverage?
  • State budget constraints and priorities: What are current projections for state revenue growth? How will changes in state fiscal conditions affect states’ ability to continue to pursue and maintain recent investments in Medicaid for behavioral health, long-term care, reimbursement rates, social determinants of health, and efforts to reduce disparities? How will federal Medicaid policy changes affect state budgets?
  • The long-term care workforce: Will Congress or the new Trump administration overturn final rules that would bolster nursing facility staffing, wages for long-term care workers, and payment transparency? How will broader changes in Medicaid affect states’ ability to retain higher payment rates for long-term care workers and supports for family caregivers? How will changes in immigration policies affect the direct care workforce?

How Does the Department of Health and Human Services (HHS) Impact Health and Health Care?

Author: Rakesh Singh
Published: Jan 21, 2025

With President Trump now in office, his cabinet nominees continue to testify at congressional hearings as part of the nomination process. Robert F. Kennedy Jr. is the nominee to be the secretary of the Department of Health and Human Services (HHS), and his nomination hearings will spotlight a range of HHS activities but may not touch on the full scope of the department’s responsibilities. To better understand HHS’s impact on the health care system and the American people’s coverage, public health, safety, and well-being, what follows is an overview of the activities of the department.

Overview of HHS

The Department of Health, Education, and Welfare was established in 1953 and evolved into the Department of Health and Human Services in 1980 after the Department of Education was established as an independent entity. A relatively new department of the 15 current executive branch departments, HHS has a Fiscal Year (FY) 2024 budget funding estimated at $1.7 trillion, and the department’s budget is about a quarter of the total FY 2024 U.S. federal budget. It has the largest budget of any federal agency and is the largest grant-making agency.

Most federal executive branch health policy is implemented and managed within HHS, though the White House typically plays a major role in policymaking. The department has 13 operating divisions, most of which have a health focus in areas of coverage, research, regulation, resource delivery, and training. Others are focused on social assistance and support for families and communities in need. More than 80,000 HHS employees are located across the U.S. and the world and half of the workforce is outside the greater Washington, D.C. area.

The Public Health Service (PHS) predates HHS and now exists across ten of the 13 operating divisions within the department:

  • The Administration for Strategic Preparedness and Response (ASPR)
  • The Advanced Research Projects Agency for Health (ARPA-H)
  • The Agency for Healthcare Research and Quality (AHRQ)
  • The Agency for Toxic Substances and Disease Registry (ATSDR)
  • The Centers for Disease Control and Prevention (CDC)
  • The Food and Drug Administration (FDA)
  • The Health Resources and Services Administration (HRSA)
  • The Indian Health Service (IHS)
  • The National Institutes of Health (NIH)
  • The Substance Abuse and Mental Health Services Administration (SAMHSA)

Led by the Assistant Secretary of Health and the U.S. Surgeon General, the more than 6,000 United States Public Health Service Corps work across HHS and several other federal departments in everyday roles involving their health expertise, but they are also the country’s frontline workers for emergency response including public health emergencies.

Health Care Coverage and Affordability

The largest division of HHS is the Centers for Medicare and Medicaid Services (CMS), responsible for administering or overseeing health insurance coverage for Medicare, Medicaid, the Children’s Health Insurance Program, and the Affordable Care Act’s Health Insurance Marketplaces. Together, these programs provide health coverage access to 170 million Americans—more than half the population. However, the impact of HHS on the nation’s health insurance system goes well beyond the programs it administers, as it is heavily involved in the federal regulation of private health insurance, including employer-sponsored health insurance covering more than 150 million people, in conjunction with the Departments of Labor and the Treasury.

Beyond the core health insurance programs CMS administers, HHS also supports access to health care services in several other ways. Community health centers provide primary care and some additional services to low-income and uninsured populations and often serve special populations, e.g., people experiencing homelessness, migratory agricultural workers, and rural residents. HHS has a central role in setting standards and providing significant funding through various sources. HHS also provides medical and public health care to American Indians and Alaskan Natives through a network of providers run or contracted by the Indian Health Service. It has programs addressing the needs of specific populations, including the Ryan White HIV/AIDS program, refugee health, mental health and substance use treatment programs, and maternal and child health, to name a few.

Public Health and Disease Control

The public health role of HHS has been in the spotlight due to the COVID-19 pandemic, but its role during the crisis was based on pre-existing infrastructure and routine activities that adapt to the needs of the day. The department has a long-standing role in monitoring, preventing, and reducing the spread of infectious and non-communicable diseases. Its role encompasses a wide range of responsibilities, including research, screening, policy development and guidance, public education, treatment, and funding for state and local health departments.

Aside from COVID-19, HHS has been active in addressing infectious disease outbreaks of H5N1 avian flu, mpox, and hepatitis A in the past five years and works on long-term challenges like the HIV/AIDS epidemic. The role of HHS in vaccination dates back to the 1950s polio vaccine and it continues to have a substantial role in influencing the country’s vaccine policy.

Emergency Preparedness and Response

The routine health activities of HHS often merge with its role in addressing the health impacts of public emergencies and disasters. Events like the September 11, 2001, terrorist attacks, the opioid epidemic, the Flint, Michigan water crisis, natural disasters of hurricanes, tornadoes, and wildfires, and disease outbreaks have all triggered an HHS response in conjunction with other federal agencies.

HHS has provided emergency coordination and strategic planning to set up shelters for acute medical care and mental health support, sometimes utilizing the National Disaster Medical System, accessed stockpiles of critical equipment and medicine, led investigations and expanded on testing and monitoring activities, and assisted with survivor and community recovery including continuity of health care services.

Food and Drug Safety

Arguably, the broadest touch point for HHS’ impact on Americans’ daily lives is its role in food safety. The Food and Drug Administration (FDA) oversees most food safety aside from meat and poultry and shares responsibility for egg products with the Department of Agriculture. It also regulates the information about dietary supplements provided to consumers, though it does not have authority to approve them for safety and effectiveness. Among the activities related to food safety are conducting inspections of facilities, labeling requirements, issuing food recalls and alerts, and ensuring imported food meets U.S. standards. However, the FDA isn’t the only HHS agency that plays a significant role in food safety, as the Centers for Disease Control’s broad role of monitoring and responding to disease outbreaks also includes those related to consuming contaminated food.

HHS has a major role in regulating medical drugs and devices, mainly through the FDA. This includes pre-market testing for the safety and effectiveness of a product’s intended use, monitoring of approved products for any harm to consumers, and regulations for producing and labeling such products.

Scientific Research and Innovation

HHS, primarily through the National Institutes of Health, is the world’s largest public funder of health research. While the research often conducted can center on the basics of science and biomedicine, it has led to breakthroughs like the first successful polio vaccine, treatments for cancer and HIV/AIDs, the development of MRI technology, and the ability to personalize medicine because of the mapping of the human genome.

Supporting Families and Communities

The health of individuals can be impacted by several non-medical factors often categorized as social determinants of health. HHS has a range of social service programs that may not be typically considered health services, but usually factor in the stability of individual and family lives.

Financial assistance for low-income families with children has long been a federal program, and Temporary Assistance for Needy Families (TANF) is the primary cash assistance program for this population. TANF is administered by the HHS Administration of Children and Families (ACF) which also has programs related to child support enforcement, foster care, adoption, and child care. It also promotes early childhood development in low-income children under the age of five through Head Start.

One element of the department’s support services that has gained significant attention over the past decade, particularly as refugee resettlement submissions to the U.S. have sharply increased, is the array of services offered by the Office of Refugee Resettlement (ORR). Established 45 years ago, ORR aims to integrate individuals, including unaccompanied minors, and families into American society and provide a pathway to self-sufficiency. Services offered include financial assistance, housing, medical care, and employment services.

How Many Physicians Have Opted Out of the Medicare Program?

Published: Jan 17, 2025

Medicare provides health insurance coverage to 67 million adults—20% of the U.S population—and is a major source of revenue for physicians and other health providers. In 2024, Medicare spending on Part B services (including physician services, outpatient services, and physician-administered drugs) accounted for nearly half (49%) of total Medicare benefit spending. Physicians are not required to participate in Medicare, though the vast majority of them choose to do so.

In recent years, physician groups and some policymakers have raised concerns that physicians would opt out of Medicare due to reductions in Medicare payments for many Part B services, potentially leading to a shortage of physicians willing to treat people with Medicare. Medicare payments are lower, on average, than payments from private insurers and are not automatically indexed to keep pace with inflation in medical practice costs. Every year, as required by law, the Centers for Medicare & Medicaid Services (CMS) updates Medicare payments to physicians under the physician fee schedule through rulemaking. Since 2021, Congress has enacted four temporary, one-year increases to physician payment rates to soften scheduled cuts. However, Congress has not enacted a payment increase for 2025, and a 2.93% drop in average Medicare payments to physicians went into effect on January 1.

Despite these ongoing concerns, virtually all (98%) of non-pediatric physicians participate in the Medicare program. Furthermore, Medicare beneficiaries report access to physician services that is equal to, or better than, that of privately-insured individuals, with similar shares reporting delays in needed care or difficulty finding a physician who takes their insurance.

This brief uses the most recent CMS data to document the extent to which non-pediatric physicians have opted out of Medicare, by specialty and by state, as of November 2024, updating prior KFF analyses. (See Methods for details).

Key Takeaways:

  • About one percent of all non-pediatric physicians have formally opted out of the Medicare program in 2024. The share was highest for psychiatrists (8.1%), followed by plastic and reconstructive surgeons (4.5%) and neurologists (3.2%).
  • In 11 specialties, the share of physicians who have opted out of Medicare is 0.5% or lower, with the lowest shares seen among emergency medicine physicians (0.1%), oncologists (0.1%), radiologists (0.1%), and pathologists (<0.1%).
  • Psychiatrists account for the largest share (39.0%) of all non-pediatric physicians who have opted out of Medicare in 2024, followed by family medicine physicians (21.5%) and internal medicine physicians (13.0%).
  • Less than two percent of non-pediatric physicians have opted out of Medicare in 47 states. The rate is slightly higher in three states and the District of Columbia: Alaska (2.8%), Colorado (2.3%), Idaho (2.2%), and the District of Columbia (2.9%).

Three options for physicians

Currently, physicians and other health providers seeking payment from Medicare for Part B services must enroll as a Medicare provider. Physicians may either agree to be a participating provider or non-participating provider. Providers who do not want to enroll in Medicare or receive Medicare payments are required to sign an “opt out” agreement with their patients.

  • Participating providers agree to accept “assignment” on all Medicare claims for all of their Medicare patients, which means that they have signed a participation agreement with Medicare, agreeing to accept Medicare’s fee schedule amounts as payment-in-full for all Medicare covered services. Medicare beneficiaries seeing a participating provider can only be liable for the cost sharing required by Medicare. Providers have several incentives to be participating providers, such as being paid higher rates (5% higher) than the rates paid to non-participating providers. In 2022, the vast majority (98%) of physicians and practitioners billing Medicare were participating providers.
  • Non-participating providers accept Medicare patients, but can choose whether to take assignment (i.e., Medicare’s approved amount) on a claim-by-claim basis. Unlike participating providers, who are paid the full Medicare-allowed payment amount, non-participating physicians who take assignment are limited to 95% of the Medicare approved amount. In 2022, 7% of fee schedule claims were paid on assignment. Physicians who choose to not accept assignment can charge beneficiaries up to 15% more than the Medicare-approved amount, a process known as “balance billing.” Medicare patients are financially liable for this additional amount plus applicable deductibles and coinsurance.
  • Opt-out physicians and other practitioners must sign an affidavit to “opt out” of the Medicare program entirely. These providers enter into private contracts with their Medicare patients, allowing them to bill any amount they determine is appropriate. Providers who have opted out of the Medicare program must opt out for all of their Medicare patients, including those enrolled in Medicare Advantage. Medicare patients seeing a provider who has opted out of the Medicare program must sign this agreement and agree to be financially responsible for the entire cost of any services received. Neither the provider nor the patient can submit a bill to Medicare for reimbursement of any service covered under Medicare Part B. Opt-out agreements last for two consecutive years and are automatically renewed at the end of each two-year period.

What share of physicians have opted out of Medicare?

1.2 percent of non-pediatric physicians have formally opted out of the Medicare program. As of November 2024, 12,244 non-pediatric physicians have opted out of Medicare, representing a very small share (1.2%) of the total number active physicians, similar to the shares reported in 2013 and 2022 (Figure 1).

Few (1.2%) Physicians Have Formally Opted-Out of Medicare in 2024

While the overall opt-out rate is low, opt-out rates are somewhat higher for certain specialties, such as psychiatry and plastic and reconstructive surgery. In 2024, 8.1% of psychiatrists have opted out of Medicare, followed by 4.5% of physicians specializing in plastic and reconstructive surgery and 3.2% of physicians specializing in neurology (Figure 2).

Top 10 Specialties with the Highest Share of Physicians Opting-Out in Specialty, 2024

On the other hand, of the 26 specialty groups included in this analysis, 11 have opt-out rates that are 0.5% or lower, with the lowest rates seen among physicians specializing in emergency medicine (0.1%), oncology (0.1%), radiology (0.1%), and pathology (<0.1%) (Appendix Table 1).

Psychiatrists are disproportionately represented among the 1.2 percent of active physicians who have opted out of Medicare. Psychiatrists account for the largest share (39.0%) of opt-out physicians, followed by physicians in family medicine (21.5%), internal medicine (13.0%), and obstetrics/gynecology (5.9%) (Figure 3). This is consistent with prior analyses that found that psychiatrists are less likely than other physician specialties to accept new patients with Medicare or private insurance, suggesting that psychiatrists may prefer to be paid directly by their patients, in order to avoid the administrative burden of submitting claims to insurers and maintain the flexibility to charge higher fees.

Figure 3: Psychiatrists Accounted for the Largest Share of Physicians Opting Out of Medicare in 2024

In addition to physicians, another 4,474 select clinical professionals with doctorate degrees (i.e. oral surgeons, podiatrists, and optometrists) have also opted out of the Medicare program, with oral surgeons accounting for the vast majority (93.9%) of this group (Appendix Table 1).

Less than two percent of physicians have opted out of Medicare in all but three states and the District of Columbia. As of November 2024, the District of Columbia (2.9%), Alaska (2.8%), Colorado (2.3%), and Idaho (2.2%) have the highest rates of non-pediatric physicians who have opted out of Medicare (Figure 4). In twelve states (Alabama, Arkansas, Iowa, Kentucky, Minnesota, Mississippi, Nebraska, North Dakota, Ohio, South Dakota, West Virginia, and Wisconsin) the opt-out rate is 0.5% or lower (Appendix Table 2).

In 47 States, Less Than 2 Percent of Active Non-Pediatric Physicians Have Opted Out of Medicare

Due to data limitations, this analysis only includes opt-out rates at the state level. Opt-out rates may vary based on rural status and other county-level factors, and some counties may have opt-out rates that are higher than the state average.

Appendix

Supplemental Tables

Number and Share of Physicians and Select Other Clinicians Formally Opting Out of Medicare, by Specialty, 2024

Number and Share of Physicians Formally Opting Out of Medicare, by State, 2024

Methods

This analysis uses Medicare opt-out affidavit data from the Centers for Medicare & Medicaid Services (CMS), as of November 2024. The scope of this analysis was limited to non-pediatric physicians, given its Medicare focus, as well as a select group of other clinicians with doctorates: optometrists, oral surgery, and podiatrists. Therefore, pediatricians and other non-physician specialists, such as certified nurse midwives, clinical social workers, and physician assistants, were excluded from the total number of opt-out physicians. Of note, while some clinicians under the oral surgery specialty group may also hold a medical degree (MD or DO), for the purpose of this analysis, these physicians were grouped in accordance with the primary specialty (oral surgery) associated with their National Provider Identifier (NPI) in CMS’ opt-out file.

This analysis obtained data on the number of active allopathic and osteopathic physicians by specialty and state from Redi-data, Inc, which utilizes data from the American Medical Association (AMA) Physician Masterfile. One limitation of this analysis is that due to data source limitations, it was not possible to exclude active physicians involved in professional activities other than patient care, such as research and administration. We were also unable to examine opt-out rates based on the ownership characteristics of physicians (e.g., hospital-owned vs physician-owned practices). Further, we were unable to examine out-out rates by rural status due to lack of county-level opt-out data.

The specific physician specialty groups identified in this analysis were selected if they were included in the list of opt-out providers provided by CMS. In order to gain a more complete picture of the distribution of opt-out providers in each specialty category, this analysis grouped some subspecialties under a broader specialty category, consistent with the specialty cross-walk provided by Redi-Data, Inc. More specifically, anesthesiology includes pain management and interventional pain management, obstetrics and gynecology includes reproductive endocrinology, and preventive medicine includes occupational medicine. The internal medicine category includes the following subspecialties: internal medicine (not otherwise specified), critical care medicine, gastroenterology, hematology, hospice & palliative medicine, infectious disease, nephrology, pulmonary disease, and rheumatology. The surgery category includes the following subspecialties: cardiac surgery, colorectal surgery, general surgery, hand surgery, micrographic dermatologic surgery, thoracic surgery, and vascular surgery. The following subspecialties are included in the “other” category: addiction medicine, cosmetic surgery aesthetic medicine, Doctor of Medicine, hospitalist, integrative medicine, undefined physicians, sleep medicine, osteopathic manipulative medicine, and medical toxicology.