Jennifer Tolbert
  Clea Bell
  Sammy Cervantes
  Rakesh Singh
 Health coverage in the United States is marked by a blend of private and public insurance options that leaves about 8% of the population uninsured. This coverage system has evolved over the years, most recently with the implementation of the Affordable Care Act (ACA), which aimed to reduce the uninsured rate by expanding Medicaid, creating health insurance Marketplaces for individuals, and providing subsidies to make the coverage more affordable. Many factors, including economic conditions, federal and state policy changes, and significant health crises, such as the COVID-19 pandemic, influence the uninsured rate. The ACA and policy changes designed to protect coverage during the pandemic led to increased health coverage overall; however, passage of the 2025 Federal Budget Reconciliation Bill (referred to as the One Big Beautiful Bill Act) along with other policy changes are expected to increase significantly the number of people who are uninsured over the next ten years.

The Uninsured Population and Health Coverage
Published: October 8, 2025
Health Policy 101:
KFF Authors:
Table of Contents
Introduction
What is the Landscape of Health Care Coverage in the United States?
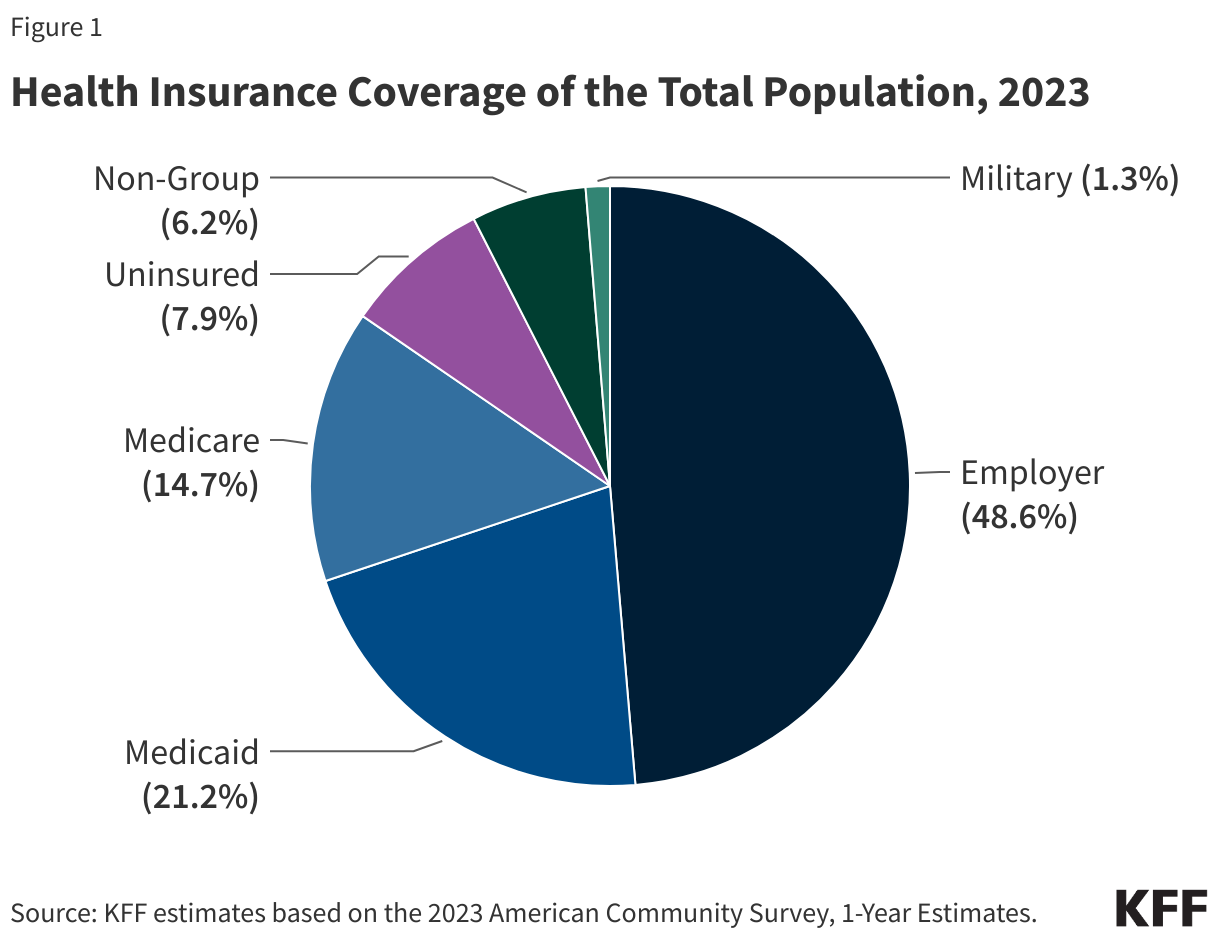
Health coverage in the U.S. is a complex patchwork of private and public insurance coverage options. In 2023, most residents had private insurance coverage, with nearly half covered by an employer-based plan. About 1 in 5 U.S. residents received coverage through the Medicaid program, the federal and state-financed comprehensive health coverage program for low-income people. Another roughly 15% of the population had health coverage from the federal Medicare program, which covers seniors and people under age 65 with long-term disabilities. About 6% of the population had private non-group insurance either purchased through the ACA Marketplace or off-market, and just over 1% of the population was covered through the military’s TRICARE or VA health care programs. The uninsured rate for the total population was 7.9% for the year (Figure 1). (In some cases, people have multiple forms of coverage. For example, about 12 million people are enrolled in both Medicare and Medicaid and are classified in these figures as covered by Medicaid.)
Trends in the Uninsured Rate
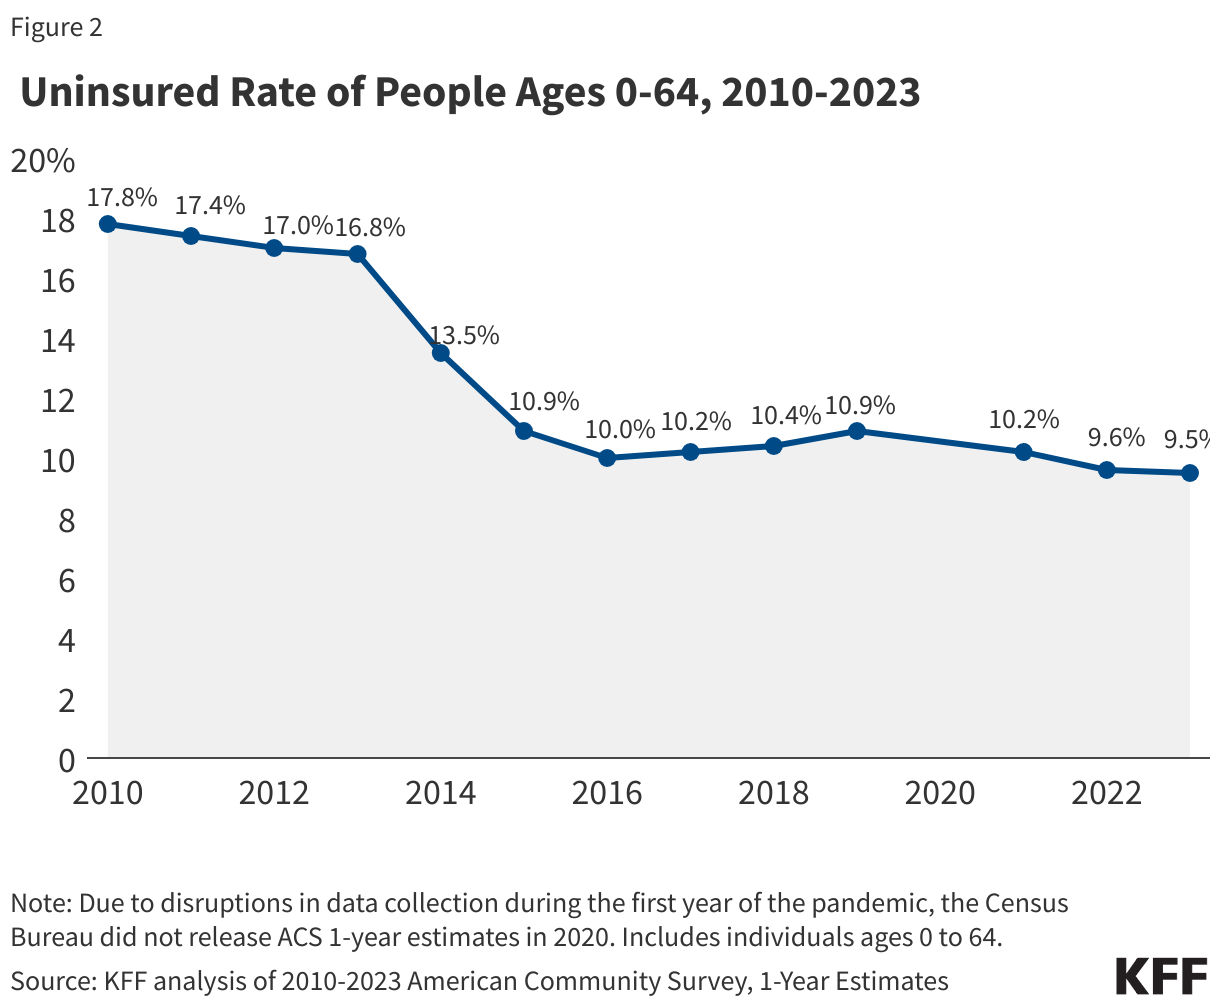
In 2023, there were 25.3 million uninsured residents ages 0-64, and the uninsured rate among the population ages 0-64 was 9.5%, the lowest rate in U.S. history (Figure 2). The analysis of the uninsured population focuses on coverage among people ages 0-64 since Medicare offers near-universal coverage for seniors—just 457,000, or less than 1%, of people over age 65 were uninsured.
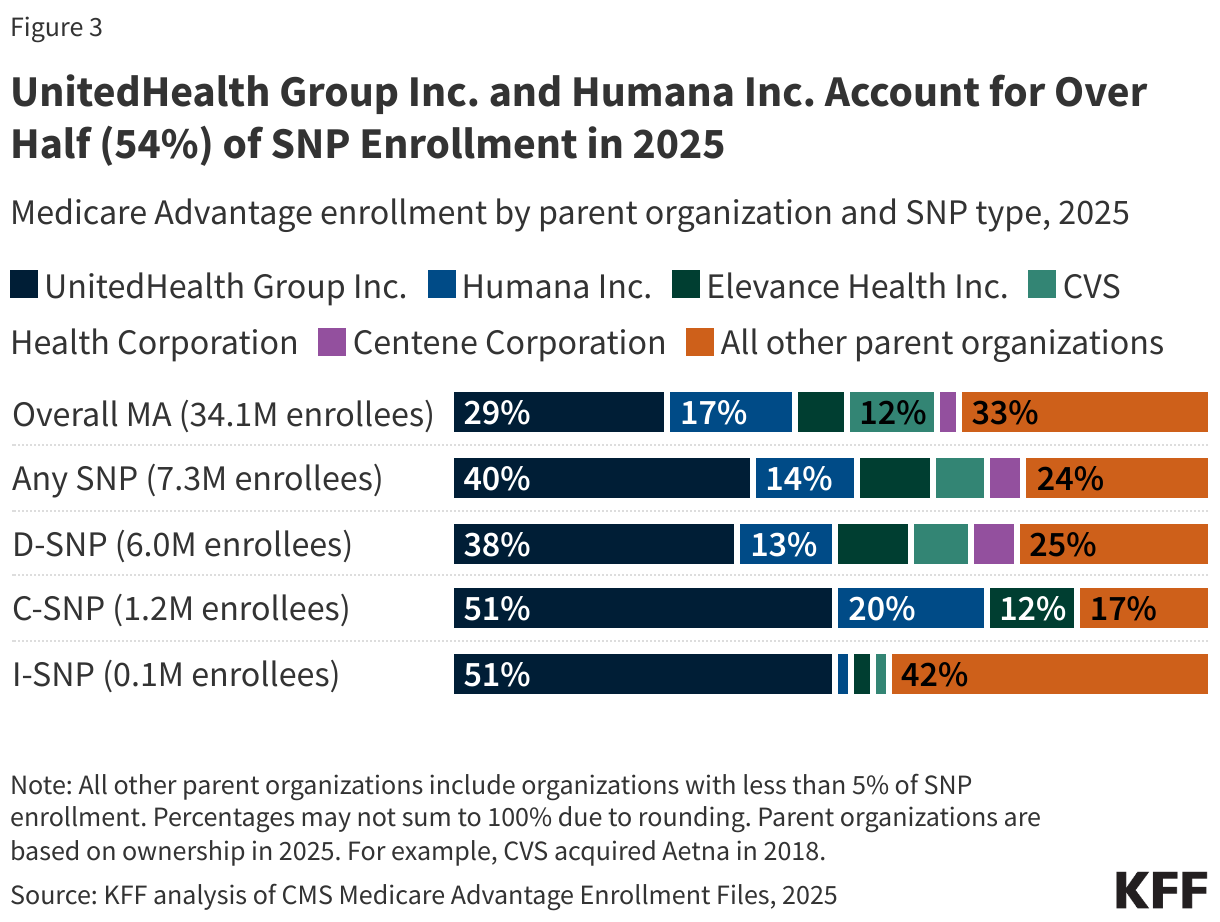
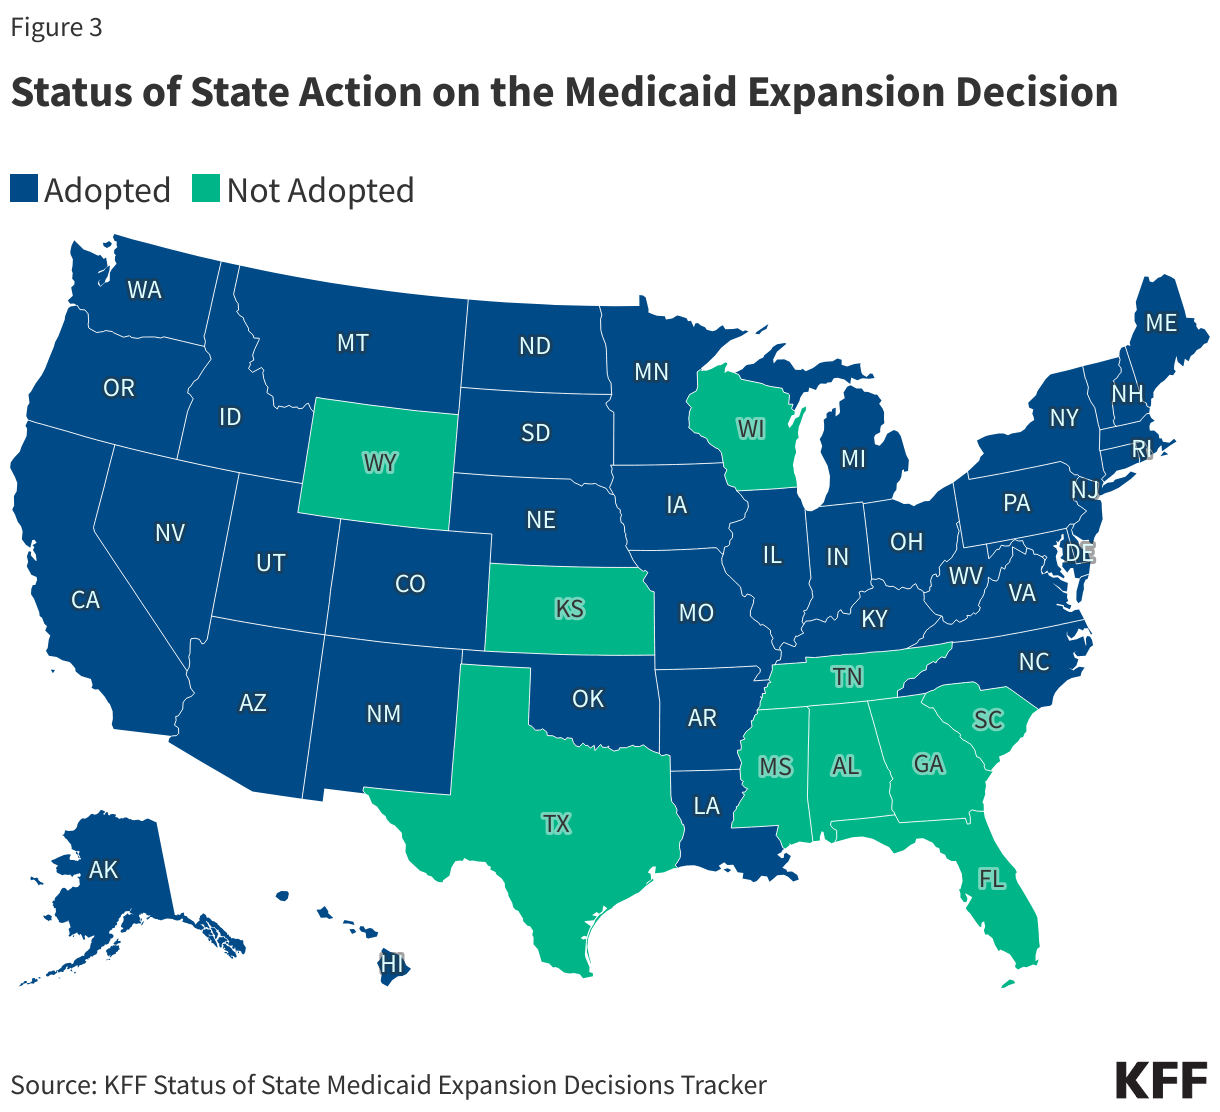
Prior to the implementation of the ACA, gaps in the public insurance system and lack of access to affordable private coverage left over 40 million people without health insurance. The ACA expanded Medicaid coverage to nearly all adults with incomes up to 138% of the federal poverty level (FPL) (the poverty level in the continental U.S. is $15,650 for a single individual in 2025) and created new health insurance Marketplaces through which individuals can purchase coverage with financial help to afford premiums and cost-sharing. Following the passage of the ACA in 2010 and the rollout of the coverage provisions, the number of uninsured people ages 0-64 dropped to 27 million in 2016. The ACA envisioned that all states would adopt the Medicaid expansion; however, a Supreme Court ruling in 2012 made expansion optional for states. As of early 2025, 40 states and Washington, D.C. had adopted the ACA’s Medicaid expansion (Figure 3).
The declines in uninsured rates following implementation of the ACA coverage expansions were largest among poor and near-poor individuals, particularly adults. People of color, who had higher uninsured rates than White people prior to 2014, had larger coverage gains from 2013 to 2016 than White people, although the coverage disparities were not eliminated.
Before implementation of the ACA, expansions of Medicaid coverage and the enactment of the Children’s Health Insurance Program (CHIP) helped to lower the uninsured rate for children. Changes in the 1980s and early 1990s expanded Medicaid eligibility levels for children and pregnant people, and the establishment of CHIP in 1997 provided coverage for children with incomes above Medicaid thresholds. When states implemented CHIP, extensive outreach efforts along with the adoption of streamlined processes facilitated enrollment of children in Medicaid and CHIP and reduced the number of uninsured children.
After declining through 2016, the number of uninsured people and the uninsured rate began increasing in 2017 and continued to grow through 2019. Generally favorable economic conditions as well as policy changes during the Trump Administration, such as reduced funding for outreach and enrollment assistance, encouraging periodic Medicaid eligibility checks, changes to immigration policy related to public charge rules, and approval of some demonstration waivers to restrict enrollment led to a decline in Medicaid enrollment, which likely contributed to the increase in uninsured people.
With the arrival of the COVID-19 pandemic, policies adopted to protect coverage drove a decline in the uninsured population from 2019 to 2023. The Families First Coronavirus Response Act required states to keep people continuously enrolled in Medicaid in exchange for enhanced federal funding. Medicaid continuous enrollment ended in March 2023, and most states completed renewals for individuals who enrolled during continuous enrollment by December 2024. In addition, the American Rescue Plan Act (ARPA) provided temporary enhanced ACA Marketplace subsidies to make Marketplace coverage more affordable, and these subsidies were renewed for another three years in the Inflation Reduction Act of 2022. These enhanced subsidies will expire at the end of December 2025 unless Congress acts to extend them.
Who is Uninsured in the United States?
Most people who are uninsured are adults under age 65, are in working low-income families, are people of color, and, reflecting geographic variation in income, immigration status, and the availability of public coverage, live in the South or West. In 2023, over 8 in 10 people ages 0-64 who were uninsured were adults and 16% were children.
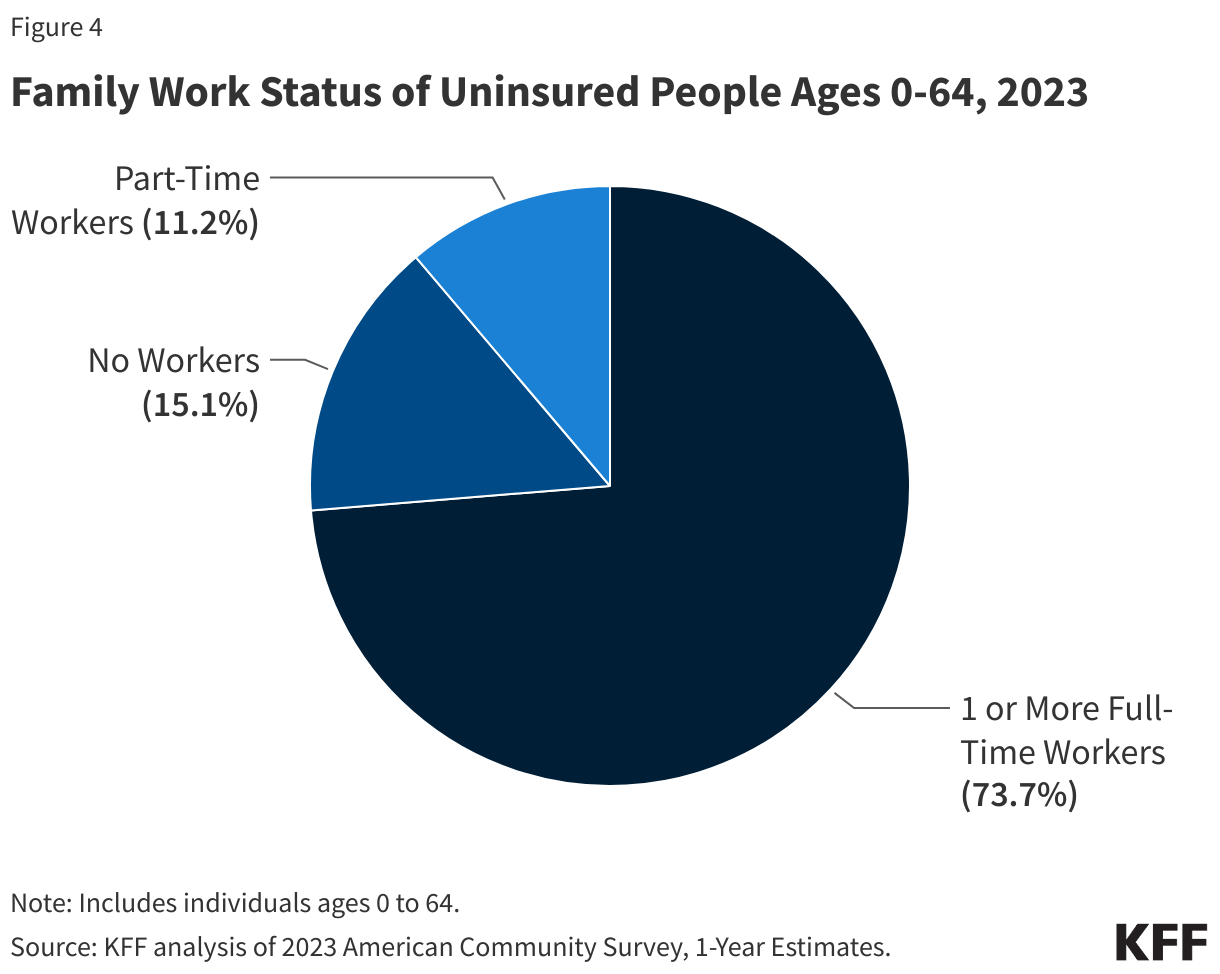
Nearly three-quarters (73.7%) of the uninsured population ages 0-64 had at least one full-time worker in their family and an additional 11.2% had a part-time worker in their family (Figure 4). More than 8 in 10 (80.9%) people ages 0-64 who were uninsured were in families with incomes below 400% FPL in 2023 and nearly half (46.7%) had incomes below 200% FPL. People of color comprised 62.9% of the uninsured population ages 0-64 in 2023 despite making up about 46% of residents ages 0-64. Most uninsured individuals (74.2%) were U.S. citizens, while 25.8% were noncitizens in 2023. Nearly three-quarters lived in the South and West.
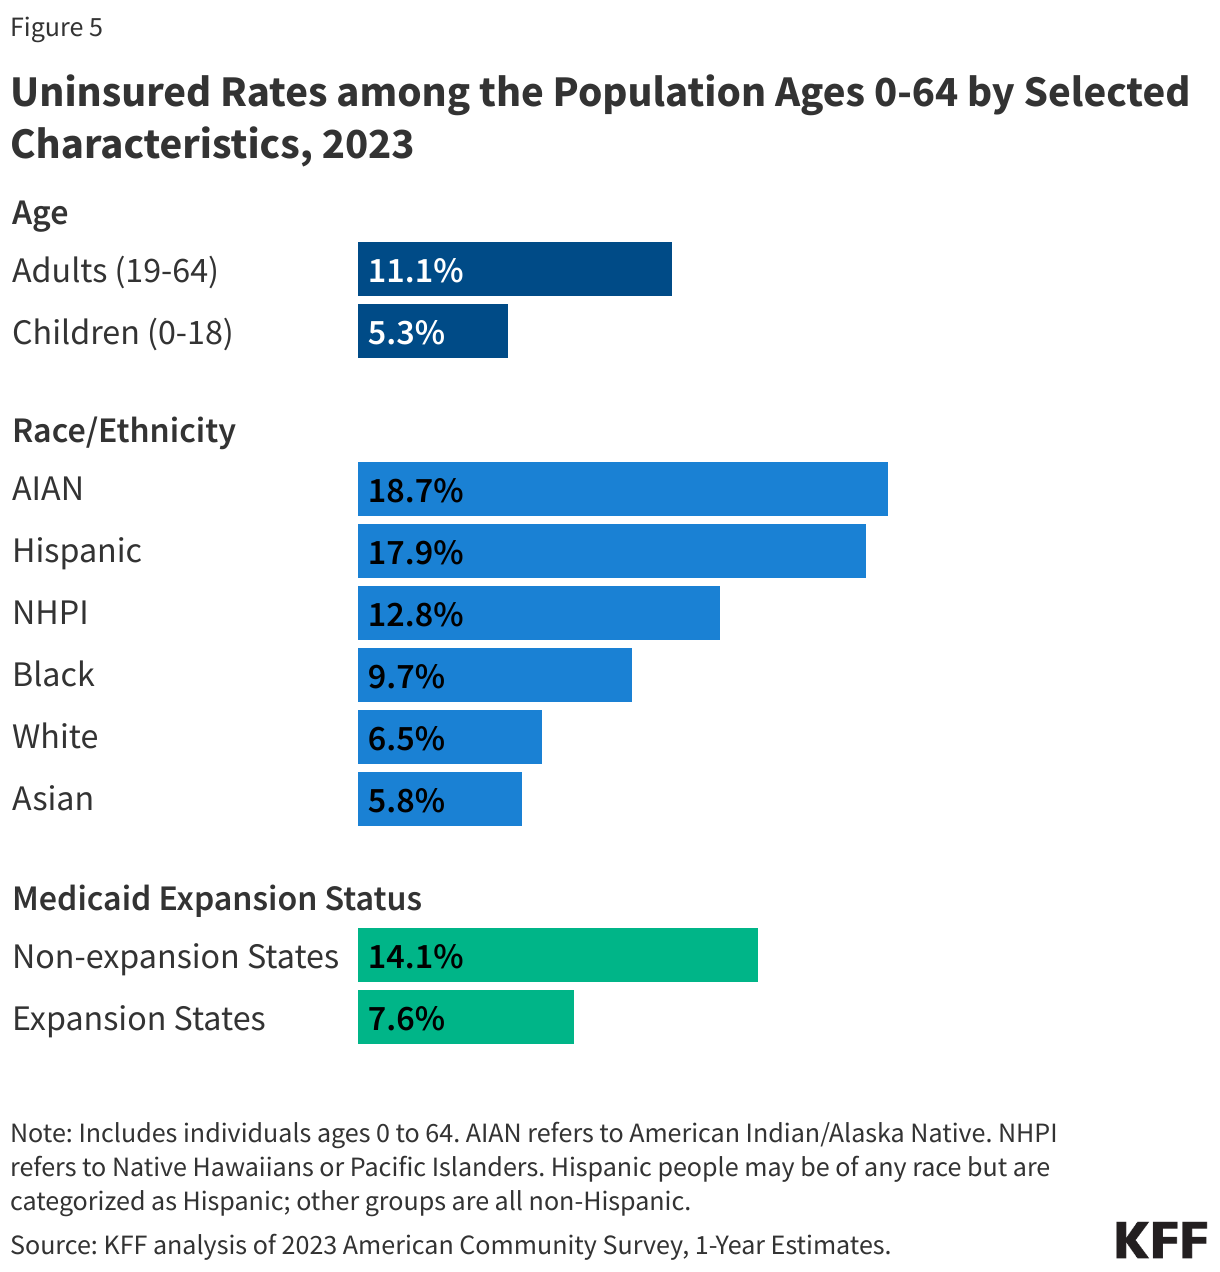
Adults ages 19 to 64 are more likely to be uninsured than children. The uninsured rate among children (5.3%) was less than half the rate among adults ages 19-64 (11.1%) in 2023, largely due to the broader availability of Medicaid and CHIP coverage for children than for adults. Among adults ages 19-64, men had higher uninsured rates than women in 2023 (12.6% vs. 9.5%).
Reflecting persistent disparities in coverage, people of color are generally more likely to be uninsured than White people. In 2023, American Indian and Alaskan Native (AIAN) and Hispanic people ages 0-64 had the highest uninsured rates at 18.7% and 17.9%, respectively, which were nearly three times higher than the uninsured rate for White people (6.5%). Uninsured rates for Native Hawaiian or Pacific Islander (NHPI) (12.8%) and Black people (9.7%) ages 0-64 were also higher than the rate for their White counterparts (Figure 5). These differences in uninsured rates are driven by lower rates of private coverage among these groups. Medicaid coverage helps to narrow these differences but does not fully offset them.
Noncitizens are more likely than citizens to be uninsured. Nearly one-third of noncitizen immigrants were uninsured in 2023 while the uninsured rate for U.S.-born citizens was 7.5% and 8.9% for naturalized citizens. One in 4 children has an immigrant parent, including over 1 in 10 (12%) who are citizen children with at least one noncitizen parent.
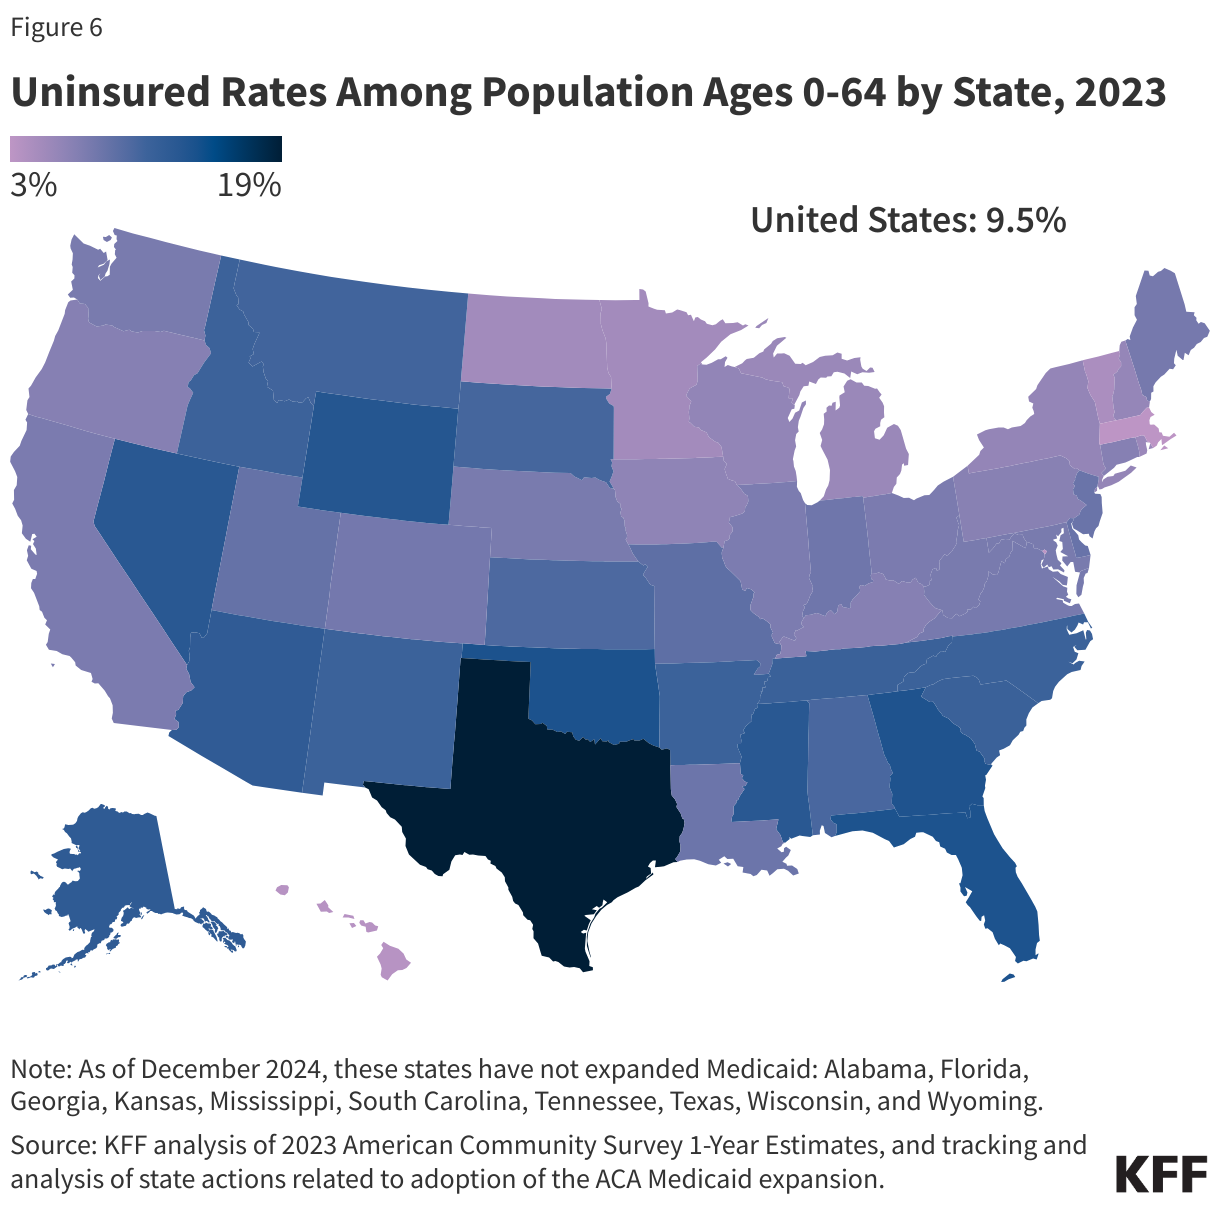
Uninsured rates vary by state and by region and were generally higher in states that had not taken up the ACA Medicaid expansion in 2023 (Figure 6). Economic conditions, availability of employer-sponsored coverage, and demographics are other factors contributing to variation in uninsured rates across states.
Why are People Uninsured?
The fragmented U.S. health coverage system leads to gaps in coverage. While employer-based insurance is the prevalent source of coverage for the population ages 0-64, not all workers are offered coverage by their employer or, if offered, can afford their share of the premiums. Medicaid covers many low-income individuals, especially children, but eligibility for adults remains limited in most states that have not adopted the ACA Medicaid expansion. While subsidies for Marketplace coverage are available for many low and moderate-income people, few people can afford to purchase private coverage without financial assistance.
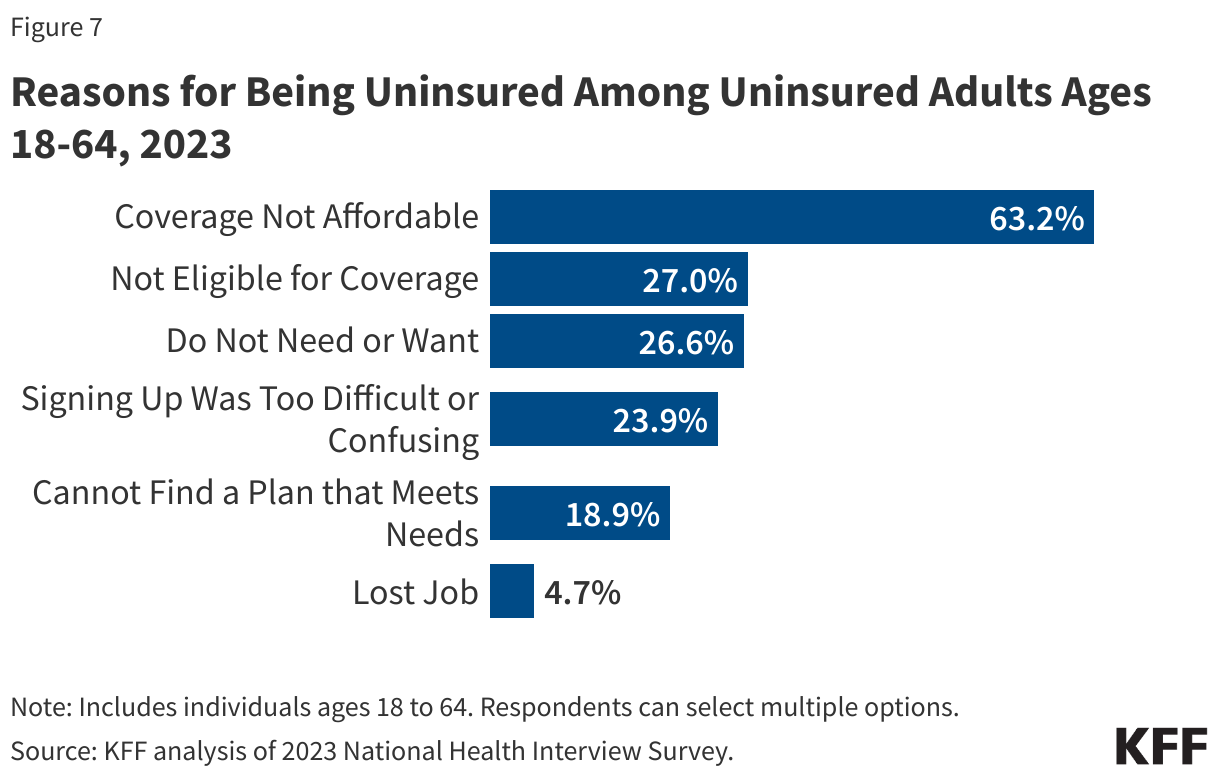
The cost of health coverage and care poses a challenge for the country broadly and is a significant barrier to coverage for people who are uninsured. In 2023, 63.2% of uninsured adults ages 18-64 said they were uninsured because coverage is not affordable, making it the most common reason cited for being uninsured (Figure 7). Other reasons included not being eligible for coverage (27.0%), not needing or wanting coverage (26.6%), and signing up being too difficult (23.9%).
Not all workers have access to coverage through their jobs. In 2023, 64.7% of uninsured workers worked for an employer that did not offer them health benefits. Among uninsured workers who are offered coverage by their employers, cost is often a barrier to taking up the offer. Low-income families with employer-based coverage spend a significantly higher share of their income toward premiums and out-of-pocket medical expenses compared to those with income above 200% FPL.
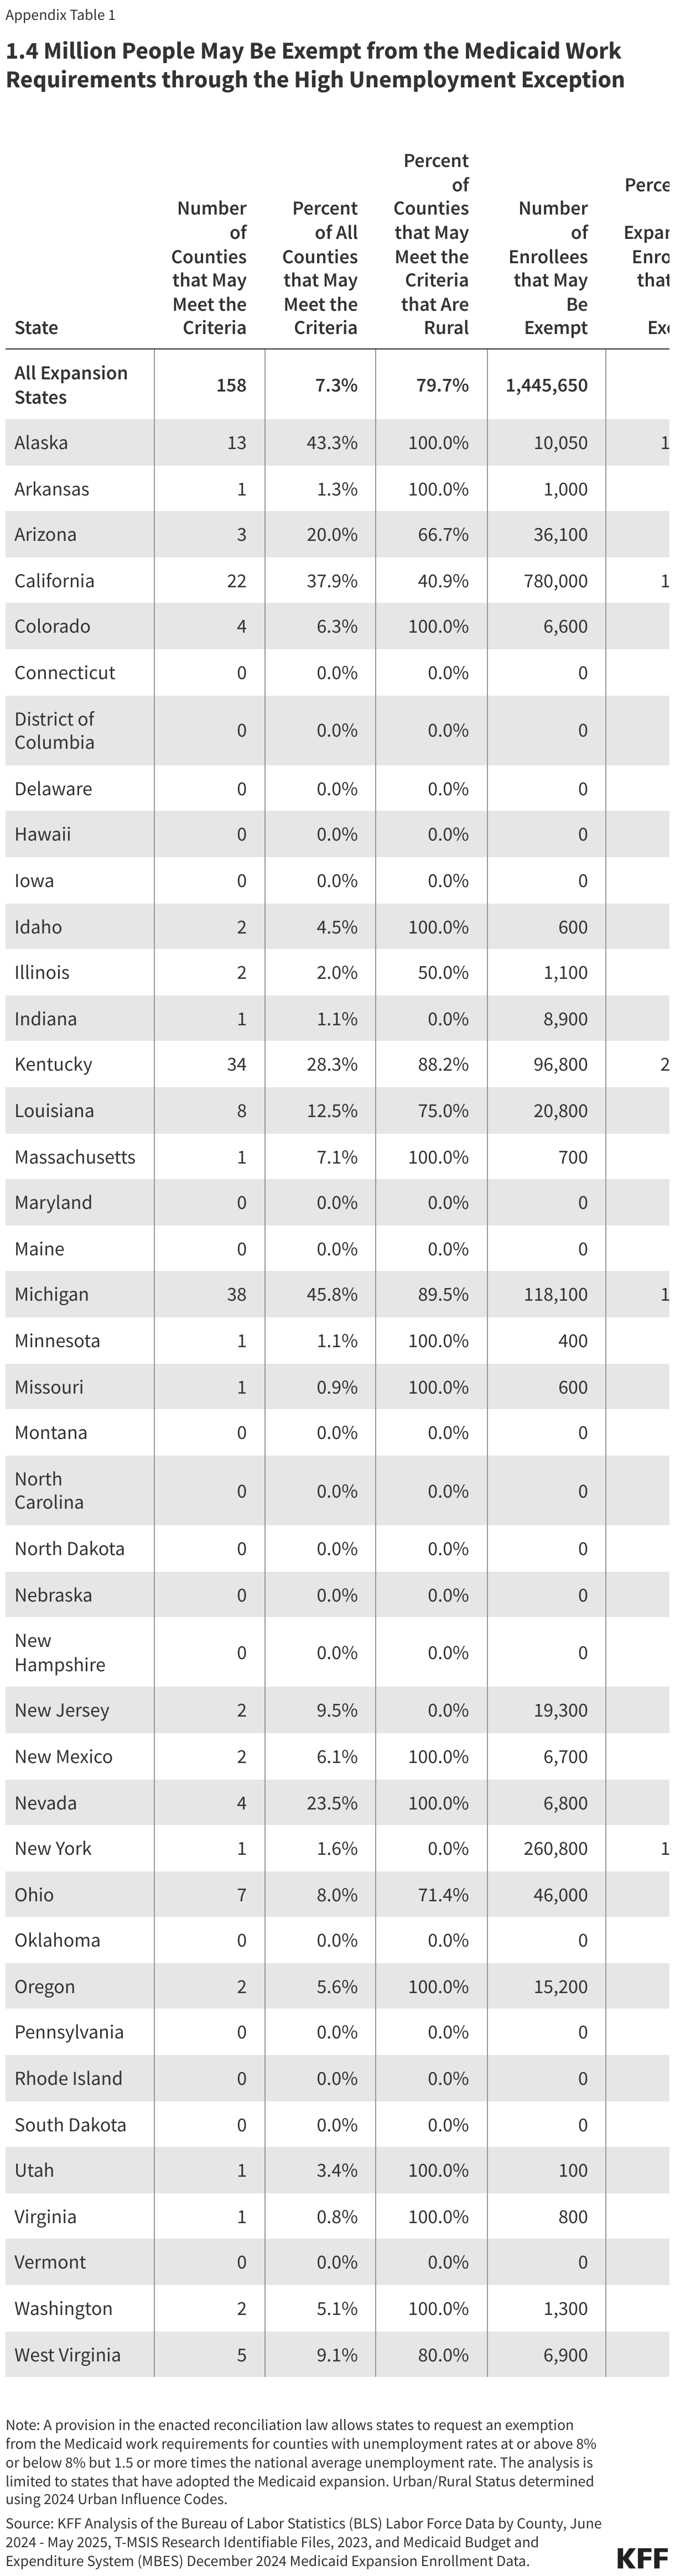
A decade after the implementation of the ACA coverage options, 10 states have not adopted the Medicaid expansion, leaving 1.4 million uninsured people without an affordable coverage option. A coverage gap exists in states that have not adopted the expansion for poor adults who earn too much to qualify for Medicaid coverage but not enough to be eligible for subsidies in the Marketplace.
Lawfully-present immigrants generally must meet a five-year waiting period after receiving qualified immigration status before they can qualify for Medicaid. States have the option to cover eligible children and pregnant people without a waiting period, and as of January 2025, 38 states have elected the option for children, and 32 states have taken up the option for lawfully-present pregnant individuals. Under current law, lawfully-present immigrants are eligible for Marketplace tax credits, including those who are not eligible for Medicaid because they have not met the five-year waiting period. Undocumented immigrants are ineligible for federally-funded coverage, including Medicaid and Marketplace coverage, although some states provide fully state-funded health coverage to these individuals.
Health care provisions in the 2025 reconciliation package narrow eligibility for federally-subsidized health coverage, including Medicaid and CHIP, Medicare, and Marketplace subsidies, to a limited group of lawfully-present immigrants. These changes take effect on January 1, 2027 and are expected to increase the number of lawfully residing immigrants without health coverage.
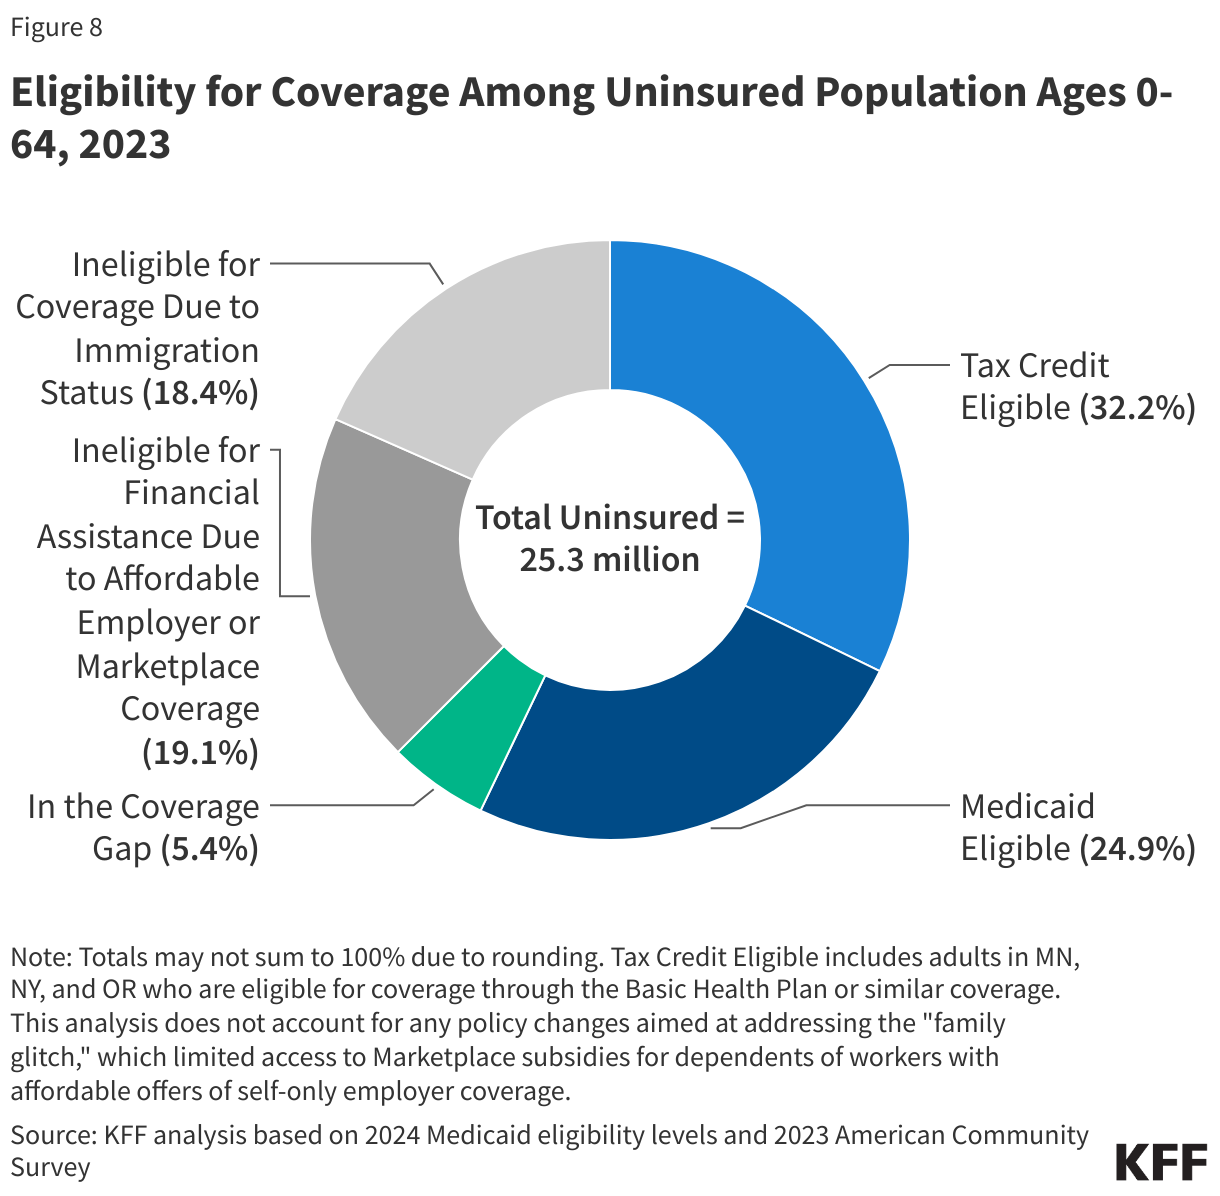
Though financial assistance is available to many of the remaining uninsured under the ACA, not everyone who is uninsured is eligible for free or subsidized coverage. Nearly 6 in 10 (14.5 million) uninsured individuals in 2023 were eligible for financial assistance through Medicaid or subsidized Marketplace coverage (Figure 8). However, over 4 in 10 uninsured (10.9 million) were outside the reach of the ACA because their state did not expand Medicaid, their immigration status made them ineligible, or they were deemed to have access to an affordable Marketplace plan or offer of employer coverage (Figure 8).
What are the Consequences of Being Uninsured?
Lacking health insurance in the United States can impact a person’s access to health care, their financial situation, and their health status. It can also broadly impact a community’s public health (illustrated by the COVID-19 pandemic) and the economy through lower productivity.
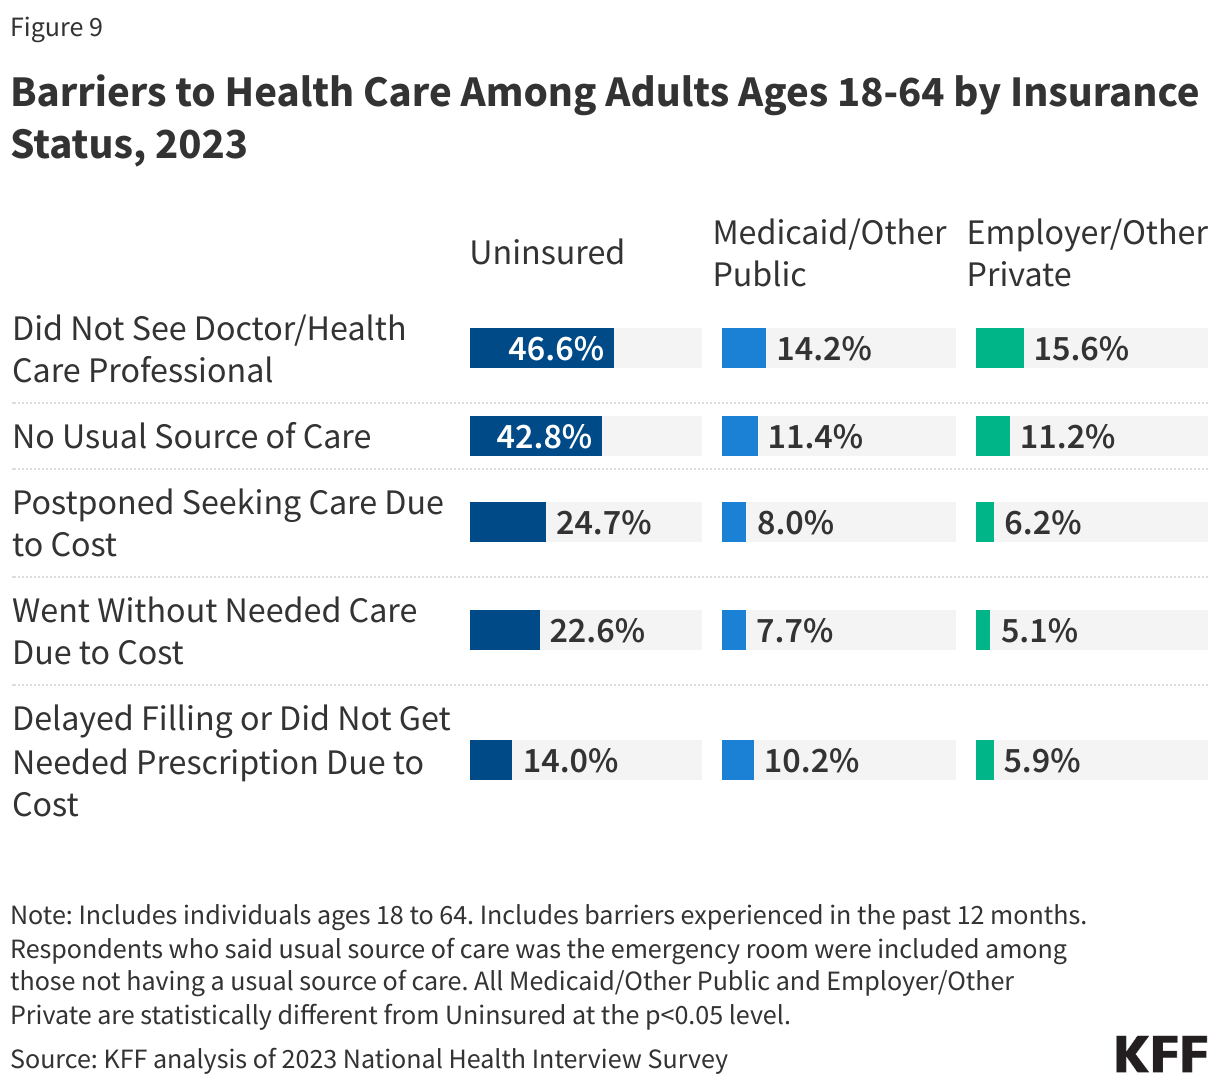
Adults who are uninsured are almost five times more likely than adults with insurance to report not having a usual source of care, which is often a key entry point for accessing health care whether for preventive services or for treating existing conditions. Consequently, in 2023, nearly half (46.6%) of uninsured adults ages 18-64 reported not seeing a doctor or health care professional in the past 12 months compared to 15.6% with private insurance and 14.2% with public coverage (Figure 9). Uninsured individuals are also more likely to face cost barriers to accessing needed care. In 2023, uninsured adults were nearly three times more likely to report not getting medical care due to cost compared to publicly insured adults and four times more likely than privately insured adults (22.6% vs 7.7% and 5.1%, respectively).
The lack of access to health care and a delay in seeking care due to costs mean uninsured people are more likely to be hospitalized for avoidable health problems and to experience declines in their overall health. Research also shows that when they are hospitalized, uninsured people receive fewer diagnostic and therapeutic services and have higher mortality rates than those with insurance.
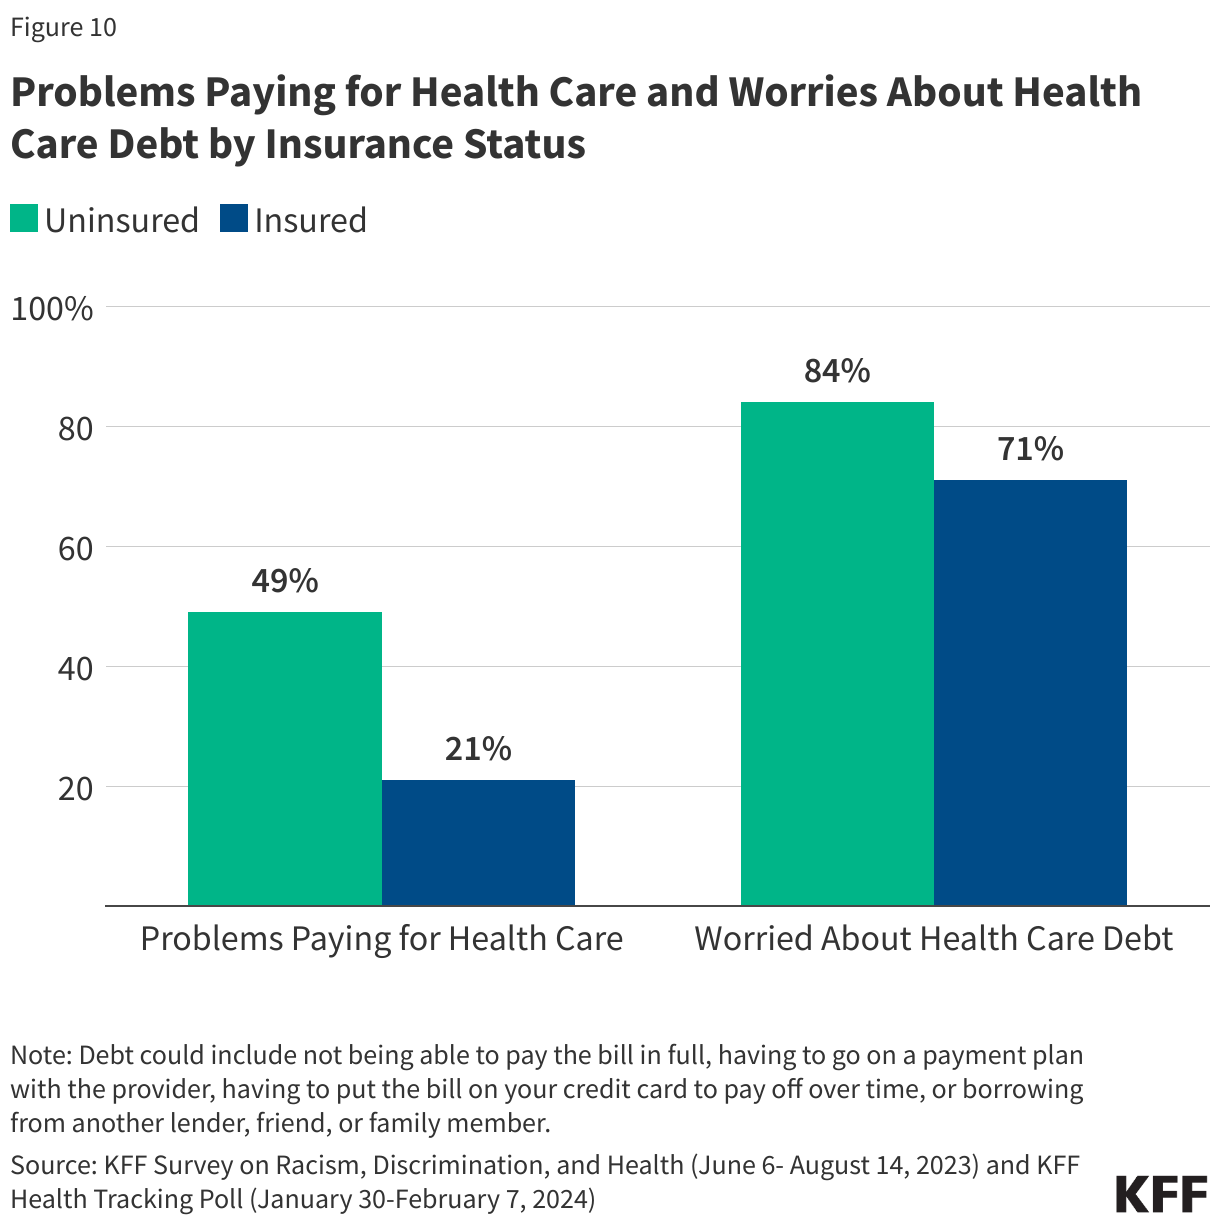
Uninsured individuals often face unaffordable medical bills when they do seek care, which can lead to medical debt and other forms of financial instability. Nearly half of uninsured adults reported difficulty paying for health care, compared to 21% of insured adults and over 8 in 10 (84%) uninsured adults said they worried that health care costs would put them in debt or increase their existing debt, compared to 71% of adults with insurance (Figure 10). Uninsured adults are also more likely to face negative consequences due to health care debt, such as using up savings, having difficulty paying other living expenses, or borrowing money.
Future Outlook
Driven by pandemic-era policies to promote health coverage, the number of people without insurance and the uninsured rate dropped to historic lows in recent years. Although millions of people lost Medicaid coverage during the unwinding of continuous enrollment, Medicaid enrollment remains higher than in February 2020, before the start of the pandemic. Enhanced Marketplace subsidies adopted during the pandemic led to record Marketplace signups, with enrollment topping 25 million in 2025. States have also taken action to reduce the number of people who are uninsured. In 2023, two states, North Carolina and South Dakota, newly adopted the Medicaid expansion, and several states have expanded state-funded coverage for certain individuals regardless of immigration status.
However, actions by Congress and the Trump Administration threaten to reverse these recent coverage gains. Congress passed the 2025 Federal Budget Reconciliation package on July 3, 2025, which makes significant changes to Medicaid and ACA Marketplaces, and President Trump signed the reconciliation package into law on July 4, 2025. The Congressional Budget Office (CBO) estimates that the law will increase the number of people without health insurance by 10 million. The expiration of the enhanced premium tax credits for Marketplace enrollees, which will happen at the end of 2025 unless Congress takes action to extend them, will further increase the number of people without health insurance. CBO projects that over 14 million more people will be uninsured in 2034 due to the combined effects of the reconciliation package and the expiration of the enhanced Marketplace subsidies. In addition to these potential coverage losses, the Trump administration’s increased immigration enforcement activities are likely to have a broad chilling effect that could cause immigrants to decide to disenroll or not enroll themselves or their children, most of whom are U.S. citizens, in health coverage programs even if they are eligible due to immigration-related fears.
Enactment of the ACA helped close some gaps in our fragmented health coverage system and led to a significant decline in the number of people who were uninsured. Recent efforts built on that success to further shrink the share of people without insurance. Yet, despite this success and the ACA’s continued favorability—the public has a favorable view of the ACA by a 2 to 1 margin—policymakers enacted cuts to federal support for Medicaid and ACA coverage to fund other budget priorities. The impact on health coverage and people’s ability to access needed health care services will be significant.
Resources
- Key Facts about the Uninsured Population
- How Many Uninsured Are in the Coverage Gap and How Many Could be Eligible if All States Adopted the Medicaid Expansion?
- A Closer Look at the Remaining Uninsured Population Eligible for Medicaid and CHIP
- Health Coverage by Race and Ethnicity, 2010-2023
- Key Facts on Health Coverage of Immigrants
- How Does Cost Affect Access to Health Care?
- State-Funded Health Coverage for Immigrants
- How Will the One Big Beautiful Bill Act Affect the ACA, Medicaid, and the Uninsured Rate?
Citation
Tolbert, Jennifer, Bell, Clea, Cervantes, Sammy & Singh, Rakesh, The Uninsured Population and Health Coverage. In Altman, Drew (Editor), Health Policy 101, (KFF, October 2025) https://www.kff.org/health-policy-101-the-uninsured-population-and-health-coverage/ (date accessed).
 Emma Wager
  Cynthia Cox
  Stephanie Oum
  Kellie Moss
  Jennifer Kates
 Larry Levitt
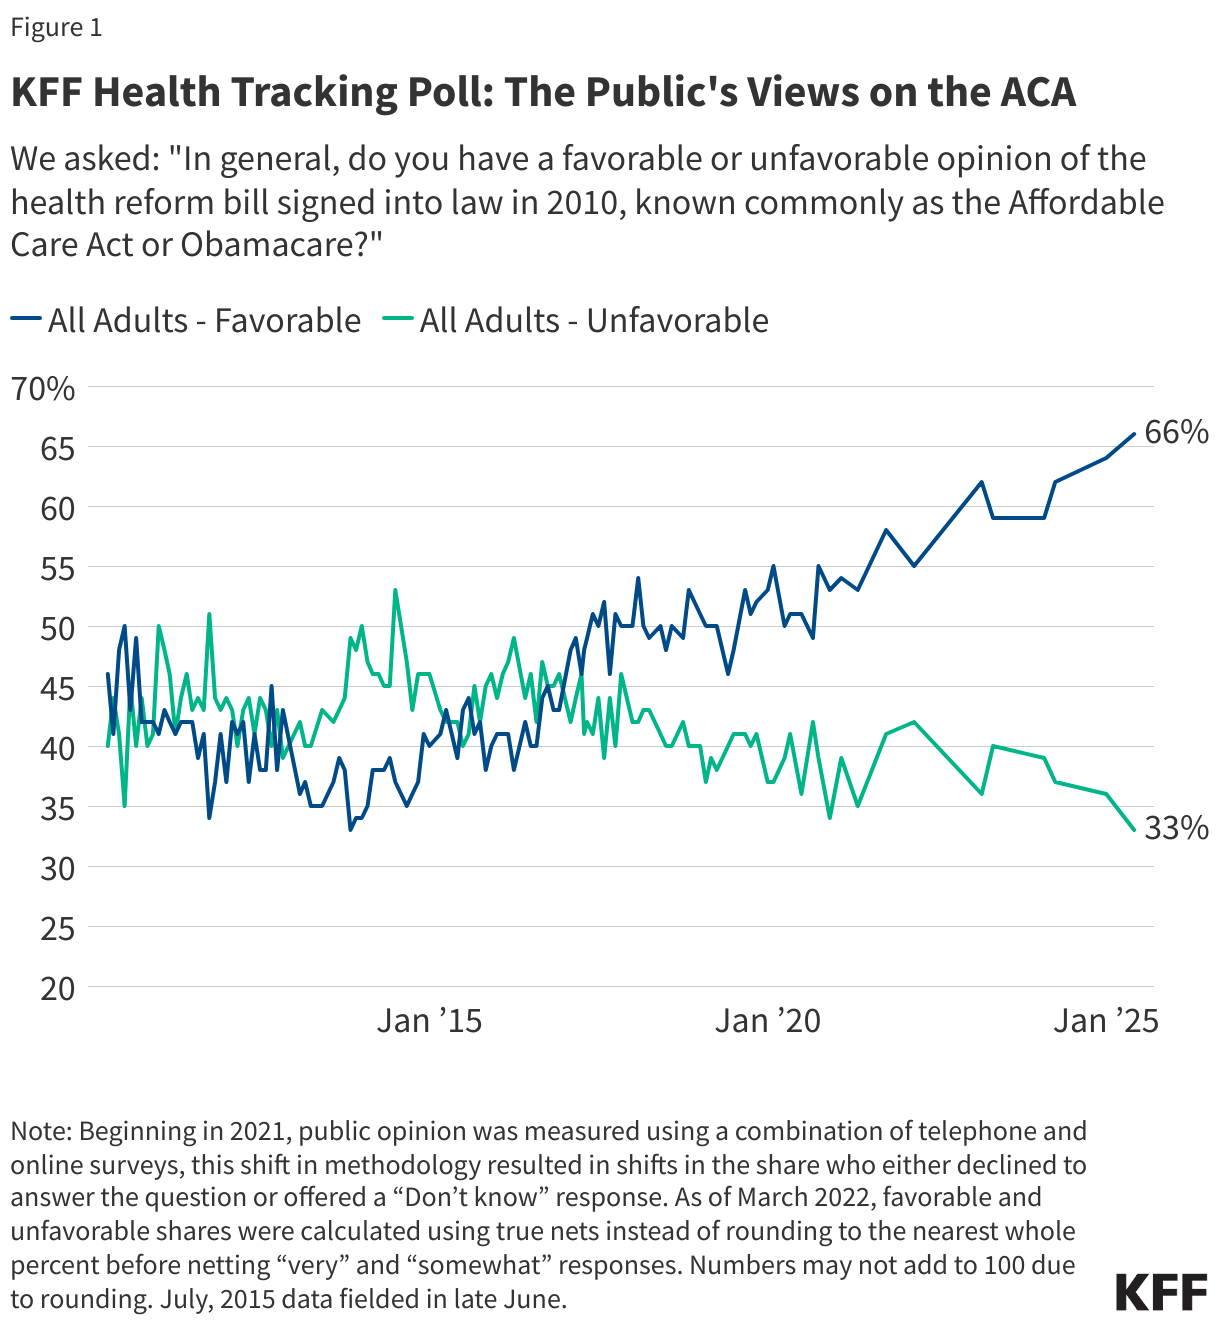
 Juliette Cubanski
  Meredith Freed
  Nancy Ochieng
  Alex Cottrill
  Jeannie Fuglesten Biniek
  Tricia Neuman