VOLUME 15
Skepticism About Vaccines and Response to Bird Flu
This is Irving Washington and Hagere Yilma. We direct KFF’s Health Information and Trust Initiative and on behalf of all of our colleagues at KFF, we’re pleased to bring you this edition of our bi-weekly Monitor.
KFF Authors:
 Irving Washington
  Hagere Yilma
 Summary
This volume shares key findings from the latest KFF Tracking Poll on Health Information and Trust, along with updates from Robert Kennedy Jr.’s senate hearings. We also examine narratives that reflect distrust in public health messaging about bird flu, motivations for sharing information online, and how fraudulent research can sometimes inform AI chatbot models.
Featured: Latest KFF Poll Shows Declining Trust in Government Health Agencies
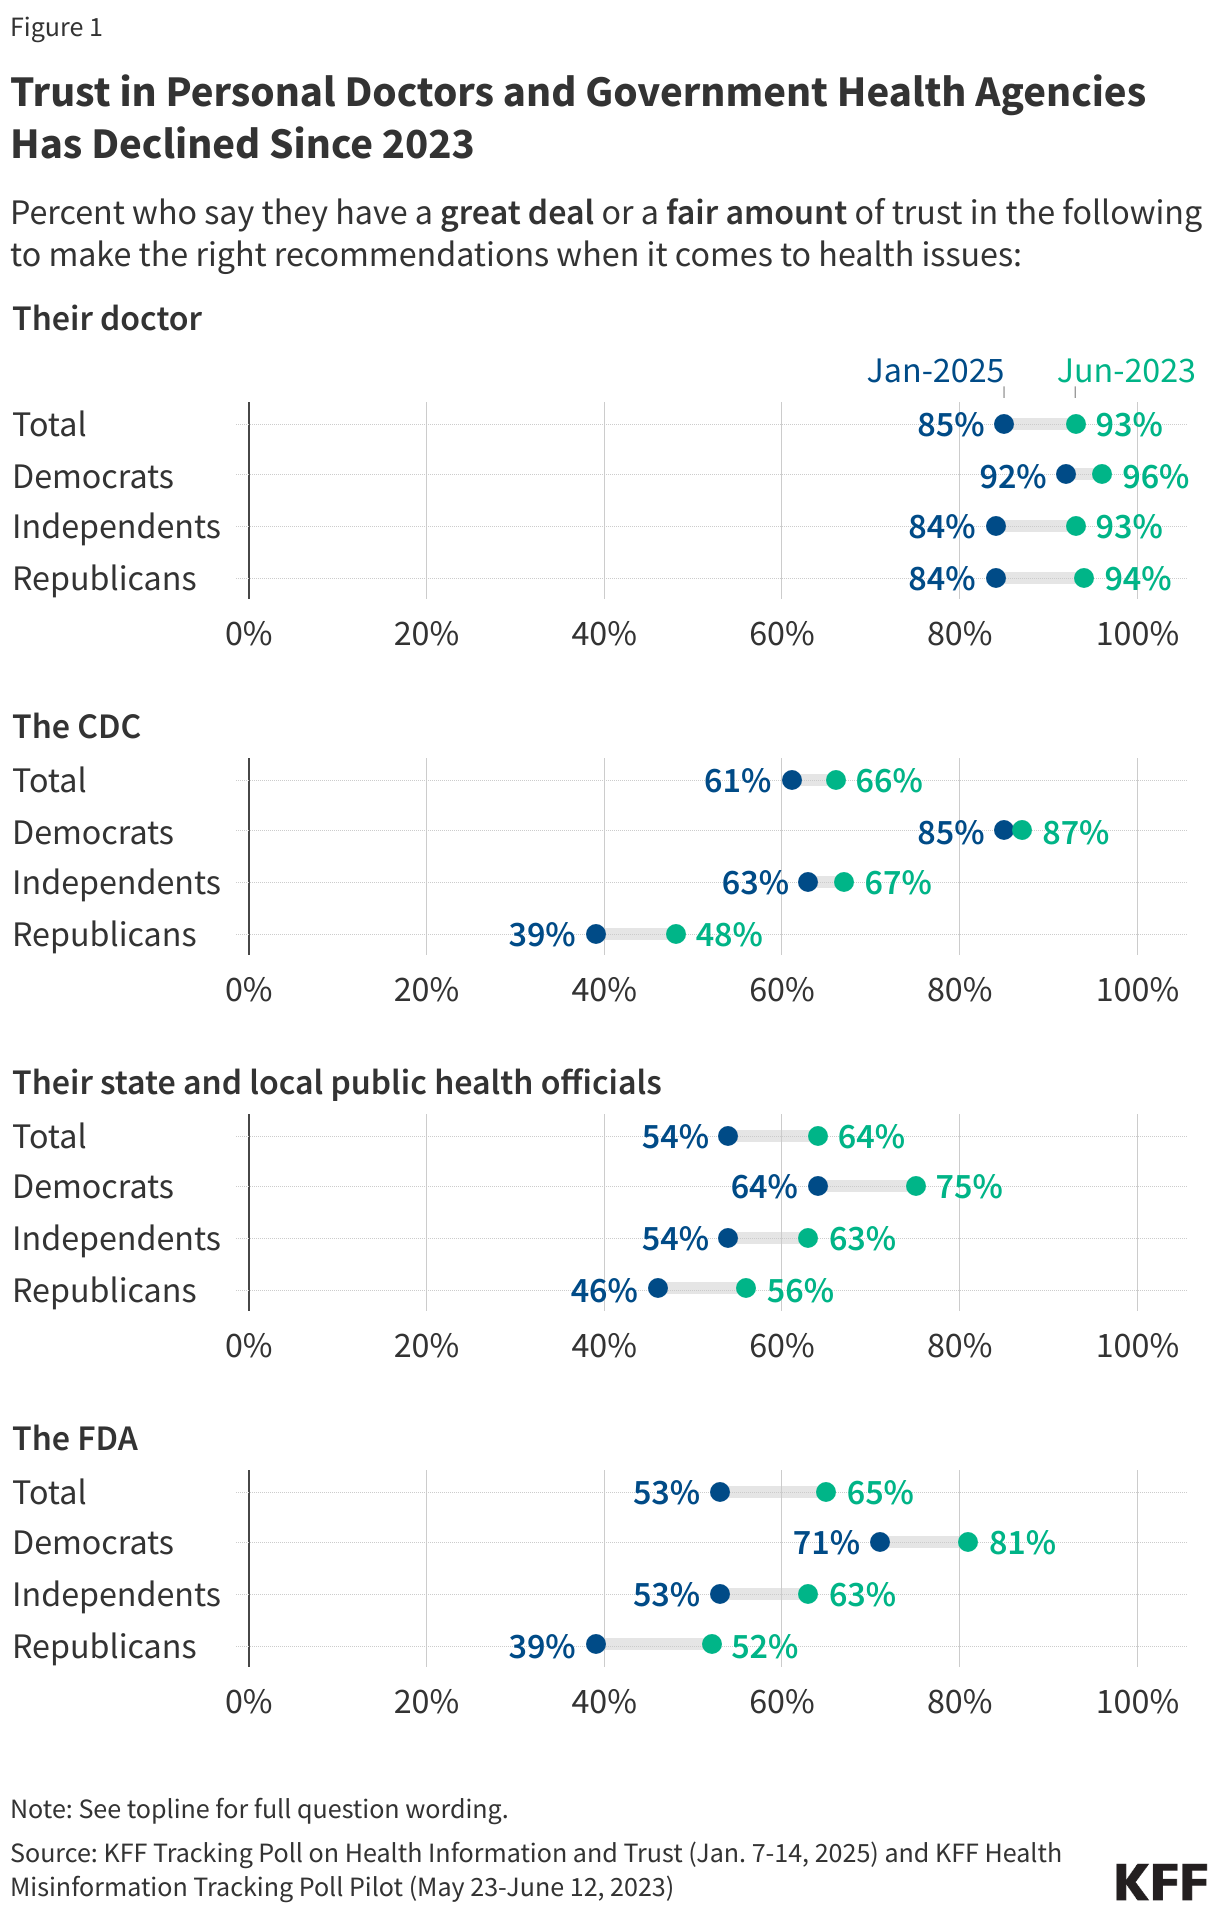
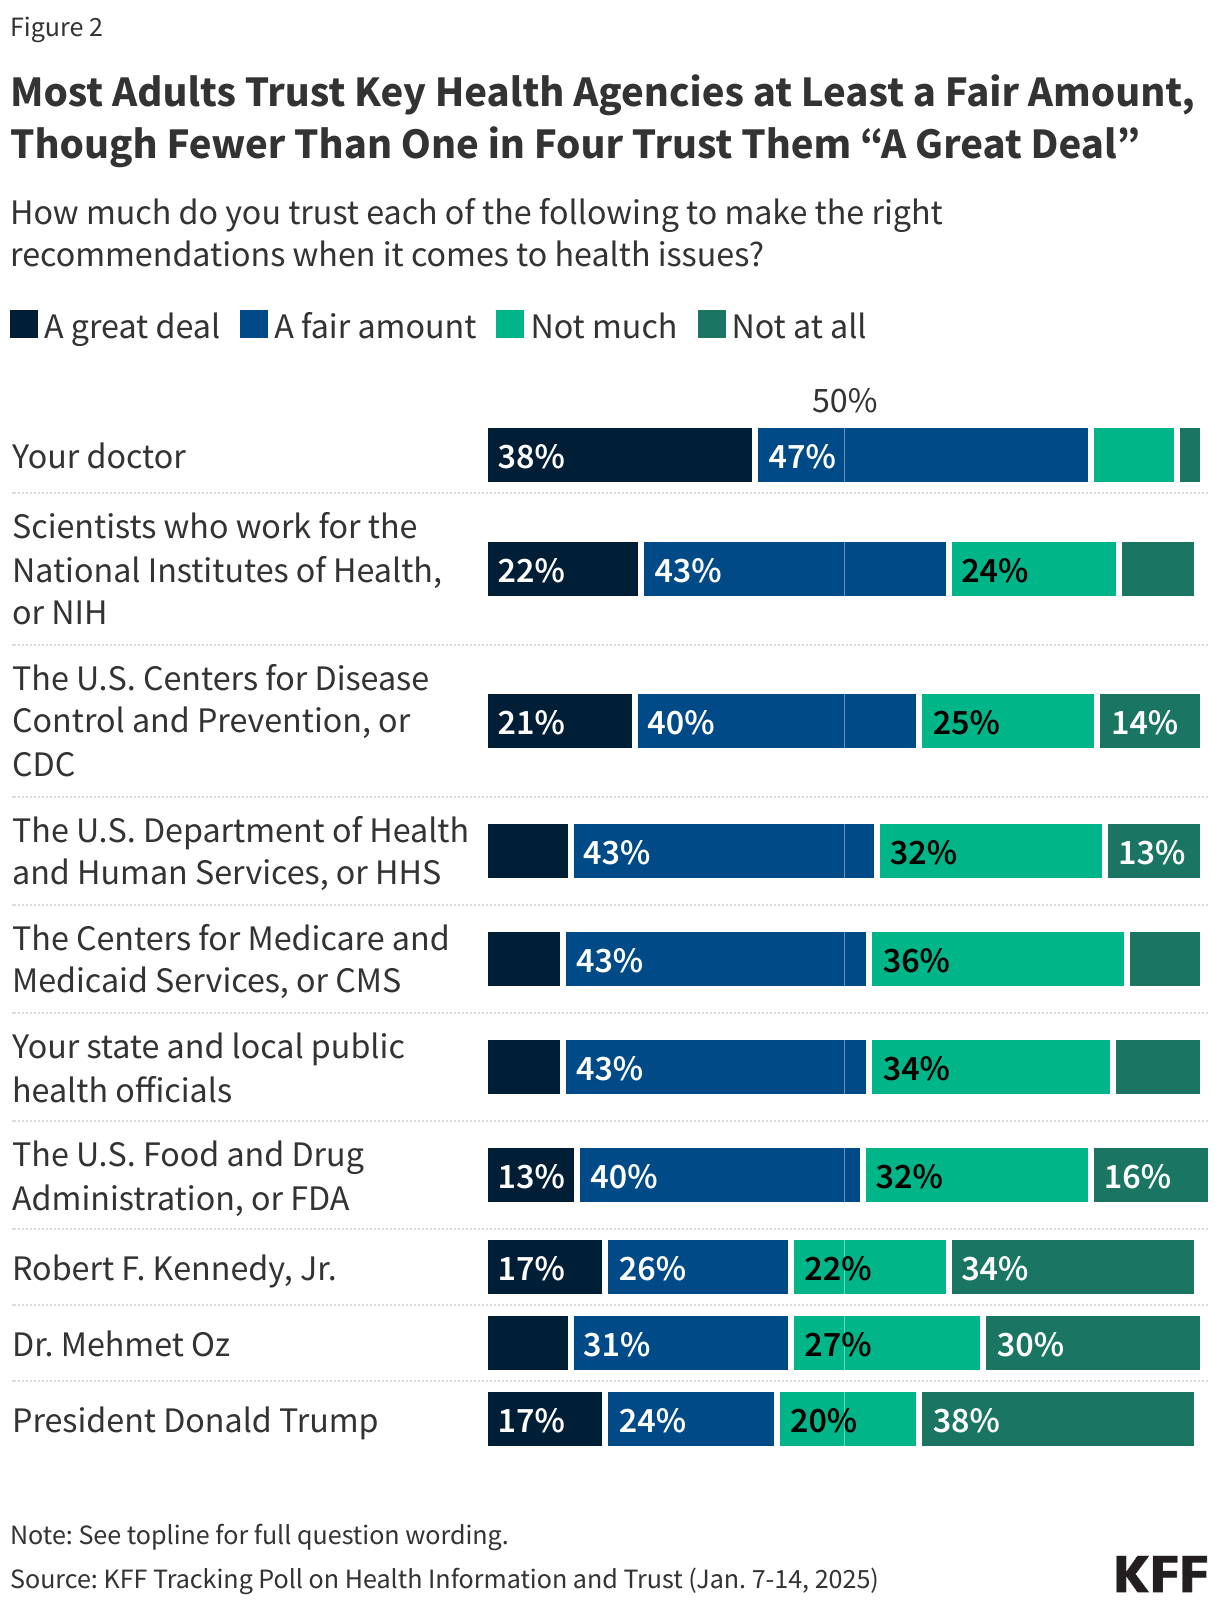
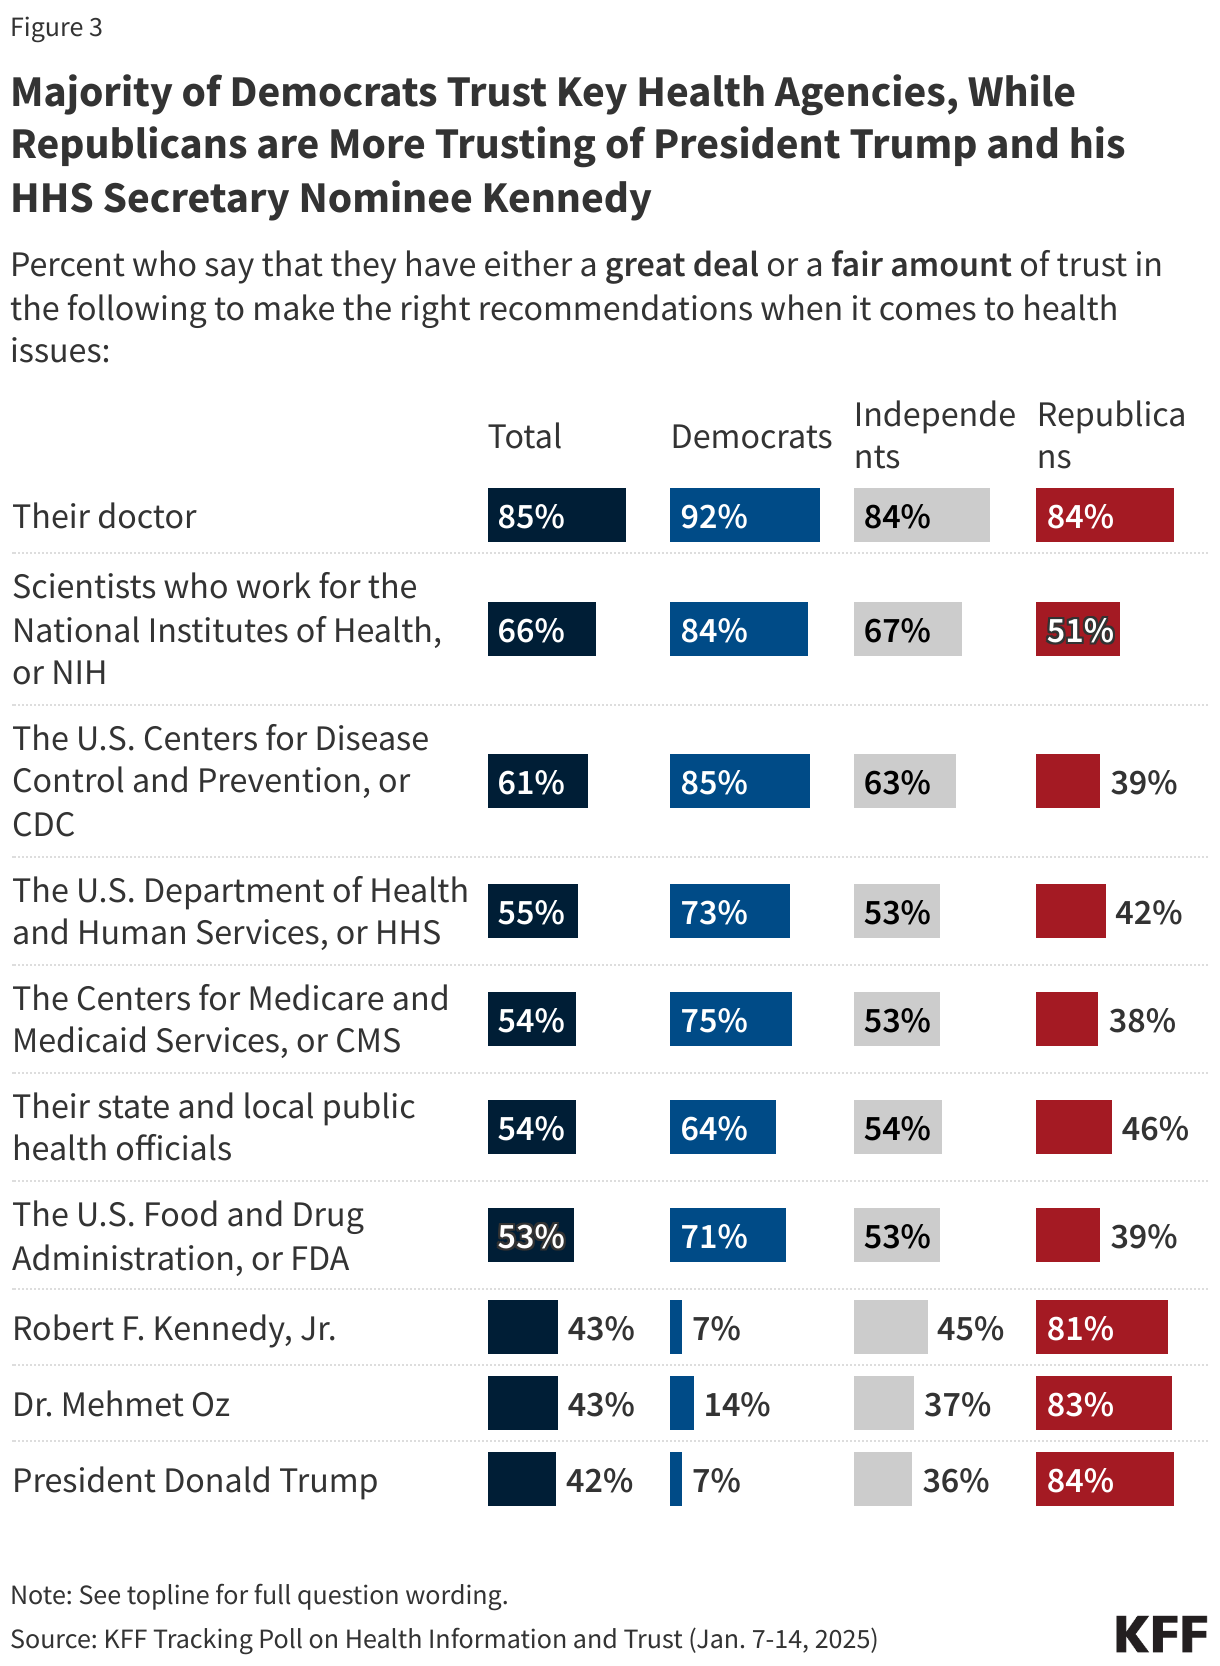
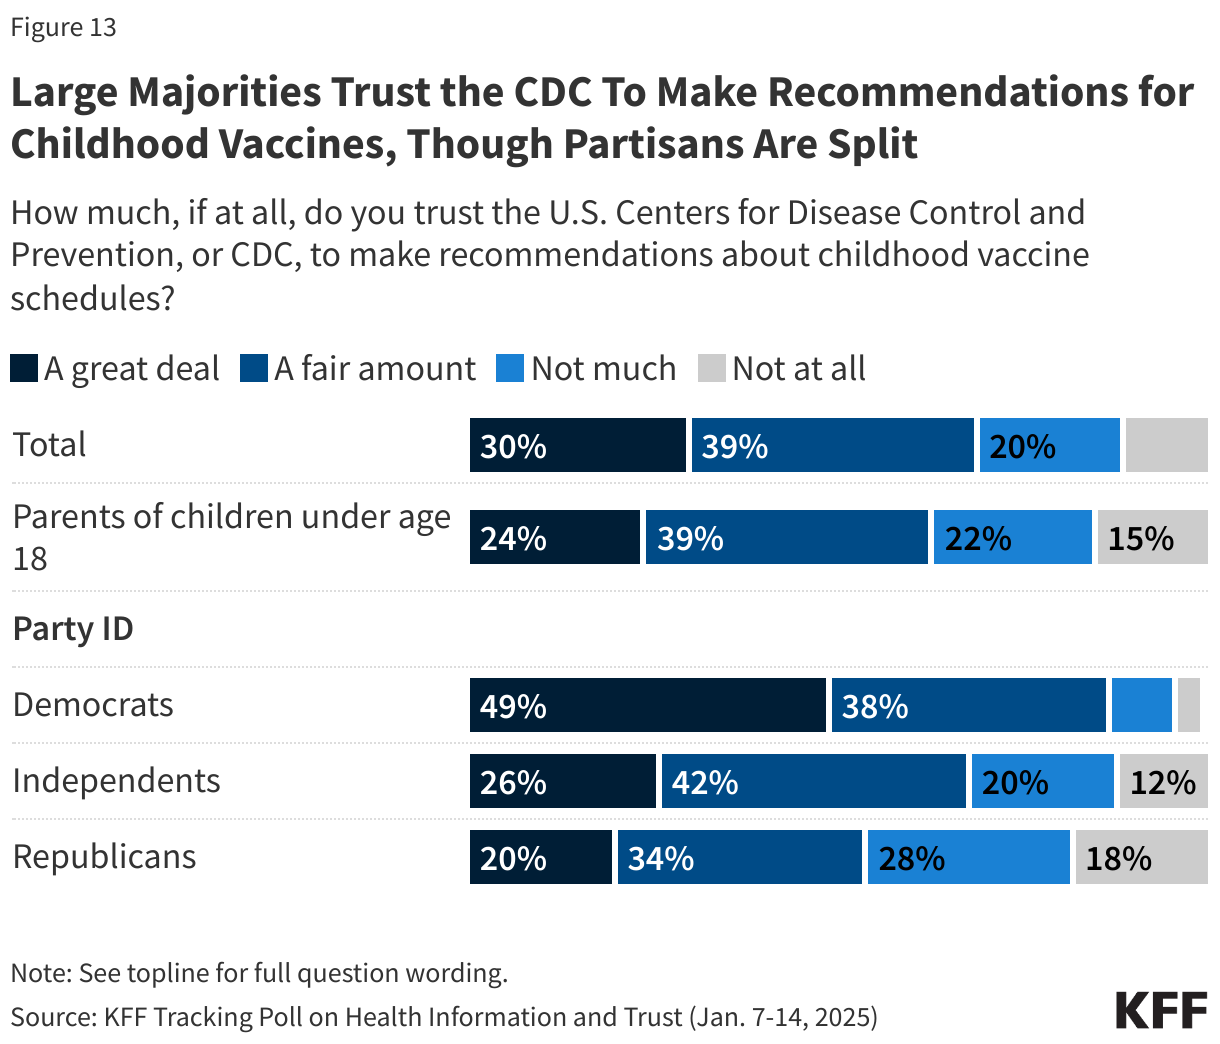
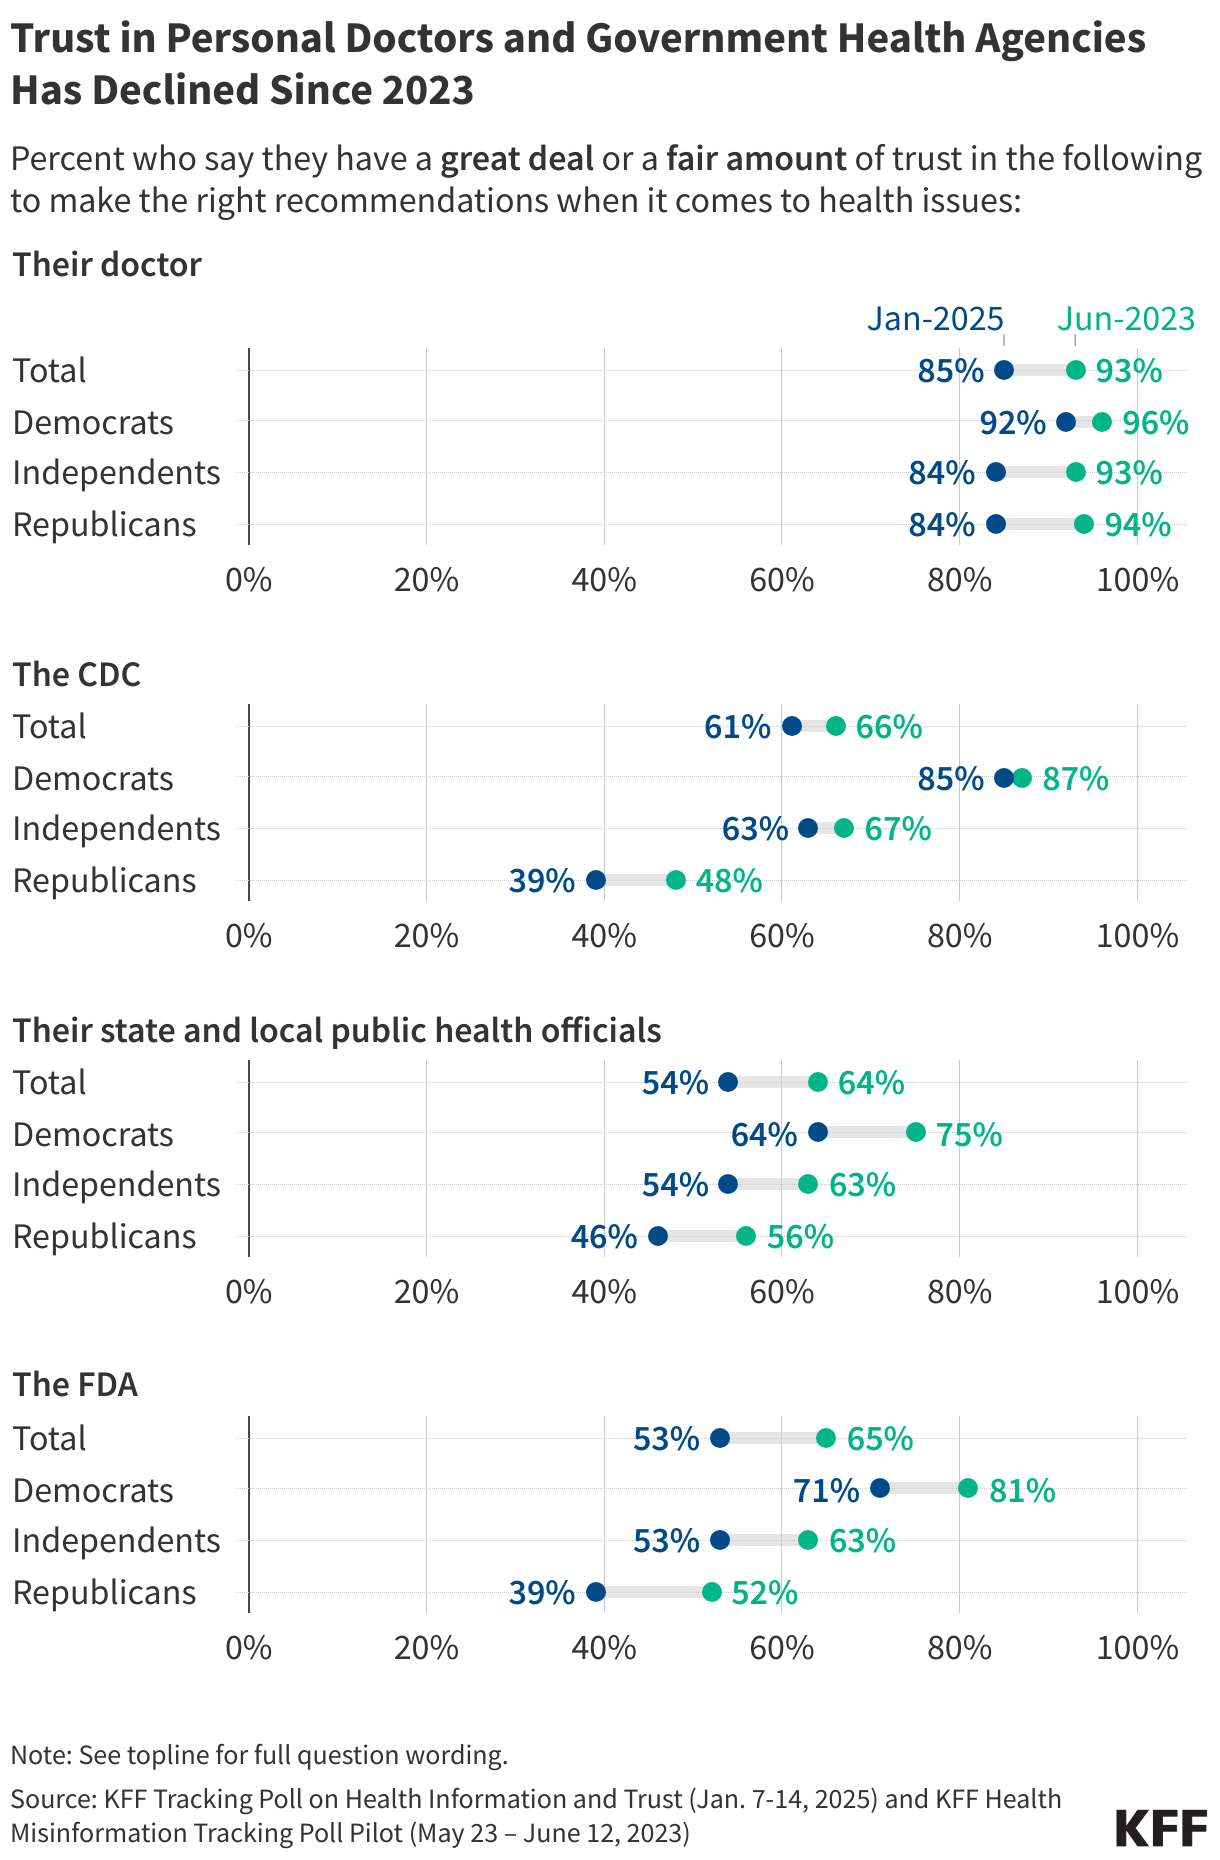
KFF’s latest Tracking Poll on Health Information and Trust shows declining public trust in key government health agencies with divisions along partisan lines, a continuation of a trend beginning during the COVID-19 pandemic. Compared to KFF polling from June 2023, fewer adults now say they have a “great deal” or a “fair amount” of trust in the CDC (from 66% to 61% in the latest poll), FDA (from 65% to 53%), or their state and local public health officials (from 64% to 54%) to make the right recommendations when it comes to health issues. Trust in government health agencies is divided along partisan lines, with Republicans far less likely than Democrats and independents to say they trust each of these agencies. On the other hand, about eight in ten Republicans trust President Trump, Robert F. Kennedy, Jr., and Dr. Mehmet Oz, compared to closer to one in ten Democrats.
While doctors remain the most trusted source of health recommendations among the public, this share has also decreased by eight percentage points overall, driven largely by declining trust among Republicans and independents.
Recent Developments
Senate Questions Kennedy on Vaccine Views Amid Rising Parental Vaccine Hesitancy
Robert F. Kennedy Jr. appeared before the Senate Finance Committee on Wednesday, January 29th and the Senate Committee on Health, Education, Labor, and Pensions on Thursday, January 30th for his confirmation hearings as the nominee for Department of Health and Human Services (HHS) Secretary. During the hearings, senators raised questions about Kennedy’s history of casting doubt on vaccines, including his past claims about the safety and efficacy of COVID-19, measles, and polio vaccines. Kennedy framed his position as pro-safety rather than an outright opposition to vaccines, stating that all his children are fully vaccinated. However, some senators challenged this characterization, citing his financial gains from lawsuits against vaccine manufacturers and suggesting political or financial motives for questioning vaccine safety. A KFF policy watch explains the influence Kennedy could have over vaccine approval processes, recommendations, and advisory committees as HHS Secretary. Kennedy would oversee a department that not only approves and recommends vaccines, but also one with programs providing health coverage to over half the population.
Polling Insight:
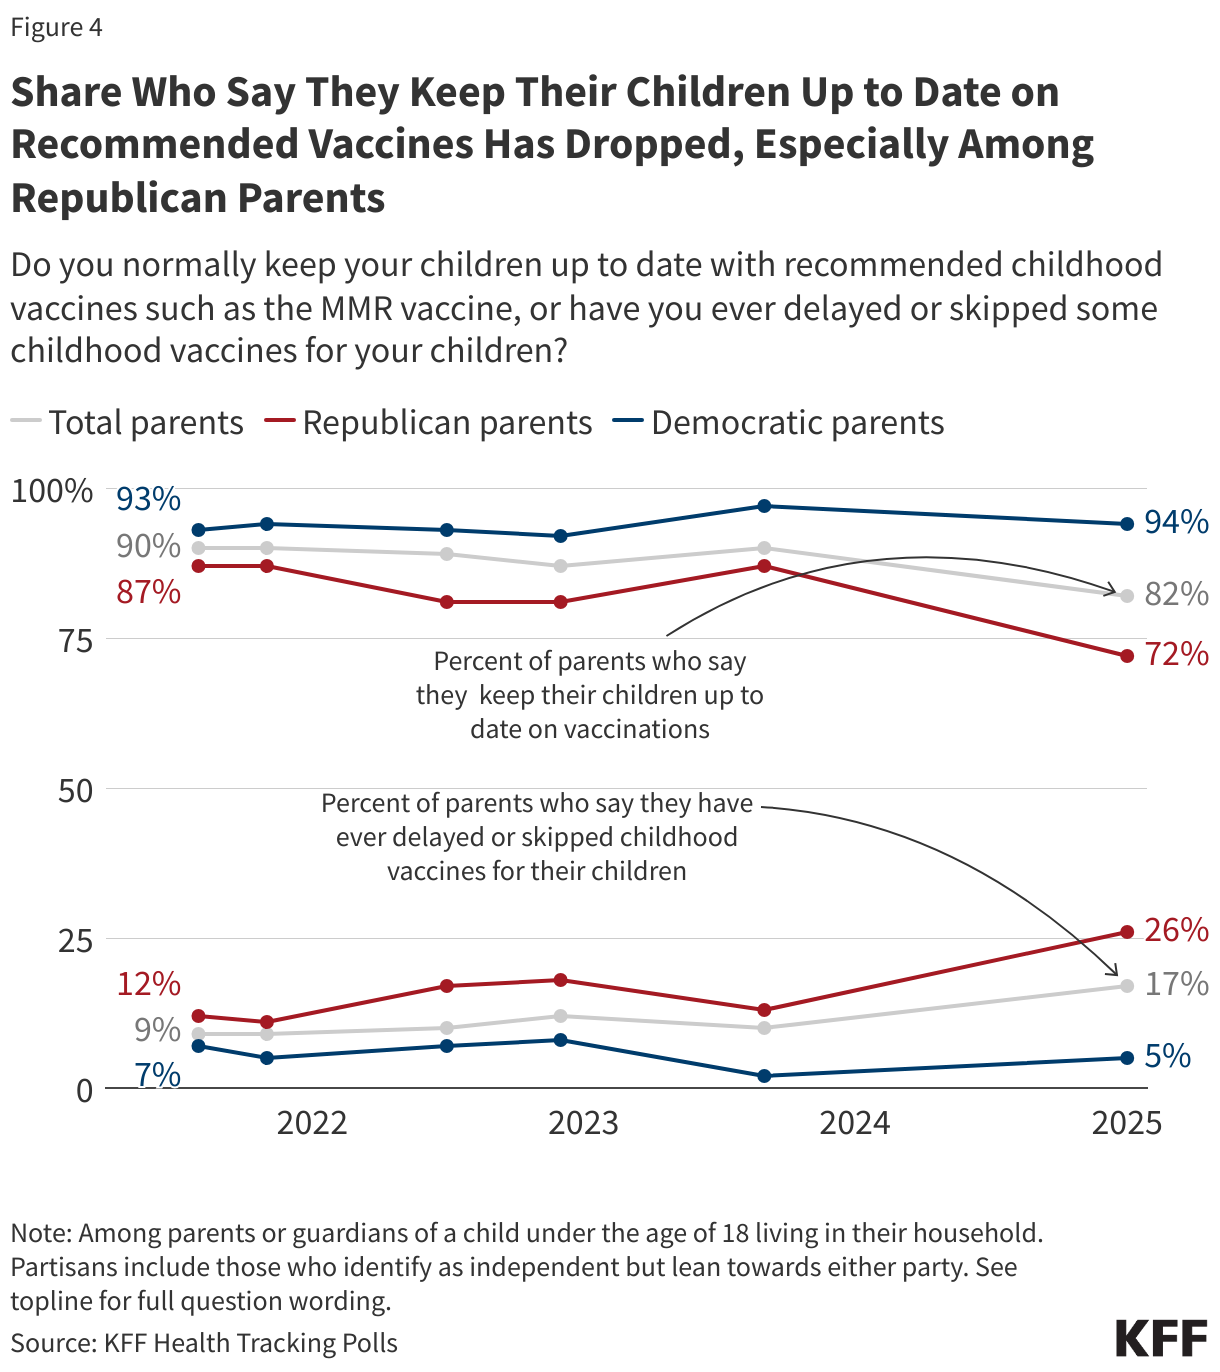
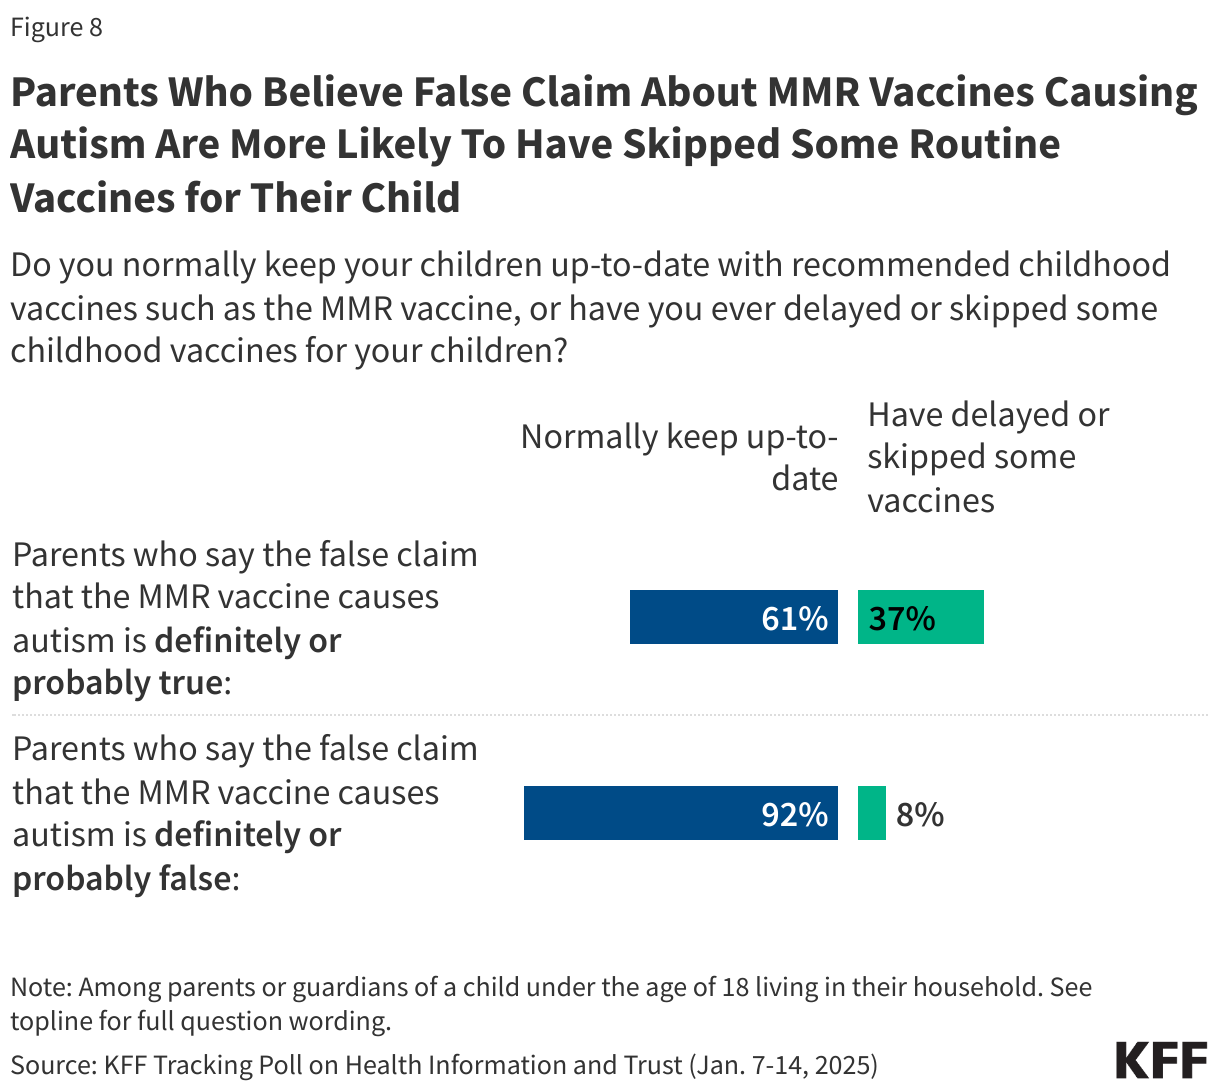
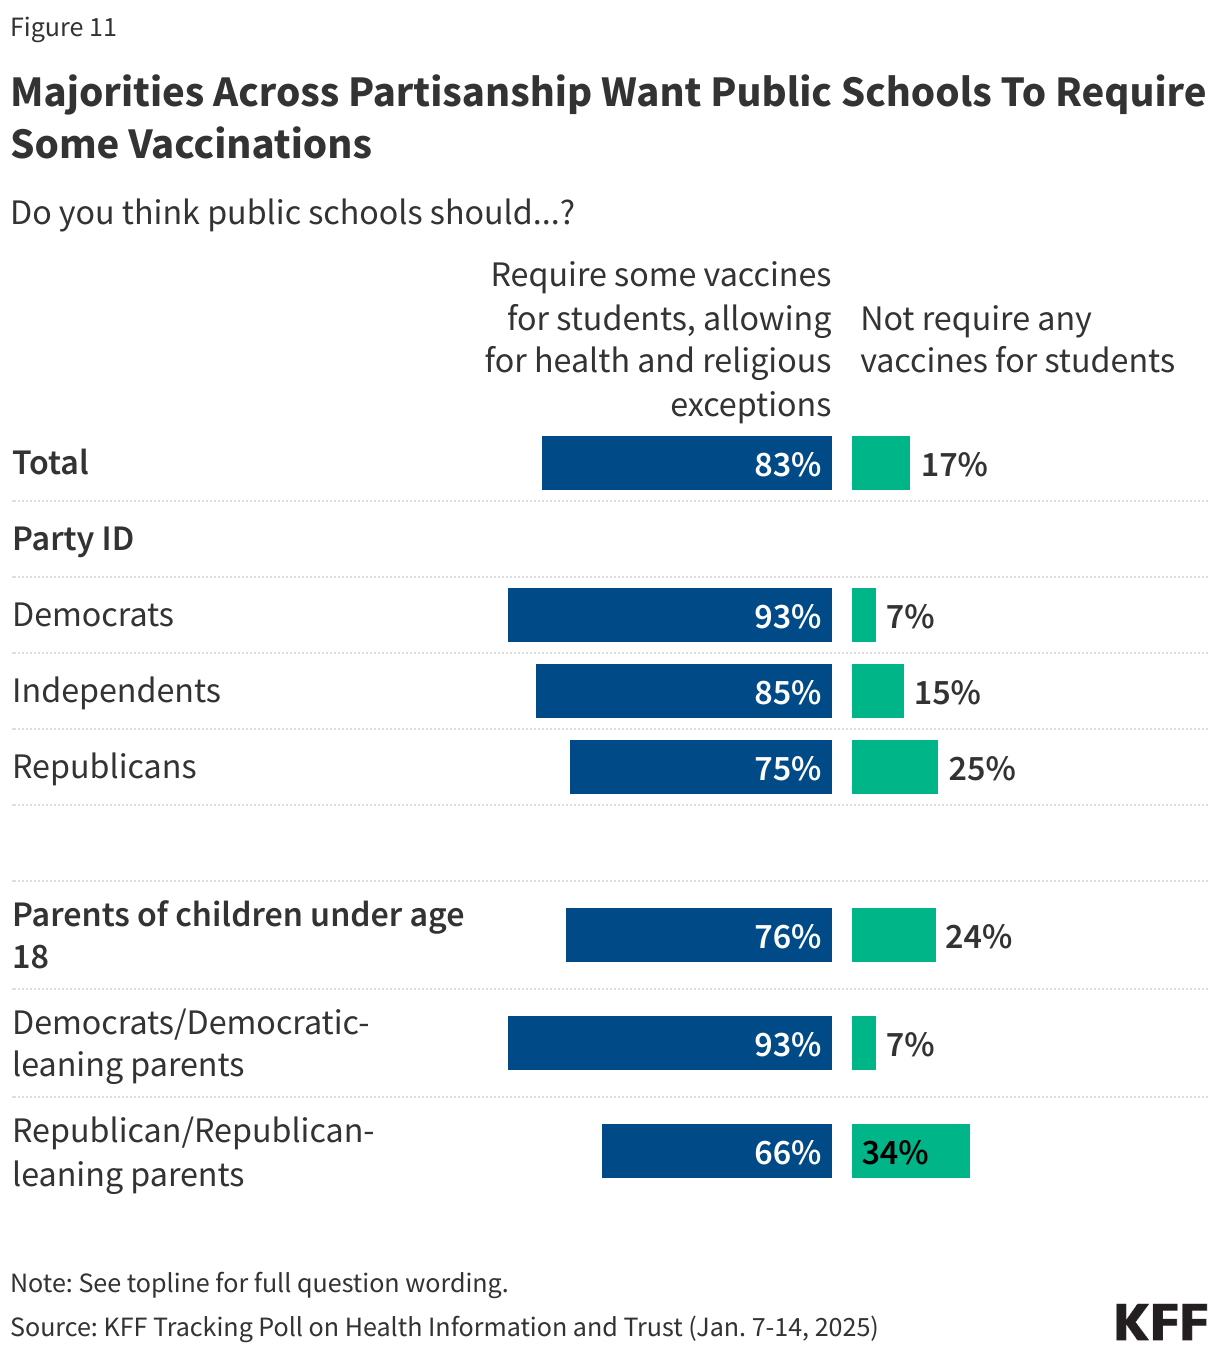
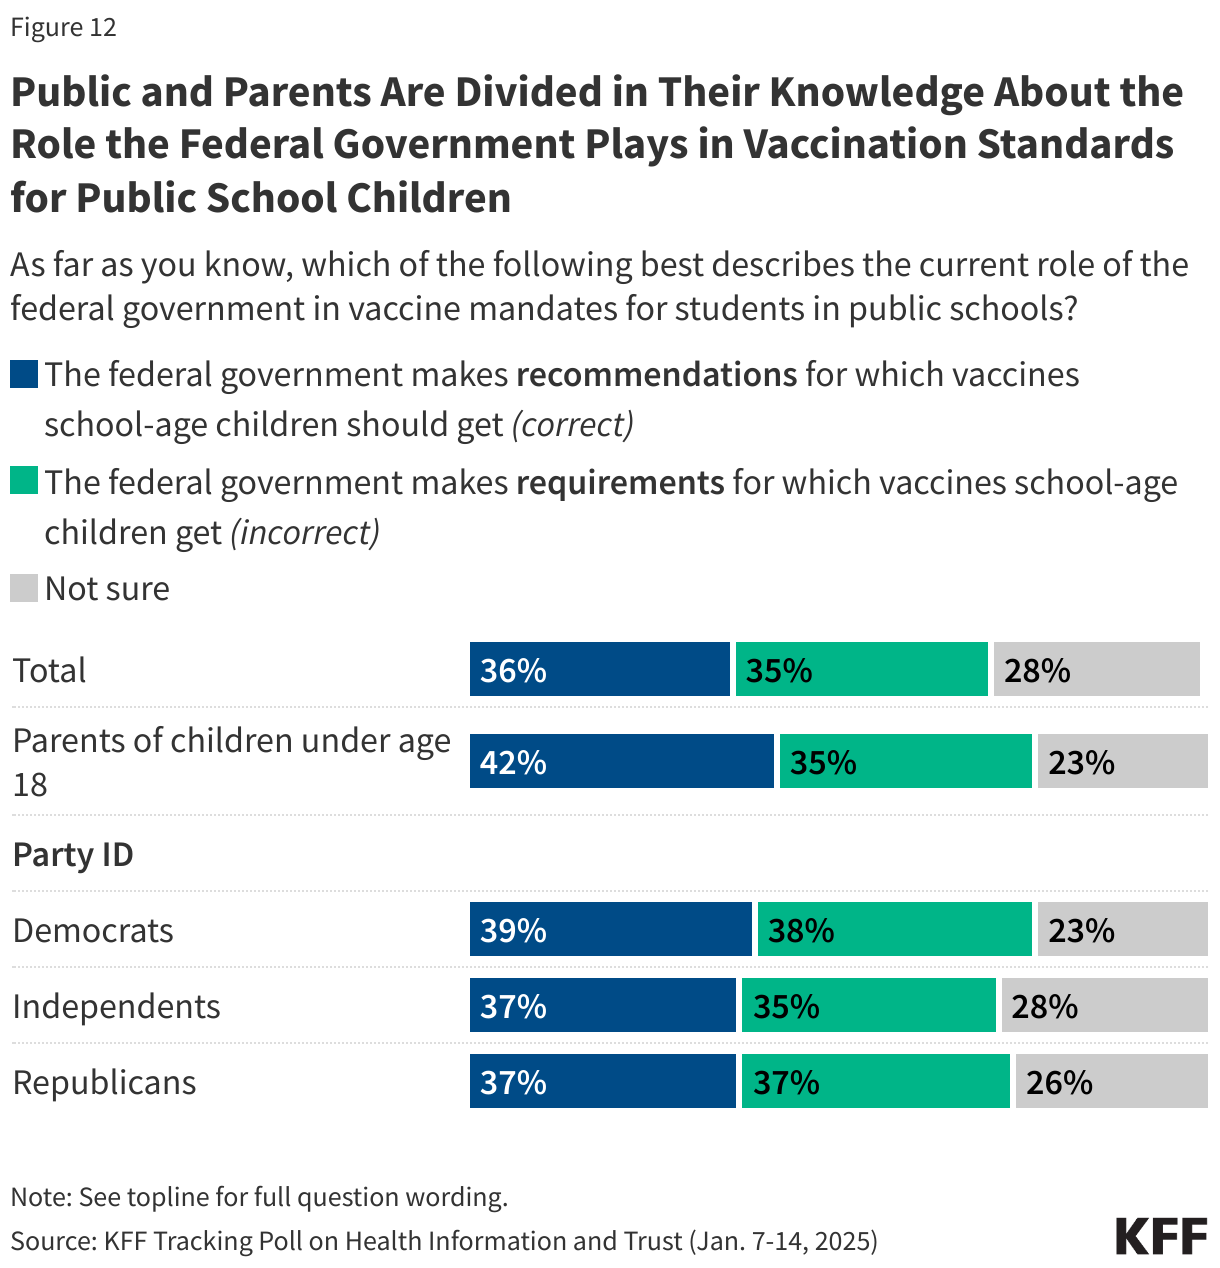
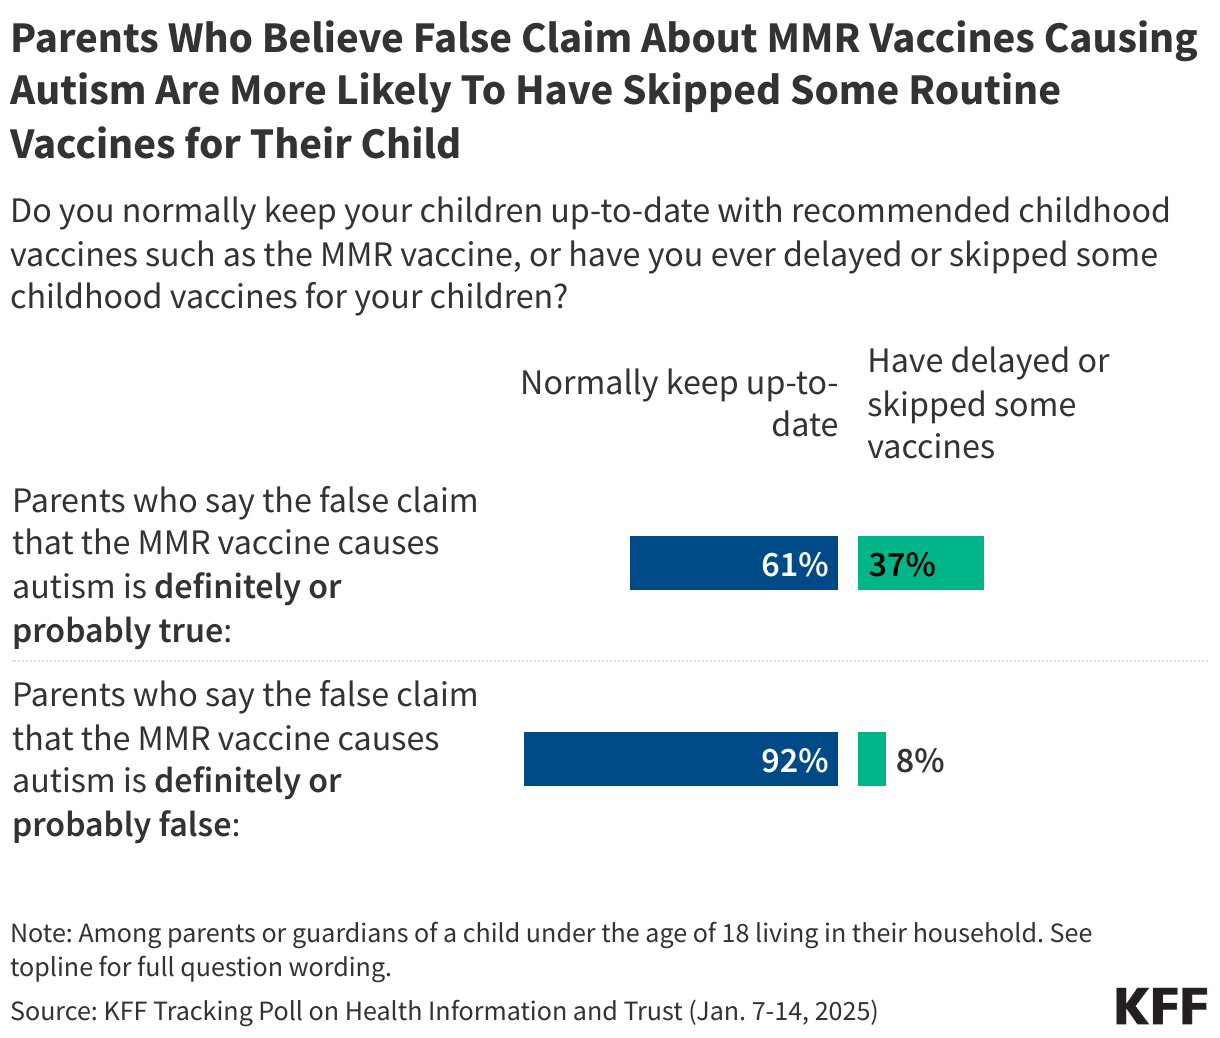
The concerns raised at the hearings come amid broader discussions about vaccine safety. While large shares of the public continue to express positive attitudes toward childhood vaccines and school vaccination requirements, KFF’s latest Tracking Poll on Health Information and Trust shows larger shares of parents now report delaying or skipping recommended vaccines for their children. Nearly one in five (17%) parents now say they have ever delayed or skipped some recommended vaccines, such as the MMR vaccine, for their children – an increase of seven percentage points since September 2023.
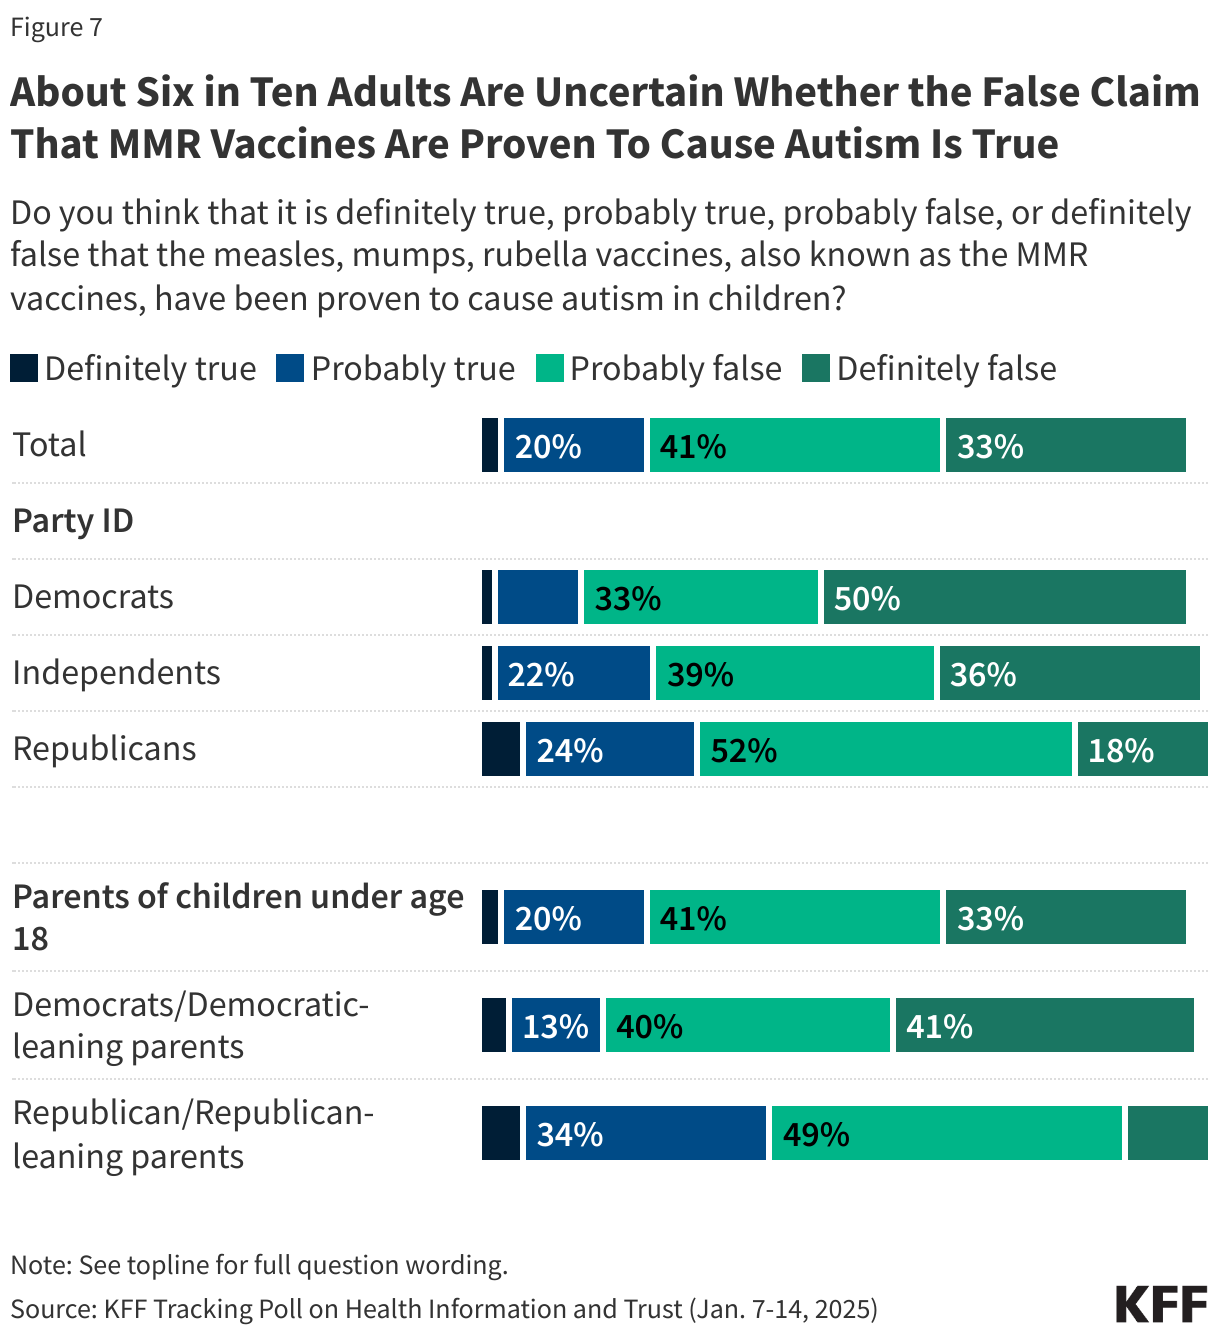
The false claim that the MMR vaccines have been proven to cause autism continues to persist, with most adults – including most parents – falling in the “malleable middle,” expressing some level of uncertainty about whether this claim is true or false. Parents who believe or are open to believing the falsehood that the MMR vaccines have been proven to cause autism are about four times as likely as those who say this myth is definitely or probably false to report delaying or skipping vaccines for their children (37% vs. 8%).
Vaccine Skepticism Towards Existing and Potential Bird Flu Vaccines

As bird flu spreads among animals and raises concerns about the potential for future human transmission, the Department of Health and Human Services, under the Biden Administration, announced that it is investing another $590 million to expedite the development of Moderna’s mRNA-based bird flu vaccines. However, misinformation and skepticism surrounding bird flu vaccines persist online, often misrepresenting data and undermining trust. KFF monitoring of online conversations about bird flu reveals narratives that have focused on Audenz, a bird flu vaccine that was approved by the FDA in 2020. Concerns that Audenz caused one in 200 clinical trial participants to die circulated widely on social media, pointing to a 2021 clinical trial that found some deaths (<1%) among adult participants but determined no link to the vaccine. The study’s researchers concluded, “No adult deaths were vaccine-related, and the frequency of these events was in line with U.S. mortality statistics for the age groups in question.” The misrepresentation of clinical data has stoked fear about vaccine safety before, as similar misrepresentations of deaths during COVID-19 clinical trials raised concern about the Pfizer’s COVID-19 vaccines in previous years.
In addition to misrepresenting data, online narratives often raise concerns about vaccine ingredients, reiterate resistance to bird flu vaccines, and oppose future public health measures. Some users also share anecdotes about alleged vaccine injuries from COVID-19 vaccines to argue that bird flu vaccines would cause similar harm. One online post, which received thousands of likes and reposts, said “We are not masking up. We are not PCR testing. We are not socially distancing. We are not getting mRNA vaccines. We are not locking down.” Many comments echoed this sentiment, questioned the need for public health measures, or expressed solidarity with those resisting public health guidance.
Polling Insight:
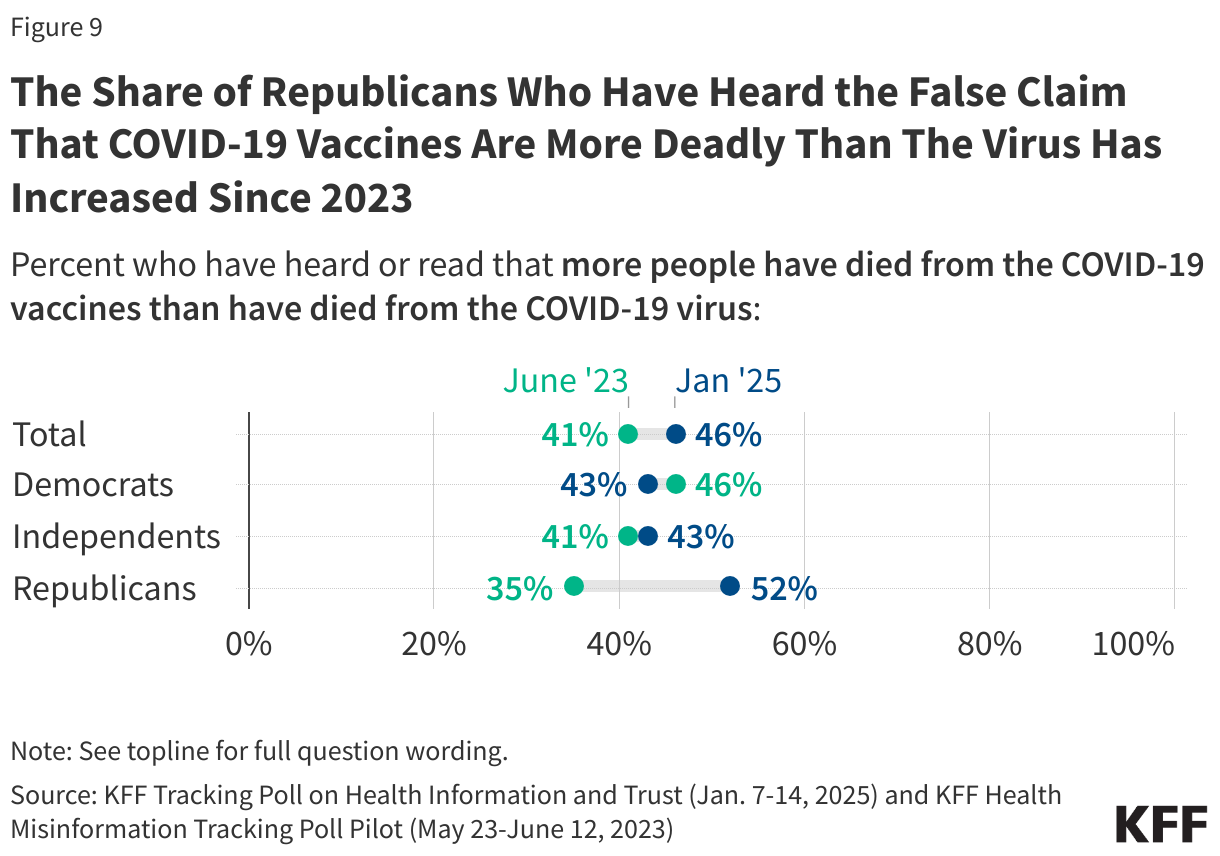
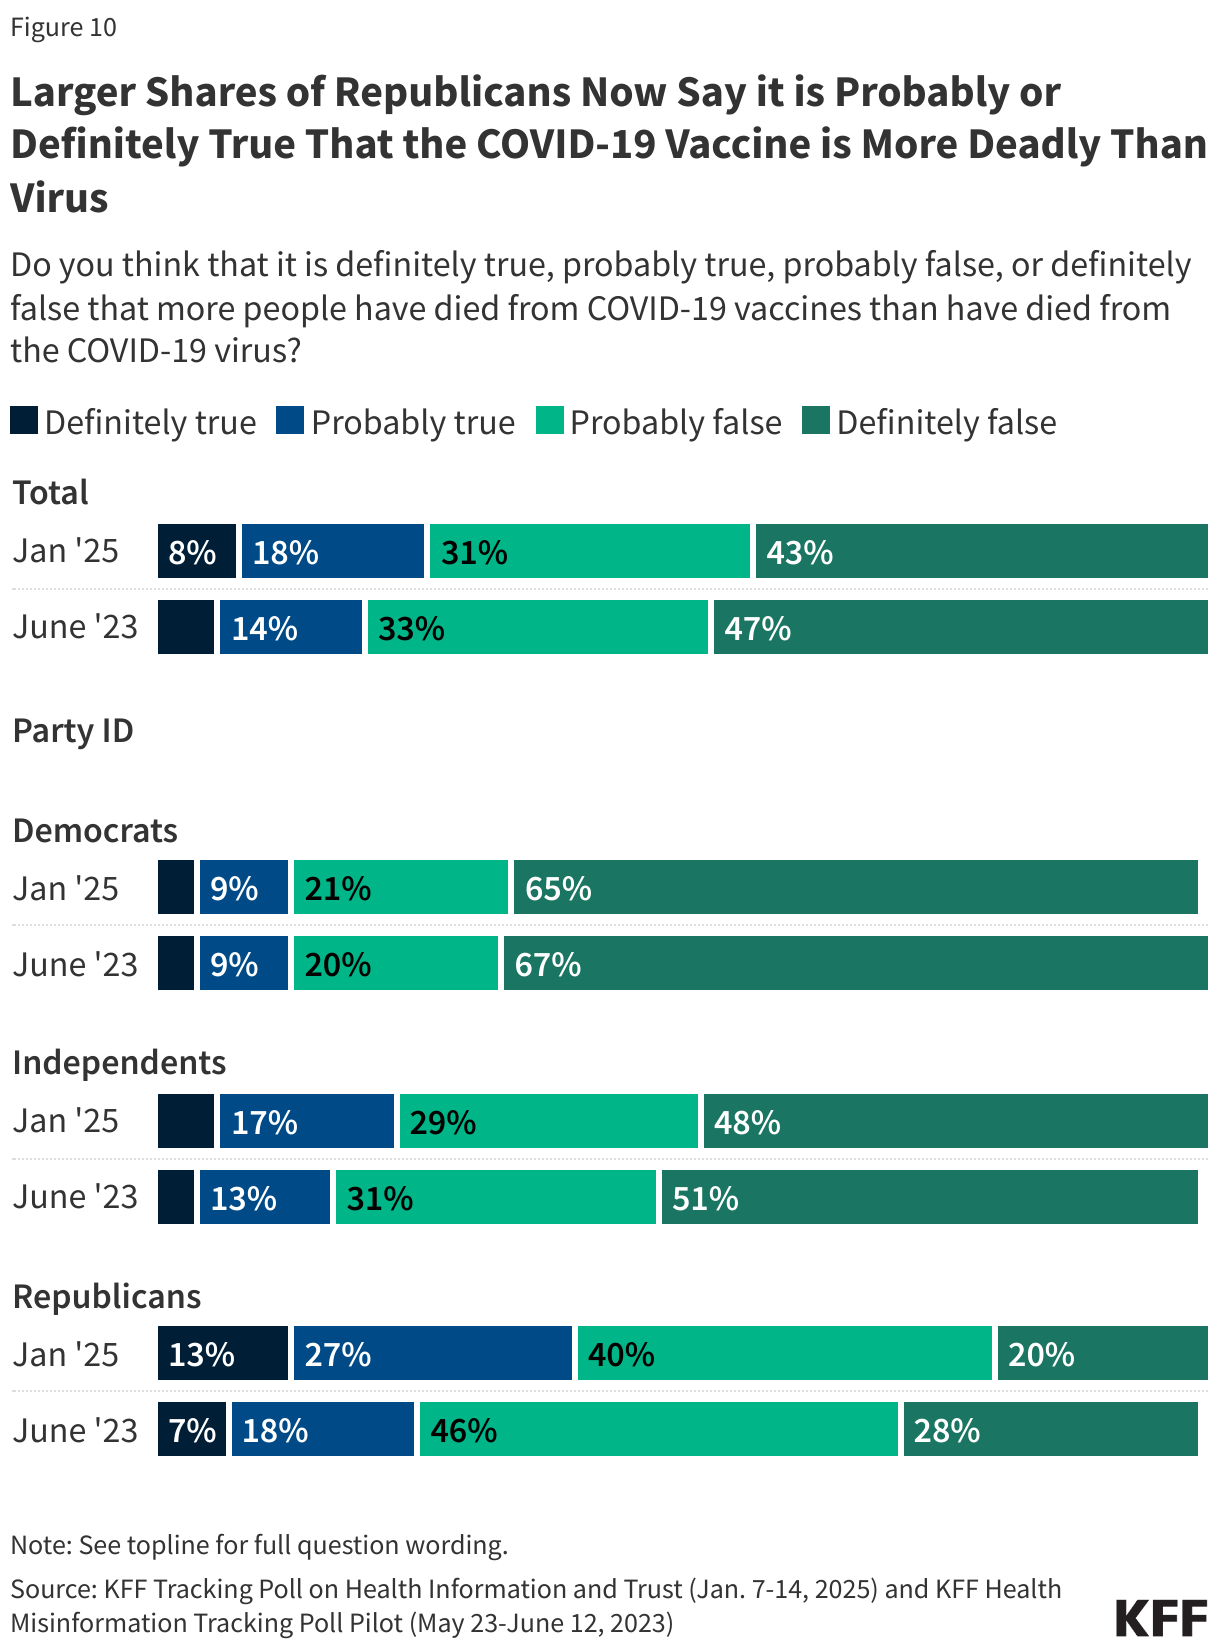
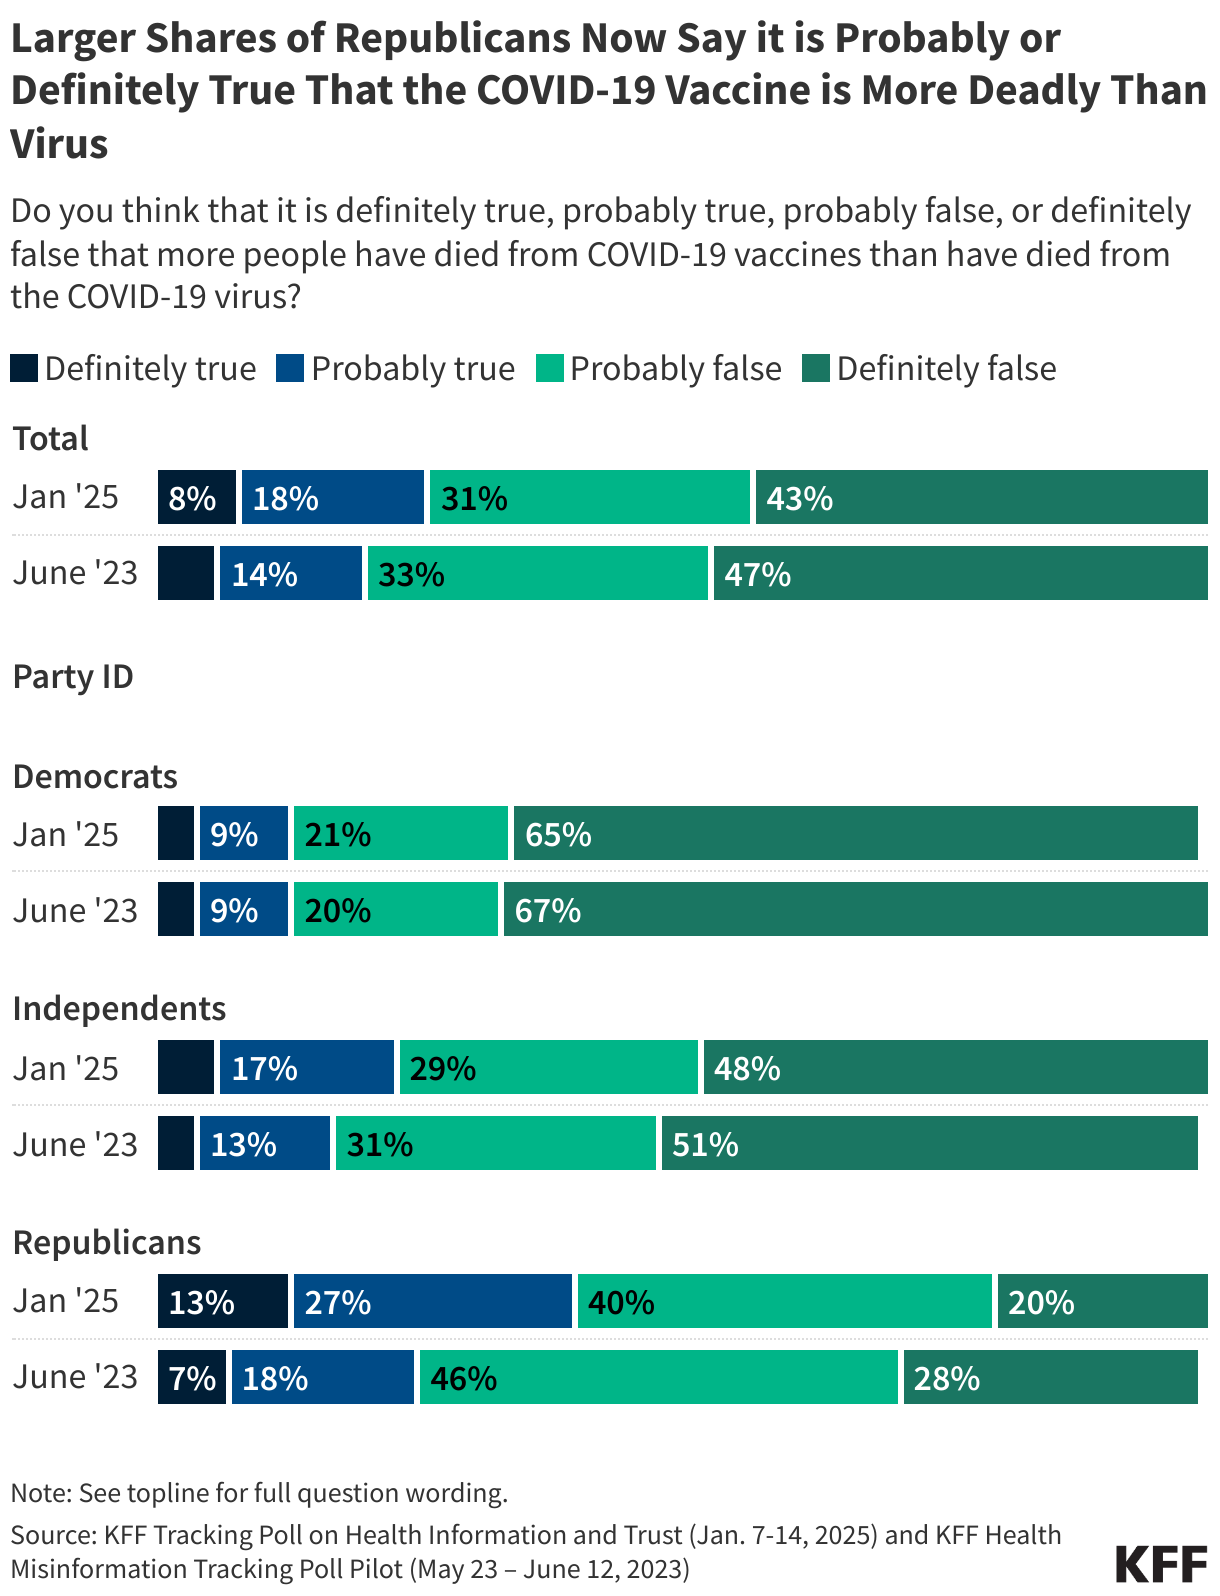
Misinformation and skepticism surrounding the bird flu vaccines echo those related to the COVID-19 vaccines. KFF’s latest Health Information and Trust poll shows that these myths have persisted, particularly among Republicans. While about one in four adults say the false claim that “more people have died from COVID-19 vaccines than have died from the COVID-19 virus,” is “definitely true” (8%) or “probably true” (18%), four in ten Republicans say it is “definitely” (13%) or “probably true” (27%), an increase from one in four Republicans who said this was at least probably true in June 2023.
Concerns About Bird Flu Reflect Distrust in Public Health Messaging

As the U.S. invests in vaccine development, along with other preventative measures, some have shared concerns beyond vaccine skepticism, suggesting that bird flu might be used as a pretext for lockdowns and food supply restrictions. KFF media monitoring research shows that these narratives are resonating with tens of thousands of people online. For example, a radio host garnered 80,000 likes and 29,000 reposts in 10 days when they shared a video on X making these claims with a caption describing bird flu as “A Plot To Shutdown Society” and an “Evil Psyop.” Many of the 2,800 comments on the post conveyed similar concerns. Skepticism is also expressed about health communicators aligned with federal health agencies. In early January, a video of Dr. Leana Wen discussing the bird flu response was captioned with an accusation that she trying to restart the “COVID-19 scam.” The post quickly attracted thousands of interactions, including comments accusing Wen, Dr. Anthony Fauci, and Bill Gates of criminal activity.
Contrary to these persistent claims, the CDC explains that the risk of bird flu to the general public remains low. However, the most common strain of bird flu can spread through contact with an infected animal’s saliva, mucus, feces, respiratory secretions, and other body fluids, so certain groups that work with livestock (e.g., farmers, backyard bird flock owners, veterinarians, and animal health responders) face increased risk due to their frequent exposure to potentially infected animals or animal byproducts. To prevent infection, the CDC recommends avoiding direct contact with infected animals, practicing good hygiene, and using personal protective equipment (PPE) when necessary. Despite the agency closely monitoring the situation, eroding trust in health institutions may undermine public confidence in these prevention strategies and guidance.
Polling Insight:
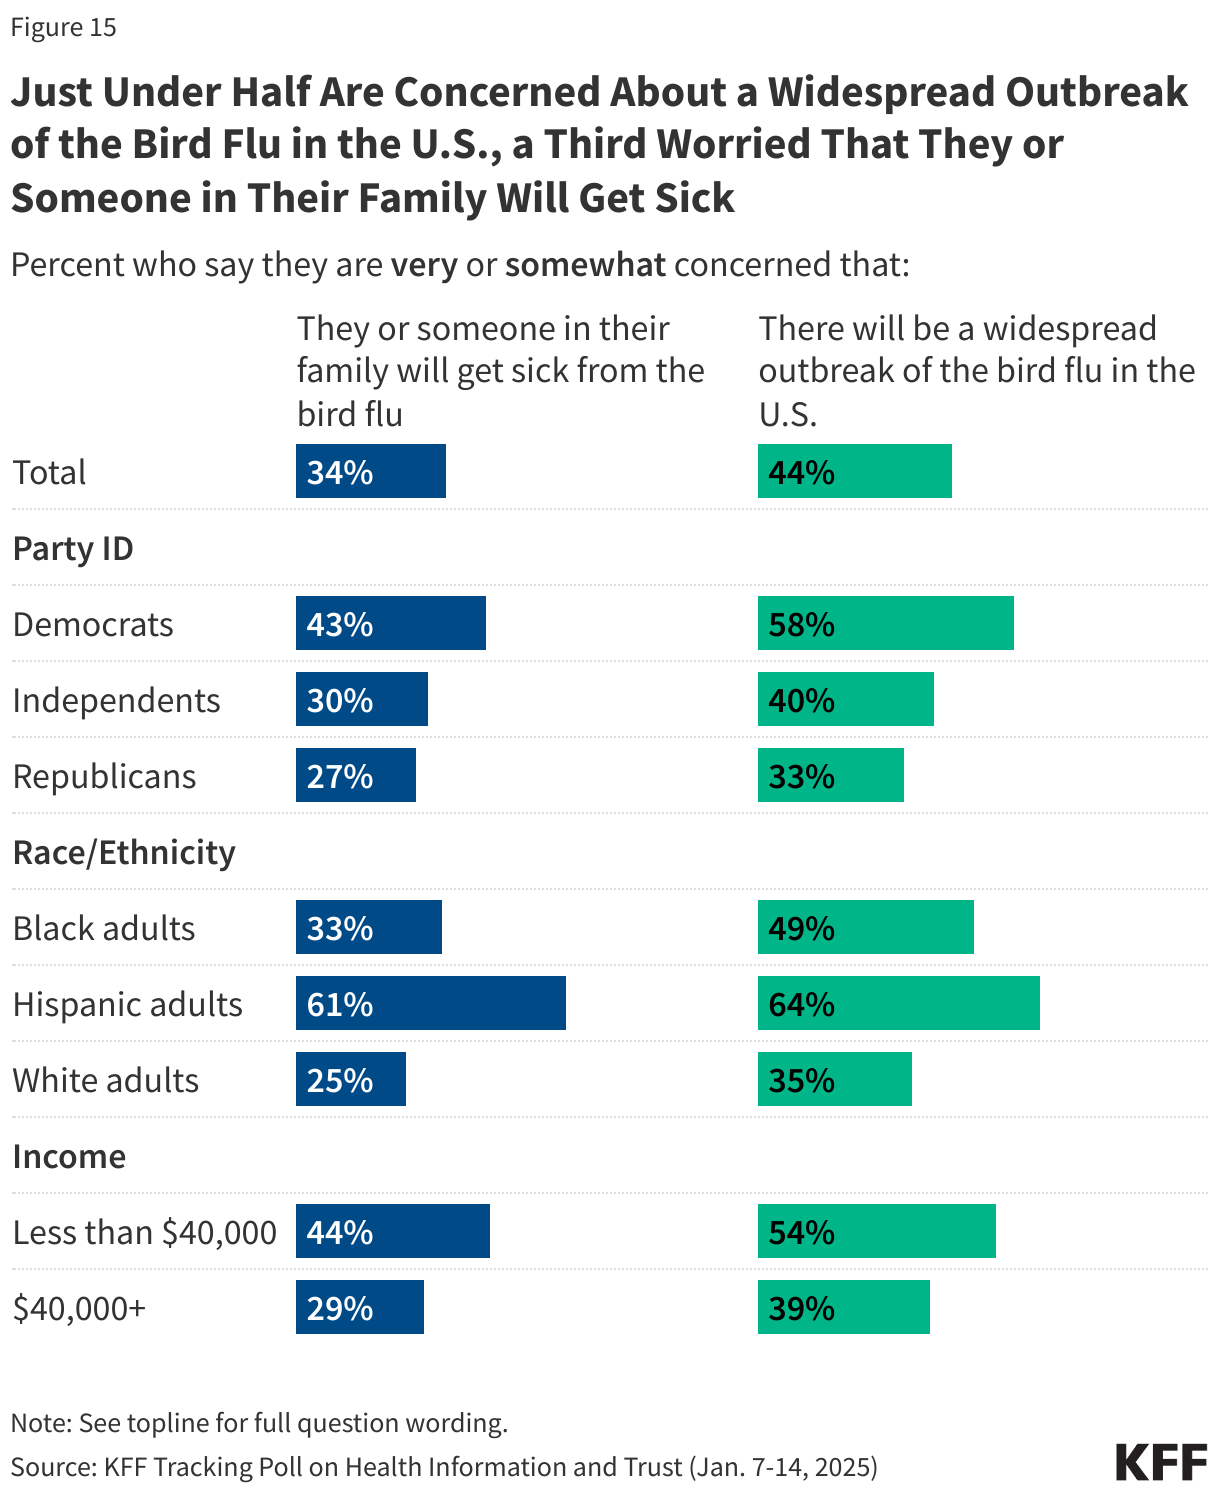
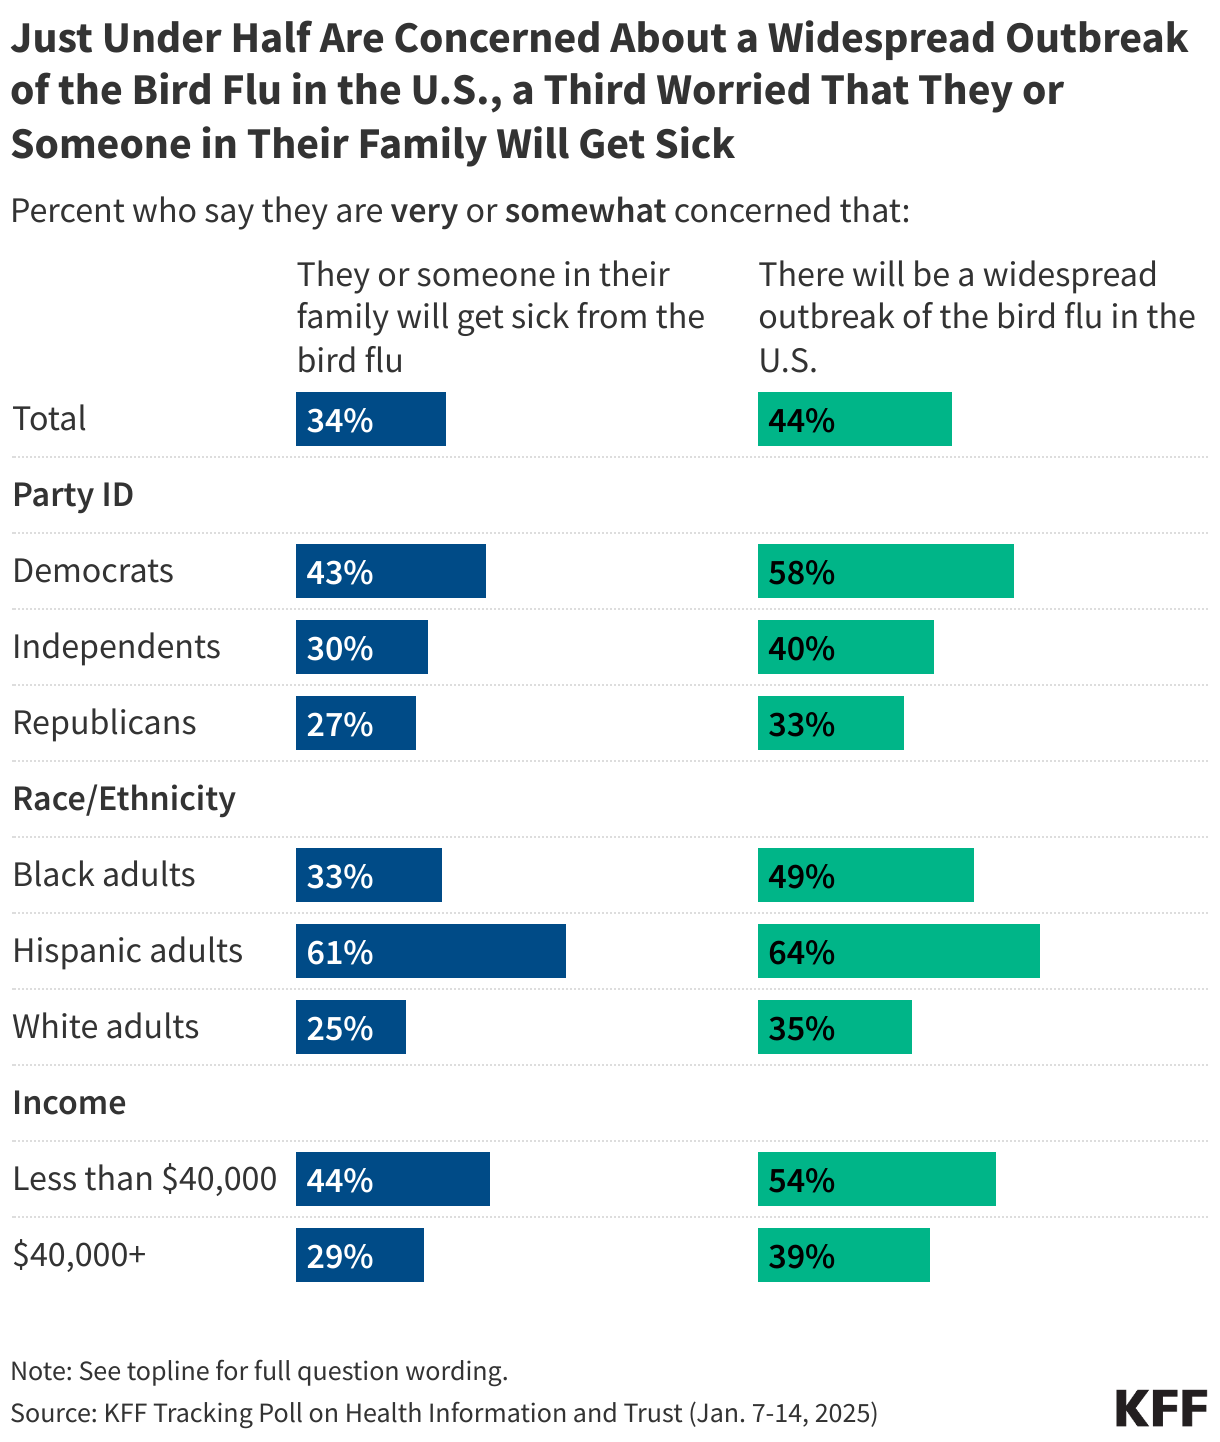
The latest KFF Tracking Poll on Health Information and Trust finds that forty-four percent of U.S. adults are “very” or “somewhat concerned” that there will be a widespread outbreak of bird flu in the U.S., while fewer (34%) say they are concerned that they or someone in their family will get sick. Majorities of Democrats, Hispanic adults, and adults in lower income households express concern about a widespread outbreak of bird flu, and each of these groups is more likely than their counterparts to say they are concerned they or their families will get sick.
Research Insights
Desire for Power and Influence Linked to Increased Online Misinformation Sharing

Research published in Computers in Human Behavior investigated how power motives influence social media behavior, particularly the spread of false or misleading information. Across four studies, individuals with strong power motives—those who prioritize influence, authority, and control—were found to actively share content, including fake news, driven by a desire to assert influence and control narratives within online networks. Power values were stronger predictors of misinformation sharing than dominance or context-specific power goals, meaning that people who value power are more likely to share misinformation, regardless of whether they are trying to dominate others or act strategically. While actual power had minimal impact, power-motivated individuals showed moral leniency by using misinformation to enhance visibility and network centrality. The findings suggest that power-motivated individuals use manipulable narratives to achieve social influence, although real-world dynamics and other contributing factors such as social skills and charisma warrant further exploration.
Source: Guinote, A., Kossowska, M., Jago, M., Idenekpoma, S., & Biddlestone, M. (2025). Why do people share (mis) information? Power motives in social media. Computers in Human Behavior, 162, 108453.
Monitoring and Addressing Misleading Ads for Alternative Cancer Treatments

A study in the HKS Misinformation Review explored how alternative cancer clinics used Google search ads to target cancer patients seeking information about treatment, prognosis, and options. Between 2012 and 2023, these clinics spent more than $15 million on Google ads, resulting in millions of website visits. The ads often mimicked sensitive patient queries, such as those related to cancer survival rates and top treatment centers, only to redirect users to clinics offering unproven therapies. The research highlights the need for health communicators to monitor, pre-bunk, and debunk misleading ads promoting non-evidence-based cancer treatments. Understanding the types of alternative treatments being marketed through these ads is important to help address misinformation before patients encounter it.
Source: Zenone, M., Marcon, A., Kenworthy, N., van Schalkwyk, M., Caulfield, T., Hartwell, G., & Maani, N. (2024). Google allows advertisers to target the sensitive informational queries of cancer patients. Harvard Kennedy School Misinformation Review.
AI & Emerging Technology
Fraudulent Research Can ‘Poison’ LLM Training Datasets

Large Language Models (LLMs), such as ChatGPT, are trained on large datasets, often including publicly available information from the internet. However, the quality and reliability of these data sources can limit the accuracy and trustworthiness of the models. A recent study in Nature explored how the inclusion of fraudulent scientific papers in publicly available repositories can contribute to misinformation. These fraudulent studies, often produced by paper mills, mimic legitimate research but lack rigorous peer review. When such content is used to train LLMs, it risks perpetuating inaccuracies and false claims, particularly in sensitive areas such as health information. According to the study, even when only 0.01% of the training data was corrupted, 10% of the responses contained errors, including false claims about vaccine effectiveness and misidentified medications.
About The Health Information and Trust Initiative: the Health Information and Trust Initiative is a KFF program aimed at tracking health misinformation in the U.S., analyzing its impact on the American people, and mobilizing media to address the problem. Our goal is to be of service to everyone working on health misinformation, strengthen efforts to counter misinformation, and build trust.

The Monitor is a report from KFF’s Health Information and Trust initiative that focuses on recent developments in health information. It’s free and published twice a month.
Sign up to receive KFF Monitor
email updates
Support for the Health Information and Trust initiative is provided by the Robert Wood Johnson Foundation (RWJF). The views expressed do not necessarily reflect the views of RWJF and KFF maintains full editorial control over all of its policy analysis, polling, and journalism activities. The Public Good Projects (PGP) provides media monitoring data KFF uses in producing the Monitor.