SCOTUS Ruling on Medina v. Planned Parenthood Will Limit Access to Care for Patients in South Carolina and Beyond

Published: Jun 27, 2025

On June 26th, 2025, the Supreme Court of the United States issued its decision in Medina v. Planned Parenthood South Atlantic, finding that Medicaid enrollees cannot seek relief in federal court to enforce Medicaid’s “free-choice of provider provision.” This provision allows Medicaid enrollees to seek care from any provider that is qualified and willing to participate in the program. South Carolina’s policy barring Medicaid patients from obtaining care from clinics that provide abortion care is part of broader efforts by anti-abortion policymakers to exclude Planned Parenthood clinics from the Medicaid program, and ultimately, eliminate all federal payments to Planned Parenthood centers. Medicaid pays health care providers, including Planned Parenthood, for the delivery of health care services, but the program does not pay for abortion care except under very limited circumstances (abortions for pregnancies resulting from rape, incest or that are life-threatening).

This decision means that people enrolled in Medicaid in South Carolina, and in other states that exclude Planned Parenthood going forward, will not be able to use their Medicaid coverage to obtain any preventive services, such as contraceptive care, STI treatment and cancer screenings, at Planned Parenthood clinics. Medicaid is a major source of revenue for Planned Parenthood clinics. The loss of this revenue could result in the closure of many sites or scaling back service hours or staff and affect access for all patients, not only Medicaid enrollees. Nationally, one in three (32%) women and one in ten men (11%) have received health services from a Planned Parenthood clinic.

This case stems from a 2018 executive order issued by South Carolina’s governor that prohibited any clinic that provides abortion care from participating in the state’s Medicaid program. Planned Parenthood South Atlantic, which operates two clinics in South Carolina, and Julie Edwards, a patient who wanted Planned Parenthood to be her provider, challenged this decision to block Medicaid patients from having Planned Parenthood as their provider. The Court ruled that the “free-choice of provider” provision does not create a right enforceable by individuals under the civil right statute Section 1983 because the statute does not clearly confer an individual right. The majority opinion distinguished this case from the Court’s 2023 Talevski decision, which found a private right of action for nursing home residents, because the Federal Nursing Home Reform Act (FNHRA) includes explicit language giving residents’ rights. Without the word “right” in the Medicaid “free choice of provider” provision, the Court concluded that the provision is about states’ duties under Medicaid, but it does not confer individual rights to Medicaid enrollees to sue to get services from the participating provider of their choice.

Justice Jackson wrote a dissent, joined by Justices Kagan and Sotomayor, criticizing the majority and contesting their conclusion that because the word “right” does not appear in the free choice of provider provision, the section does not confer individual rights.

Enforcement of Free-Choice of Provider is Now Limited

The Court states that Planned Parenthood could challenge their exclusion from South Carolina’s Medicaid program through South Carolina’s administrative process and then appeal to state courts and ultimately seek review at the Supreme Court. However, the administrative process at the state level could be prolonged, and in the meantime, patients enrolled in Medicaid would not be covered for care at Planned Parenthood clinics. As a result, the clinics would likely close or reduce the scope or availability of services before the administrative process concludes.

How will this impact access to care for Medicaid patients across the country?

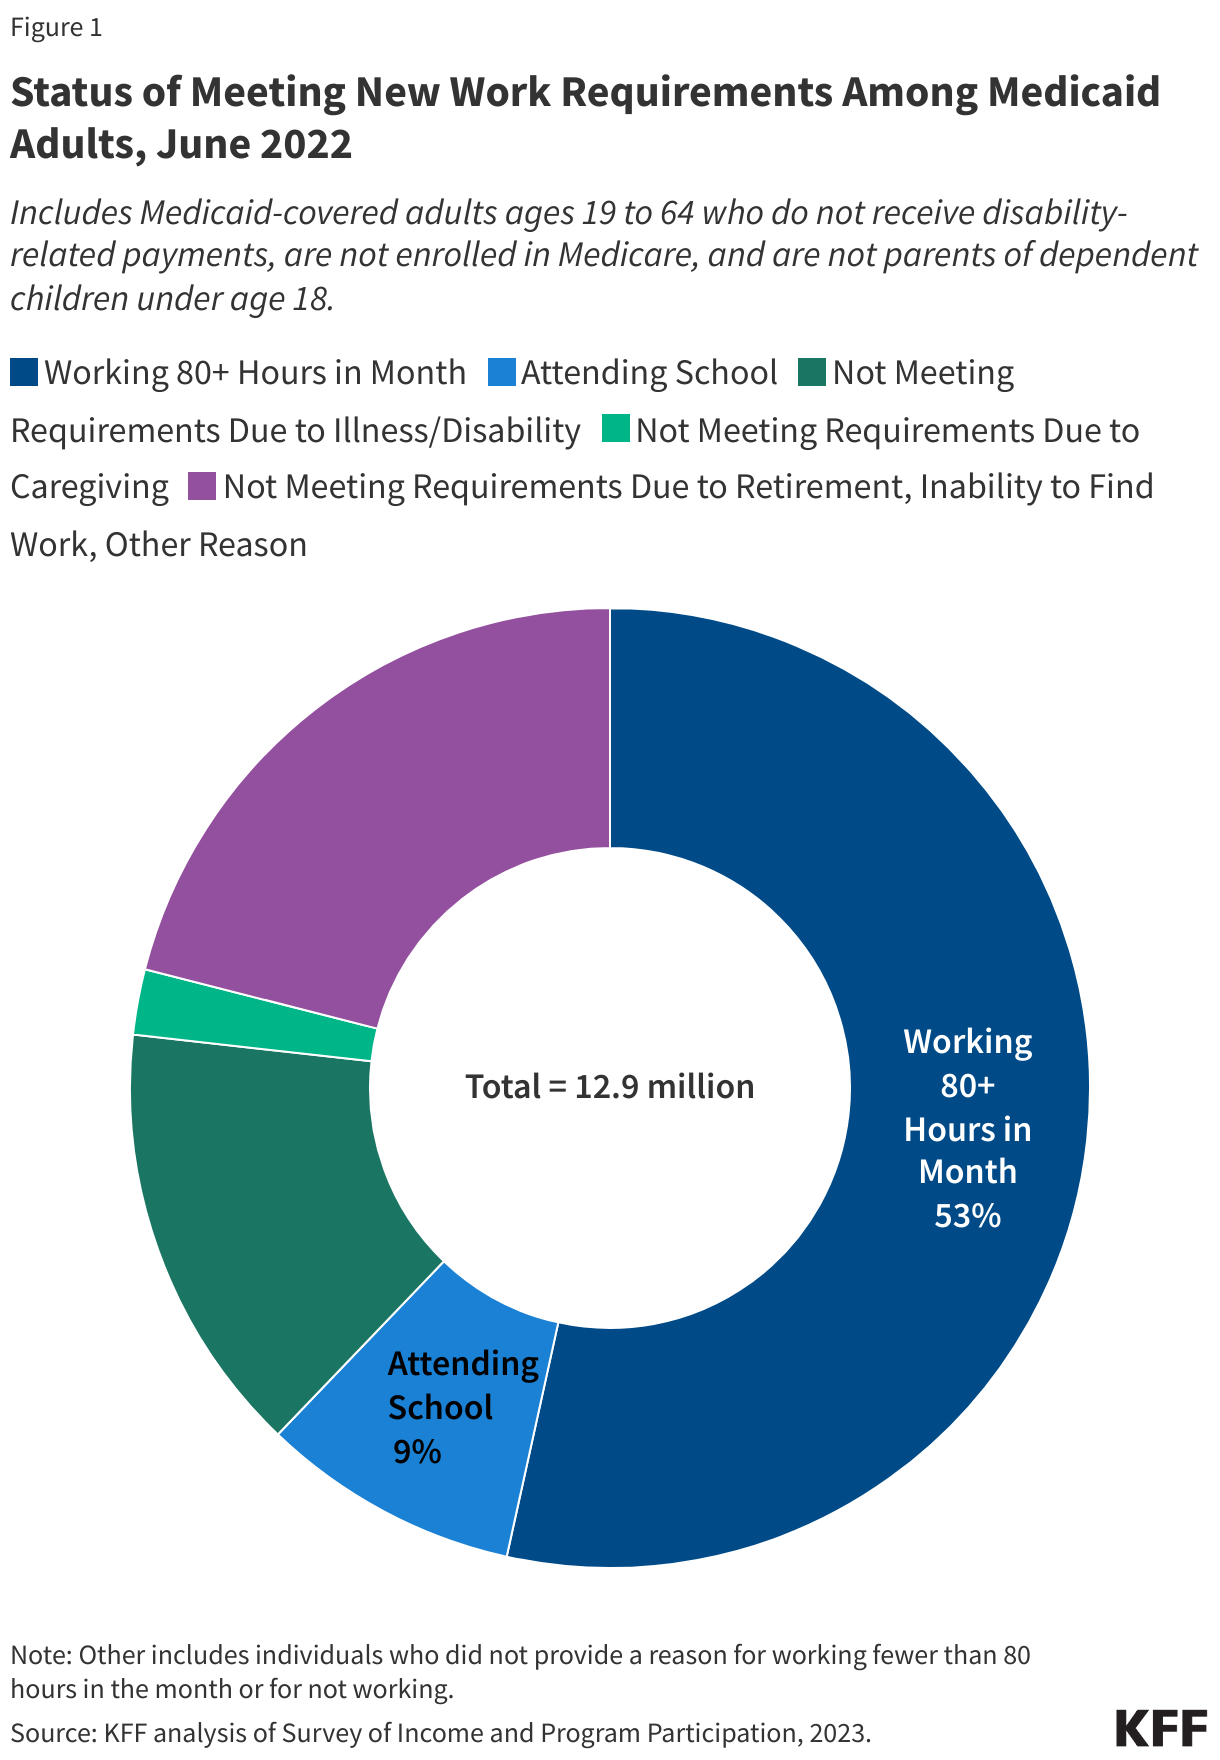
Many states have tried to exclude Planned Parenthood clinics from their Medicaid program, largely due to opposition to including a health care provider that also provides abortion. In the past decade, at least 14 states (AL, AR, AZ, FL, IA, ID, KS, LA, MO, MS, OK, SC, TN, TX) have used state-level policies or sought federal permission to block the provider from participating in their state Medicaid programs, though they have often been blocked by court action, until this ruling (Figure 1).

People Living in Many States May Be Affected by State Efforts to Exclude Planned Parenthood from Medicaid

While the high court’s ruling opens the door for South Carolina and other states to disqualify Planned Parenthood from their Medicaid program, the House-approved reconciliation bill could have an even broader impact if passed by the Senate. It would ban federal health care payments by Medicaid for any services to Planned Parenthood and other providers who also offer abortion care (which is currently not covered by Medicaid) in every state. The Senate Parliamentarian is still reviewing the provision to see whether it can be included in the final Senate version of the bill or whether it runs afoul of the “Byrd Rule” and would therefore require 60 votes to pass. Regardless of the outcome, as a result of the Medina case, patients who rely on Planned Parenthood sites for their contraceptive, STI, and preventive care will be likely in some states to find themselves with fewer or no options to get that care, especially in rural or medically underserved communities where there are far fewer providers.

How Might Changes to the ACA Marketplace Impact Enrollees with Mental Health Conditions?

Published: Jun 27, 2025

Marketplace enrollment has grown substantially in recent years, increasing from 11.4 million people in 2020 to 24.3 million in 2025. Insurance coverage is a key determinant in accessing health care services, including mental health services. However, several pending policy changes, such as the One Big Beautiful Bill Act (OBBBA) and the expiration of enhanced premium tax credits, may lead to an additional 8.2 million people losing their Marketplace coverage and becoming uninsured by 2034, according to the Congressional Budget Office (CBO). This potential coverage loss raises concerns about access to mental health care services. One in five Marketplace enrollees report that their mental health is “fair” or “poor”, based on a KFF survey. This brief estimates the number of current Marketplace enrollees with a mental health diagnosis – identified as individuals with a health care claim that included at least one mental health diagnosis – to understand what changes in enrollment may mean for access to services, using 2022 health care claims data from the Center for Medicare and Medicaid Service.

Among Marketplace enrollees, more than 1 in 6 (18.2%) had at least one mental health diagnosis on a health care claim in 2022 (Figure 1). However, the share of Marketplace enrollees with a mental health condition is likely higher. This estimate only captures diagnoses for people with a mental illness diagnosis recorded in their medical claims. This estimate does not account for enrollees with only prescription drug claims for a mental health condition, enrollees with undiagnosed mental health conditions, enrollees in remission from mental health conditions, or those who did not seek treatment for their mental health conditions. Additionally, not all individuals are screened for mental illness, and diagnoses are not always recorded on healthcare claims. Prevalence rates estimated through surveys are generally higher than the prevalence rates observed in claims data. A prior KFF analysis found that among adults – regardless of insurance status – reporting moderate or severe symptoms of anxiety and/or depression, 39% did not receive treatment.

1 in 6 Marketplace Enrollees Had a Mental Health Diagnosis

Among the 24.3 million Marketplace enrollees in 2025, over 4.4 million individuals are estimated to have at least one mental health diagnosis on a health care claim (Figure 2). Given that 18.2% of Marketplace enrollees had a health care claim with a mental health diagnosis in 2022, approximately 4.4 million enrollees may seek services associated with a mental health diagnosis in 2025. These mental health diagnoses include, but are not limited to, anxiety disorders (3.0 million), depression disorders (2.0 million), trauma and stressor related disorders (0.9 million), and bipolar disorders (0.3 million). Further, mental health conditions often co-occur. Among Marketplace enrollees with at least one mental health diagnosis, 39% will have health care claims that include two or more mental health diagnoses.

Over 4.4 Million Marketplace Enrollees Are Estimated to Have at Least One Mental Health Diagnosis

Among Marketplace enrollees, mental health diagnoses were most common among adults ages 26-34 and females (Figure 3). Female Marketplace enrollees were more likely to have a health care claim that included a mental health diagnosis than males (22.8% vs. 12.8%). A prior KFF analysis found that men with moderate to severe symptoms of anxiety and/or depressive disorder were more likely than women to not receive mental health treatment, and as a result not receive a mental health diagnosis in the year. Over one-in-five enrollees ages 26-34 (21.6%) had a health care claim that included a mental health diagnosis, followed by enrollees ages 35-49 and 50-64 (19.5% and 19.2% respectively).

Among Marketplace Enrollees, Mental Health Diagnoses Are Most Common Among Adults Ages 26-34 and Females

The Congressional Budget Office estimates that up to 8.2 million more people will be uninsured in 2034 as a result of changes to Marketplace coverage, which may affect many enrollees with mental health conditions. Several aspects of Marketplace plans created under the Affordable Care Act have allowed for improved access to mental health and substance use services, including classifying these services as essential health benefits, providing coverage for individuals with pre-existing conditions, including mental health conditions, and parity protections. Access to these Marketplace plans has increased with record enrollment in recent years driven in part by enhanced premium tax credits that lowered costs for most enrollees, as well as policy changes that made it easier to sign up for coverage. However, several pending policy changes, including the OBBBA, recently passed by the House, along with the expiration of enhanced premium tax credits, and provisions in a new CMS Marketplace Integrity and Affordability rule may lead to an additional 8.2 million people losing their Marketplace coverage and becoming uninsured by 2034. This would mean if enrollees with mental health conditions lose coverage at a similar rate as other Marketplace enrollees, over one million more people with a mental health diagnosis could be uninsured in 2034. Separately, CBO estimates that changes to Medicaid via the OBBBA would further increase the number of uninsured people by 7.8 million. Medicaid plays a large part in coverage and treatment of behavioral health conditions, covering nearly one-third of all adults with mental health disorders.

Health care expenditures for those with mental health conditions are higher than those without, making insurance an important part of affording treatment for people with mental health conditions. Insured adults with moderate to severe symptoms of anxiety and/or depression are significantly more likely to receive mental health care compared to their uninsured counterparts (64% vs. 38%) in 2019, highlighting the key role insurance coverage plays in linking individuals to mental health care. Among privately insured individuals, those with anxiety and/or depression face higher out-of-pocket costs annually than their peers without a mental health diagnosis ($1,501 vs. $863 in 2021). Reflecting these financial burdens, a 2023 KFF survey found that 43% of insured adults with “fair” or “poor” mental health said they didn’t get needed mental health care because they couldn’t afford the cost. Loss of insurance coverage would further exacerbate the financial burden of seeking mental health treatment.

Methods

Data from the 2022 Enrollee-Level External Data Gathering Environment (EDGE) limited dataset were analyzed to understand how common mental health diagnoses are among Marketplace enrollees. After determining the percentage of enrollees with one or more mental health diagnoses, the results were scaled to the size of the 2025 Marketplace enrollment. Mental health diagnoses were identified using the Clinical Classifications Software Refined (CCSR) from the Agency for Healthcare Research and Quality. Specifically, diagnoses in categories MBD001 through MBD013 and MBD027 were included. Two related categories—suicidal ideation/attempt/intentional self-harm (MBD012) and suicide attempt/intentional self-harm; subsequent encounter (MBD027)—were grouped together. Diagnoses were based on all available medical claims, including updates from the supplemental claims file (submitted in the risk adjustment data collection process). These claims were mapped to mental health diagnoses where appropriate. This analysis did not include retail prescription drug claims. Further, claims for treating substance use conditions are not included in the public use EDGE dataset; some enrollees may have mental health diagnoses on SUD claims.

Reconciliation Language Could Lead To Cuts in Medicaid State-Directed Payments to Hospitals and Nursing Facilities

Published: Jun 27, 2025

On May 22, the House passed the One Big Beautiful Bill Act, which the Congressional Budget Office (CBO) estimated would reduce federal Medicaid spending by $793 billion over 10 years. Almost 10% of those savings came from a provision that would limit state-directed payments to hospitals and nursing facilities in future years. State-directed payments (SDPs) require managed care organizations (MCOs) to make certain types of payments to health care providers, generally aimed at increasing provider payment rates to increase access to or quality of care (see Box 1). The House reconciliation bill would require future SDPs for hospitals and nursing facilities to be limited to 100% of Medicare rates in expansion states and 110% of Medicare rates in non-expansion states but would allow existing SDPs to remain at current rates. The Senate Finance Committee’s draft reconciliation language expands on the SDP provision by reducing existing SDPs 10% each year until they reach the statutory limits applicable to new SDPs.

If Congress passes the reconciliation bill with the Finance Committee’s requirements for SDPs, the required payments to hospitals or nursing facilities would likely decrease in 29 states, and possibly, in more than 31. KFF identified the potentially affected states by reviewing SDP arrangements that have been approved by the Centers for Medicare and Medicaid Services (CMS). Although the focus of this issue brief is payments to hospitals or nursing facilities, which combined account for a major source of Medicaid spending, payment rates for other providers could be affected, and some SDPs apply to multiple provider types but set different payment limits for different types of providers. Payments to other providers are included in this analysis when they are included in an SDP that also targets hospitals and/or nursing facilities (see Methods). Further, this analysis does not consider whether affected states would have to reduce payments to hospitals, nursing facilities, or both. This analysis also does not attempt to project the effects of the provision that will limit any future SDPs to levels that are lower than today’s or for the proposed limits on provider taxes which are one of the ways that SDPs can be funded and the new limits could prompt states to reduce SDPs.

Box 1: What are state-directed payments?

Managed care is the dominant delivery system for people enrolled in Medicaid, with 75% of Medicaid beneficiaries enrolled in comprehensive managed care organizations (MCOs) throughout 42 states. States are generally prohibited from directing how MCOs pay providers but may do so in certain circumstances through “state-directed payments” (SDPs).  Federal regulations govern permissible SPDs (42 CFR 438.6(C)), which specify that states may direct MCO payments for the following purposes:

  • To adopt minimum or maximum fee schedules,
  • To provide uniform payment increases for specific services,
  • To implement value-based purchasing models for provider reimbursement, or
  • To participate in a multi-payer or Medicaid-specific delivery system reform or performance improvement initiative.

Before implementing SDPs, states must receive approval from the Centers for Medicare & Medicaid Services (CMS) unless the SDP uses a minimum fee schedule that is equivalent to the Medicare or Medicaid fee-for-service payment rates.

Most states that have SDPs for hospitals or nursing facilities use average commercial rates to benchmark at least one state-directed payment (Figure 1).  The pre-approval documents states submit to CMS before implementing SDPs (“preprints”) generally require states to indicate the payment level required of comprehensive managed care organizations (MCOs), which is sometimes described as a benchmark. Benchmarks are generally established using Medicare or Medicaid fee-for-service rates, or commercial rates and a state can use one or more of these when establishing SDPs. Benchmarks are generally established for specific types of providers and specified categories of services. State-directed payments are often higher than the levels that would be permissible under the reconciliation bill: 24 states have at least one SDP which raises reimbursement to more than 90% of average commercial rates. One state (North Carolina) benchmarks against average commercial rates but its specific rates are only disclosed in attachments to its preprints that are not publicly available. About one fifth (11) of states have at least one payment rate benchmarked to Medicare (half of those payment rates are benchmarked to at least 92% of Medicare rates with one as high as 202%), and relatively few (3) states have at least one payment benchmarked to Medicaid fee-for-service rates.

Most States Use Average Commercial Rates to Benchmark Directed Payments to Hospitals or Nursing Facilities

Tying payments to average commercial rates was intended to ensure access to adequate provider networks and increase the use of value-based payment methods. A 2024 rule on Medicaid managed care codified CMS’ previously informal practice that the maximum payment rate on total payments after accounting for SDPs for hospital services, nursing facility services, and qualified practitioner services at academic medical facilities was the average commercial payment rate (ACR). There is no upper payment limit on SDPs for other types of services, but CMS indicated that it would use the average commercial rate as a standard when considering states’ applications for approval. The change was intended to help Medicaid compete with commercial insurers and to ensure robust access to Medicaid enrollees. Base rates paid to hospitals by Medicaid, without accounting for supplemental payments like SDPs, are often quite low.

Average commercial rates tend to be higher than Medicaid or Medicare rates and SDPs have been a driver of increased federal spending. There have been numerous proposals to restrain commercial prices for hospital care, which have contributed to higher premiums and reduced wage growth, among other effects.  The Congressional Budget Office (CBO) updated its Medicaid spending projections for 2025-2034 to reflect a 4% (or $267 billion) increase with half of the increase attributed to expected growth in directed payments in Medicaid managed care (driven in part by the rule change allowing states to pay at the average commercial rates). The Government Accountability Office noted that the rapid spending growth suggested the need for enhanced oversight and transparency.

Most states would likely need to reduce payments to hospitals or nursing facilities to comply with the Senate Finance Committee’s proposed caps on state-directed payments (Figure 2). The list of potentially affected states includes any state with an SDP benchmark that exceeds 100% of Medicare fee-for-service rates in expansion states, and 110% of Medicare rates in non-expansion states. For SDPs that benchmark rates to commercial payment rates, KFF converted those rates to a percentage of Medicare rates using data from RAND about the relationship between commercial and Medicare payment rates for hospitals (see Methods).

Among the 42 states with comprehensive managed care plans, 36 states had SDPs starting on January 1, 2024 or later, of which 33 states had SDPs targeting hospitals or nursing facilities (in addition to Vermont’s SDP which is through their All-Payer Accountable Organization Model). Among those 34 states:

  • 29 states would likely be affected because they have at least one SDP benchmarked to Medicare or average commercial rates that are estimated to be higher than the proposed caps (see Methods). Eleven of these states (Georgia, Iowa, Kentucky, Minnesota, Nevada, Oklahoma, Oregon, South Carolina, Tennessee, Washington, and New Mexico) have at least one SDP raising payments to 100% of average commercial rates.
  • Two states, North Carolina and Wisconsin, could possibly be affected by the proposed caps. North Carolina benchmarks some SDPs to commercial rates but does not document the adjusted rate within the preprint. For other SDPs, North Carolina benchmarked payment rates between 146% of Medicaid fee-for services rates (hospital outpatient laboratory services) and 256% of Medicaid rates (for inpatient hospital services). There are no publicly available data to compare states’ Medicaid rates to Medicare rates, so it’s difficult to discern whether benchmarks above 100% of Medicaid rates would also be above the new Medicare-based statutory limits specified in the reconciliation bill. Wisconsin has an SDP that benchmarks payment rates against providers’ costs (up to 124%), which is also difficult to compare to Medicare rates.
  • Three states (Indiana, Missouri, and Vermont) have SDPs that would likely not be affected because their SDP rates are estimated to be below the proposed caps.

Among the remaining states, 3 states (Nebraska, Utah, and West Virginia) have SDPs that do not target hospitals or nursing homes, and 13 states and DC do not have any SDPs in this time period.

Senate Reconciliation Bill Likely to Reduce Hospital and Nursing Facility Payments in Most States

Reduced payments to hospitals or nursing facilities could potentially lead to reduced access to or quality of care. Increased payments through SDPs are permitted under federal law, with the goal to help ensure sufficient access to care and promote improved quality. They can help support hospitals serving a large percentage of Medicaid patients and rural hospitals, which are more likely to have negative operating margins and could face larger financial challenges with cuts to Medicaid financing and increasing the number of people without health insurance by nearly 11 million. These reductions could also have implications for nursing facilities because Medicaid is the primary payer for over 6 in 10 residents, paying for nearly half of the total spending on institutional long-term care. For both types of providers, they may have to offer fewer services or reduce the quality of care to work with the reduced payment rates expected under the bill, and in some cases, may be unable to remain open.

The effects of limiting SDPs in the reconciliation bill will amplify the effects of limiting provider taxes, a mechanism that many states use to help fund hospital and nursing facility payment rates. Both the House and Senate reconciliation language establishes a moratorium on provider taxes that is expected to save money in future years by limiting the amount of future Medicaid spending growth (some health care provisions of the Senate bill have been ruled out of order by the Senate parliamentarian and may need to be revised or removed from the legislation to pass with a simple majority). That provision is similar to the House’s proposed SDP limits that apply to new SDPs but permit existing SDPs to remain in place. In both cases, the Senate Finance Committee’s language makes deeper Medicaid cuts: by limiting existing SDPs and by reducing existing provider taxes in states that adopted the Medicaid expansion if they exceed new limits. KFF estimates that 22 states would be required to cut provider taxes on hospitals or managed care organizations under the Finance Committee language, which would exacerbate the effects of cutting existing SDPs for the states that are jointly affected. Because provider taxes often fund SDPs, even states with SDPs below permissible levels could be forced to cut their provider payment rates if they are affected by the lower provider tax thresholds.

Methods

This analysis examined 172 approved state-directed payment (SDP) “preprints” that were published online by CMS as of June 25, 2025, and started on or after January 1, 2024. The analysis is limited to the 50 states and DC, and to preprints that direct one or more payments to inpatient or outpatient hospital services or nursing facility services. A single SDP may contain one or more payment rates, which may vary in terms of their level (what the rate is set at), what measure is used a benchmark (e.g., average commercial rates or Medicare rates), and providers to which the rate applies. Payment rates benchmarked to average commercial rates were converted to estimates of Medicare-equivalent rates using RAND Price Transparency Study, Round 5.1 data on prices for hospital services, by state. RAND data are based on commercial claims for employer-sponsored health insurance plan enrollees collected from participating self-insured employers and health plans as well as from all-payer claims databases (APCDs) from 12 states. States may calculate commercial benchmarks differently than RAND and commercial to Medicare ratios could be higher or lower for specific hospital services as well as for other providers.

The analysis compares the preprint payment rates to the proposed caps on SDP payment rates, which equal 100% of Medicare rates in expansion states (determined using KFF’s Status of State Medicaid Expansion Decisions) and 110% of Medicare rates in non-expansion states. Each payment rate was classified in one of the following three buckets:

  • “Likely affected” payments are those where the SDP rate (benchmarked to Medicare or commercial) exceeds the state’s proposed cap;
  • “Possibly affected” payments are those benchmarking against Medicaid but that exceed Medicaid fee-for-service payment rates or against another measure for which a comparison to Medicare rates was not possible (such as providers’ costs); and
  •  “Likely not affected” payments are those that fall below the proposed caps.

If a state had at least one payment rate that was classified as “likely affected,” the state was classified as “likely affected.”  States that had no payment rates that were “likely affected” were classified as “possibility affected” if they had at least one payment rate that was “possibly affected.” It is possible that some states received their classification based on payment rates to providers besides hospitals and nursing facilities (for instance, if a single preprint contains payments to both hospital and physician services, payment rates for physician services would be included). However, when restricting the sample to preprints that were only targeted to hospitals and/or nursing facilities, 24 states were still classified as “likely affected.”

CMS sometimes publishes preprints before the start date and sometimes publishes them after; states may have SDPs that could be affected that have not yet been approved or published.  At the time of writing this, CMS has been publishing, updating, and removing preprints from its website frequently.

This work was supported in part by Arnold Ventures. KFF maintains full editorial control over all of its policy analysis, polling, and journalism activities.

Patrick Drake, an independent consultant at Data, et cetera, aggregated the preprint data for this analysis.

Cost Sharing Requirements Could Have Implications for Medicaid Expansion Enrollees With Higher Health Care Needs

Published: Jun 27, 2025

The budget reconciliation bill (the “One Big Beautiful Bill”) being debated in Congress makes significant changes to the Medicaid program, including requiring states to impose cost sharing on certain adults enrolled through the ACA Medicaid expansion. This requirement marks a departure from current rules that permit, but do not require, states to impose cost sharing on certain populations within limits designed to protect Medicaid enrollees from high out-of-pocket costs. These protections were put in place based on evidence showing that cost sharing, even nominal amounts, can pose barriers to accessing needed care for individuals with low incomes. Cost sharing, such as copays required at point of service, is associated with reduced use of care, worse health outcomes, and increased financial burden. Other research finds that cost sharing often has limited state savings and often means a reduction in reimbursement for providers.

The bill would, for the first time, require states to impose cost sharing of up to $35 per service on Medicaid expansion adults with incomes between 100% and 138% of the federal poverty level (FPL; the federal poverty level is $15,650 for a single adult in 2025). Some services, including primary care, mental health and substance use disorder (SUD) treatment, family planning, emergency care provided in a hospital emergency department, and institutional long-term care, would be exempt from cost sharing. Additionally, cost sharing for prescription drugs would remain at nominal levels as specified by current rules. While $35 is the upper cost sharing limit per service (with the exception of non-emergency services provided in an emergency room, for which cost sharing can exceed $35), states can choose to charge less. As under current rules, states can allow providers to require payment of any cost sharing prior to providing services, which could lead to denial of services if an enrollee is unable to pay.

Under current rules, states are permitted to impose cost sharing on adults enrolled through the Medicaid expansion, though federal rules limit what states can charge given enrollees’ limited ability to pay out-of-pocket costs. Maximum allowable cost sharing varies by type of service and income. Total out-of-pocket costs are limited to no more than 5% of family income, and states are required to establish a process for tracking incurred cost sharing that does not rely on enrollee documentation and stops cost sharing once a family meets the cap, which the bill would maintain. Prior to the start of the COVID-19 pandemic in January 2020, over half of states that had adopted the Medicaid expansion charged cost sharing on some services for adults enrolled in the expansion. Most of these states imposed cost sharing regardless of income, though three states limited cost sharing to adults with income at or above 100% FPL. States were prohibited from imposing new cost sharing or increasing existing cost sharing from January 2020 through December 2023 in exchange for enhanced federal Medicaid funding. States could impose new cost sharing starting in January 2024, though some states have since eliminated all cost sharing.

Because the bill only addresses cost sharing for a limited group of expansion enrollees, it does not appear to affect existing cost sharing policies states have in place. States that currently impose cost sharing on the expansion population will likely maintain that cost sharing, though they may be required to apply the cost sharing to a wider range of services for expansion adults with incomes 100%-138% FPL. If a state has a cost sharing requirement above $35 per service, they will likely have to reduce the amount for the specified expansion adult population. Cost sharing on populations other than the specified expansion adults will likely be able to remain in place as long as it complies with existing rules.

This brief uses 2021 Medicaid claims data to examine utilization among Medicaid expansion adults and estimate how much cost sharing these enrollees could be required to pay under the new requirement if all states imposed the maximum cost sharing amounts. This is an illustrative analysis intended to describe which enrollees may be subject to the most cost sharing under the new provisions rather than estimate exactly what expansion enrollees may actually pay. The estimates are based on utilization among all adults enrolled through the expansion (income data to identify adults with income 100%-138% FPL are not available) who had utilization that would be subject to the cost sharing and assumes cost sharing of $35 per non-exempt service. The $35 represents the upper bound of what states could charge for most services, though not all states would be expected to impose cost sharing at this amount on all services. It does not, however, include cost sharing for prescription drugs, which the bill mandates must be limited to nominal amounts. Many states currently charge nominal cost sharing for prescription drugs. See methods for more details and limitations of this analysis.

Under the proposed cost sharing rules, the average expansion enrollee could pay $542 in a year if maximum cost sharing amounts were imposed on non-exempt services (Figure 1). Overall, 31% of Medicaid expansion enrollees would not be subject to the cost sharing requirements either because they did not use any services in the year or they only used services, such as primary care, mental health treatment, or family planning services, that would be exempt from the cost sharing requirements. Among the remaining expansion enrollees in the 2021 claims data who used services potentially subject to cost sharing, the average enrollee received 15.5 services and could pay up to $542 annually for those Medicaid services.

Analysis of Medicaid Utilization Patterns Suggest That Older Expansion Enrollees and Those With Chronic Conditions Could Face Higher Cost Sharing Than Younger Enrollees and Those With No Chronic Conditions

Expansion adults who are older or who have multiple chronic conditions could face a much higher cost sharing burden than the average enrollee. Copayments that are required at the point of service have a greater impact on enrollees with higher health care needs who use more services. Compared to younger enrollees and those with fewer chronic conditions, adults ages 50-64 and those with multiple chronic conditions utilize more health care services and, therefore, are subject to higher cost sharing. Adults ages 50-64 could pay, on average, $736 per year or one-third more than the average enrollee and more than twice the $349 that younger adults ages 19-26 could pay (Figure 1). Medicaid enrollees with three or more chronic conditions would have the highest average cost sharing and could pay up to $1,248 per year, or more than twice what the average expansion enrollee could pay, and more than five times what Medicaid enrollees with no chronic conditions could pay.

Because of higher utilization, average cost sharing for single Medicaid expansion enrollees ages 50-64 and those with multiple chronic conditions who have income at 100% FPL could come close to exceeding or could exceed the cap of 5% of family income on out-of-pocket costs. While the required cost sharing for many Medicaid enrollees would not exceed 5% of family income, some expansion enrollees with particularly high utilization could face cost sharing amounts that would exceed the cap. Average cost sharing could amount to 4.7% of income for single Medicaid expansion enrollees ages 50-64 with income at 100% FPL, which is close to the 5% cap. For single enrollees with three or more chronic conditions, average cost sharing could be 8% of income at 100% FPL, exceeding the cap by three percentage points.

Interactive DataWrapper Embed

Methods

Medicaid Claims Data: This analysis uses the 2021 T-MSIS Research Identifiable Demographic-Eligibility and Claims Files (T-MSIS data) to identify Medicaid utilization.

State Inclusion Criteria: Though Idaho and Virginia expanded Medicaid prior to 2021, adult expansion enrollees primarily show up in the traditional adult eligibility group. Therefore, those expansion states are excluded from this analysis as they do not have sufficient expansion enrollees to be included.

Enrollee Inclusion Criteria: Enrollees were included if they were ages 19-64, had Medicaid coverage through the ACA’s Medicaid expansion in an expansion state, and were not dually enrolled in Medicare.

Identifying Utilization Subject to Cost Sharing: This analysis identifies eligible health care utilization in T-MSIS by stacking the inpatient (IP) and other services (OT) files, excluding claims that fall into exempted service categories, and then summing the remaining header claims to get a count of claims per enrollee. The prescription drug and institutional long-term care files are excluded from this analysis entirely. After stacking the IP and OT files, the following claims are excluded based on a combination of procedure codes and other methods described in previous KFF work:

  • Primary Care
  • Substance use treatment
  • Mental health treatment
  • Family planning services
  • Emergency services

The procedure codes used to define these exempted categories are available upon request.

Defining Chronic Conditions: This analysis used the CCW algorithm for identifying chronic conditions (updated in 2020). This analysis also included in its definition of chronic conditions substance use disorder, mental health, obesity, HIV, hepatitis C, and intellectual and developmental disabilities. In total, 35 chronic conditions were included.

Limitations: The cost sharing provision would only apply to Medicaid expansion enrollees with incomes between 100-138% of the federal poverty level, but that is not considered in this analysis as reliable income data is not available in T-MSIS. Relatedly, this analysis assumes similar utilization patterns across the entire expansion group, which likely does not reflect actual utilization patterns. Expansion enrollees with incomes at 100% or more of the federal poverty level are more likely to work, have fewer chronic conditions, and be younger. Additionally, this analysis assumes a $35 per service cost-sharing level, but it is not clear what cost-sharing states would ultimately levy on services.

The Implications of Federal SNAP Spending Cuts on Individuals with Medicaid, Medicare and Other Health Coverage

Published: Jun 26, 2025

Nearly 53 million people of all ages in the United States live in households that experience food insecurity, meaning they are unable to access adequate food due to lack of money or other resources. The Supplemental Nutrition Assistance Program (SNAP) was established in 1964 as a federal aid program to address food insecurity among low-income households by providing a monthly benefit to help participants purchase food.

The GOP’s House and draft Senate budget reconciliation bill, known as the One Big Beautiful Bill Act, is working its way through Congress and would reduce federal spending on SNAP by $287 billion over 10 years. Cuts to SNAP would produce budgetary savings but could produce higher rates of food insecurity and poorer health outcomes in the long run. Several studies indicate that individuals who receive SNAP benefits have better health and lower rates of food insecurity than similar people who are eligible but not receiving these benefits. Food insecurity is associated with multiple chronic conditions, poorer self-reported health status, higher health care utilization, and lower rates of medication adherence.

In addition to SNAP cuts, the reconciliation bill would cut federal health program spending by more than $1 trillion over the next decade, including $793 billion from Medicaid and $268 billion from the ACA Marketplaces – the largest cuts to federal support for health programs in the nation’s history. According to Congressional Budget Office (CBO), the bill will increase the number of uninsured by 10.9 million within ten years. The combination of federal spending reductions on SNAP and health programs would mean many people are at risk of losing both food assistance and health coverage, primarily those enrolled in Medicaid.

This analysis, based on the U.S Census Bureau’s 2023 Survey of Income and Program Participation (SIPP), examines the distribution of SNAP recipients and rates of food insecurity, by source of coverage.

The majority (78%) of people who received SNAP benefits in 2022 were covered by Medicaid, including 18% who were covered by both Medicaid and Medicare.

Nearly 30 million of the 38.3 million people receiving SNAP benefits in 2022 were enrolled in Medicaid (Figure 1). The overlap between the two programs reflects similar eligibility requirements for Medicaid and SNAP, though rules vary by state. Among Medicaid enrollees receiving SNAP benefits, 23.3 million were solely covered under Medicaid, while 6.7 million were also covered by Medicare (otherwise known as dual-eligible individuals). Medicaid was the primary source of coverage for children receiving SNAP, covering 88% of kids with SNAP, or approximately 13 million children.

A total of 9.2 million Medicare beneficiaries received food assistance benefits under SNAP, accounting for one in four (24%) SNAP recipients. Most Medicare beneficiaries with SNAP benefits (18% or 6.7 million) had supplemental coverage under Medicaid. In 2023, one in four Medicare beneficiaries lived on incomes below $21,000 per person.

Over 500,000 people who purchase health insurance coverage directly (mostly from ACA Marketplaces) received SNAP benefits in 2022. In addition, 2.4 million SNAP recipients were uninsured in 2022.

Most People Receiving SNAP Benefits in 2022 Were Enrolled in Medicaid and 1 in 4 Were Covered by Medicare

Some Medicaid enrollees who receive food assistance benefits from SNAP could lose both health insurance coverage and financial resources to supplement their food budgets as a result of the reconciliation bill.

Proposed changes in eligibility rules in both SNAP and Medicaid may jeopardize some people’s access to both adequate food and health care if various provisions of the bill take effect, in part because there is a significant overlap in eligibility requirements for Medicaid and SNAP across states. Four in 10 (40%) Medicaid enrollees receive SNAP benefits, compared to only 3% of those without Medicaid.

Recent KFF polling shows a majority of the public is worried about the consequences of significant reductions in federal Medicaid spending, and half of low-income adults reported their households having difficulty affording necessities, including food.

A CBO analysis of the House version of the reconciliation bill estimates that households in the lowest income decile could see a 4% decrease in resources by 2034, primarily due to changes in Medicaid and SNAP, while the highest income decile households would see a 2% increase in resources as a result of proposed tax cuts.

Many people enrolled in the programs slated for cuts in the reconciliation bill, including Medicaid and those receiving SNAP benefits, already experience food insecurity.

People living in households with and without SNAP report that they had problems affording food over the prior year. Overall, 52.8 million people lived in a household with food insecurity in 2022, including 30% of people enrolled in Medicaid (22.4 million), 13% of Medicare beneficiaries (8.7 million people), 26% of the uninsured, and 12% with coverage they purchased directly, including from ACA Marketplaces (Figure 2). A total of 14.6 million children lived in a household that experienced food insecurity in 2022.

Many households already struggling with food insecurity may be at risk of reduced SNAP benefits, or losing eligibility, at the same time they face new eligibility restrictions or higher costs for their healthcare. 22.4 million people enrolled in Medicaid experienced food insecurity, including 9.3 million children. Nearly 2 million people enrolled in direct purchase coverage in 2022 lived in a household experiencing food insecurity. Many of these households will face higher premium costs if Marketplace enhanced premium tax credits expire at the end of this year, increasing demands on some household budgets. Almost half of ACA Marketplace enrollees have incomes below 150 percent of the federal poverty level, $23,475 for an individual in 2025.

Among the 52.8 million people who reported food insecurity in their households in 2022, more than two-thirds (73%, or 38.6 million) were not receiving SNAP benefits. At the same time, even SNAP participants can experience food insecurity. Among the 38.3 million people receiving SNAP benefits in 2022, 37% (14 million) reported being unable to access adequate food due to lack of money or other resources.

Proposed cuts to SNAP could increase the number of people experiencing food insecurity and worsen affordability challenges for those already struggling to access food, as well as for those at risk of losing health insurance due to other changes in the legislation.

Three in Ten Medicaid Enrollees Lived in Households Experiencing Food Insecurity

 Methods

This analysis is based on the U.S Census Bureau’s 2023 Survey of Income and Program Participation (SIPP). The SIPP is a nationally representative, household-based survey that provides data on social program participation and eligibility, income, and labor force participation of the U.S non-institutional population. Health insurance source coverage was identified in the SIPP based on coverage held for at least 6 months of the calendar year. Respondents may report having more than one type of coverage in the survey instrument. In Figure 1, individuals are sorted into only one category of insurance coverage using the following hierarchy (Medicare, Medicaid, Direct Purchase (ACA), employer-sponsored insurance (ESI), Other, Uninsured). Throughout the analysis, dual enrolled Medicare and Medicaid people are included in both estimates unless specified otherwise. SIPP data provides estimates of multiple units of interest (i.e., person, family, or household). This analysis considers the person the unit of analysis.

SNAP coverage is defined as at least one month of coverage during the reference period (2022 calendar year), and the question is asked of all people.

The composite food security measure in the SIPP is assessed at the household-level, with responses provided by the household respondent applying to the entire household. The measure is based on the US Department of Agriculture Six-Item Short Form of the Food Security Survey Module and respondents were asked about the 2022 calendar year:

  • The food that I [or we] bought often or sometimes didn’t last, and [I/we] didn’t have money to get more.
  • I [or we] couldn’t afford to eat balanced meals often or sometimes of the time
  • In the past 12 months, did you or other adults in your household ever cut the size of meals or skip meals because there wasn’t enough money for food?
  • How often did you cut the size of your meals?
  • [Among respondents with positive responses to questions 1-3] In the last 12 months, did you ever eat less than you felt you should because there wasn’t enough money for food?
  • [Among respondents with positive responses to questions 1-3] In the last 12 months, were you ever hungry but didn’t eat because there wasn’t enough money for food?

What Could the Health-Related Provisions in the Reconciliation Bill Mean for Older Adults?

Published: Jun 26, 2025

The Trump Administration and Congress are moving quickly to pass legislation that could have significant implications for health coverage of older Americans. The House-passed reconciliation bill awaiting action by the full Senate, known as the One Big Beautiful Bill, includes several provisions that would affect health insurance coverage and well-being of older adults ages 50 and older, including those who are covered by Medicare.

The House-passed reconciliation bill includes an estimated $793 billion in federal Medicaid spending cuts over the next 10 years, including several provisions expected to increase costs or eliminate coverage for Medicaid beneficiaries, with similar provisions in the draft Senate bill. Collectively, these provisions could affect the 22 million people ages 50 and older with coverage under the Medicaid program by reducing the number of people with Medicaid and reducing access to health and long-term care services for people who remain enrolled in the program. The House bill and draft Senate language also include changes that are expected to reduce the number of people with ACA Marketplace coverage, including among 50-64 year olds.

According to KFF’s most recent poll, one third (34%) of adults ages 50 and older said they have a favorable view of the tax and budget bill moving rapidly through Congress, with stronger support among Republicans (61%) than Independents (23%) or Democrats (9%). After hearing that the bill would increase the number of uninsured by 10 million people, the share of adults ages 50 and older with favorable views drops from 34% to 24% and from 61% to 39% among Republicans. Among older adults who self-identify as MAGA, support for the bill drops from 70% to 45%. Support drops by a similar amount when people are told that the bill would decrease funding for local hospitals (see Figure 1 below).

Below are six health-related provisions to watch as the reconciliation bill works its way through the Congress. Some health care provisions of the Senate bill have been ruled out of order by the Senate parliamentarian and may need to be revised or eliminated for the legislation to pass with a simple majority.

1. New Medicaid Work Requirements. The largest source of federal Medicaid spending cuts would come from new work requirements that would be imposed on the Medicaid expansion population. The Congressional Budget Office (CBO) estimates that the work requirements in the House-passed bill would reduce Medicaid spending by $344 billion and cause nearly 5 million people to become uninsured. If passed, the bill would require adults ages 50-64 to meet new work and reporting requirements if they are enrolled through the ACA expansion. Most Medicaid enrollees ages 50-64 are working or could be exempt from the work requirements because of a disability or caregiving responsibility, but they would still need to comply with reporting requirements, putting them at risk of risk losing Medicaid coverage. According to a new KFF analysis, fewer than half of adults ages 50-64 would meet the work requirements through either employment or school, compared with 72% of adults ages 19-27 and 66% of adults ages 27-49. Those who do not qualify for an exemption could also face greater challenges reentering the workforce because of their age and physical limitations.

2. Changes to ACA Marketplaces. An estimated 5.5 million adults ages 55 to 64 get health insurance from ACA Marketplaces in 2025. The House-passed bill and Senate draft bill make changes to the ACA Marketplaces that would increase the number of people who are uninsured, including older people ages 50-64. The legislation in its current form, combined with the Trump administration Marketplace integrity rules, would shorten the open enrollment period, impose new documentation and pre-enrollment verification of eligibility requirements, and make other changes that would affect enrollment. Overall, the outcome would be loss of health insurance coverage for an estimated 4 million people by 2034, including older adults.

Further, because the bill in its current form does not extend enhanced ACA premium tax credits for Marketplace coverage that are set to expire at the end of this year, an additional 4.2 million people (including older adults) are estimated to lose coverage by 2034. Without enhanced premium tax credits, enrollees with incomes over four times poverty would lose subsidy eligibility and those with incomes between 100 and 400% of poverty will receive a smaller tax credit. Over half of individual market enrollees with incomes above four-times the poverty threshold are between the ages of 50 and 64.

Health insurance premiums are higher for people in their 50s and early 60s than for younger adults choosing the same plan in the same area. If the enhanced premium tax credits expire, enrollees currently receiving a subsidy could face higher costs to enroll, particularly if their incomes are about or above 400% of poverty. For example, according to the KFF calculator, a 59 year old single widow living in Jackson, Missouri earning $62,000 (just above 400% of the poverty level) would pay $5,270 for her silver Marketplace plan in 2025, but without enhanced premium tax credits, she would pay $14,213 in premiums, which amounts to 22.9% of her income for the same health insurance policy. It’s not hard to see why she and others like her might give up their Marketplace plans, given the cost relative to their income.

3. Blocking Implementation of the Medicare Savings Program and Medicaid Eligibility and Enrollment Rules. Older adults are also at risk of losing coverage due to provisions in the House-passed bill and the Senate Finance Committee language that would block implementation of two Biden-era rules that were intended to streamline the enrollment process for Medicaid, especially for older adults and people with disabilities. The second largest source of federal reductions in Medicaid spending stems from these two provisions, which are collectively estimated to reduce federal Medicaid spending by $167 billion.

Both rules aim to reduce barriers to enrolling in and maintaining Medicaid coverage. They are expected to disproportionately affect enrollment among older adults and people with disabilities because there are specific requirements related to streamlining enrollment among Medicare beneficiaries, and to facilitating smoother enrollment for people who are eligible for Medicaid because they have a disability, are ages 65 and older, or use long-term care.

CBO estimates that the reconciliation language would result in 1.3 million low-income Medicare beneficiaries losing Medicaid coverage. A separate KFF analysis shows that the loss of these benefits would result in a someone with an income of $967 per month paying $185 per month in Medicare premiums, or about 20% of income, without accounting for other non-trivial out-of-pocket costs, including Medicare cost-sharing requirements and the loss of Medicaid benefits.

4. Reducing Spending for Long-Term Care Services. If signed into law, the House-passed bill and the draft Senate legislation would reduce federal funds for nursing facilities and would likely lead to reductions in spending for other long-term care services. The bill would reduce federal Medicaid spending by $23 billion over 10 years by prohibiting implementation of a Biden Administration rule on nursing facility staffing. The rule aims to help address long-standing concerns about inadequate staffing and the quality of care, locking into place a federal judge’s ruling to overturn key elements of the rule.

The reconciliation bill could also reduce Medicaid funds available to nursing facilities through a moratorium on provider taxes (in place for nursing facilities in 46 states) and new limits on some payments to nursing facilities (known as state-directed payments). In the House bill, those provisions jointly account for $161 billion in reduced federal Medicaid spending over 10 years, although they would also affect hospitals and other providers. The Senate Finance language would also reduce existing state-directed payments to 100% of Medicare rates in states that have adopted the ACA expansion and 110% of Medicare rates in states that have not.

If past predicts future, substantial cuts to federal Medicaid spending could lead to reduced spending for home care, which includes long-term care provided in people’s homes and the community (and is sometimes referred to as home- and community-based services or HCBS). During the last major reduction in federal spending, all states reduced spending on home care by serving fewer people (40 states) or by benefits or cutting payment rates (for long-term care providers) (47 states). As a significant source of Medicaid spending comprised of optional services for which there are already waiting lists, home care may be especially vulnerable.

5. Prohibiting Medicare Coverage for People with Lawful Immigrant Status. Under current law, undocumented immigrants are not eligible for Medicare. Medicare coverage is restricted to people who are citizens or permanent legal residents. Both the House-passed reconciliation bill and draft Senate legislation include a provision that would prevent defined groups of individuals who are lawfully present in the U.S. from becoming eligible for Medicare benefits. The legislation would also terminate Medicare coverage for currently eligible beneficiaries who are not U.S. citizens, green card holders, certain immigrants from Cuba, and people residing under the Compacts of Free Association within a year of enactment of the legislation. Individuals affected by this provision and their employers would continue to be required to pay Medicare payroll taxes. This would be the first time that Congress has taken away coverage from potentially eligible legally residing individuals.

The Senate parliamentarian has ruled that this provision, as currently drafted, would require 60 votes to pass.

6. Adding Work Requirements and Cutting Spending for Supplemental Nutritional Assistance Program (SNAP). The House-passed reconciliation bill and draft Senate bill includes nearly $300 billion in cuts to SNAP benefits. Reductions of this magnitude, coupled with work requirements, are likely to affect the health of older adults, particularly given the strong ties between health and nutrition. As noted above, work requirements, even with exemptions, pose administrative hurdles for older adults that put them at risk for losing SNAP benefits. An estimated 9.2 million Medicare beneficiaries received SNAP benefits to help cover the costs of food and groceries in 2022, according to KFF analysis. The SNAP work requirements may particularly exacerbate financial challenges for older Medicaid enrollees ages 50 and older who are two and a half times more likely to experience food insecurity than other older adults not enrolled in Medicaid (28% compared to 10%).

Favorable Views About the One Big Beautiful Bill Among Adults Ages 50+ Drop After Hearing the Bill Increases the Uninsurance Rate and Decreases Hospital Funding

This work was supported in part by the John A. Hartford Foundation. KFF maintains full editorial control over all of its policy analysis, polling, and journalism activities.

Explaining Cost-Sharing Reductions and Silver Loading in ACA Marketplaces

Authors: Emma Wager and Cynthia Cox
Published: Jun 26, 2025

Originally published on June 2, this Policy Watch has been updated to reflect subsequent developments related to the reconciliation bill.

The House of Representatives recently passed a budget reconciliation bill that would appropriate funding for cost-sharing reductions that insurers are required to provide to low-income enrollees in the Affordable Care Act marketplace. The Congressional Budget Office (CBO) has estimated that this action will reduce the deficit by $31 billion and increase the number of people without health insurance by 300,000 through 2034. This provision was ruled out of order by the Senate parliamentarian (Byrd rule) on June 26, 2025 and may need to be revised or eliminated for the legislation to pass with a simple majority.

This brief explains what these cost-sharing reductions are, how they relate to federal spending, and how appropriating funding impacts premiums and the uninsured rate.

What are cost-sharing reductions?

The Affordable Care Act (ACA) has two types of financial assistance for lower-income enrollees: assistance with monthly premiums (“premium tax credit”) and assistance with out-of-pocket expenses when people get medical care or fill a prescription (“cost-sharing reductions”).

The ACA requires insurers to offer plans with reduced patient cost-sharing (e.g., deductibles and copays) to marketplace enrollees with incomes between 100 and 250% of the poverty level (an annual income of $15,650 to $39,125 for a single person in the contiguous U.S.). The reduced cost-sharing is only available in silver level plans, and the premiums are the same as standard silver plans.

The cost-sharing reductions (CSRs) significantly lower deductibles in these plans: for plans where there is a combined deductible for medical care and prescription drugs, the average deductible is reduced for those with incomes below 150% of poverty from $4,902 to $87; for those with incomes between 150% and 200% of poverty, the average deductible is reduced to $682; and for enrollees with incomes between 200% and 250% of poverty, the average deductible is $3,620.

During the Obama administration, from the start of ACA implementation in 2014, the federal government paid insurers directly to offset the cost-sharing reductions. To compensate for the added cost to insurers of the reduced cost-sharing, the federal government was making 7 billion dollars in annual payments directly to insurance companies by 2017.

In 2016, a federal district judge ruled that direct CSR payments without explicit congressional appropriation were illegal, but stayed the ruling after it was appealed by the Obama administration. However, in October 2017, the Trump administration stopped the appeals process and chose to end the CSR payments, saying at the time the ACA was “dead.”

What is silver loading?

In response to the federal government ending cost-sharing reduction payments, most insurers raised silver premiums substantially to compensate for the loss of CSR payments. Most states either allowed or encouraged insurers to “load” the cost of CSRs onto silver premiums only (not onto other metal levels), since silver plans are the only plans where cost-sharing reductions are available. The practice of increasing silver plan premiums to compensate for the loss of federal CSR payments is known as “silver loading.” From 2017 to 2018, average benchmark silver plan premiums rose by about 17 percentage points more than bronze premiums did.

In August 2018, the Trump administration issued guidance encouraging state regulators to allow insurers to increase only the premium on silver plans offered on-exchange, so that off-exchange silver plans could be priced lower. The 2026 Notice of Benefit and Payment Parameters (issued by the Biden Administration in January 2025) codified the practice of silver loading so long as it is permitted by the state regulator and the insurer does not receive other reimbursements for cost-sharing reductions.

What is the cost of silver loading to the federal government?

While the federal government saved money by no longer making CSR payments, those savings were offset by higher payments for premium tax credits that result from silver loading. That is because the ACA’s premium tax credits are based on the premium for a benchmark plan in each area: the second-lowest-cost silver plan in the marketplace. The premium tax credit is calculated as the difference between the premium for that benchmark plan and a premium cap calculated as a percent of the enrollee’s household income. Any systematic increase in premiums for benchmark silver plans increases the amount of premium tax credits.

The increased tax credits completely cover the increased premium for subsidized enrollees covered through the benchmark silver plan. Enrollees who apply their tax credits to other plans (e.g., bronze, gold, or other silver plans) would also receive increased premium tax credits even if they do not qualify for reduced cost-sharing and even if the underlying premiums in their plans might not have increased at all. After 2017, increased premium tax credits allowed many more individuals to purchase bronze – and sometimes even gold – plans with zero out-of-pocket premium costs.

For this reason, ending federal payments for cost-sharing reductions ended up costing the federal government more money than if the cost-sharing reduction payments had continued. Additionally, subsequent research has pointed to the practice of silver loading having an upward effect on ACA Marketplace enrollment.

An August 2017 CBO report projected that ending CSR payments would increase the federal deficit by $6 billion in 2018, $21 billion by 2020 and $26 billion by 2026, and added that after taking premium tax credits into account, most enrollees would pay similar or lower premiums than they had been paying before.

What does the House reconciliation bill do with CSR funding?

The budget reconciliation bill passed by the House in May 2025 appropriates funding for cost-sharing reductions, returning to the pre-2017 federal payment system practice. The bill does not explicitly ban silver loading, but if insurers receive federal CSR payments, they will no longer have a justification to silver load under current regulations.

The bill also bans federal CSR payments to insurers for Marketplace plans that include coverage for abortion, which will raise conflicts with state laws in a dozen states requiring abortion coverage. It is not yet clear how those states will respond (e.g., whether they will restrict abortion coverage in ACA marketplace plans and allow insurers in their state to receive federal cost-sharing reduction payments).

Although the federal government would resume CSR payments to insurers, this is expected to reduce the federal deficit by effectively ending silver-loading, thus lowering benchmark silver plan premiums, which in turn reduces the dollar amount of premium tax credits paid out to subsidized enrollees.

What might be the effect on premiums and enrollment?

Premiums for silver plans – before accounting for premium tax credits – are expected to decrease as silver-loading would no longer be necessary if funding for CSRs is appropriated. Given that silver premiums rose by about 17 percentage points more than bronze plans did in 2018, it is likely there could be a similar drop in gross premiums for silver plans if this legislation passes. Meanwhile, funding CSRs is likely to have little or no effect on what insurers charge for bronze and gold premiums (before accounting for the premium tax credit).

However, the vast majority of ACA Marketplace enrollees receive a premium tax credit and therefore do not pay the gross premium. Generally speaking, subsidized enrollees who pick a silver level plan may see no difference in their monthly out-of-pocket premium payments resulting from the funding of CSRs. Meanwhile, enrollees who pick a bronze or gold level plan will likely pay more for their monthly premium. This is because bronze and gold gross premiums would be unaffected, while the total amount of the premium tax credit is smaller, resulting in people in those plans paying more than they would have with silver loading.

Because enrollees in bronze and gold plans would face higher premium payments if CSRs are appropriated, it’s likely some of these enrollees would drop their coverage, thus having an upward effect on the uninsured rate. The enrollees who drop their coverage as a result of CSR appropriation are likely to be middle-income people (those making between two and four times the poverty level).

However, the appropriation of CSRs is just one of many changes the reconciliation package makes to the ACA Marketplaces. Other provisions of the budget reconciliation, as well as expiring enhanced subsidies, will have separate effects on premiums and the amount of financial assistance enrollees receive.

5 Key Facts About Medicaid Coverage for People Living in Rural Areas

Published: Jun 26, 2025

Approximately 66 million people in the United States live in rural areas – about 20% of the population. Individuals living in rural areas may experience unique health care challenges compared to individuals living in urban areas. They report poorer physical and mental health, and have lower incomes and higher rates of poverty than individuals living in urban areas. Additionally, individuals in rural areas may have less access to health care services due, in part, to provider shortages in rural areas, and many rural hospitals have closed or are at risk of closure.

Evidence suggests that Medicaid helps mitigate some of these challenges. Medicaid covers nearly half of all births in rural areas and one-fifth of inpatient discharges in rural hospitals. Studies have shown that the Affordable Care Act (ACA) Medicaid expansion is associated with improved hospital financial performance and lower likelihood of hospital closure, particularly for rural hospitals; significant increases in the number of visits to providers for services such as mammograms and substance use disorders in rural areas; and higher staffing levels in rural community health centers.

The One Big Beautiful Bill passed by the House is projected to reduce federal Medicaid spending by $793 billion over 10 years, based on Congressional Budget Office (CBO) estimates, which could have a significant impact on rural communities and individuals living in rural areas who rely on Medicaid for health care coverage. The Senate finance committee’s draft reconciliation language includes similar provisions as the House, but with potentially more significant funding cuts for hospitals, particularly in states that have adopted the ACA expansion. Polling data show that among both parties, most people living in rural areas say Medicaid is “very important” for people in their local community and that they or a family member has received help from Medicaid at some point. Many are worried about the effects of the federal spending reductions to their communities. Furthermore, researchers estimate that more than 300 rural hospitals might be at risk of closure if the federal Medicaid spending cuts as outlined in the House bill are enacted.

1. Nearly 1 in 4 people in rural areas have Medicaid coverage.

Medicaid is the second largest source of health care coverage in both rural and urban areas. However, Medicaid covers a somewhat higher share of people (including those who have both Medicaid and Medicare coverage) in rural areas compared to urban areas, 24% and 21%, respectively. Employer-sponsored insurance is the largest source of health care coverage in rural and urban areas but covers a lower share of people in rural areas (42%) compared to urban areas (50%). Rates of uninsurance are similar across both rural and urban areas.

States have wide variation in their rates of Medicaid coverage in rural areas and in their shares of Medicaid enrollees who are living in rural areas (Appendix Table 1). In six states, at least half of Medicaid enrollees are living in rural areas – Vermont, Wyoming, South Dakota, Mississippi, Montana and Kentucky (Appendix Table 1).

Nearly 1 in 4 People in Rural Areas Have Medicaid Coverage

2. People living in rural areas in expansion states have higher rates of Medicaid coverage and lower rates of uninsurance compared to non-expansion states.

States that expanded Medicaid have a somewhat larger share of individuals enrolled in Medicaid (including those dually enrolled in Medicaid and Medicare) in rural areas (25%) than states that did not expand Medicaid (22%). This contributes to a lower uninsured rate in rural areas – in expansion states, 7% of people are uninsured compared to 11% in states that did not expand Medicaid. Expansion and non-expansion states have similar rates of employer-sponsored health insurance coverage in rural areas (42% vs 41%).

Research shows that Medicaid enrollees, in general, have substantially better access to care than people who are uninsured and are less likely to postpone or go without needed care due to cost, as federal rules generally limit out of pocket Medicaid costs. A study focused specifically on rural Medicaid enrollees found that gaining Medicaid coverage significantly increased the likelihood that rural residents felt their health care needs were addressed from when they were uninsured.

People Living in Rural Areas in Expansion States Have Higher Rates of Medicaid Coverage and Lower Rates of Uninsurance Compared to Non-Expansion States

3. Children and expansion adults represent over half of rural Medicaid enrollees.

In rural areas, children are the largest Medicaid eligibility group, constituting 36% of enrollees, followed by expansion adults who represent 20% of rural Medicaid enrollees. When looking only at Medicaid enrollees who live in the most rural areas (i.e. rural areas not adjacent to metropolitan areas), the share of expansion adults increases to 24% of enrollees (Appendix Figure 1). In expansion states, the share of rural Medicaid enrollees who are eligible through the ACA expansion jumps to 30% (data not shown), a group that is more at risk of losing Medicaid coverage given the targeting of federal spending reductions to expansion states. A majority (63%) of rural enrollees are White, with smaller shares of Black (12%) and Hispanic (10%) enrollees. This is a notably different demographic make-up compared to urban enrollees, where only one-third of urban enrollees are White (data not shown).

Children and Expansion Adults Represent Over Half of Rural Medicaid Enrollees

4. Nearly 4 in 10 rural Medicaid enrollees under age 65 have a diagnosed chronic condition.

Chronic conditions are conditions that last at least one year and require ongoing medical care or limit daily activities (e.g. heart disease, diabetes, cancer, mental illness, etc.). Thirty-eight percent of rural Medicaid enrollees under age 65 and not dually enrolled in Medicare have at least one diagnosed chronic condition. Of those with at least one chronic condition, approximately one-quarter have three or more chronic conditions (data not shown). The most diagnosed chronic conditions for these rural Medicaid enrollees are physical (which include high blood pressure, obesity and high cholesterol), with 24% of rural Medicaid enrollees having at least one diagnosed physical health condition. Behavioral health conditions, which include mental health and substance use conditions, are diagnosed in 22% of rural Medicaid enrollees and 5% of rural Medicaid enrollees have a diagnosed cognitive impairment condition, including dementia and intellectual and developmental disabilities, which often cause functional limitations that require long-term care.

Rates of diagnosed chronic conditions are calculated from Medicaid claims data, which reflect only diagnoses recorded during medical visits in 2021 and do not measure overall prevalence. Prevalence rates from surveys are generally higher than claims-based estimates because not everyone is screened, treated, or has a recorded diagnosis for their chronic conditions in claims data in any given year. The numbers exclude Medicaid enrollees who also have Medicare (since Medicare is the primary payer for outpatient and acute care services), as well as enrollees ages 65 and older, nearly all of whom also have Medicare coverage (see Methods for more details).

Nearly 4 in 10 Rural Medicaid Enrollees Under Age 65 Have a Diagnosed Chronic Condition

5. A higher percentage of rural Medicaid enrollees used care in expansion states than in non-expansion states.

Eighty-two percent of Medicaid enrollees living in rural areas in expansion states had at least one health care claim in the year compared to 74% of rural Medicaid enrollees in non-expansion states. Enrollees living in urban areas in expansion states also utilized care at higher rates than those living in non-expansion states, although by a smaller margin than rural enrollees, 80% to 74%, respectively (data not shown).

A Higher Percentage of Rural Medicaid Enrollees Used Care in Expansion States Than in Non-Expansion States

Methods

American Community Survey Data: This analysis uses the 2023 American Community Survey (ACS) 1-year estimates to calculate Medicaid coverage rates in rural areas in Figures 1 and 2.

Medicaid Claims Data: This analysis uses the 2021 T-MSIS Research Identifiable Demographic-Eligibility and Claims Files (T-MSIS data) to identify rural Medicaid enrollees and their demographics, chronic conditions and utilization of care in Figures 3-5, Appendix Table 1 and Appendix Figures 1-2.

State Exclusion Criteria:

  • Race/Ethnicity (Figure 3): 14 states were excluded from this figure because they received a “High Concern/ Unusable” rating on the R/E DQ Atlas assessment measure.
  • Chronic Conditions (Figure 4): Mississippi was excluded from this figure. See brief here for more information on state exclusion criteria when calculating chronic condition rates.
  • Utilization (Figure 5 and Appendix Figure 2): Mississippi was excluded from this figure. See our brief here for more information on state exclusion criteria for utilization analysis.

Defining Rural Medicaid Enrollees in ACS and Medicaid Claims Data: Medicaid enrollees living in urban areas are defined as those living in a metropolitan area, while Medicaid enrollees living in rural areas are defined as those living in nonmetropolitan areas. A metropolitan area is a county or group of counties that contains at least one urban area with a population of 50,000 or more people. Nonmetropolitan areas include micropolitan areas—which are counties or groups of counties that contain at least one urban area with a population of at least 10,000 but less than 50,000—and noncore areas (areas that are neither metropolitan nor micropolitan). Appendix tables and figures further break down rural areas into those that are adjacent to metropolitan areas and those that are not adjacent to metropolitan counties (defined as the “most rural” areas in this brief).

This analysis categorized counties and county equivalents based on 2024 Urban Influence Codes from the USDA, as follows:

  • Urban
  • 1: Large metro (in a metro area with at least 1 million residents)
  • 4: Small metro (in a metro area with fewer than 1 million residents)
  • Rural, adjacent to a metro area
  • 2: Micropolitan, adjacent to a large metro area
  • 3: Noncore, adjacent to a large metro area
  • 5: Micropolitan, adjacent to a small metro area
  • 6: Noncore, adjacent to a small metro area
  • Rural, not adjacent to a metro area (“most rural”)
  • 7: Micropolitan, not adjacent to a metro area
  • 8: Noncore, not adjacent to a metro area and contains a town of at least 5,000 residents
  • 9: Noncore, not adjacent to a metro area and does not contain a town of at least 5,000 residents

Defining Chronic Conditions (Figure 4): This figure reflects diagnosed chronic conditions for rural Medicaid enrollees who are under age 65 and not dually enrolled in Medicare. This analysis used the CCW algorithm for identifying chronic conditions (updated in 2020). This analysis also included in its definition of chronic conditions substance use disorder, mental health, obesityHIV, hepatitis C, and intellectual and developmental disabilities. In total, 35 chronic conditions were included and were further grouped into 3 broad categories: behavioral health, physical health, and cognitive impairment conditions. Specific conditions within these groupings include:

  • Behavioral health conditions: Any mental health condition and any substance use disorder. See KFF’s brief, “5 Key Facts About Medicaid Coverage for Adults with Mental Illness,” KFF brief “SUD Treatment in Medicaid: Variation by Service Type, Demographics, States and Spending,” and the Urban Institute, Behavioral Health Services Algorithm for additional details (Victoria Lynch, Lisa Clemans-Cope, Doug Wissoker, and Paul Johnson. Behavioral Health Services Algorithm. Version 4. Washington, DC: Urban Institute, 2024).
  • Physical health conditions: Hypertension, transient ischemic attack, acute myocardial infarction, hyperlipidemia, ischemic heart disease, atrial fibrillation, heart failure, obesity, chronic obstructive pulmonary disease, pneumonia, asthma, diabetes, arthritis, hip fracture, osteoporosis, cataracts, glaucoma, chronic kidney disease, colorectal cancer, endometrial cancer, urologic cancer, prostate cancer, lung cancer, breast cancer, hepatitis, HIV, anemia, hypothyroidism
  • Cognitive impairment conditions: Alzheimer’s, intellectual and developmental delay, Parkinson’s, and dementia

Defining Utilization of Care (Figure 5): An enrollee is determined to have utilized care in the year if they have a claim in the inpatient, long-term care, prescription drug or other services files in the T-MSIS data.

Appendix

Medicaid Enrollees Living in Rural and Urban Areas By Degree of Rurality, 2021
Share of Rural Medicaid Enrollees by Eligibility Group and Type of Rurality, 2021
Percent of Rural Medicaid Enrollees Who Used Care by State Expansion Status and Type of Rurality, 2021

VOLUME 25

Shifts in Funding Priorities and Vaccine Guidance Contribute to Safety Myths. Plus, Reactions to Ruling in U.S. v. Skrmetti


Summary

This volume examines how the U.S. government’s cancellation of $766 million in contracts with Moderna to develop pandemic flu vaccines, along with unfounded claims by new vaccine advisors, has contributed to the spread of persistent myths about the safety of mRNA technology. It also explores how shifting COVID-19 vaccine guidance and false claims are re-igniting misleading narratives about miscarriage. Lastly, it analyzes how reactions to a Supreme Court ruling upholding a state ban on gender-affirming care for minors further misconceptions and inflammatory language.


Recent Developments

Cancellation of mRNA Flu Vaccine Contract Leads to Renewed Safety Debate

CHRISTOPH BURGSTEDT/SCIENCE PHOTO LIBRARY / Getty Images

The federal government’s termination of $766 million in contracts with Moderna for the development of vaccines against pandemic influenza viruses, including the H5N1 bird flu, has led to renewed conversation about the virus and debate about the safety of mRNA vaccines. Moderna said that its vaccine candidate against H5 avian flu had progressed through early clinical trials involving 300 healthy adults, with 97.8% of participants achieving protective levels of antibody titers three weeks after the second dose. A spokesperson for the Department of Health and Human Services (HHS) attributed the contract cancellation to “safety concerns,” falsely claiming that “mRNA technology remains under-tested,” even though mRNA vaccines for COVID-19 were tested in Phase 3 clinical trials involving more than 70,000 adults. Millions of doses have been administered worldwide, and monitoring data supports their strong safety profile. Despite this, administration officials have previously made broad, unfounded claims about the safety of mRNA vaccines, and several states are considering banning the technology.

KFF analysis of social media showed that mentions of mRNA vaccines increased on May 29, the day after the contract cancellation, appearing more than twice as often as the daily average over the previous two weeks. Online reaction was divided, with some users expressing concern over public health risks while others celebrated the cancellation as a stand against pharmaceutical companies. The most-engaged-with post, from a commentator with more than 1.4 million followers on X, said, “No more blank checks for big Pharma to run experiments on the American people!” Several posts amplified misleading narratives about the safety of mRNA vaccines, with one account with over 900,000 followers and medical credentials in their biography writing, “Americans are done funding failed mRNA experiments that enrich pharma giants and endanger public health.” The most viral posts combined distrust of pharma with vaccine skepticism, which is a familiar pairing in high-engagement misinformation.

Polling Insights: KFF’s April Tracking Poll on Health Information and Trust found that mRNA technology is obscure to much of the public, including partisans. Overall, about one-third (32%) of U.S. adults say vaccines that use mRNA technology are “generally safe” – twice the share of those who say they are “generally unsafe” (16%). However, half (52%) of adults say they do not know enough about mRNA technology to say whether it is safe or not. While Republicans and independents are much more likely than Democrats to say mRNA vaccines are “generally unsafe,” most Republicans (61%) and roughly half of independents and Democrats report not knowing enough about this technology to say.

At Least Half of the Public and Partisans Don’t Know Enough About mRNA Vaccines To Say Whether They Are Safe, Though Democrats Are Less Likely To Believe They Are Unsafe

Unfounded Claims About Spike Protein May Cause Confusion About mRNA Vaccine Safety

KATERYNA KON/SCIENCE PHOTO LIBRARY / Getty Images

Misconceptions about mRNA vaccines continue, as people express uncertainty about how these vaccines impact their health long term. One common concern is that the spike protein produced by the COVID-19 mRNA vaccine is toxic and can cause damage to a person’s organs. mRNA vaccines for COVID-19 trigger an immune response by instructing cells to create the spike protein found on the surface of the SARS-CoV-2 virus, but the spike proteins created by the vaccine are not toxic and are quickly degraded by the body. Studies have not found evidence that the spike proteins created by vaccines damage organs. Still, the claim has been spread by health officials, including new members of the federal Advisory Committee on Immunization Practices (ACIP). One new appointee to the group, which advises the Centers for Disease Control and Prevention (CDC) on immunization schedules and recommendations for the public, has previously falsely claimed that the spike protein can cause “permanent damage” in children’s organs and that mRNA vaccines can cause cancer or a form of AIDS. Other new members have made similar unfounded statements about mRNA safety, with one writing, “The evidence is mounting and indisputable that mRNA vaccines cause serious harm including death, especially among young people.”

The claims reflect broader public misconceptions. In the 30 days leading up to June 20, approximately 66% of social media posts identified by KFF that mentioned the spike protein in COVID-19 vaccines referenced safety, while 21% discussed potential toxicity. Beyond public perception, the misconceptions held by ACIP appointees can impact the CDC’s immunization recommendations and, therefore, which vaccines are covered at no cost by insurance providers.

Polling Insights: KFF’s April Tracking Poll on Health Information and Trust found that about nearly half (45%) of the public report having heard the false claim that mRNA vaccines can alter your DNA, and while few think this myth is “definitely true,” most express uncertainty. Overall, just 3% of adults say it is “definitely true” that mRNA vaccines can change your DNA with much larger shares (24%) saying this is “definitely false.” However, most adults fall in a malleable middle category, saying this claim is either “probably true” (26%) or “probably false” (45%).

The share who believe or lean toward believing this myth differs across partisans, with Republicans and independents each about twice as likely as Democrats to say it is “definitely true” or “probably true” that mRNA vaccines can change your DNA (37% of Republicans and 33% of independents v. 13% of Democrats).

Large Majorities of the Public and Partisans Are Uncertain if the Myth That mRNA Vaccines Can Change Your DNA Is True

Miscarriage Myths Reemerge as HHS Changes COVID Vaccine Recommendations

Morsa Images / Getty Images

Misleading reports of fetal loss following COVID-19 vaccination are contributing to concern over the safety of the vaccine for pregnant people. A 2024 meta-analysis published in BMJ found no increased risk of adverse pregnancy or perinatal outcomes following vaccination during pregnancy. In fact, vaccination reduced the risk of hospitalization with COVID-19 during pregnancy by 94%. However, false claims made by a Florida OB-GYN during a May 21 Senate subcommittee hearing have further fueled these concerns. The doctor repeated the debunked narrative that a 2021 study in The New England Journal of Medicine showed an 82% miscarriage rate following COVID-19 vaccination, but his interpretation only included people who were vaccinated in their first or second trimesters and reported completing their pregnancies by the time of follow-up interviews three months later. The actual study found a miscarriage rate of 12.6%, in line with the prevalence of miscarriage in all known pregnancies.

The testimony caused large spikes in social media posts linking COVID-19 vaccines to miscarriage. One account with more than 1.7 million followers posted video of the testimony and repeated the doctor’s false claim that the COVID-19 vaccine functions like abortion medications. Although mentions of miscarriage or fetal loss make up a small portion of overall COVID-19 vaccine conversations, of those that do mention it, the most-engaged-with content amplifies the false claim that the vaccine causes miscarriage in up to 80% of pregnancies. Following the testimony, HHS announced that the CDC would no longer recommend COVID-19 vaccines for healthy children or pregnant people, again citing misleading studies to support the policy shift. Reactions to the HHS announcement were mixed, with some on social media calling for more by banning COVID-19 for all people. Others expressed fear about how this may impact vaccine availability for those who chose to be vaccinated, as the CDC no longer recommends COVID-19 vaccination during pregnancy but still lists pregnancy as a high-risk underlying condition.

Misconceptions and Inflammatory Language Follow Supreme Court Ruling on Gender-Affirming Care

joe daniel price / Getty Images

The June 18 Supreme Court’s decision to uphold a Tennessee law banning gender-affirming care for minors led to one of the largest spikes in news reports and social media conversations about gender-affirming care in 2025 thus far. Many of the posts repeated misconceptions about gender-affirming care that underlie most similar bans, including the inaccurate belief that it is experimental or lacks sufficient evidence. In reality, many of the medical treatments involved, like puberty blockers and hormone therapies, have been used safely for decades in cisgender children and adults to treat conditions including delayed and precocious puberty. U.S. medical associations, including the American Medical Association, American Academy of Pediatrics, and the American Psychological Association, support youth access to gender-affirming care, pointing to evidence that such care improves mental health outcomes for transgender youth. Research has found gender-affirming medical interventions to be associated with lower odds of depression and suicidality.

Posts also frequently used emotionally charged language to evoke fear, inaccurately referring to gender-affirming care as “mutilation,” “castration,” or “maiming,” and comparing it to female genital mutilation. Female genital mutilation includes non-medical procedures recognized as human rights violations. In the last 30 days, as of June 20, approximately 12% of social media posts about gender-affirming care identified by KFF included such terms, up from 7% in the previous 30 days. One podcaster with 3.7 million followers celebrated the ruling on X, calling it “a fatal blow to the child mutilation industry,” while Attorney General Pam Bondi said the decision “allows states to protect vulnerable children from genital mutilation.” Mentions of these terms previously spiked on June 2, after the Federal Bureau of Investigation (FBI) asked the public to report providers who they said “mutilate” children by offering gender-affirming surgery to minors.

The use of such language can suggest violence or harm and has been used in unsubstantiated claims that schools or healthcare providers are providing transition-related care without parental knowledge or consent. In reality, the most common forms of transition, especially for minors, are non-medical, such as altering clothing, hairstyle, or pronouns to better fit their gender identity. When medical interventions are pursued, they are consensual, medically supervised, and evidence-based treatments. Surgical interventions are relatively uncommon among adults and very rare among minors. One study of more than 22 million youth found that fewer than .01% of transgender and gender diverse adolescents ages 13 to 17 underwent gender-affirming surgery, and none under 12 received such care.


AI & Emerging Technology

AI Usefulness in Diagnostics May be Limited by Human Interactions

Yana Iskayeva / Getty Images

While previous research has shown artificial intelligence chatbots to be capable of passing the United States Medical Licensing Exam, a new study from researchers at the University of Oxford highlights that human interactions with these tools may limit their accuracy and usefulness. Researchers tested whether large language models (LLMs) could help members of the public correctly identify health conditions and determine a course of action in 10 common medical scenarios. They found that when performing alone, the LLMs correctly identified conditions in 94.9% of cases. But, real people using the same models identified relevant conditions in only 34.5% of cases, underperforming a control group that did not use the AI chatbots.

The researchers examined the transcripts of participant interactions with the chatbots, observing cases where the participants provided incomplete information and where the LLMs misinterpreted prompts. They noted that the AI models often provide users with 2-3 different possible options, allowing users to have the final decision, and that at least one of the suggested conditions was relevant in at least 65.7% of conversations with participants. Since users performed poorly at making the correct choice, the study authors suggested that the usefulness of LLMs could be improved by including explanations, structured outputs, or clear recommendations. Despite AI’s strong performance on medical benchmarks and in controlled scenarios, misunderstandings between human users and chatbots could amplify confusion or lead to misdiagnoses. The researchers recommend involving human users in safety testing prior to the deployment of these tools in clinical settings.

About The Health Information and Trust Initiative: the Health Information and Trust Initiative is a KFF program aimed at tracking health misinformation in the U.S., analyzing its impact on the American people, and mobilizing media to address the problem. Our goal is to be of service to everyone working on health misinformation, strengthen efforts to counter misinformation, and build trust. 


View all KFF Monitors

The Monitor is a report from KFF’s Health Information and Trust initiative that focuses on recent developments in health information. It’s free and published twice a month.

Sign up to receive KFF Monitor
email updates


Support for the Health Information and Trust initiative is provided by the Robert Wood Johnson Foundation (RWJF). The views expressed do not necessarily reflect the views of RWJF and KFF maintains full editorial control over all of its policy analysis, polling, and journalism activities. The Public Good Projects (PGP) provides media monitoring data KFF uses in producing the Monitor.

Different Data Source, But Same Results: Most Adults Subject to Medicaid Work Requirements Are Working or Face Barriers to Work

Published: Jun 25, 2025

On May 22, the House passed a budget reconciliation bill that makes significant changes to the Medicaid program, including adopting a national work requirement for certain people covered by Medicaid. The new requirements would apply to adults eligible through the Medicaid expansion and would require them to work 80 hours or more per month, engage in work-related activities, or be in school half time. Certain individuals, including parents of dependent children and individuals who are “medically frail,” (defined as those who have a physical, intellectual, or developmental disability, a substance use disorder or “disabling” mental disorder, and those with “serious or complex” medical conditions), would be exempt from the requirements.

Under the House-passed bill, whether an individual is meeting the work requirements would be assessed at application and at renewal. Adults applying for Medicaid would have to meet the requirements or qualify for an exemption at least in the month preceding their application and could be required at state option to meet the requirements for more than one consecutive month. Adults enrolled in Medicaid expansion coverage would have to meet the requirements for at least one month between 6-month eligibility determinations, or more frequently at state option.

Text of the Senate version of the reconciliation bill, released on June 16, also includes a Medicaid work requirement similar to the provisions in the House bill, though it makes some changes to who is exempt from the requirement, notably narrowing the exemption for parents to those whose children are ages 14 and younger.

The Congressional Budget Office estimates the Medicaid work requirement provisions in the House bill would reduce federal spending by $344 billion over ten years, and increase the number of people without health insurance by 4.8 million. Based on experience with work requirements in Arkansas, where 18,000 enrollees lost Medicaid coverage following implementation of work requirements, many adults are expected to lose coverage because of difficulty navigating the reporting requirements and proving they worked the required hours or qualified for an exemption.

This analysis builds on prior analysis of the work status of Medicaid enrollees and uses data from the Survey of Income and Program Participation (SIPP) to model the impact of the work requirements in the House-passed bill. It includes adults on Medicaid who are not receiving disability income, are not also enrolled in Medicare, and are not parents of dependent children in states that had adopted the Medicaid expansion as of December 2021, as these adults are likely to be subject to the new requirements. Specifically, the analysis examines the work status of these Medicaid adults to assess whether they would meet the 80+ hours per month requirement and identify the reasons why individuals may not be meeting the requirement. It also examines work status throughout the year for this group to determine whether adults who meet the work requirement by working 80 or more hours in one month continue to meet the requirement in subsequent months.

KFF Analyses of Medicaid and Work

To understand the impact of Medicaid work requirements included in the budget reconciliation bill being debated in Congress, KFF has undertaken two difference analyses using different data sources. Below describes the differences between these analyses.

Current Population Survey (CPS): Study population includes adults with Medicaid who do not receive disability payments or who are not enrolled in Medicare. Analysis measures the share who worked full-time or part-time, regardless of the number of part-time hours worked. Among those who did not work, examines the reasons why they did not work. Work status is measured for the full year and includes those who worked the entire year as well as those who worked part of the year. The time period for the analysis is 2023. In addition to national estimates, CPS allows for state-level estimates for some measures.

Survey of Income and Program Participation (SIPP): Study population includes adults with Medicaid who do not receive disability payments, who are not also enrolled in Medicare, and who are not parents of dependent children. Analysis measures the share of adults who work 80 or more hours in a month, and for adults who did not work 80+ hours, the reasons why they did not work the required hours. The time period for the analysis is June 2022 (SIPP captures work status on a monthly basis).

Monthly Work Status

Among Medicaid adults who would be subject to the work requirements in the House-passed reconciliation bill, nearly eight in ten either met the requirement to work at least 80 hours or did not meet the requirement for a reason that would likely qualify them for an exemption. Over half (53%) worked at least 80 hours in the month analyzed (June 2022) and 9% were attending school (Figure 1). Nearly one in five (17%) of adults did not work 80 or more hours because of illness or disability (15%) or caregiving responsibilities (2%), reasons that could qualify them for an exemption from the requirement. However, about one in five (21%) Medicaid adults were not working or did not work enough hours to meet the requirement for reasons, including the inability to find work or to work more hours, retirement, or having been laid off, that would put them at particular risk for losing coverage if the new requirements go into effect.

Status of Meeting New Work Requirements Among Medicaid Adults, June 2022

The share of adults who would meet the new requirements or qualify for an exemption varies by age. Over seven in ten (72%) of young adults ages 19-27 were working 80 or more hours (48%) or were in school (24%) and would have met the requirements, the highest share of any age group. An additional 7% reported having an illness or disability (Figure 2). A slightly smaller share (66%) of adults ages 27-49 would have met the requirements while one in five would have qualified for an exemption based on health limitations or caregiving responsibilities. Adults ages 50-64 were least likely to meet the requirements, with less than half (48%) working 80 or more hours in the month. However, nearly a quarter (24%) of these adults were not meeting the requirements for reasons that would likely qualify them for an exemption.

Compliance with Work Requirements and Barriers to Meeting Requirements Among Medicaid Adults, By Age Groups, June 2022

Adults ages 50-64 are at greater risk of losing Medicaid coverage for not meeting the new requirements. Adults who are not working 80 or more hours in the month and who do not appear to qualify for an exemption because they cite an inability to find work, retirement, or other reasons for why they are not working are at the greatest risk of losing coverage if the work requirements are implemented. Nearly three in ten (29%) Medicaid adults ages 50-64 are not meeting the work requirements and do not appear to qualify for an exemption (Figure 2). While similar shares of adults ages 50-64 compared to other age groups cited being unable to find work or other reasons for not meeting the work requirements, over one in ten (11%) said they had retired. Among adults who said they retired, 28% reported having a disability. Because of their age and physical limitations, these adults may face particular challenges trying to reenter the workforce, if they don’t meet reporting requirements to qualify for an exemption.

Work Status Throughout the Year

About 10% of Medicaid adults who meet the requirement to work 80+ hours in a month do not continue to meet the requirement for all of the following six months. Under the requirements in the House-passed bill, states must confirm that individuals meet the work requirements at application and every 6 months when eligibility is redetermined (or more frequently at state option). States would be required to “look back” at least one month between 6-month eligibility periods and could choose to “look back” more consecutive or non-consecutive months to verify compliance. While 44% of Medicaid adults who met the requirement to work 80+ hours in June continued to meet the requirement in all six months from July to December, 4% met the requirement for 4 or 5 months and 5% met the work requirement for only 1, 2, or 3 months during the 6-month period from July to December. Depending on how states operationalize the “look back” period, the month-to-month volatility in hours worked could lead to increased coverage loss, but even individuals who continue to meet the requirement could still lose coverage if states require monthly verification.

Among Adults Covered by Medicaid Who Worked 80+ Hours in June, the Number of Months They Worked 80+ Hours from July to December

Similar to previous analyses, this analysis shows that a majority of Medicaid expansion adults who would be subject to the work requirements in the reconciliation bill are working 80 or more hours in a month, and most are working those hours consistently over a six-month period. Many adults who do not meet the work requirements are attending school or have an illness or disability that limits their ability to work and would, therefore, appear to qualify for an exemption from the work requirements. Nevertheless, these adults are at risk of losing coverage if they are unable to navigate reporting requirements established by their state. Expansion adults ages 50-64 may be at greater risk of losing coverage under the new requirements because they are less likely to work 80 or more hours in a month or to qualify for an exemption.

Methodology

Data for this analysis are from the 2023 Survey of Income and Program Participation (SIPP), which covers calendar year 2022. The analysis focuses on the working patterns of individuals in the month of June 2022 who:

  • Were enrolled in Medicaid, but were not dually enrolled in Medicare;
  • Were between the ages of 19 and 64;
  • Did not receive Supplemental Security Income (SSI) or disability-related income;
  • Were not parents of dependent children under the age of 18 in the same household;
  • Were not pregnant (those who did not work because of a pregnancy or childbirth);
  • Had complete records on hours worked for each month of the year; and
  • Lived in Medicaid expansion states.

To identify reasons for not meeting work requirements, defined as working more than 80 hours per month, responses were combined from several questions, including reasons for not working and reasons for working part-time. Furthermore, to assess work status across a six-month window, individuals who met the work requirement in June were then followed from July through December to examine how their work status changed over time.