Key Takeaways
The opioid overdose epidemic, characterized by the rapid rise in opioid-involved overdoses and overdose-related deaths, began in the late 1990s, driven by increased prescribing of opioids to treat pain. In subsequent years, the epidemic evolved, and is now largely driven by synthetic opioid-involved deaths, including illicitly manufactured fentanyl. Medicaid enrollees have been particularly impacted by the opioid epidemic, with higher rates of substance use disorder (SUD) and prescribed opioids among Medicaid enrollees compared to people with other types of insurance. To combat the opioid overdose epidemic, policymakers have enacted legislation to reduce opioid prescriptions for pain and increase access to treatment for opioid use disorder (OUD), and the Consolidated Appropriations Act, passed in December 2022, vastly increased the number of providers authorized to prescribe controlled substance medication treatment to treat OUD.
This analysis builds on previous KFF work by using Medicaid claims data, administrative data on Medicaid enrollees’ health care utilization, for 2016-2019 to explore how prescriptions for opioids used to treat pain and those used to treat OUD or rapidly reverse overdose changed across states and enrollee demographic groups over time leading up to the COVID-19 pandemic. A full description of the data and methods can be found in the Methods section. Key findings include the following:
- Opioid prescriptions declined overall from 2016 to 2019, driven by a 44% decline in the number of prescriptions for opioids used to treat pain. At the same time, prescriptions for medications used to treat OUD or rapidly reverse opioid overdose doubled, driven by an increase in buprenorphine prescriptions.
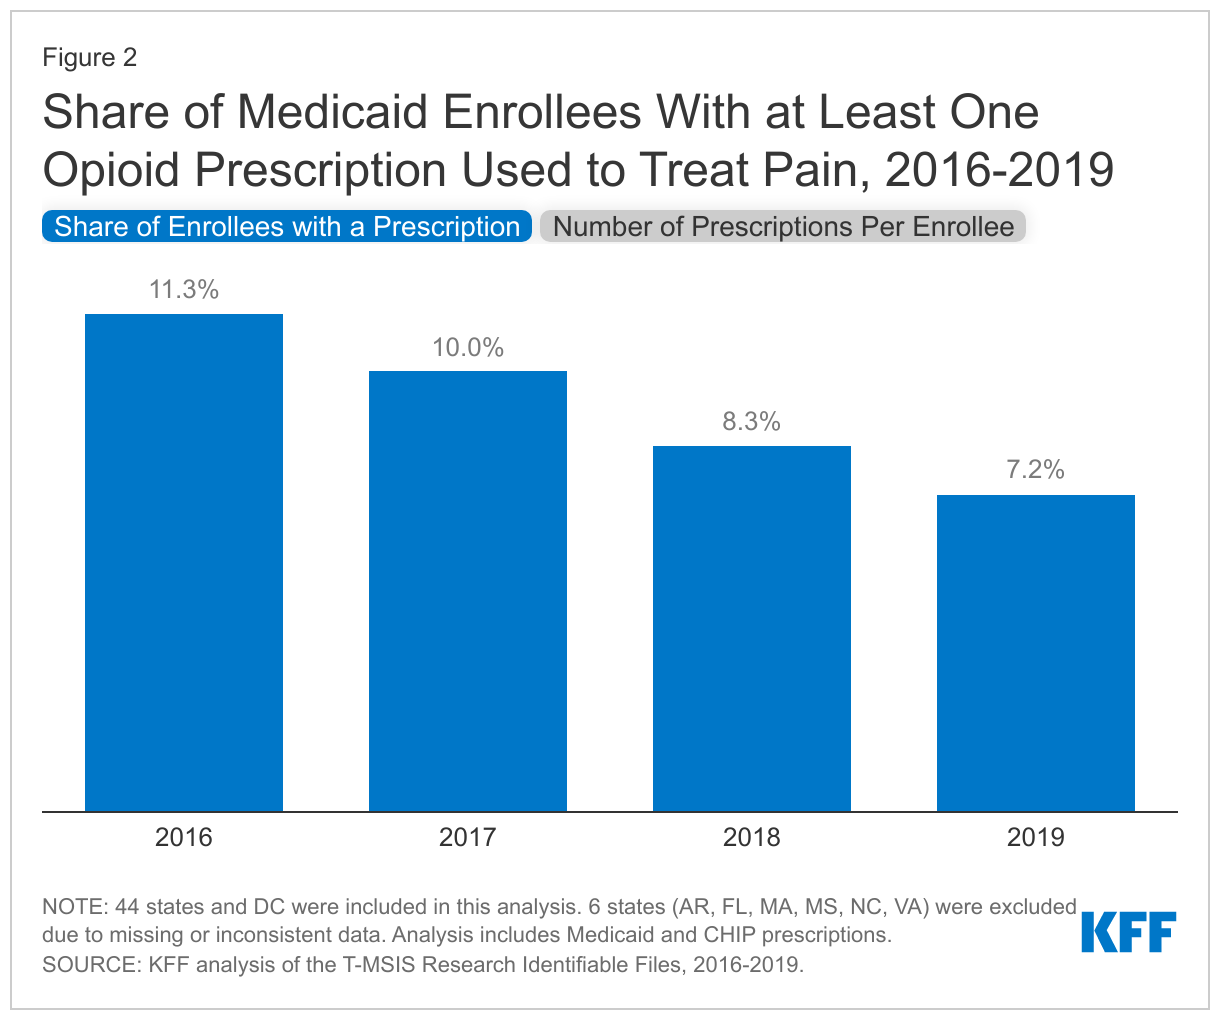
- The share of enrollees receiving at least one opioid prescription for pain declined from 11.3% in 2016 to 7.2% in 2019, which drove the overall declines in utilization of opioids to treat pain. The magnitude of declines varied by state, eligibility group, and race/ethnicity.
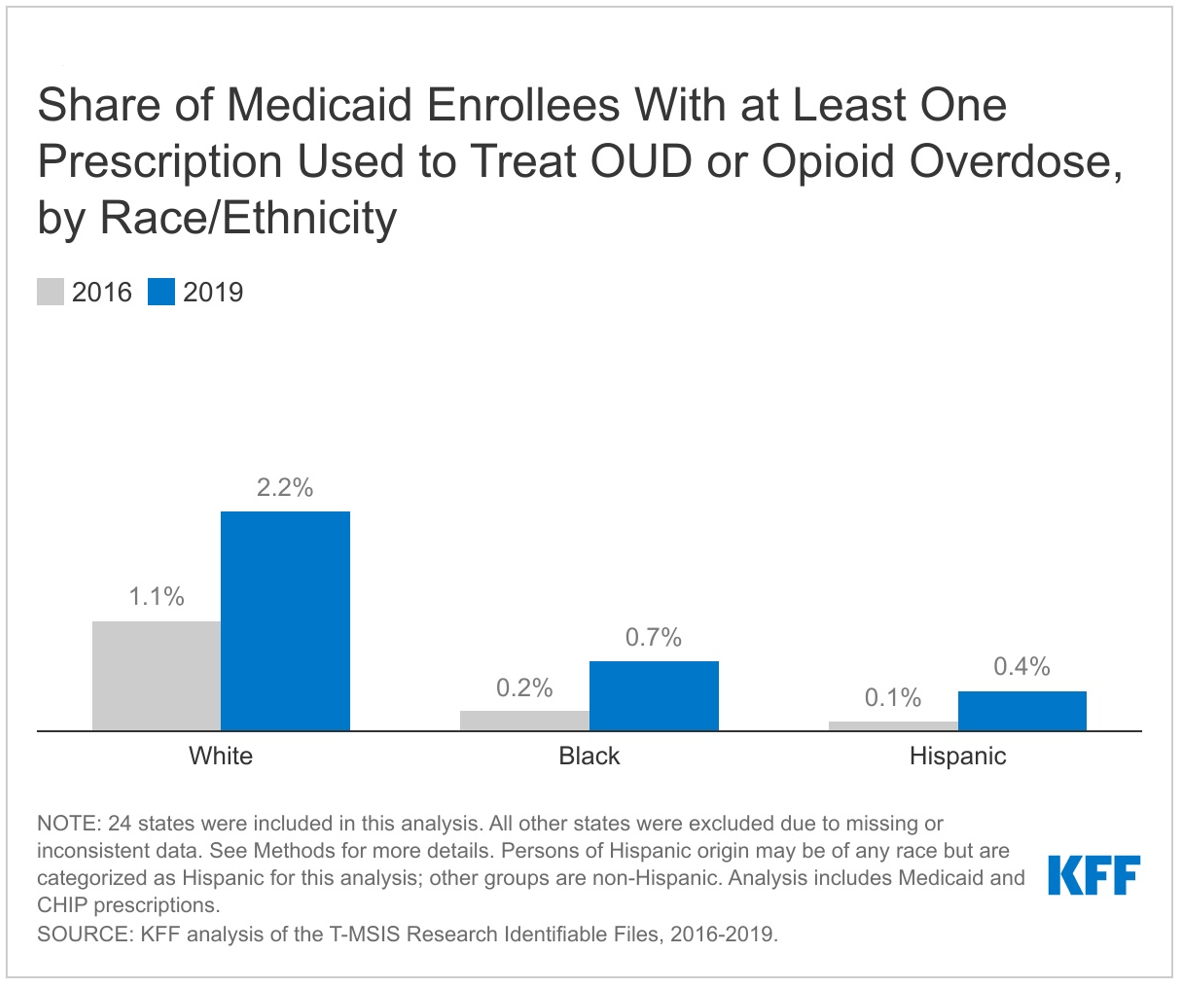
- The share of enrollees receiving at least one medication used to treat OUD or reverse opioid overdose doubled from 2016 to 2019. Compared to Black and Hispanic enrollees, White enrollees were more likely to receive at least one treatment prescription and saw the largest increase their share over the period, suggesting racial disparities in access to prescription medication to treat OUD or reverse overdose.
Background
The opioid overdose epidemic began in the late 1990s with the increased prescribing of opioids to treat pain. Then, the epidemic shifted in 2010 with sharp increases in deaths due to heroin overdose, and, since 2013, synthetic opioid-involved deaths, including deaths involving illicitly manufactured fentanyl, have increased rapidly, far surpassing deaths involving commonly prescribed opioids and heroin. Opioid overdose death rates continue to rise, increasing by 38% from 2019 to 2020, and the recent rise in deaths associated with drug overdoses has disproportionately affected people of color. Prescription opioids were still involved in 24% of all opioid overdose deaths in 2020, though this share has declined sharply since 2007 when prescription opioids were involved in 78% of all opioid overdose deaths.
The opioid epidemic was declared a nationwide public health emergency on October 26, 2017, and there have been various strategies at the state and national level to address the opioid crisis, including actions to reduce opioid overprescribing and guidelines from the Centers for Disease Control and Prevention (CDC) in 2016. Since then, states have enacted limits on opioid prescriptions for acute pain, including limits on prescription length or daily dosage, requirements for naloxone prescription alongside opioid pain prescriptions, prescription drug monitoring programs (PDMPs), and state policies that enhance PDMPs. In 2018, a KFF survey of state Medicaid programs found all states and DC had implemented at least one opioid-focused pharmacy management policy, with 40 states expecting to implement additional opioid-focused strategies the following year. These interventions have reduced the number of opioid prescriptions in recent years; however some argue the 2016 CDC guidelines, which were voluntary, were too strictly applied or misapplied by providers, making it more difficult for some individuals to access needed pain relief.
Policy efforts have also aimed to improve access to medications for OUD treatment, as they have been shown to substantially reduce overdose and mortality rates. However, most people with OUD do not receive recommended treatment, with some estimates suggesting a gap of almost 90%. Of the three drugs currently approved to treat OUD (methadone, buprenorphine, and naltrexone), only two—buprenorphine and naltrexone—are available through prescription and can be taken at home. Methadone for OUD treatment must be dispensed onsite through licensed opioid treatment programs. Buprenorphine was first authorized to treat OUD outside of opioid treatment programs in the early 2000’s through the Drug Addiction Treatment Act of 2000, which permitted practitioners who obtained a separate controlled substances license (also referred to as an X-waiver) to prescribe buprenorphine. Over time, efforts have focused on increasing the supply of buprenorphine providers, and the Consolidated Appropriations Act completely eliminated the X-waiver, thus substantially increasing the number of providers who are authorized to prescribe buprenorphine to treat OUD.
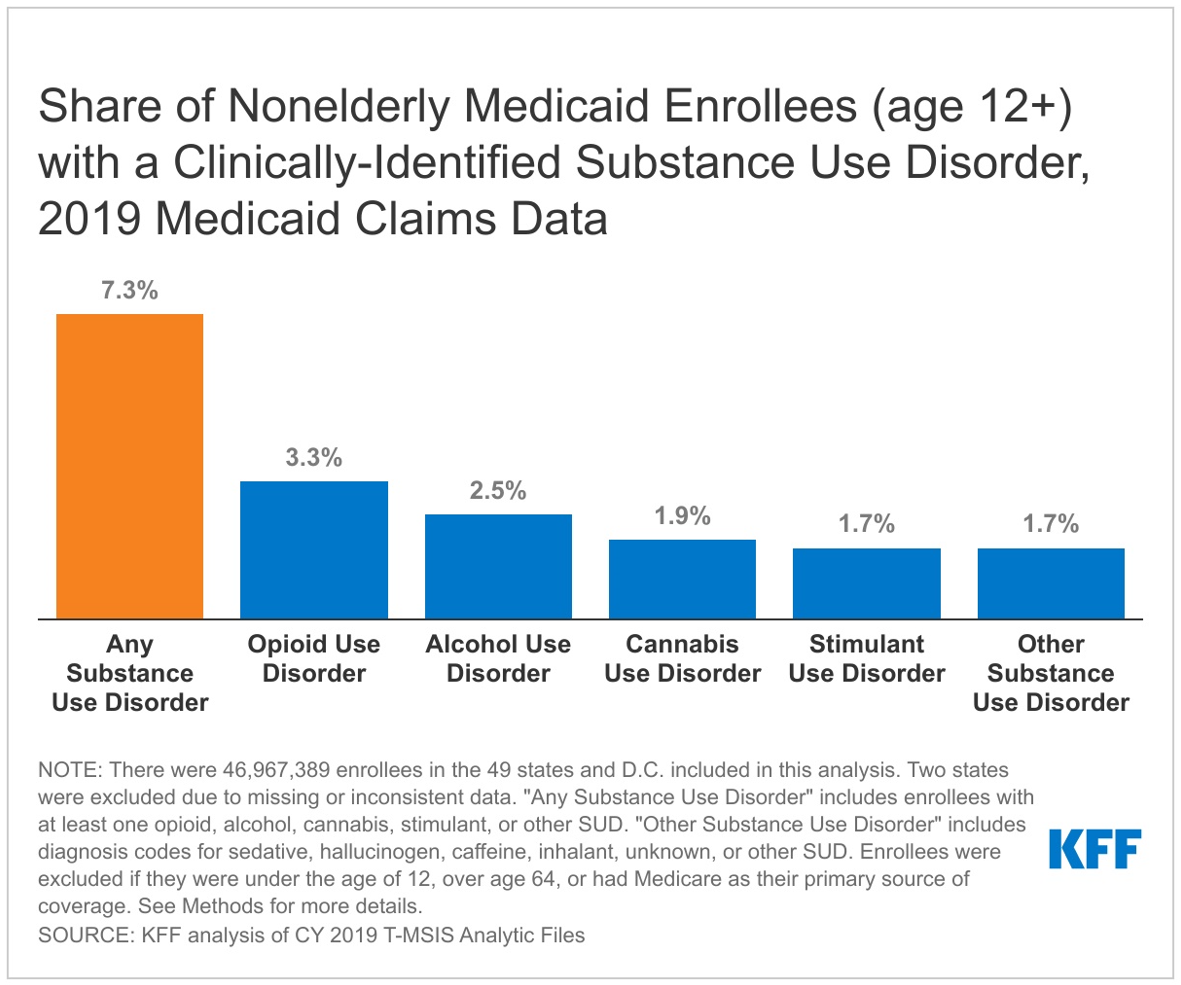
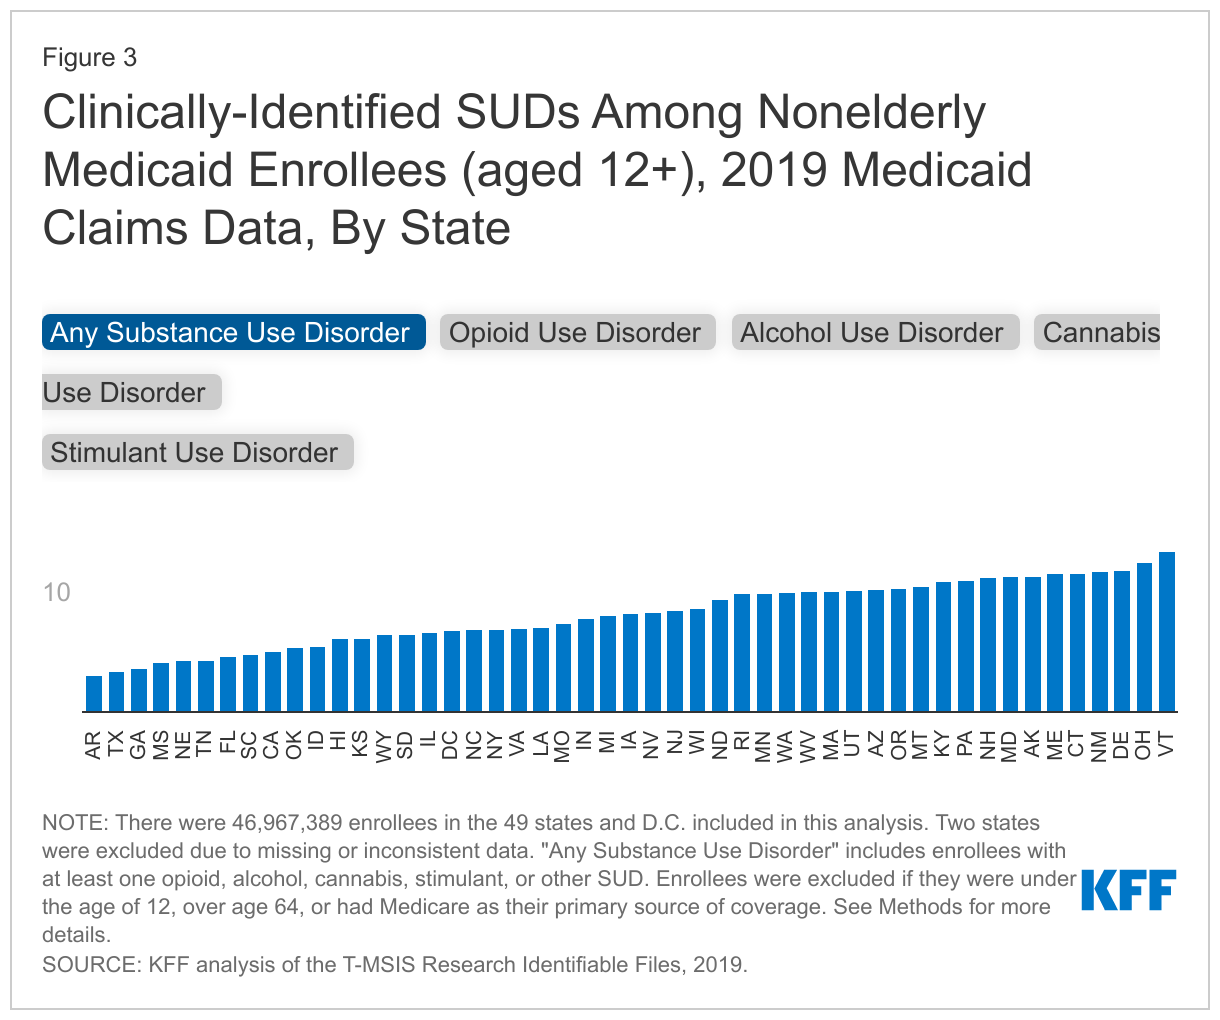
The Medicaid population may be particularly impacted, as 21% have mild, moderate, or severe SUD, compared to 16% of commercially insured. Medicaid enrollees also receive prescriptions for pain medications at higher rates compared to individuals with other insurance types. In its role as a public program and the single largest payer of behavioral health services in the country, Medicaid is particularly well positioned to implement policy to improve the delivery, quality, and effectiveness of behavioral health services. In recent years, many states have used Medicaid Section 1115 waivers and other program authorities to expand treatment options for enrollees with OUD as well as enacted various laws to increase access to naloxone and promote the use of naloxone in Medicaid.
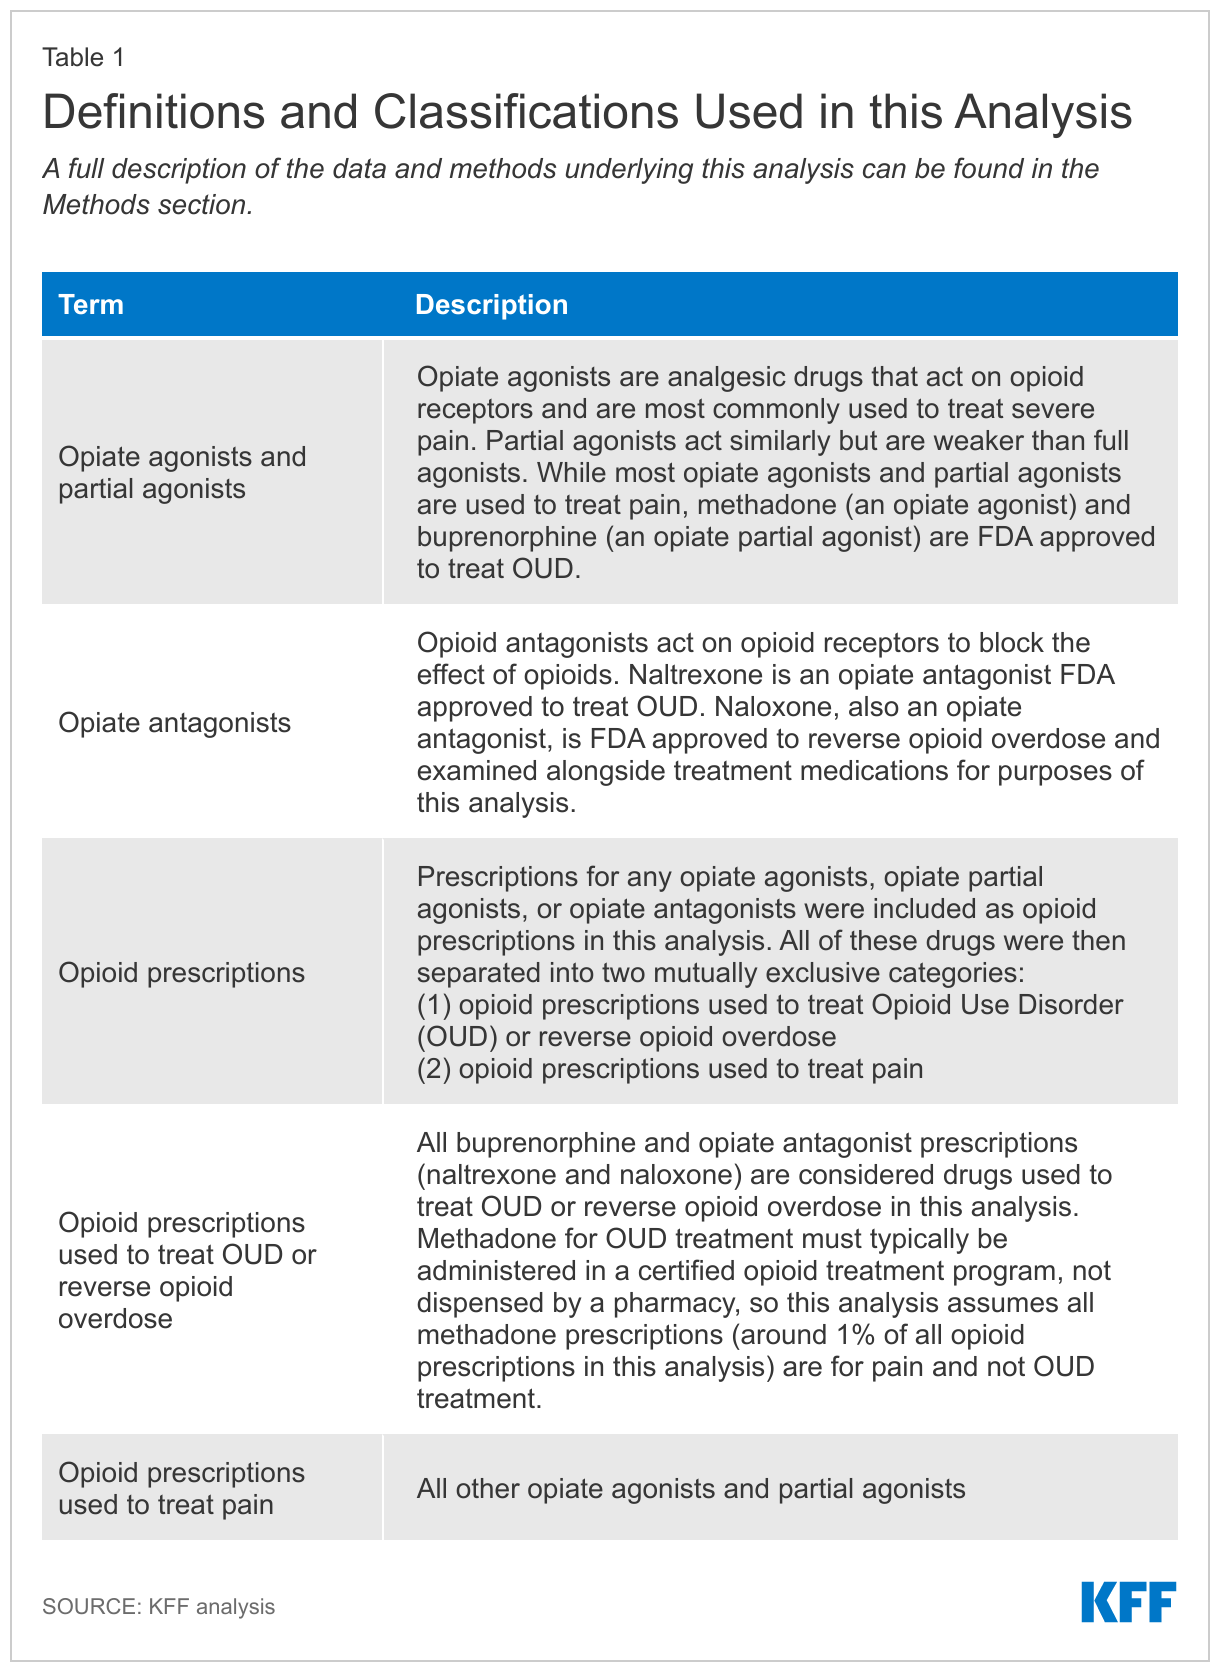
The detailed and comprehensive claims data available for Medicaid can help answer questions and inform policy. This analysis builds on previous KFF work by using Medicaid claims data for 2016-2019 to explore how prescriptions for opioids used to treat pain and those used to treat OUD or rapidly reverse overdose changed across states and Medicaid enrollee demographic groups over time. We exclude methadone for OUD treatment, which is only dispensed from licensed opioid treatment programs, and cannot be obtained using a prescription (for more information, see Table 1 and Methods).
What are recent trends in opioid prescribing?
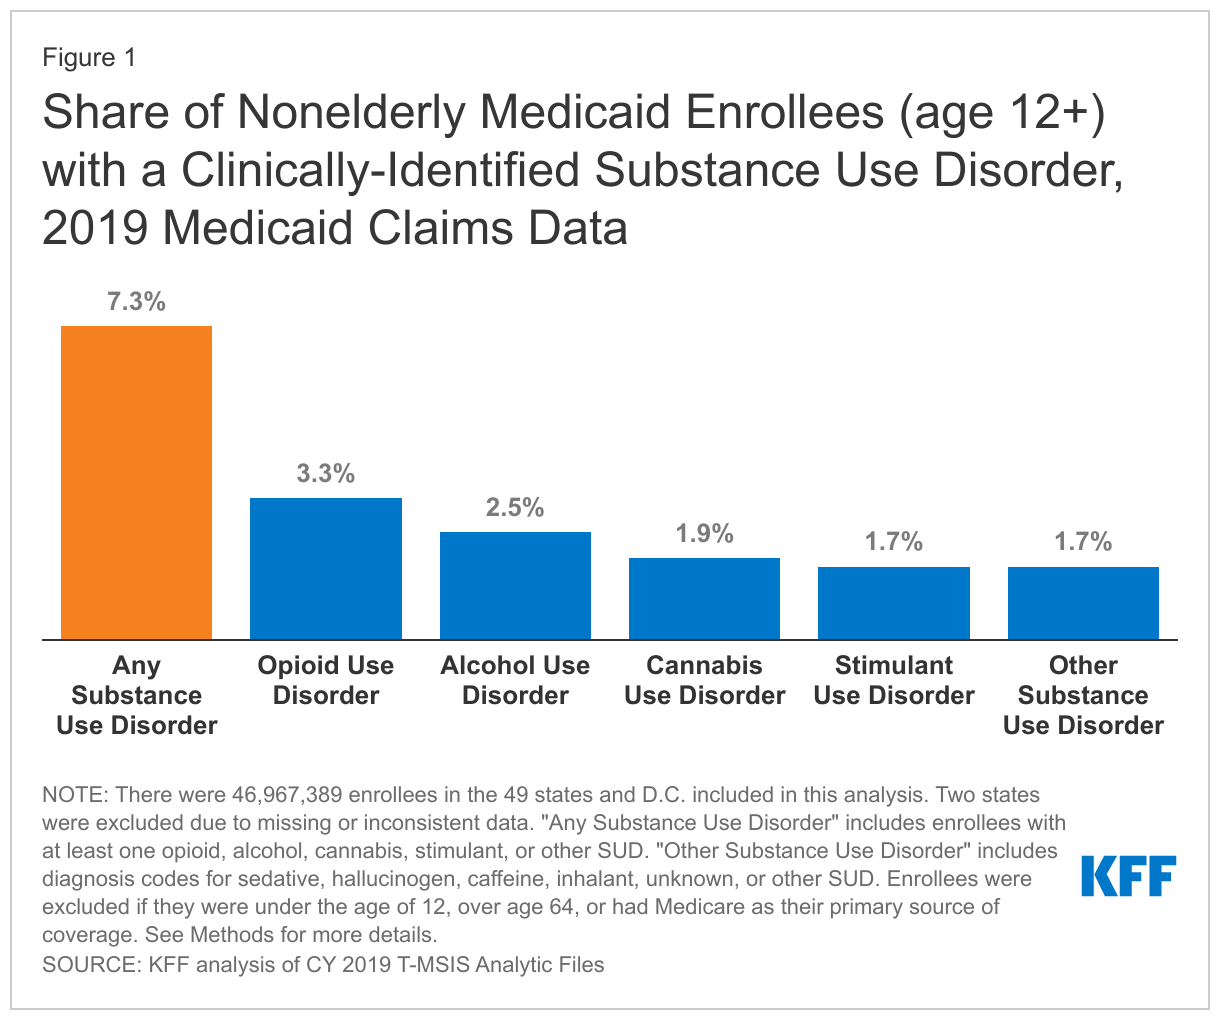
The number of Medicaid prescriptions for opioids in this analysis declined by 27% from 2016 to 2019, driven by a decline in the number of opioid prescriptions used to treat pain. The utilization of opioids prescriptions to treat pain declined by 44% from 2016 to 2019 (Figure 1). While still widely prescribed, opioids are also making up an increasingly smaller share of all Medicaid outpatient prescription drug claims. In this analysis, opioids overall accounted for 3.0% of all Medicaid outpatient prescription drug claims by 2019, down from 4.1% in 2016.
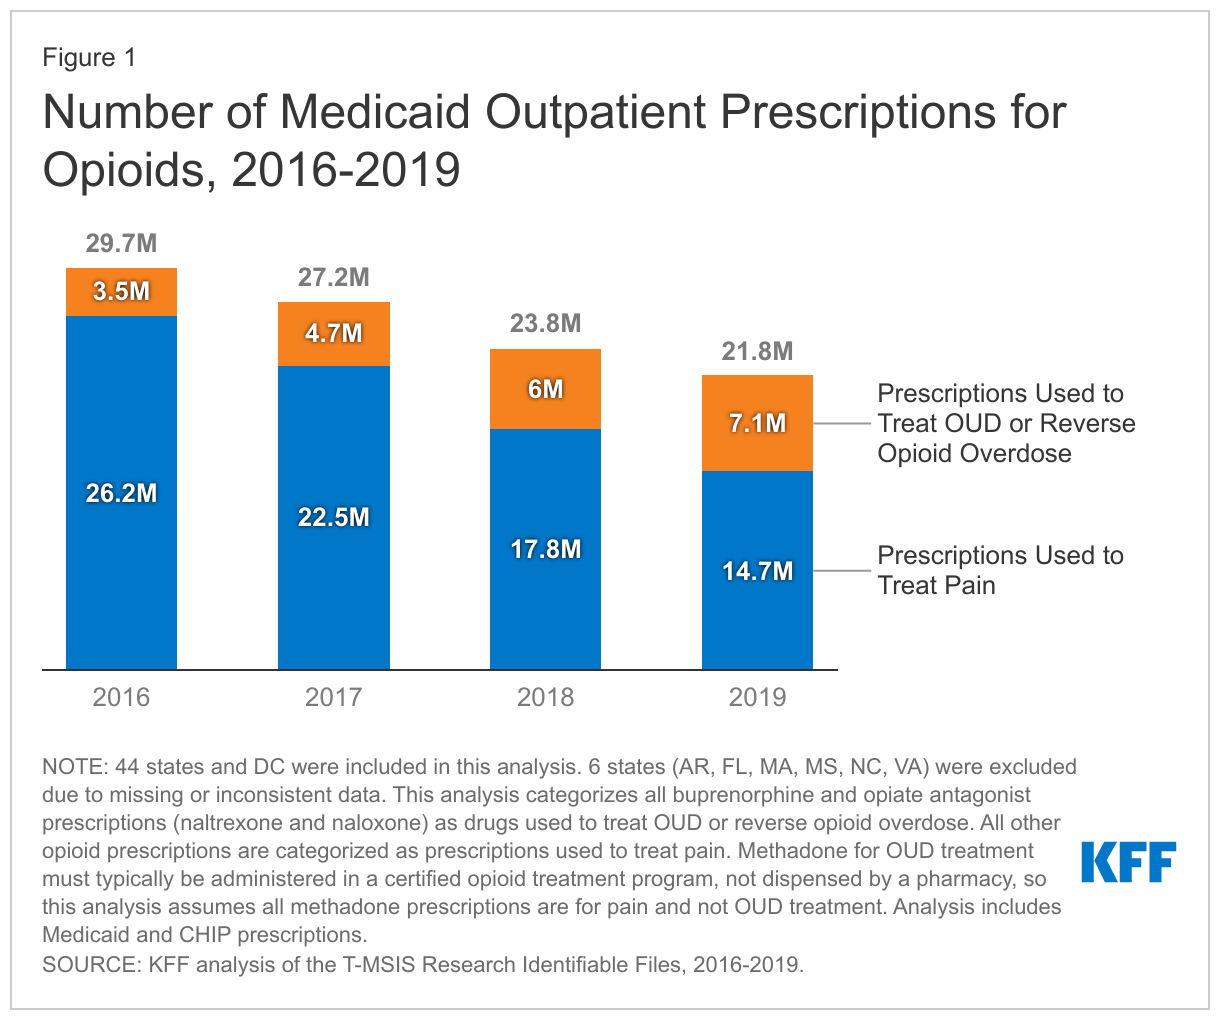
Medicaid prescriptions used to treat OUD or rapidly reverse opioid overdose doubled from 2016 to 2019 and made up an increasing share of all opioid prescriptions over the period. While most opioid prescriptions over the period were for opioids used to treat pain, prescriptions for drugs used to treat OUD (buprenorphine and naltrexone) or rapidly reverse opioid overdose (naloxone), doubled over the period, and together they made up 33% of all opioid prescriptions by 2019, up from 12% in 2016. Table 1 describes what prescription drugs are included and how drugs are categorized as prescriptions used to treat pain or prescriptions used to treat OUD or reverse opioid overdose in this analysis (for more information, see Methods).
What is driving the decline in opioid prescriptions used to treat pain?
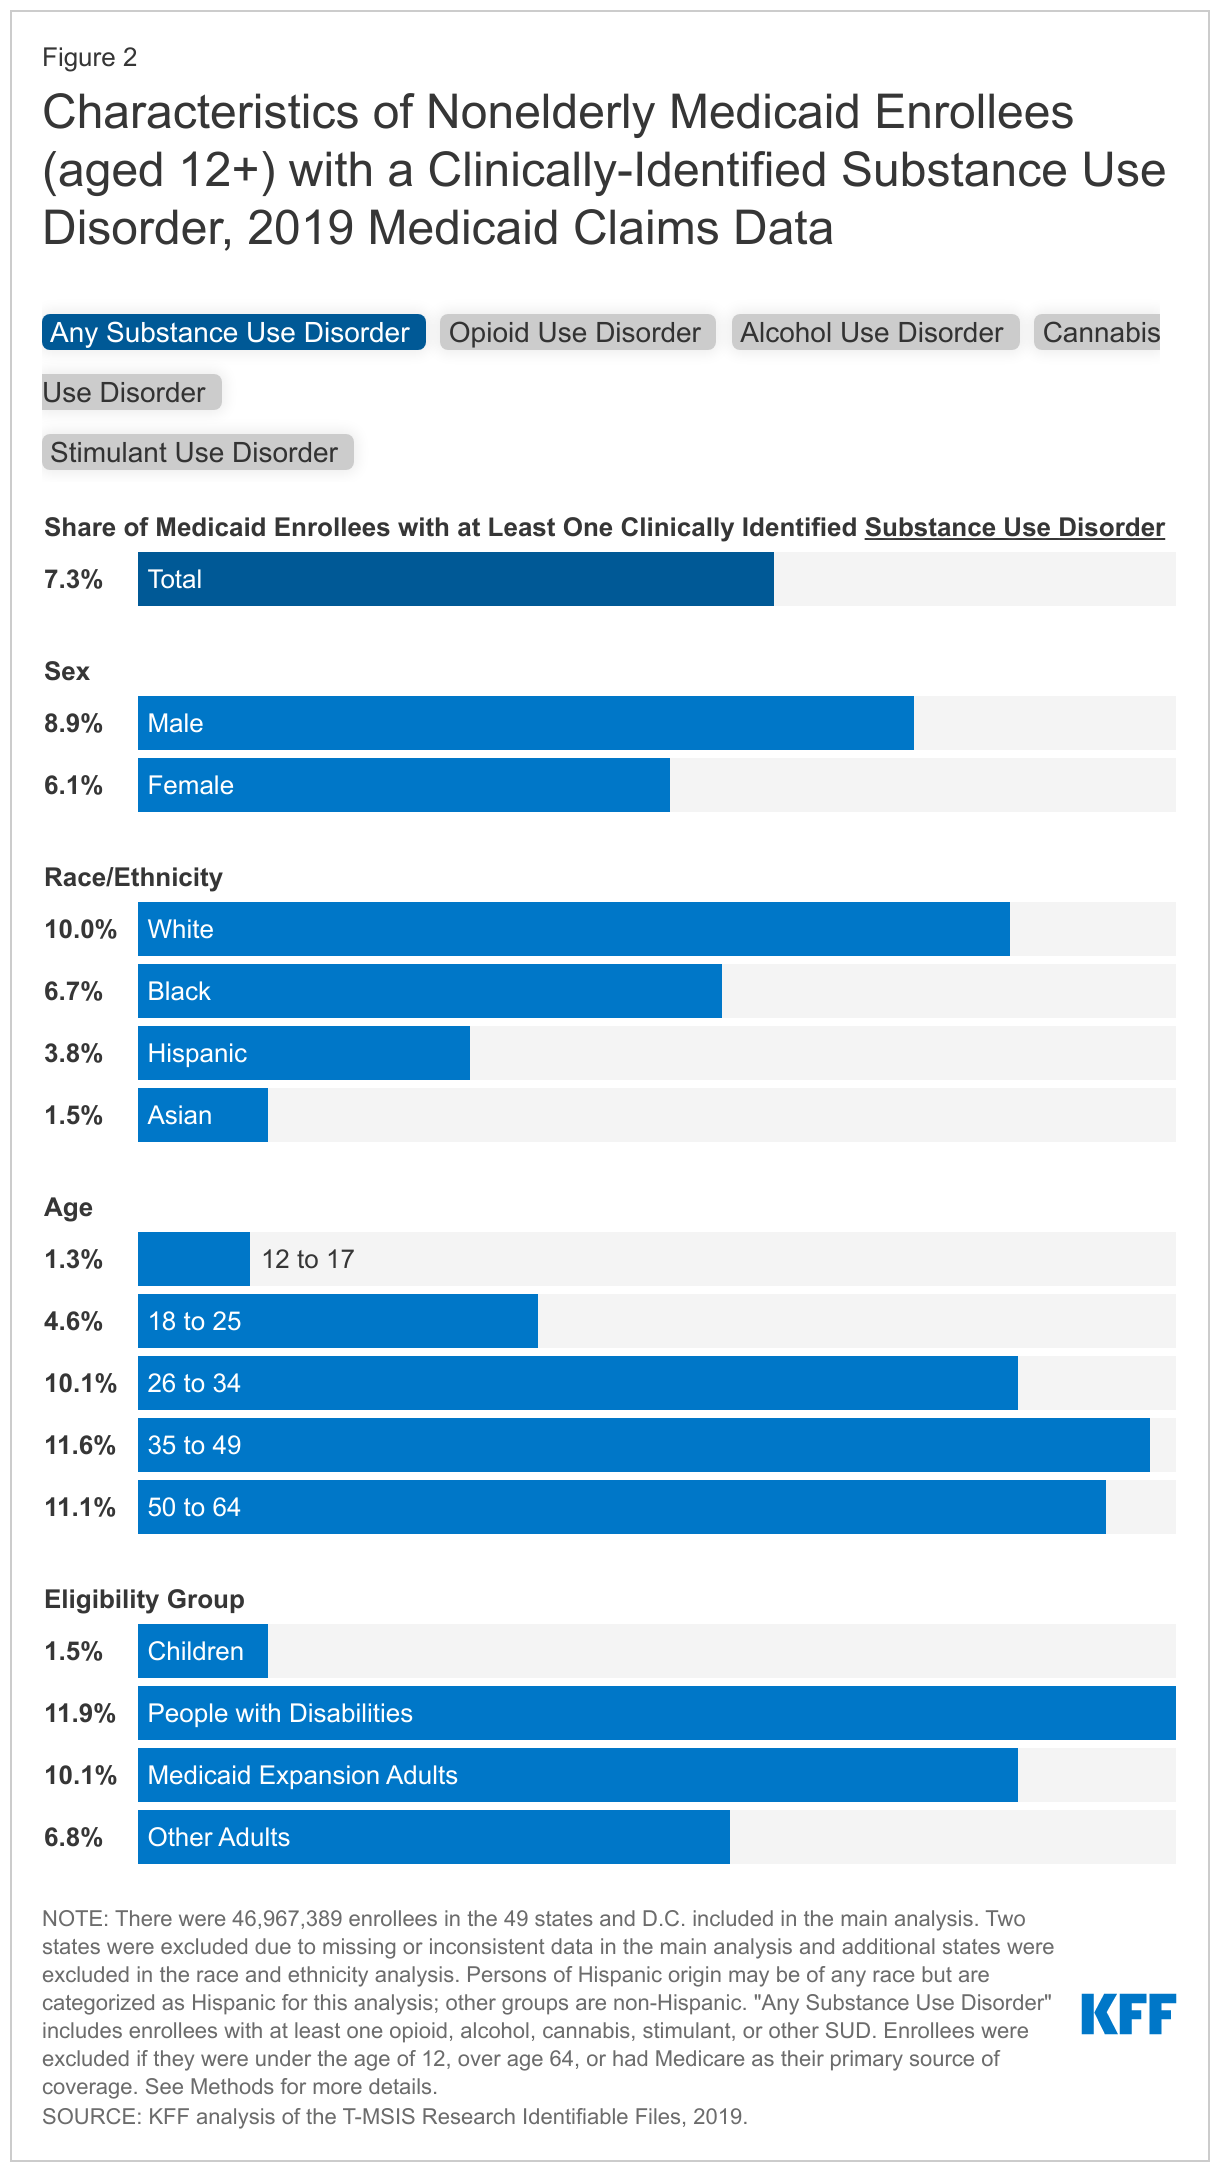
The share of Medicaid enrollees who received at least one opioid prescription used to treat pain within the year declined from 11.3% in 2016 to 7.2% in 2019, or 4.1 percentage points (Figure 2). The number of opioid prescriptions among those with at least one opioid prescription used to treat pain remained relatively stable over the period, around 3 prescriptions per person. This suggests the decline in utilization results from fewer enrollees receiving any prescriptions rather than from enrollees who already receive opioid prescriptions receiving fewer prescriptions. The share of Medicaid enrollees who received at least one opioid prescription used to treat pain declined across all eligibility groups over the period. In 2016, pregnant women accounted for the largest share of enrollees receiving at least one opioid prescription used to treat pain (23.9%). However, from 2017 onward, individuals eligible for Medicaid based on a disability had the largest share, with 18.8% receiving at least one opioid prescription used to treat pain by 2019 compared to 15.6% of pregnant women, 15.3% of traditionally eligible adults, 13.0% of expansion adults, 7.9% of seniors, and 1.7% of children. While there are likely many factors at play, state policies implemented over the period to prevent opioid-related harms as well as the release of the 2016 CDC guidelines to address opioid overprescribing likely contributed to these declines.
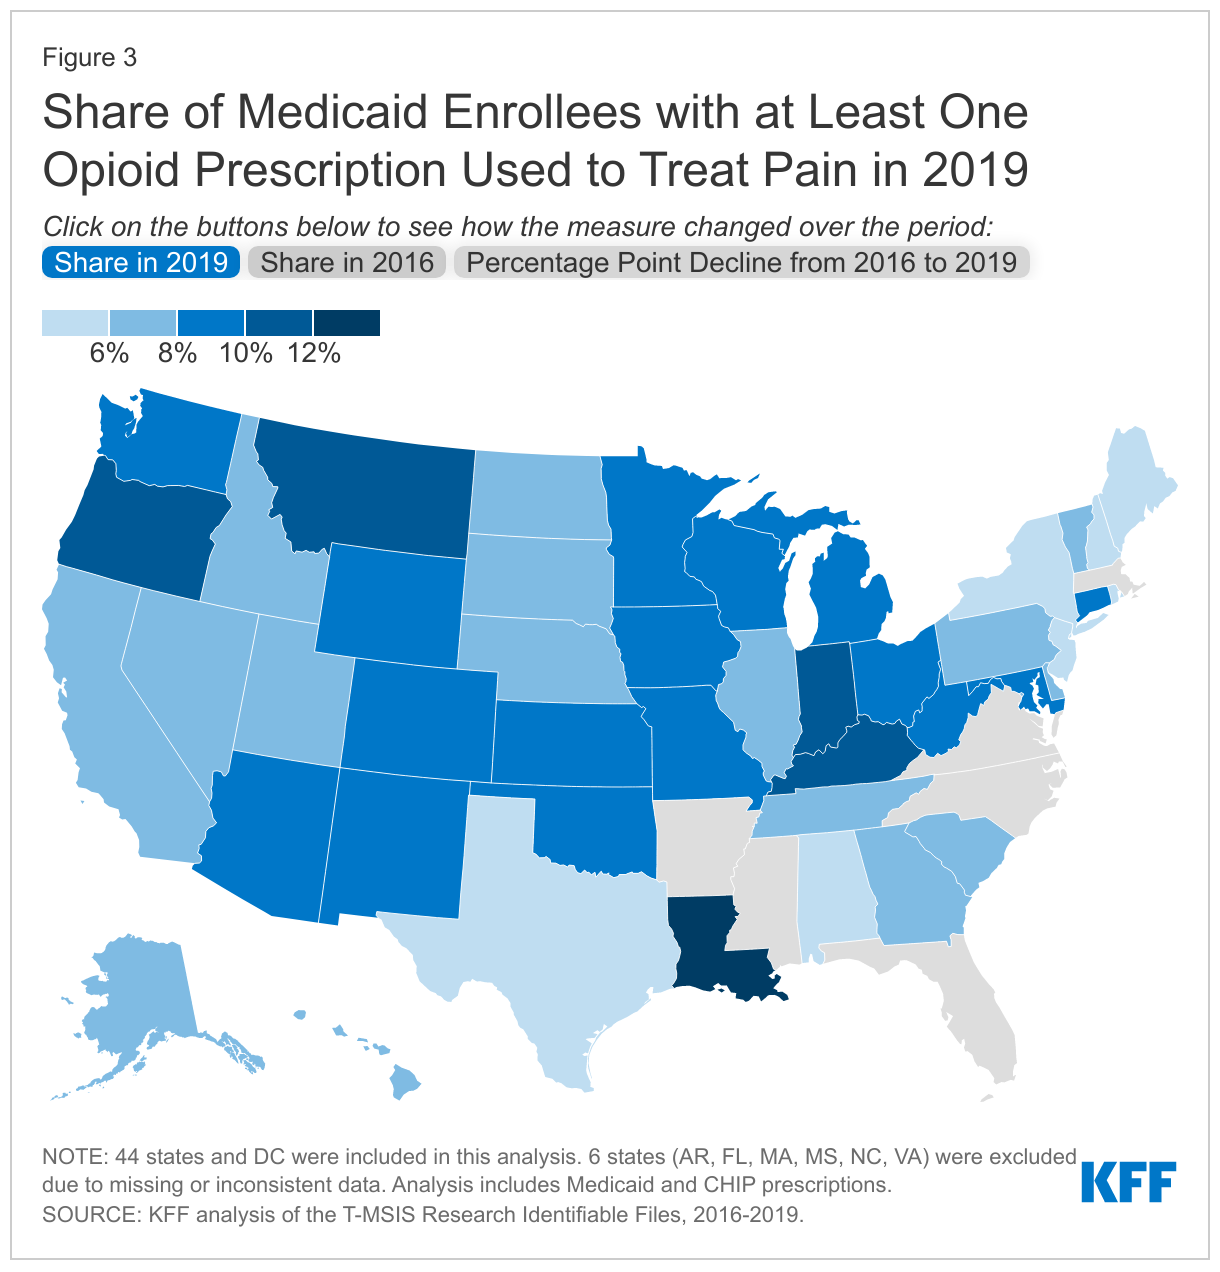
All states experienced declines in the share of Medicaid enrollees who received at least one opioid prescription to treat pain from 2016 to 2019, but the degree varied by state. The states that experienced the largest declines appear to be clustered around the Appalachian region, one of the areas hardest hit by the opioid epidemic. Of the top five states (TN, KY, OH, WV, MI) with the largest share of enrollees receiving at least one opioid prescription in 2016, the beginning of the study period, only one state (KY) remained in the top five states by 2019. On the other hand, states with the smallest declines over the period varied in location.
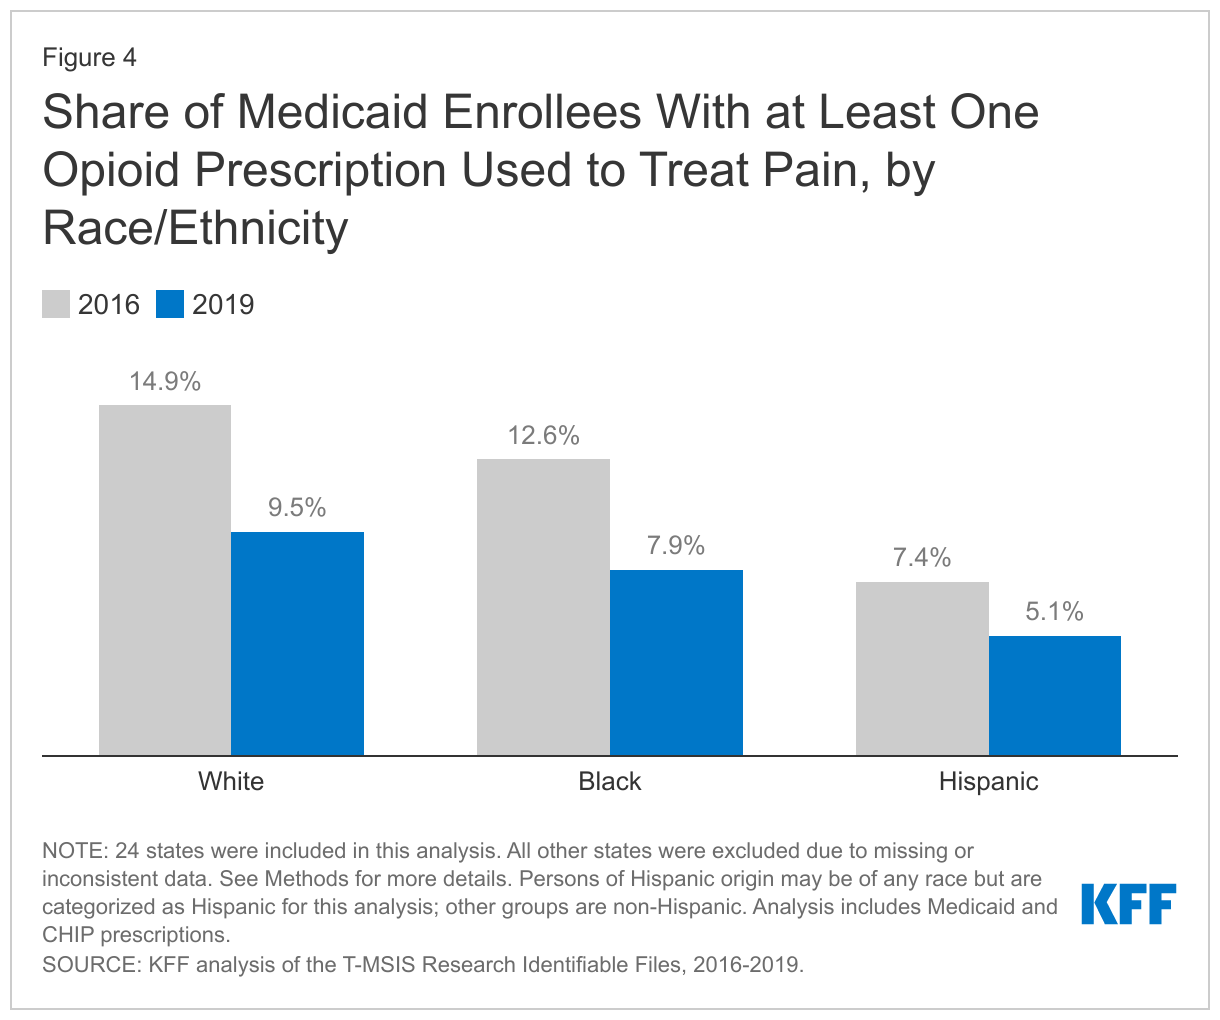
While all groups experienced a decline in the share of Medicaid enrollees receiving at least one opioid prescription used to treat pain from 2016 to 2019, White enrollees experienced the largest decline compared Black and Hispanic enrollees. White enrollees also had the highest share of enrollees with at least one opioid prescription used to treat pain in both 2016 and 2019 compared to all other racial/ethnic groups. In 2016, 14.9% of White Medicaid enrollees had at least one opioid prescription used to treat pain, compared with 12.6% of Black enrollees, the next highest group (Figure 4). By 2019, the share of White enrollees with at least one opioid prescription had fallen to 9.5% (a 5.4 percentage point decline) and the share for Black enrollees had fallen to 7.9% (a 4.7 percentage point decline). Multiple studies have shown racial disparities in opioid prescribing and pain management, and our findings suggest Black and Hispanic Medicaid enrollees are less likely to be prescribed opioids used to treat pain when compared with White enrollees.
What is driving the increase in prescriptions used to treat OUD or reverse opioid overdose?
Prescriptions for buprenorphine, an OUD treatment, grew 92% from 2016 to 2019 and made up the vast majority (87% in 2019) of all pharmacy prescriptions used to treat OUD or reverse opioid overdose (Figure 1). This reflects state efforts over the period to increase access to buprenorphine as well as changes to buprenorphine prescribing limits over the period. While they make up a smaller share of all prescriptions in this analysis, the number of opiate antagonist prescriptions almost tripled from 2016 to 2019.
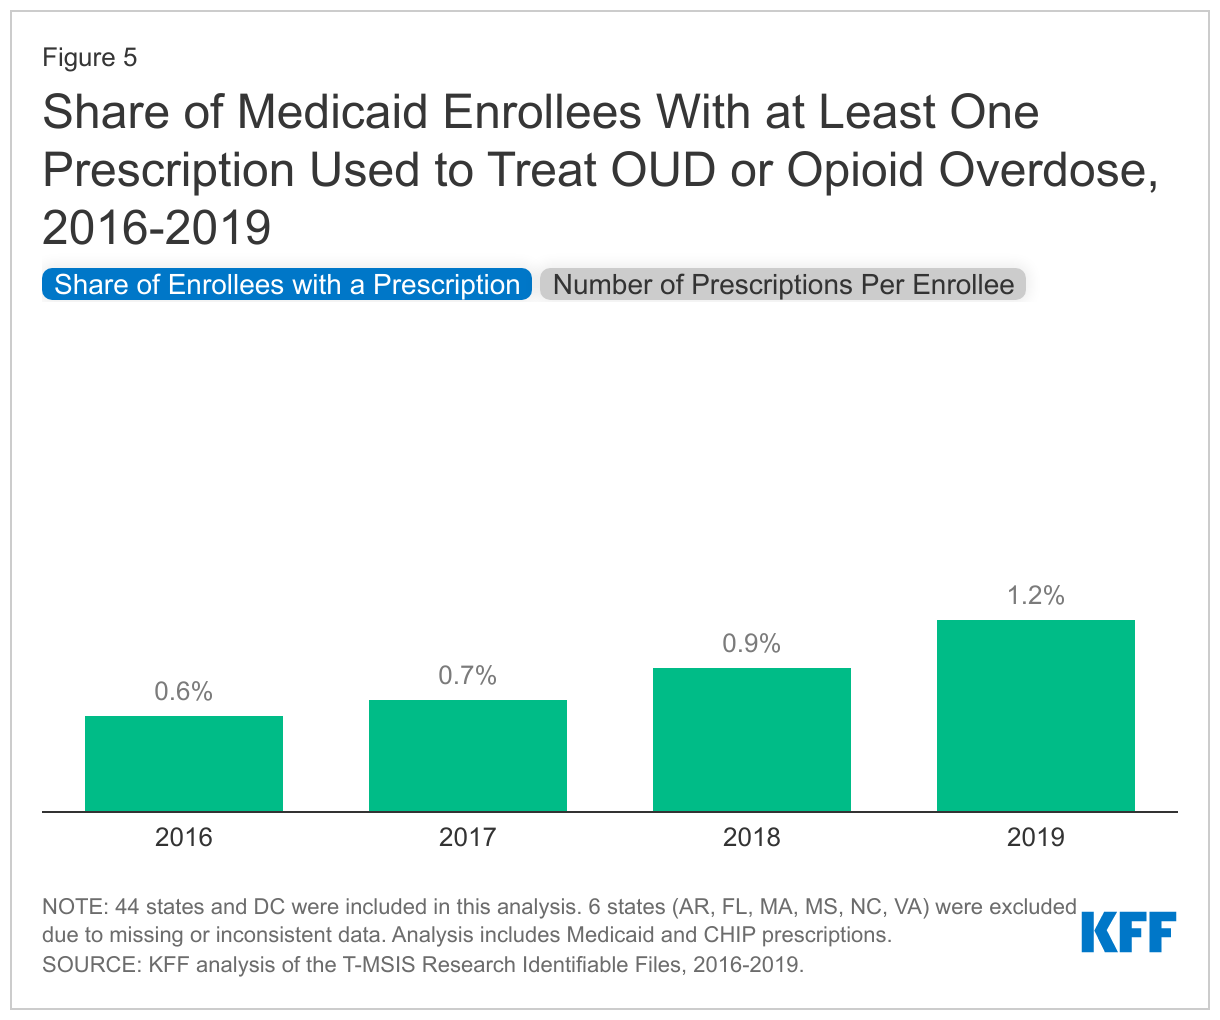
The share of Medicaid enrollees who received at least one prescription used to treat OUD or reverse opioid overdose within the year doubled, growing from 0.6% in 2016 to 1.2% in 2019 (Figure 5). At the same time, the number of OUD treatment or opioid overdose prescriptions per enrollee (among those who received any prescription for OUD treatment or overdose reversal) stayed relatively stable around 9 prescriptions per enrollee, suggesting the increase in utilization results from additional enrollees starting to receive medication for OUD treatment or to reverse opioid overdose over the period. It is important to note that this analysis looks at the utilization among all Medicaid enrollees in the analysis, not among enrollees with an OUD diagnosis, which is why the shares for treatment are small.
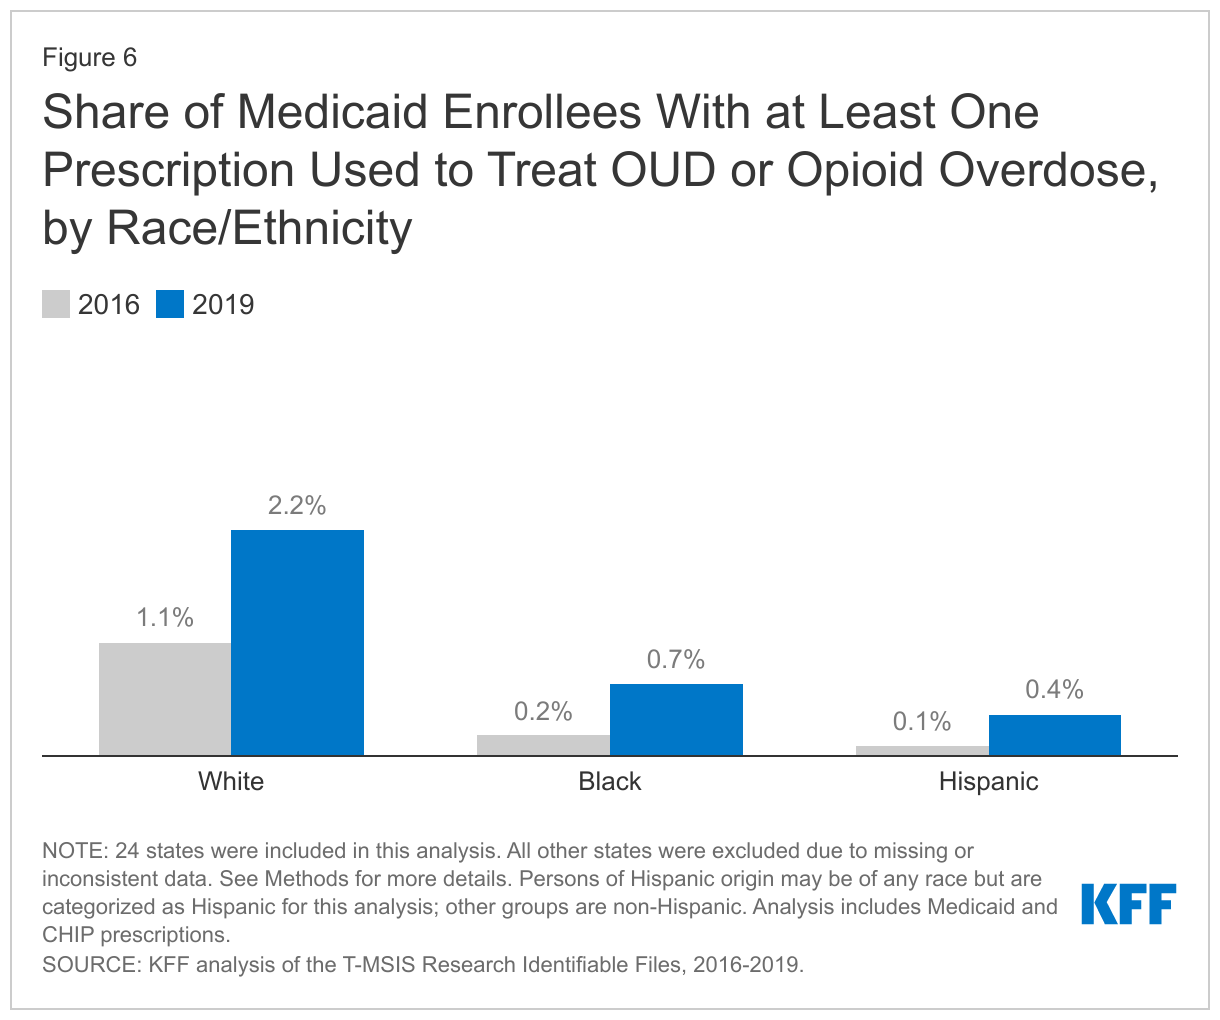
While all groups experienced in increase in the share of Medicaid enrollees receiving at least one prescription used to treat OUD or reverse opioid overdose from 2016 to 2019, White enrollees experienced the largest increase compared to Black and Hispanic enrollees. White enrollees also had the highest share of enrollees with at least one prescription for OUD treatment or opioid overdose in both 2016 and 2019 compared to all other racial/ethnic groups. In 2016, 1.1% of White Medicaid enrollees had at least one prescription to treat OUD or reverse overdose, compared with 0.2% of Black enrollees, the next highest group (Figure 6). By 2019, the share of White enrollees with at least one prescription to treat or reverse overdose had grown to 2.2% (a 1.1 percentage point increase) and the share for Black enrollees had grown to 0.7% (a 0.5 percentage point increase). Various studies have shown racial disparities in access to medications for OUD, especially for buprenorphine, and some studies suggest these disparities may have worsened during the COVID-19 pandemic. Further, continuity of treatment, as measured by the number of treatment or overdose reversal prescriptions per enrollee among enrollees receiving at least one treatment or overdose reversal prescriptions, remained mostly stable for White enrollees (around 11 prescriptions per person), but declined for Black enrollees (from around 6 prescriptions per person to 5) and Hispanic enrollees (from 7 prescriptions per person to 5).
Looking Ahead
There have been recent actions to address opioid overprescribing and misuse, including a 2022 update to the 2016 CDC guidelines for prescribing opioids for pain. The guidelines are voluntary and are intended to help providers navigate providing appropriate care to patients in pain, and the update reportedly provides for more flexibility and individualized treatment, no longer including strict duration and dosage limits that the earlier guidelines included. It is unclear at this time whether states will update their policies to reflect the eased restrictions on prescription opioids seen in the recent guidelines. Some groups are also taking steps to address racial disparities in pain management including developing new assessment tools and raising awareness of systemic racism in medicine.
There have also been recent federal efforts to increase access to medications that treat OUD or reverse opioid overdose. Following the onset of the COVID-19 pandemic, the federal government allowed for new flexibilities in OUD treatment to ease access barriers, for example allowing for take-home methadone doses and covering telehealth treatment, and the Biden administration has proposed making these flexibilities permanent. The Biden administration also released a model law to make access to naloxone more consistent across states, new buprenorphine practice guidelines that eliminate a training requirement many viewed as a barrier to treatment, and a National Drug Control Strategy to combat addiction and the opioid epidemic.
Further, the 2023 Consolidated Appropriations Act eliminated the X-waiver requirement for prescribing buprenorphine, which substantially increases the number of providers who are authorized to prescribe buprenorphine to treat OUD. The Act will also require all providers with a controlled substances license to obtain training on treating and managing patients with OUD and SUD. States and localities have also started to receive funds as part of the National Opioid Settlement, and it is required that states use at least 70% of the funding toward opioid remediation efforts, though there are concerns about a lack of transparency about how funds will be spent in some states.
Methods
Data: This analysis uses the 2016-2019 T-MSIS Research Identifiable RX line claims files merged with the demographic-eligibility files from the Chronic Condition Warehouse to include beneficiary demographic and enrollment information. The RX line files contain claims for prescription or over-the-counter drugs or other products covered by Medicaid or CHIP and provided by a pharmacy.
For 2019, the number of prescriptions identified in the T-MSIS claims is about 7 million fewer than what is reported in the State Drug Utilization Data (SDUD) which collects prescription drug rebate data submitted by states. The SDUD count is higher because the data include all rebate-eligible covered outpatient drugs, including any administered by a physician that states receive rebates for, which are excluded from the TMSIS RX files and because KFF made the state and enrollee exclusions detailed below. Prior KFF analyses used the SDUD data, but those data can’t be linked to enrollee information, which makes it impossible to analyze changes in prescribing patterns by enrollee characteristics.
Identifying Opioid Prescriptions: To identify all claims for opioid prescriptions, we used the NDC code on each drug claim to match in data from IBM’s Micromedex RED BOOK (downloaded in September 2021) about the therapeutic/pharmacologic category of the product. We included all drugs that were categorized as opiate agonists, opiate partial agonists, or opiate antagonists in the analysis. To separate out opioid prescriptions to treat pain vs. medications used to treat OUD or opioid overdose, we identified all prescriptions with the unique or primary agent buprenorphine (an opiate partial agonist) as well as all drugs categorized as opiate antagonists (naltrexone and naloxone). Naloxone is FDA approved to reverse opioid overdose but is included with other treatment prescriptions in this analysis. All other opiate agonists and partial agonists were categorized as pain medications. As methadone must typically be administered in a certified opioid treatment program (OTP) if it is being prescribed for OUD, we assume the small share of methadone prescriptions in the RX claims files (around 1% of all opioid prescriptions in 2019) were prescriptions to treat pain, not for treatment of OUD.
Enrollee Exclusion Criteria: We exclude partial-benefit enrollees, who do not generally have coverage for prescription drugs, and Medicare-Medicaid enrollees, who have primary drug coverage through Medicare. CHIP claims are included in this analysis.
State Exclusion Criteria: We calculated the change from year to year for each state across three different measures: number of opioid prescriptions, share of enrollees with at least one opioid prescription (opioid users), and number of opioid prescriptions per user. If any of those measures changed by more than 100% of the prior-year value, we excluded the state from the analysis, assuming the volatility reflected potential data quality issues. We excluded five states based on that criterion (AR, FL, MA, MS, VA). We also excluded states with total RX line volume (as assessed by the DQ Atlas) that was less than 50% of the national median which included three states (FL, MS, NC), two of which also met the prior criterion. In total, 6 states were excluded (AR, FL, MA, MS, NC, VA), and 44 states and DC were included in the main analysis.
For reporting by race/ethnicity, we excluded states with “High Concern/Unusable” DQ Atlas assessments in 2016 or 2019. Among states in the main analysis, 21 states were excluded from the race/ethnicity analysis only (AL, AZ, CO, CT, DC, HI, IA, KS, LA, MD, MO, MT, NE, NY, OR, RI, SC, TN, UT, WV, and WY), leaving 24 states for reporting by race/ethnicity (Figure 3 & Figure 6).
This work was supported in part by Well Being Trust. KFF maintains full editorial control over all of its policy analysis, polling, and journalism activities.