Executive Summary
At the start of the pandemic, Congress enacted the Families First Coronavirus Response Act (FFCRA), which included a requirement that Medicaid programs keep people continuously enrolled through the end of the COVID-19 public health emergency (PHE) in exchange for enhanced federal funding. Primarily due to the continuous enrollment provision, Medicaid enrollment has grown substantially compared to before the pandemic. When the continuous enrollment provision ends, millions of people could lose coverage if they are no longer eligible or face administrative barriers during redeterminations despite remaining eligible. The Consolidated Appropriations Act, 2023 de-links the Medicaid continuous enrollment provision from the PHE allowing states to resume disenrollments starting April 1, 2023. States can work with Medicaid managed care organizations (MCOs), which deliver care to more than two-thirds of all Medicaid beneficiaries nationally, to conduct outreach to enrollees to prepare them for the end of the continuous enrollment period. CMS has issued specific guidance allowing states to permit MCOs to update enrollee contact information and conduct outreach about the eligibility renewal process to facilitate continued enrollment as well as Marketplace transitions, where appropriate.
To better understand the role Medicaid MCOs may play in unwinding the continuous enrollment provision, KFF, in collaboration with the Association for Community Affiliated Plans (ACAP), fielded a short survey of Medicaid MCOs (also referred to as managed care plans throughout) in October-November 2022. ACAP member plans are not-for-profit safety net health plans that serve more than 20 million Medicaid enrollees, or about one in five Medicaid enrollees. The survey was fielded among all ACAP health plans that participate in the Medicaid market. A total of 29 plans (of 65), accounting for over 13.2 million Medicaid beneficiaries enrolled in Medicaid MCOs as of September 2022, across 15 states1 (of 26) responded to the survey. To gain additional insights, a roundtable discussion was held in mid-November 2022 with representatives from 10 plans. While ACAP member plans may differ in important ways from for-profit plans (which enroll more than 50% of all Medicaid beneficiaries nationally), all plans are going to want to maintain enrollment and revenue to the extent possible, and results provide important insights into implications and challenges of unwinding. For additional details, see the Methods section at the end of this brief. Key findings include the following:
Updating beneficiary contact information. Only about one-third of responding plans reported having verified/current contact information for between 76% to 100% of their Medicaid members. Most responding plans reported they are taking action to reach out to members directly to assist with updating contact information and many are working with third parties (e.g., providers, community-based organizations (CBOs), subcontractors/vendors etc.). Nearly all responding plans said that reaching Medicaid beneficiaries is a challenge. Plans also described challenges involved with transferring updated contact information data to the state.
Renewal Outreach. Nearly all responding plans reported the state where they operate is planning to provide monthly files containing information on members for whom the state is initiating the renewal process, and more than half reported that they expect to receive monthly files with information on members that have not submitted renewal information and are at risk of losing coverage. Only one in five responding plans reported hiring (or planning to hire) additional staff to help with renewal efforts. About half of responding plans indicated their renewal outreach strategy includes targeted outreach for specific populations (e.g., pregnant, or postpartum individuals, individuals with chronic conditions, individuals with mental illness or substance use disorder (SUD)).
Coverage Transitions. More than half of responding plans reported that their state Medicaid agency is planning to provide periodic termination files so plans can conduct outreach to individuals terminated for procedural reasons. However, several plans indicated termination files received from the state do not include the reason a beneficiary may be losing coverage. Plans stressed that without this information their ability to conduct targeted outreach is constrained. Nearly all responding plans that also offer a Qualified Health Plan (QHP) in the Affordable Care Act (ACA) marketplace reported that the state will permit the plan to share information about their QHP with enrollees found ineligible for Medicaid. The expectation is that many people no longer eligible for Medicaid because their incomes have risen will be eligible for premium assistance under the ACA.
Unwinding implications. Three-quarters of responding plans reported expecting between 10% to 25% of their enrollees to lose Medicaid coverage over the unwinding period. Responding plans most frequently reported decline in Medicaid enrollment, loss in revenue, churn, and disruptions in member care as significant challenges they expect related to unwinding. Most responding plans expect the risk profile (or acuity) of members to increase, as plans anticipate “stayers” will be sicker than “leavers” and expect medical loss ratios (MLRs) – the share of premiums going to pay for care – to increase.
With a date certain for the end of the continuous enrollment provision, states are finalizing unwinding operational plans and prioritization approaches as well as readying systems. Plans highlighted strategies that could help address unwinding challenges including strengthening communication across state and county agencies, providers, community-based organizations (CBOs), and health insurance Marketplaces; providing detailed, timely data transfers to enable plans to conduct targeted outreach; increasing automatic (“ex parte”) renewals; maximizing lead time for plans to conduct outreach to members before terminating coverage; state consideration of adopting continuous eligibility policies, and improving alignment of eligibility requirements and processes across programs/eligibility pathways.
Findings
To help ensure eligible enrollees retain coverage, states may direct MCOs to seek updated contact information from enrollees. If plans contract with a third party to collect this information, they must confirm the accuracy of updates with enrollees directly. MCOs may share this information with the state or assist individuals in providing their updated contact information to the state. States may accept updated enrollee contact information from MCOs including mailing addresses, telephone numbers, and email addresses provided the state complies with certain beneficiary notice requirements (to confirm the accuracy of updated contact information) or the state receives a waiver of such requirements from CMS.
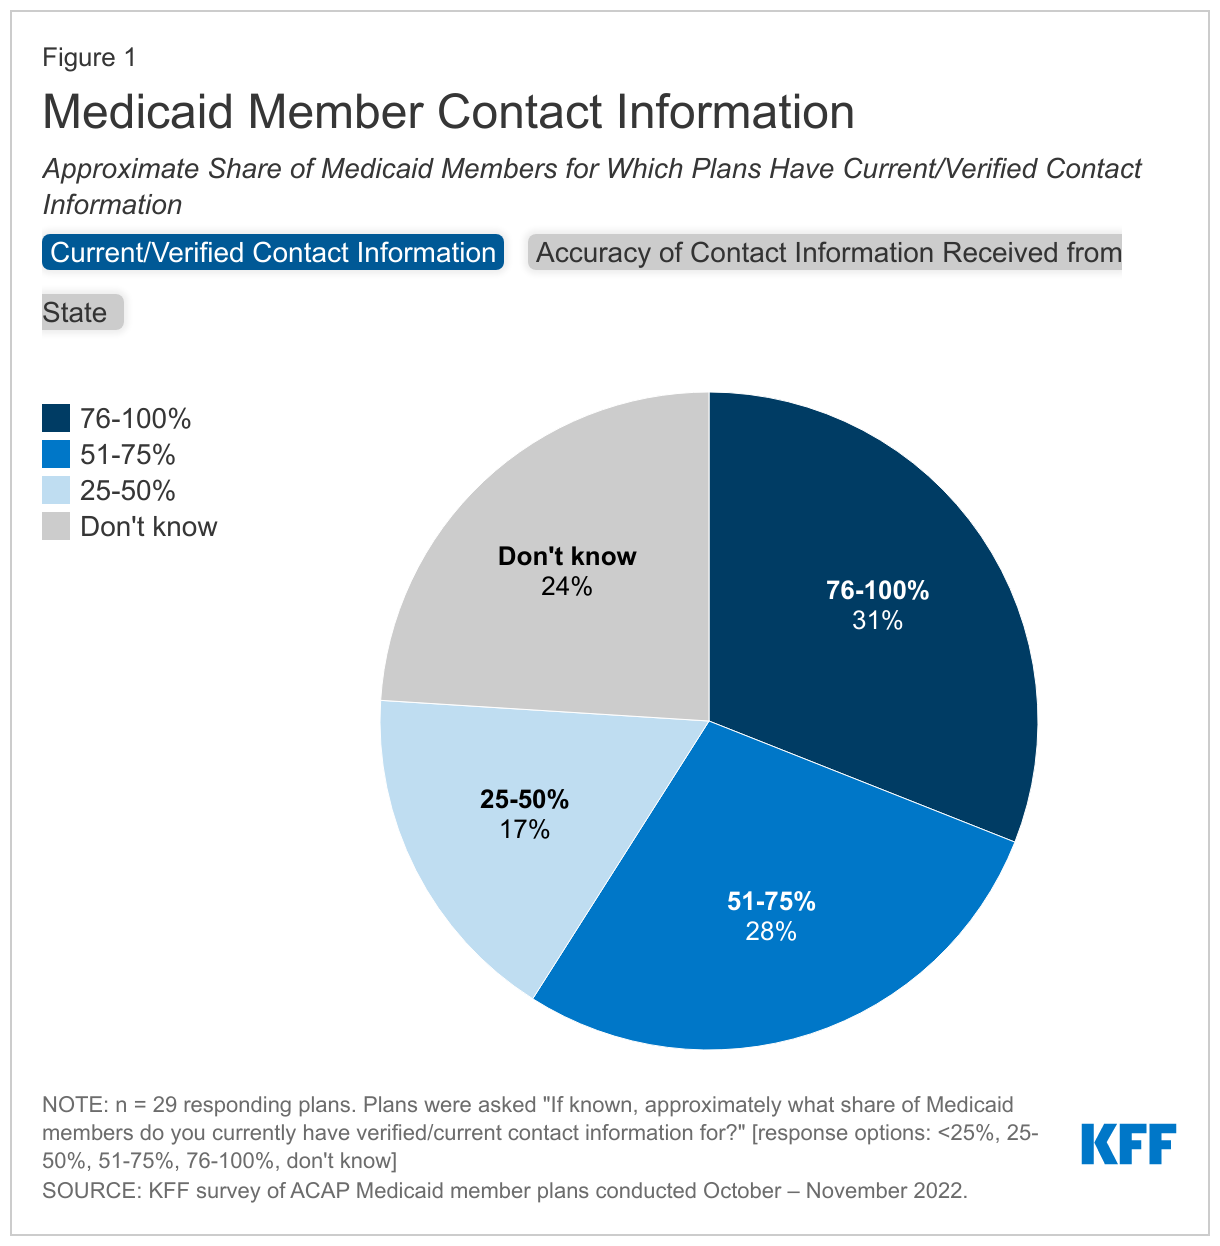
Only about one-third of responding plans reported having verified/current contact information for between 76% to 100% of their Medicaid members (Figure 1). As background, plans were asked to identify the share of Medicaid members for which they currently have verified contact information. This information is essential to ensuring members receive renewal notices and other communication from the state and the plan. Plans were also asked how often member mailing address, phone number, and email information received from the state is accurate. Less than half of responding plans (38%) reported member information received from the state Medicaid agency is accurate “most of the time” (Figure 1). During the roundtable, several plans discussed the need to maintain “shadow files” to retain up-to-date member contact information, as periodic data feeds from the state may override their member data. Plan staff also reported variable success in transferring updated data to the state (discussed in more detail below).
Most plans reported they are taking action to reach out to members directly to assist with updating contact information. Plans reported conducting direct member outreach via text, email, phone, robocall, interactive voice response (IVR), and letter/postcard. Several plans noted they verify contact information on every inbound and outbound call. In addition to conducting direct member outreach, plans also reported mass messaging via social media, website, member newsletter, tv/radio segments, and other marketing/advertisements. Plans may assist Medicaid members with updating their contact information with the state (or county) Medicaid agency or may obtain updated contact information to share with the state directly. Generally, plans reported live calls and text messaging have been the most effective methods to obtain and update contact information.
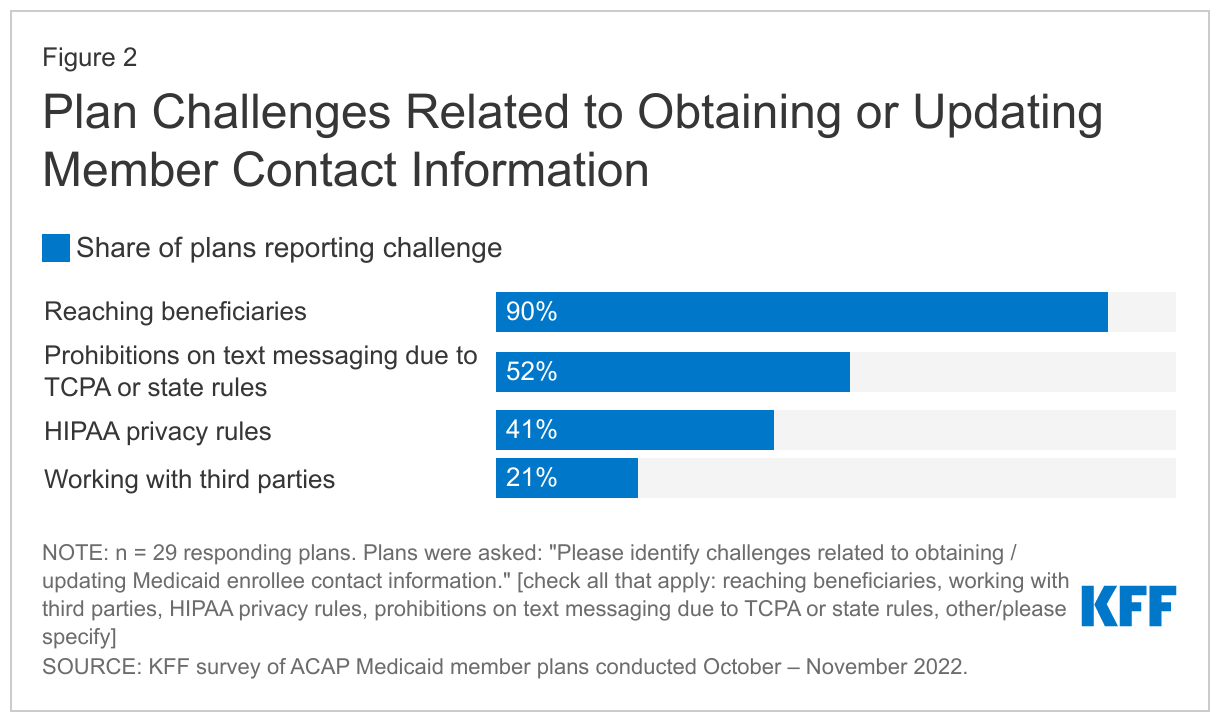
Nearly all responding plans reported reaching Medicaid beneficiaries poses a challenge to updating member contact information (Figure 2). In particular, restrictions on text messaging imposed by the Telephone Consumer Protection Act (TCPA) or state rules were cited as a challenge by about half of responding plans. TCPA prohibits sending automated text messages without obtaining the recipient's prior consent. While prior Federal Communications Commission (FCC) rulings confirmed federal and state governments are not subject to TCPA restrictions, CMS had been working to clarify with the FCC whether contractors of state agencies (including MCOs) are subject to the TCPA. On January 23, 2023, the FCC provided guidance to federal and state agencies, as well as their partners (including managed care entities), enabling them to make autodialed (and prerecorded) text and voice calls to raise awareness about Medicaid eligibility and enrollment requirements without violating the TCPA. Other challenges identified by plans include difficulty obtaining documentation from beneficiaries to assist with updating information; lack of communication between state Medicaid agency and Medicaid beneficiaries during the PHE leading to more outdated member information; and difficulty obtaining member approval/confirmation for updates received from third parties.
The majority of plans reported working with third parties to help obtain updated member contact information and to support outreach and communication efforts. Plans said they are partnering with different entities including providers, community-based organizations (CBOs), other state and local agencies (e.g., social services, public health, schools), and subcontractors and vendors (e.g., transportation vendors, pharmacy benefit managers (PBMs), contractors engaged specifically to do outreach/help members during the unwinding process) to ensure member contact information is up-to-date. A few plans described efforts to implement “feeds” for updated addresses or to flag instances of mismatched data with pharmacy or transportation vendors. One plan reported all competitor health plans in the market came together and developed a rack card which includes contact information/branding for each health plan, brief messaging around ensuring Medicaid member addresses are up-to-date, and a QR code enabling members to easily update their address. Their goal is to deliver these cards to hospitals, providers, behavioral health agencies, social service community agencies, schools, and pharmacies across the state. Plans also reported a variety of efforts to educate and engage providers and CBOs about the upcoming end of the continuous enrollment period (e.g., developing provider toolkits and training) and to support provider and CBO outreach and communication efforts (e.g., hosting renewal/recertification events with providers and CBOs and other co-branded strategies).
Nearly three in four responding plans reported providing updated member contact information data to the state or county Medicaid agency on a weekly, bi-weekly, or monthly basis, although plans also identified challenges that undermine efforts to share this information. In a number of states, counties administer the Medicaid program; notably, plans operating in California reported data is exchanged with county agencies instead of directly with the state Medicaid agency. Plans described a variety of challenges involved with transferring updated data including building systems/processes to allow for data exchange; lack of confirmation from the state agency that updated contact information was received and action was taken; lag in time for state systems to update member records; and subsequent state data runs that do not reflect updated data supplied by plan. Plans from a few states reported the state is currently unable to receive updated contact information from the plan.
Renewal Outreach
Nearly three-quarters of responding plans reported conducting outreach about Medicaid renewals prior to the COVID-19 pandemic. As background, plans were asked whether they communicated with enrollees about renewals prior to the pandemic. Pre-pandemic outreach reported by plans ranged from sending member reminders (mailings, phone calls etc.) to more active renewal application assistance as well as engagement with community partners.
Nearly all responding plans said their state is planning to provide monthly files containing information on members for whom the state is initiating the renewal process. Additionally, more than half of responding plans reported they expect the state Medicaid agency to provide monthly files with information on members that have yet to submit renewal forms or additional documentation and are at risk of losing coverage. CMS guidance emphasizes federal Medicaid managed care marketing rules (42 CFR 438.104) do not prohibit plans from providing information and conducting general outreach about the eligibility renewal process on behalf of states. To enable plans to conduct targeted outreach and provide assistance with the renewal process, CMS has encouraged states to share information with plans including beneficiaries due for renewal and those at risk of losing coverage who have yet to submit renewal forms or other documentation.
Only one in five responding plans reported hiring (or planning to hire) additional staff to help with renewal efforts. Even without new staff, plans reported planning multiple outreach efforts. Nearly three-quarters of responding plans said they will disseminate outreach materials developed by the state Medicaid agency about the need to renew coverage and will also develop other outreach materials to communicate with Medicaid members. All responding plans reported outreach materials will be available in multiple languages, most commonly Spanish. About three-quarters of responding plans reported using social media to conduct outreach. Some plans indicated they will be developing text messaging campaigns around renewals and others noted they will call members whose renewals are due. Plans also said they were developing provider toolkits specifically focused on renewals that, in some cases, include videos providers can show in their waiting rooms.
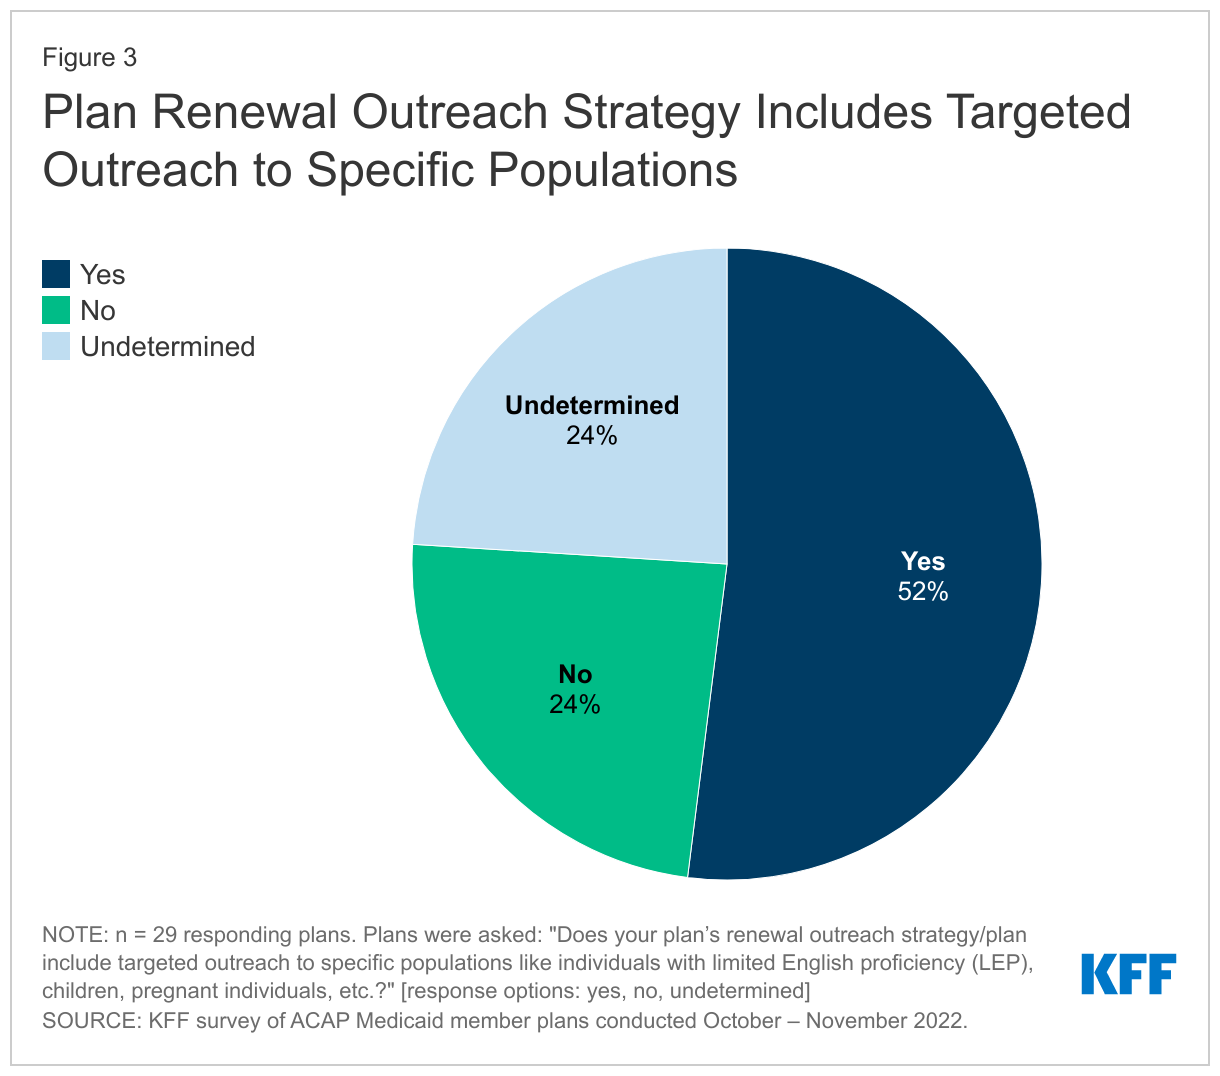
About half of responding plans reported their renewal outreach strategy includes targeted outreach for specific populations (Figure 3), most frequently for individuals with chronic conditions, pregnant individuals, postpartum individuals, and individuals with mental illness or substance use disorder. Plans indicated these targeted outreach strategies would include additional communication; customized messaging; call center and provider portal alerts for select members; leveraging care managers, transition teams, and life coaches; and partnering with CBOs to provide in-home application assistance for members with disabilities and homebound members.
Coverage Transitions
More than half of responding plans reported that the state Medicaid agency is planning to provide periodic termination files; however, outreach may be difficult if files do not include the reason for termination. Most plans reported expecting to receive termination files monthly. Medicaid managed care marketing rules at 42 CFR 438.104 do not prohibit general outreach from Medicaid managed care plans for eligibility purposes; a plan’s ability to conduct this activity depends on the plan’s contract with the state agency. CMS also clarified in recent guidance that federal marketing rules do not differentiate between coverage termination reasons and states may use plans to conduct general eligibility outreach (on behalf of the state) for any potential coverage termination reason. However, several plans indicated termination files often do not include the reason a beneficiary may be losing coverage. Plans stressed that without this information, their ability to conduct targeted outreach is constrained.
Nearly all responding plans that also offer a QHP reported that the state will permit the plan to share information about their QHP with enrollees found ineligible for Medicaid. CMS guidance outlines states may encourage MCOs that also offer a QHP in the ACA Marketplace to share information with their own enrollees who have been determined ineligible for Medicaid to assist in the transfer of individuals to Marketplace coverage (which has higher income eligibility thresholds than Medicaid). To avoid gaps in coverage, managed care plans may reach out to individuals before they lose coverage to allow them to apply for Marketplace coverage in advance. Even though CMS indicates this activity is allowable under federal rules, plans must comply with state-specific laws and/or contract requirements that may prohibit this activity. During the roundtable, a few plans highlighted the significance of being able to direct ineligible members to affiliated Marketplace plans which was not standard protocol previously. Plans will outreach in a variety of ways (e.g., disseminating written materials) and affiliated QHP plans are also planning to do direct outreach as well.
Implications and Challenges
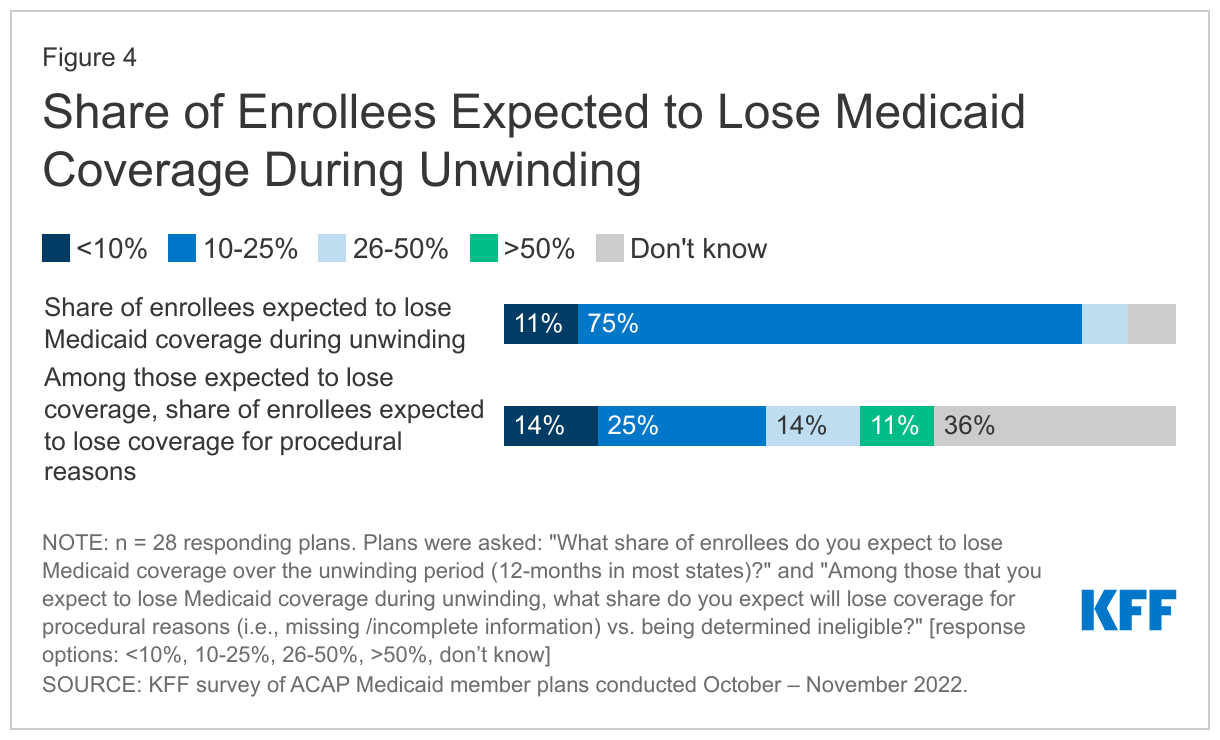
Three-quarters of responding plans reported they expect between 10% to 25% of their enrollees to lose Medicaid coverage over the unwinding period (Figure 4). While the number of Medicaid enrollees who may be disenrolled during the unwinding period is highly uncertain, it is estimated that millions will lose coverage. The share of individuals disenrolled across states will vary due to differences in how states prioritize and process renewals. One-quarter of responding plans reported they expect that among enrollees who lose coverage, 26% or more will lose coverage for procedural reasons (i.e., related to missing or incomplete information) versus being determined ineligible (Figure 4). Only a small share of responding plans participate as a QHP in the health insurance Marketplace (9 plans), but these plans reported they expect to only enroll a small share of individuals into their QHP offering following Medicaid disenrollment during unwinding (data not shown).
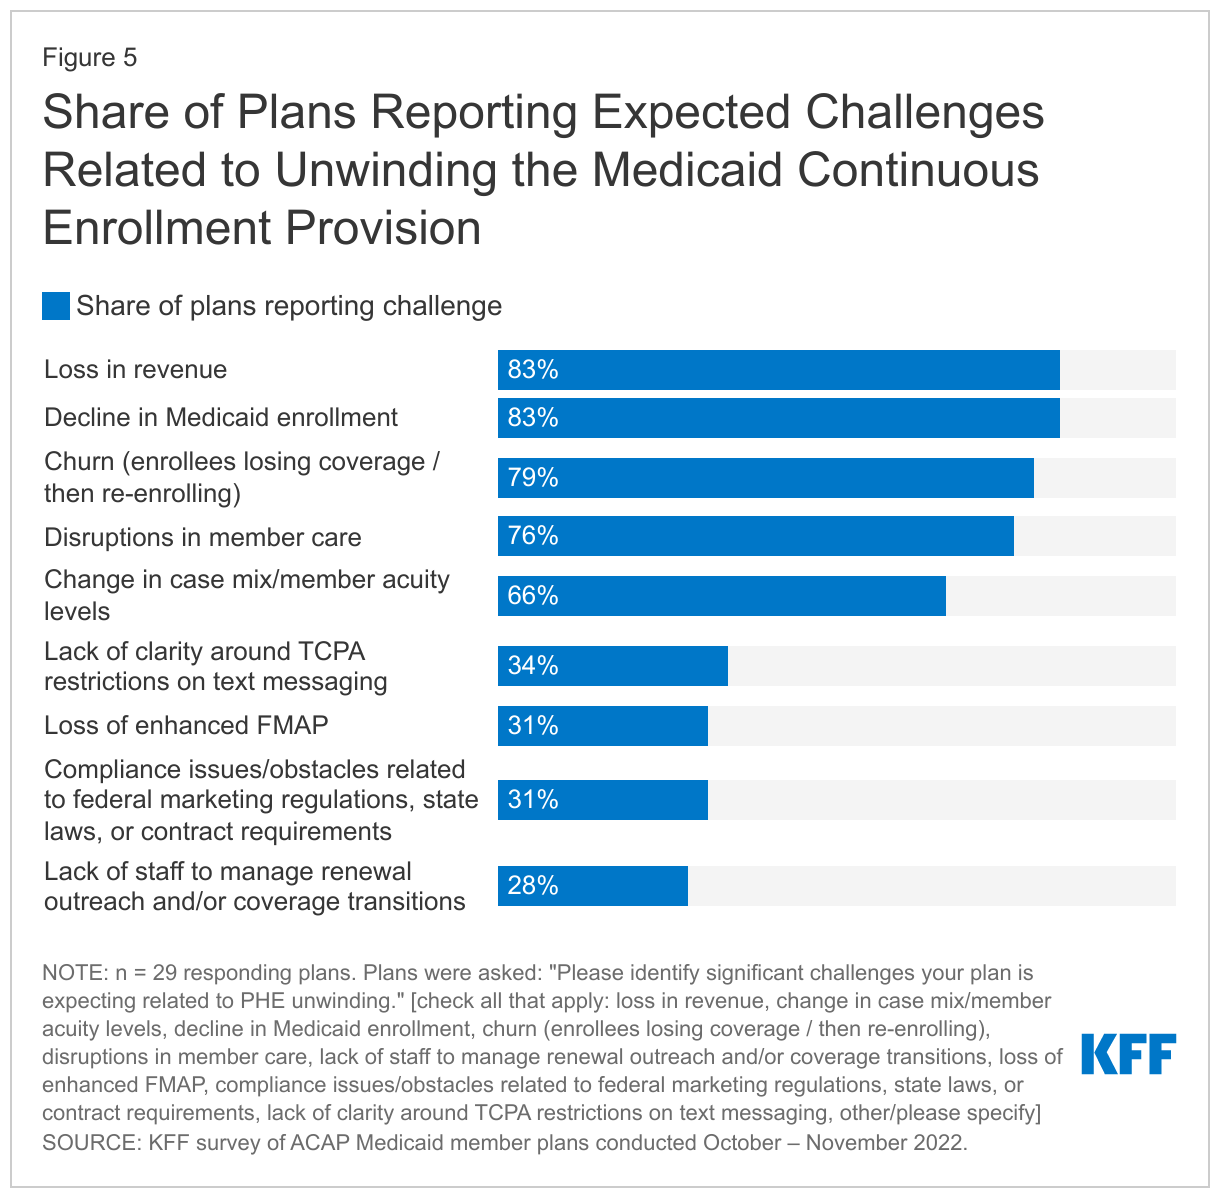
Responding plans most frequently reported decline in Medicaid enrollment and related revenue loss, enrollee churn, and disruptions in member care as significant challenges they are expecting related to unwinding (Figure 5). Prior to the pandemic, managed care plans long cited lack of continuous eligibility, or churn, as a key challenge in ensuring access to care and care continuity for members. During the roundtable, plans expressed concern about members with chronic conditions and the significant impact of interrupted coverage on access to needed services (e.g., loss of access to HIV, behavioral health, hypertension, or diabetes care). On the survey, plans were also asked to discuss the anticipated effects of the end of the continuous enrollment provision on service utilization, enrollee composition, and plan medical loss ratio (MLR). Most responding plans expect the risk profile (or acuity) of members to increase, as plans anticipate “stayers” will be sicker than “leavers.” Plans also expect MLRs to increase (the MLR reflects the proportion of total capitation payments received by an MCO spent on clinical services and quality improvement, with the remainder going to administrative costs and profits).
Looking Ahead
During the unwinding, millions of people could lose coverage if they are no longer eligible or face administrative barriers to renewing coverage despite remaining eligible. The significant volume of work that states face will place a heavy burden on eligibility and enrollment staff and could contribute to disenrollments due to procedural reasons. Medicaid managed care plans may be well positioned to assist states in conducting outreach and providing support to enrollees who will need to navigate the renewal process. With a date certain for the end of the continuous enrollment provision, states are finalizing unwinding operational plans and prioritization approaches as well as readying systems. Plans highlighted strategies that could help address unwinding challenges including strengthening communication across state and county agencies, providers, CBOs, and health insurance Marketplaces; providing detailed, timely data transfers to enable plans to conduct targeted outreach; increasing automatic (“ex parte”) renewals; maximizing lead time for plans to conduct outreach to members before terminating coverage; and state consideration of adopting continuous eligibility policies, and improving alignment of eligibility requirements and processes across programs programs/eligibility pathways.
Methods
To better understand the role of Medicaid MCOs in unwinding, KFF fielded a short Medicaid managed care plan survey in October 2022 in collaboration with the Association for Community Affiliated Plans (ACAP). ACAP member plans are not-for-profit safety net health plans which serve more than 20 million Medicaid enrollees, or about one in five Medicaid enrollees. While ACAP member plans may differ in important ways from for-profit plans (which enroll more than 50% of all Medicaid beneficiaries nationally), results provide important insights into implications and challenges of unwinding. The survey was fielded among all ACAP health plans that participate in the Medicaid market as of October 2022 (65 plans across 26 states). A total of 29 plans accounting for over 13.2 million Medicaid beneficiaries enrolled in comprehensive MCOs as of September 2022 across 15 states (AZ, CA, IL, IN, MA, MD, MN, NY, OH, OR, PA, RI, TX, WA, and WI) responded to the survey. Responding plan enrollment ranged from approximately 3,600 to 2.5 million with median enrollment of approximately 310,000. Nine plans that participated in the survey reported their health plan also participates as a qualified health plan (QHP) in the health insurance Marketplace. Staff from 10 plans across 9 states (AZ, CA, IL, MN, NY, OH, PA, TX, and WA) participated in a roundtable discussion held on November 16, 2022.