Medicare Beneficiaries’ Financial Security Before the Coronavirus Pandemic
Issue Brief
Introduction
The rising number of people in the U.S. with coronavirus is having a widespread impact on the health and economic security of people of all ages, including older Americans. Adults ages 65 and older are not only at higher risk of serious illness if they get infected, but at risk of losing their retirement security. Nearly half of older Americans (48 percent) say they are worried that their investments will be negatively affected by coronavirus disease and the spillover effects of ongoing market volatility on their economic security.
The CARES Act aims to provide relief in the short-term by extending and enhancing unemployment benefits, and by providing up to $1,200 in payments to individuals, including Medicare beneficiaries who receive Social Security payments, but the longer-term impact on retirement income is unclear. Both provisions should help older adults who live on relatively modest incomes, including seniors who have continued to work to supplement their Social Security income. However, the volatility in the stock market could have a significant impact on the retirement savings that older adults accumulate over the course of their lives to cover big expenses, including out-of-pocket health costs, especially the cost of long-term care.
This analysis looks at the income, assets and home equity of Medicare beneficiaries prior to coronavirus outbreak, using data from the Dynamic Simulation of Income Model (DYNASIM) for 2019 (See Methodology for details). We look at the overall population and variations by age, gender, and race/ethnicity. Because the analysis is based on information available prior to the pandemic, the estimates do not reflect the impact that the coronavirus economy has had, or will have, on Medicare beneficiaries’ income and savings.
Key Findings
Even before the effects of the coronavirus pandemic are fully realized, our analysis finds many Medicare beneficiaries lived on limited incomes and modest, if any, savings, with wide disparities by age, gender and race/ethnicity.
- Half of all Medicare beneficiaries lived on incomes below $29,650 per person in 2019; one in four had incomes below $17,000 per person (ES Figure 1).
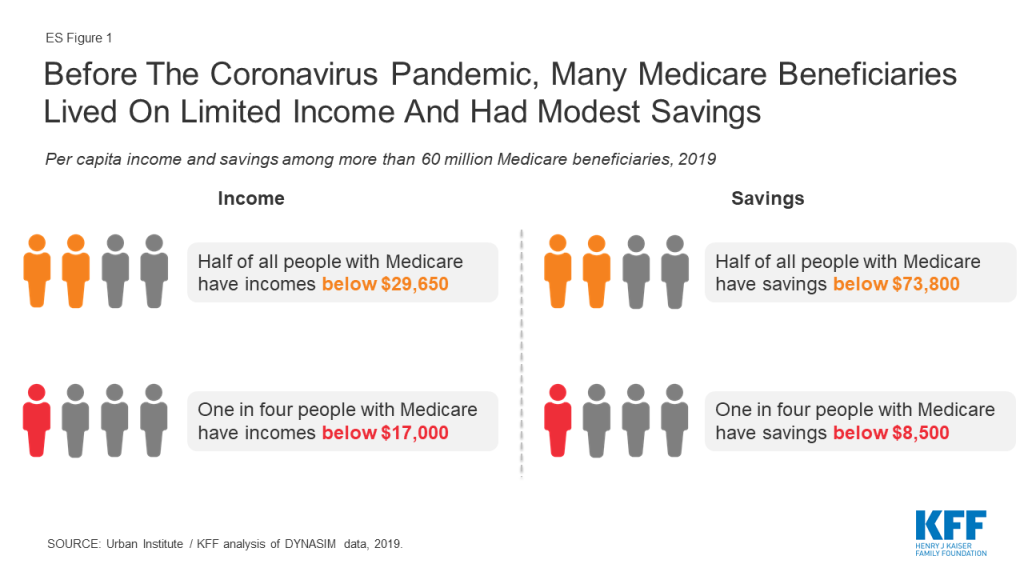
- Half of all Medicare beneficiaries had savings below $73,800 per person in 2019; one fourth had less than $8,500 per person in savings, and 12% had no savings or were in debt.
- Half of all Medicare beneficiaries had home equity below $73,350 per person in 2019, and one fourth (27%) had no home equity at all.
Income among Medicare Beneficiaries
In this analysis, the income of the Medicare population takes into account Social Security, pensions, earnings, and other income sources, including income from assets (e.g., stocks and bonds), rental income, and retirement account (IRA) withdrawals. Income is presented on a per person basis; for married people, income is divided equally between spouses to calculate per capita income. All dollar amounts are in 2019 per capita dollars.
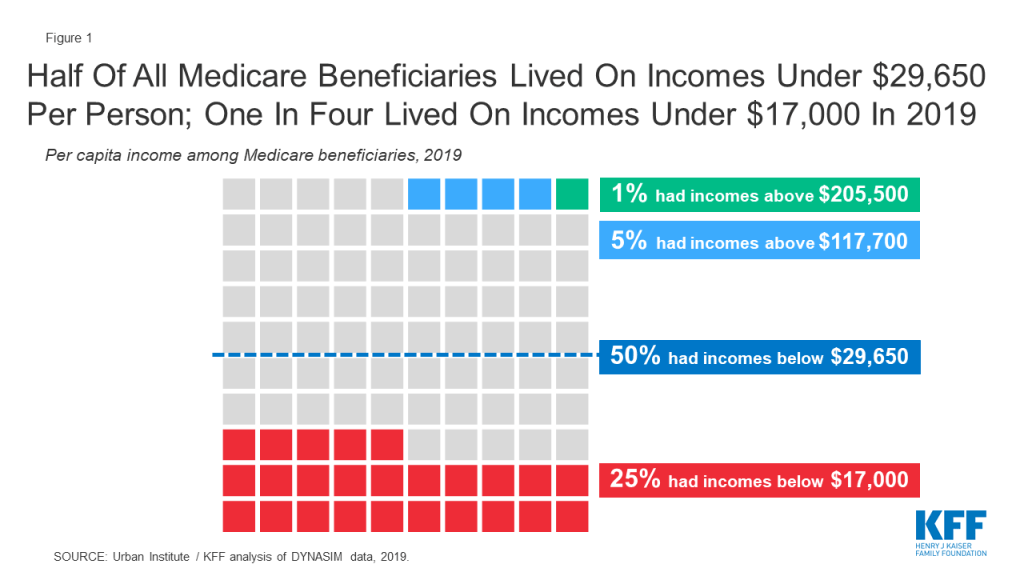
In 2019, half of all Medicare beneficiaries had incomes below $29,650 per person in 2019, while one quarter of all Medicare beneficiaries lived on incomes below $17,000 per person (Figure 1). At the higher end of the income distribution, five percent of Medicare beneficiaries had incomes exceeding $117,700 per person, including the top one percent who had incomes exceeding $205,500, in 2019. Half of all individuals ages 65 and older, who are at or near retirement, had incomes below $31,450 per person in 2019, while one in four beneficiaries ages 65 and older had incomes below $18,150 (Table 2).
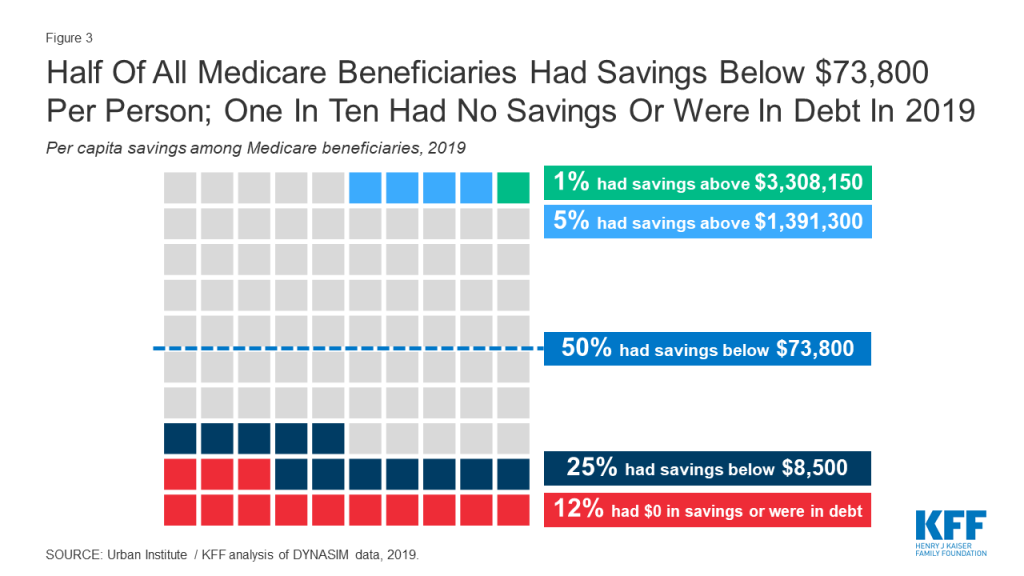
Per person estimates of income among beneficiaries vary dramatically by age, race/ethnicity and gender (Figure 2 and Table 1):
- Age: Among people ages 65 and older, median per capita income declined steadily with age, dropping from $35,200 between ages 65 to 74 to $22,750 at ages 85 and older. Across the entire Medicare population, median per capita income was considerably lower for beneficiaries under age 65 with permanent disabilities ($19,550) than among seniors. In 2018, about one in seven (15%) Medicare beneficiaries were under age 65 and generally eligible for Medicare due to a long-term disability. Median income for individuals ages 65 and older was $31,450 per person in 2019, while one in four beneficiaries ages 65 and older had incomes below $18,150 (Table 2).
- Race/Ethnicity: Median per capita income was substantially higher for beneficiaries who were white ($33,700) than for those who were black ($23,050) or Hispanic ($15,600). Due to small sample sizes, we are unable to provide estimates for Asian, American Indian or other racial or ethnic groups of beneficiaries. The difference in median income by race/ethnicity is attributable to many factors, including education, job opportunities, health status, marital status, and other determinants of wealth, the net effect of which is that people of color disproportionately have lower earnings during their working years than white people, which affects their income and how much they are able to save for retirement.
- Gender: Median per capita income in 2019 was lower among women with Medicare than men ($27,750 vs. 32,050, respectively). Because women have lower paying jobs than men during their working years, and because many work part-time or leave the workforce for periods of time to raise families or care for aging family members, many women receive lower average Social Security and pension benefits than men.
- Marital Status: Married beneficiaries had higher median per capita incomes ($35,250) than those who were divorced, widowed or single ($27,000; $26,450; and $17,000, respectively).
- Education: Median per capita income varied by years of education and was more than three-times higher among beneficiaries with college degrees ($53,250) than among those with less than a high school education ($15,250) in 2019.
Savings among Medicare Beneficiaries
In addition to income, we examine the total savings for Medicare beneficiaries. Savings include retirement account holdings (such as IRAs or 401Ks) and other financial assets, including savings accounts, bonds and stocks. Savings are presented on a per person basis; for married people, savings are divided equally between spouses to calculate per capita savings.
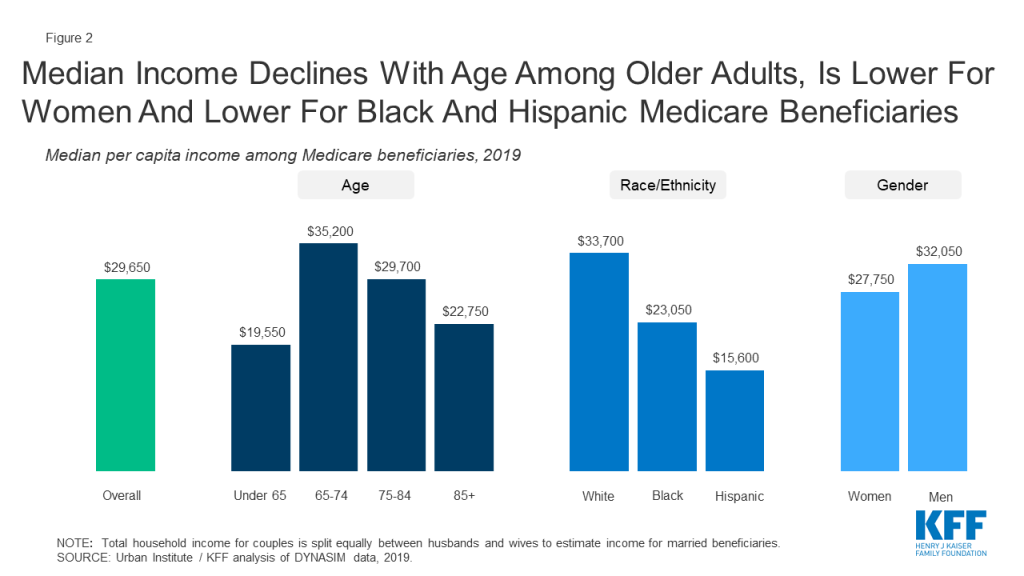
The majority of Medicare beneficiaries (88%) had some savings in 2019; however, the value of their savings varied widely.
Half of all Medicare beneficiaries had less than $73,800 in savings per person in 2019, and one quarter of all beneficiaries had savings below $8,500 per person (Figure 3). More than one in ten Medicare beneficiaries (12%) had no savings at all or were in debt. Among the wealthiest Medicare beneficiaries, five percent had more than $1.4 million in per capita savings, including the top one percent who had more than $3.3 million in savings in 2019.
Among Medicare beneficiaries ages 65 and older, half had savings below $83,850 per person in 2019, a quarter of all older adults with Medicare had savings below $9,650 per person in 2019, and 12 percent had no savings at all (Table 1; Table 2). The average household ages 65 and older with any savings invested about one fifth (18%, on average) of their total savings in the stock market in 2016; the share was lower among older households with savings in the bottom savings quintile (<1%, on average) but much higher (36 percent, on average) among older households in the top savings quintile. The volatility in the stock market raises particular concern for the financial security of seniors who have fewer years than younger adults to recover lost savings from a downturn in the economy (Table 3).
Median per capita savings among Medicare beneficiaries varies across demographics (Figure 4 and Table 1):
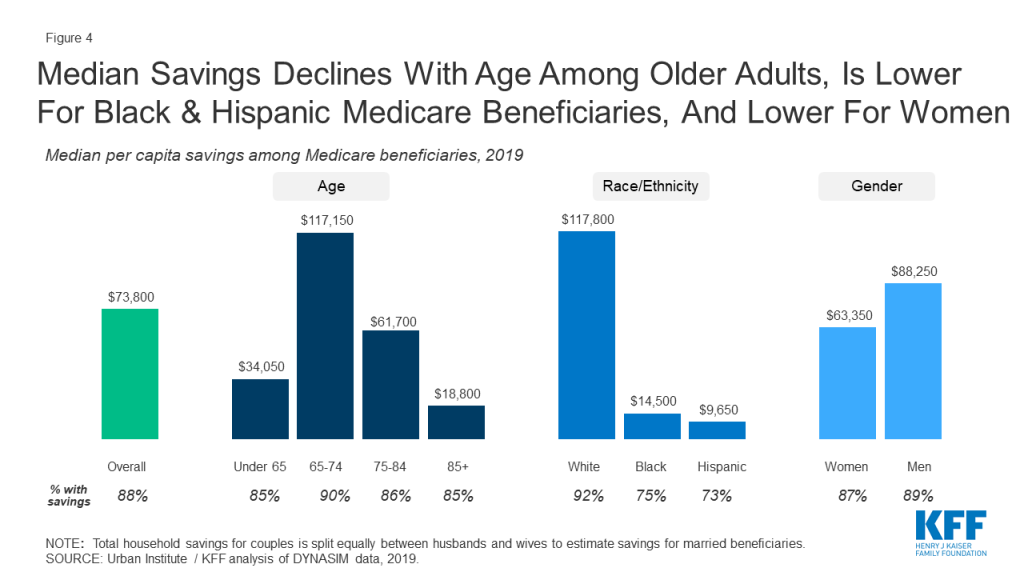
- Age: Among Medicare beneficiaries ages 65 and older, median per capita savings dropped steadily with age from $117,150 among people ages 65-74 to $18,800 per person ages 85 and older. Relatively low savings present clear challenges for adults at older ages who are more likely to incur high health and long-term care expenses. Median savings were considerably lower among beneficiaries with disabilities younger than age 65 ($34,050) than among seniors overall ($83,850).
- Race/Ethnicity: Median per capita savings among white beneficiaries ($117,800) were nearly eight times higher than among black beneficiaries ($14,500) and nearly twelve times higher than among Hispanic beneficiaries ($9,650). Notably, one in four black (25%) and Hispanic (27%) Medicare beneficiaries had no savings in 2019, compared to nearly one in ten (8%) white Medicare beneficiaries. This disparity in savings by race and ethnicity persists among adults ages 65 and older: the median per capita savings among white beneficiaries was $131,650 in 2019, compared to $15,400 among black beneficiaries, and $8,400 among Hispanic beneficiaries (Table 2). The difference in savings by race/ethnicity is the result of many factors, including education, health status, marital status, income, periods of unemployment, access to employer retirement benefits, and inherited wealth, the net effect of which is that people of color also are less likely to have pensions and lower retirement savings.
- Gender: Median per capita savings were substantially lower for women than men on Medicare, a difference of $25,000 per person ($63,350 vs. $88,250, respectively). Among women ages 65 and older, the gap in per capita median savings was even wider ($68,450 for women vs. $105,000 for men).
- Marital Status: Median per capita savings among Medicare beneficiaries who were divorced ($43,500), widowed ($41,300) or single ($17,700) were much lower than those among people who were married ($132,700).
- Education: Median per capita savings were higher among beneficiaries with more years of education; the median savings of college-educated beneficiaries ($275,000) was more than 57-times higher than the median savings among beneficiaries with less than a high school education ($4,800).
Home Equity among Medicare Beneficiaries
As with income and savings, this analysis divides home equity values equally between spouses to calculate per capita home equity. The estimates account for any decrease in home equity values that occurred as a result of the mortgage crisis; it has been estimated that more than 1.5 million Americans over age 50 lost their homes between 2007 and 2011.
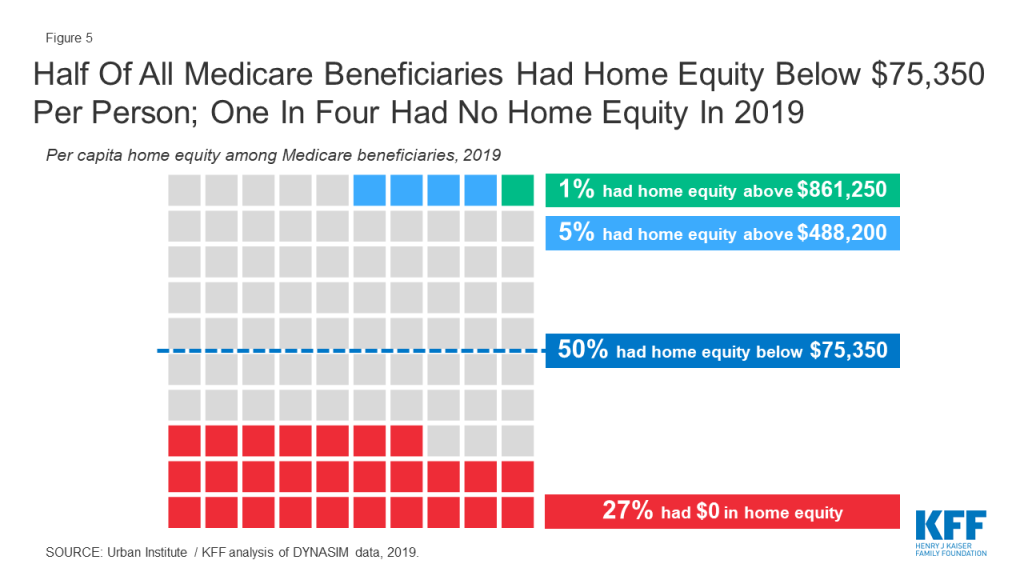
In 2019, half of all Medicare beneficiaries had less than $75,350 in home equity per person in 2019. One quarter (27%) of all Medicare beneficiaries had no home equity at all (Figure 5). At the higher end of the distribution, five percent of Medicare beneficiaries had more than $488,200 per person in home equity, including one percent who had more than $861,250 in home equity.
Estimates of home equity varied dramatically by demographic characteristics (Figure 6 and Table 1):
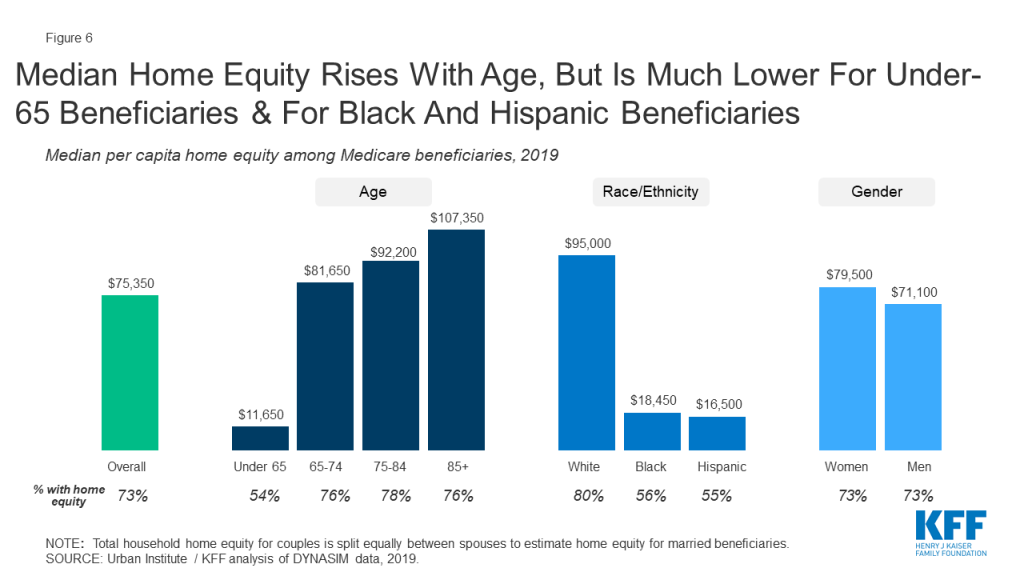
- Age: Per capita median home equity increased with age. The oldest Medicare beneficiaries, those ages 85 and older, had higher median per capita home equity ($107,350) than individuals ages 65-74 ($81,650). Medicare beneficiaries under the age of 65 had substantially lower median per capita home equity in 2019 ($11,650) than beneficiaries ages 65 and older ($87,850). Rising home equity with age reflects the natural growth in home equity as homeowners increasingly reduce and pay off mortgage debt over time. Unlike financial assets that decline with age as seniors spend accumulated savings to fund their retirement spending, homes typically store and accumulate equity over time.
- Race/Ethnicity: Hispanic and black Medicare beneficiaries had substantially lower rates of home ownership than their white counterparts (55% and 56% vs. 80%, respectively). This racial disparity in home ownership rates persisted among adults age 65 and older with Medicare.
- Gender: Median per capita home equity was somewhat higher among women than men on Medicare ($79,500 vs. $71,100). Among adults age 65 and older with Medicare, median per capita home equity was similarly somewhat higher among women than men ($89,700 vs. $85,900). Because home equity rises with age, the higher home equity of female Medicare beneficiaries reflects the higher share of women who survive to older ages than men, and therefore accrue more home equity and increasingly own the full share of their homes.
- Marital Status: Medicare beneficiaries who were widowed had higher median per capita home equity than those who were married or divorced ($123,250 vs. $88,300 and $29,900).
- Education: Median per capita home equity increased with more years of education. Medicare beneficiaries who were college graduates had the highest median per capita home equity ($136,650 vs $12,550 among those without a high school education).
Discussion
In 2019, prior to the coronavirus pandemic and its impact on the economy, the majority of Medicare beneficiaries lived on limited incomes and modest savings, with limited cushion to absorb unanticipated health expenses, and significant disparities by age, gender, and race/ethnicity. Our analysis raises questions about the extent to which Medicare beneficiaries will be able to bear additional, unanticipated costs that are likely to arise from the coronavirus pandemic, given the likely prospect of declining retirement resources. It also highlights the wide variation in Medicare beneficiaries’ financial resources, which is important context for near-term policies pertaining to the costs associated with COVID-19 treatment, and longer-term policies pertaining to Medicare reforms.
Wyatt Koma and Tricia Neuman are with KFF. Karen Smith is with the Urban Institute. Gretchen Jacobson was with KFF at the time this brief was written.
Methods
Asset and income projections are based on the Urban Institute’s Dynamic Simulation of Income Model (DYNASIM4). DYNASIM4 is a dynamic microsimulation model that projects the population and analyzes the long-run distributional consequences of retirement and aging issues. The model starts with a representative sample of individuals and families and ages the data year by year, simulating demographic and economic events including all key components of retirement income. The model integrates many important trends and differences among groups in life course processes, including birth, death, schooling, leaving home, first marriage, remarriage, divorce, disability, work, retirement, and earnings. Projections of fertility, disability, mortality, net immigration, employment, average earnings, and price changes are aligned to be consistent with 2019 OASDI Trustees intermediate cost projections. Projections of assets are aligned to the Health and Retirement Survey (HRS) for people ages 50 and older, and the Survey of Consumer Finances (SCF) for people under age 50. This brief uses data from DYNASIM4; many significant changes were made to the microsimulation model, and the findings therefore cannot be trended from previous analyses, which used DYNASIM3 (See below for more information).
Comparison of Current Data to Past Data
DYNASIM4 is an update to its predecessor, DYNASIM3. It includes a more recent starting sample, updated demographic and labor market modules, and revised asset alignment targets. DYNASIM4 starts with pooled 2004 and 2008 SIPP data and projects data from 2007 to 2093. DYNASIM3 started with pooled 1990 to 1993 SIPP data and projected data from 1993 to 2087. Compared to DYNASIM3, DYNASIM4 updated the demographic projections to add cohabitation and same-sex marriage, and updated education and labor market modules using more recent data. The SIPP data significantly underreports financial and retirement account assets (Czajka, Jacobson, Cody 2003; Smith et al 2005; Smith et al 2010). Both DYNASIM3 and DYNASIM4 adjusted SIPP self-reported assets. DYNASIM3 aligned SIPP asset distributions to the 1992 Survey of Consumer Finances (SCF) data. DYNASIM4 aligns SIPP asset distributions to the 2006 Health and Retirement Study (HRS) (age 50 and older) and 2007 SCF (under age 50) data. DYNASIM projects changes in assets after age 50, so its projections are sensitive to the adjusted SIPP starting values. The HRS asset distributions are typically lower than the SCF asset distributions, but the HRS has a significantly larger sample size for older households than the SCF. The HRS also includes older individuals living in institutions and with non-spouse family members who are not included in the SCF; these individuals tend to have lower incomes and assets than other people on Medicare.
Tables
Table 1
Per Capita Income, Savings, and Home Equity of Medicare Beneficiaries by Selected Demographic Characteristics, 2019
| Income | Savings | Home Equity | ||||||
| Median | Median among all beneficiaries | % with savings | Median among those with savings | Median among all beneficiaries | % with home equity | Median among home owners | ||
| Total | $29,650 | $73,800 | 88% | $107,750 | $75,350 | 73% | $125,900 | |
| Race/Ethnicity | White | $33,700 | $117,800 | 92% | $146,200 | $95,000 | 80% | $132,500 |
| Black | $23,050 | $14,500 | 75% | $35,250 | $18,450 | 56% | $87,150 | |
| Hispanic | $15,600 | $9,650 | 73% | $27,800 | $16,500 | 55% | $90,950 | |
| Age | <Age 65 | $19,550 | $34,050 | 85% | $52,500 | $11,650 | 54% | $68,150 |
| Total, 65+ | $31,450 | $83,850 | 88% | $119,700 | $87,850 | 76% | $132,500 | |
| 65–74 | $35,200 | $117,150 | 90% | $154,100 | $81,650 | 76% | $128,550 | |
| 75–84 | $29,700 | $61,700 | 86% | $97,450 | $92,200 | 78% | $130,900 | |
| 85 and older | $22,750 | $18,800 | 85% | $37,150 | $107,350 | 76% | $159,000 | |
| Gender | Female | $27,750 | $63,350 | 87% | $97,300 | $79,500 | 73% | $131,800 |
| Male | $32,050 | $88,250 | 89% | $121,050 | $71,100 | 73% | $120,150 | |
| Marital Status | Married | $35,250 | $132,700 | 94% | $155,750 | $88,300 | 86% | $109,850 |
| Divorced | $27,000 | $43,500 | 82% | $78,850 | $29,900 | 58% | $125,750 | |
| Widowed | $26,450 | $41,300 | 86% | $67,400 | $123,250 | 77% | $180,400 | |
| Single | $17,000 | $17,700 | 75% | $52,100 | $0 | 38% | $140,900 | |
| Education | Less than High School | $15,250 | $4,800 | 71% | $17,800 | $12,550 | 54% | $79,500 |
| High School | $24,750 | $45,700 | 87% | $66,000 | $61,150 | 72% | $106,550 | |
| Some College | $32,600 | $92,300 | 91% | $118,100 | $80,250 | 76% | $122,550 | |
| College Graduate | $53,250 | $275,000 | 96% | $301,600 | $136,650 | 84% | $176,850 | |
| Federal Poverty Level | <200% FPL | $13,650 | $8,400 | 74% | $22,150 | $8,350 | 52% | $92,400 |
| 200-399% FPL | $28,800 | $68,950 | 92% | $82,600 | $79,300 | 79% | $114,100 | |
| 400% FPL or more | $65,050 | $324,300 | 98% | $337,200 | $134,200 | 89% | $155,650 | |
| Note: Total household income, savings, and home equity for couples are split equally between couples for per capita estimates for married beneficiaries. Source: Urban Institute / KFF analysis of DYNASIM data, 2019. | ||||||||
Table 2
Distribution of Medicare Beneficiaries’ Per Capita Income, Savings, and Home Equity by Age, 2019
| Overall | Age 65 and Older | Under Age 65 | |
|---|---|---|---|
| Distribution of per capita income | |||
| Top ten percent | $89,050 | $91,750 | $63,500 |
| Top 25 percent | $54,300 | $56,700 | $35,850 |
| Median | $29,650 | $31,450 | $19,550 |
| Bottom 25 percent | $17,000 | $18,150 | $12,000 |
| Bottom 10 percent | $10,350 | $10,900 | $9,000 |
| Distribution of per capita savings | |||
| Top ten percent | $839,600 | $892,550 | $435,150 |
| Top 25 percent | $324,400 | $355,450 | $145,100 |
| Median | $73,800 | $83,850 | $34,050 |
| Bottom 25 percent | $8,500 | $9,650 | $4,250 |
| Bottom 10 percent | $0 | $0 | $-750 |
| Distribution of per capita home equity | |||
| Top ten percent | $358,450 | $371,950 | $191,300 |
| Top 25 percent | $192,200 | $205,400 | $75,300 |
| Median | $75,350 | $87,850 | $11,650 |
| Bottom 25 percent | $0 | $6,100 | $0 |
| Bottom 10 percent | $0 | $0 | $0 |
| Distribution of Medicare beneficiaries’ median income, savings, and home equity by age | |||
| Median per capita income, 2019 | |||
| Age | |||
| Under Age 65 | $19,550 | N/A | $19,550 |
| Total, Age 65+ | $31,450 | $31,450 | N/A |
| 65–74 | $35,200 | $35,200 | N/A |
| 75–84 | $29,700 | $29,700 | N/A |
| 85 and Older | $22,750 | $22,750 | N/A |
| Race/Ethnicity | |||
| White | $33,700 | $35,550 | $21,500 |
| Black | $23,050 | $24,900 | $16,500 |
| Hispanic | $15,600 | $15,700 | $15,200 |
| Gender | |||
| Female | $27,750 | $29,000 | $19,250 |
| Male | $32,050 | $34,650 | $19,900 |
| Median per capita savings, 2019 | |||
| Age | |||
| Under Age 65 | $34,050 | N/A | $34,050 |
| Total, Age 65+ | $83,850 | $83,850 | N/A |
| 65–74 | $117,150 | $117,150 | N/A |
| 75–84 | $61,700 | $61,700 | N/A |
| 85 and Older | $18,800 | $18,800 | N/A |
| Race/Ethnicity | |||
| White | $117,800 | $131,650 | $49,800 |
| Black | $14,500 | $15,400 | $11,900 |
| Hispanic | $9,650 | $8,400 | $15,400 |
| Gender | |||
| Female | $63,350 | $68,450 | $39,450 |
| Male | $88,250 | $105,000 | $28,600 |
| Median per capita home equity, 2019 | |||
| Age | |||
| Under Age 65 | $11,650 | N/A | $11,650 |
| Total, Age 65+ | $87,850 | $87,850 | N/A |
| 65–74 | $81,650 | $81,650 | N/A |
| 75–84 | $92,200 | $92,200 | N/A |
| 85 and older | $107,350 | $107,350 | N/A |
| Race/Ethnicity | |||
| White | $95,000 | $105,600 | $22,400 |
| Black | $18,450 | $31,950 | $0 |
| Hispanic | $16,500 | $21,800 | $0 |
| Gender | |||
| Female | $79,500 | $89,700 | $21,050 |
| Male | $71,100 | $85,900 | $0 |
| Note: Total household income, savings, and home equity for couples are split equally between couples for per capita estimates for married beneficiaries. Source: Urban Institute / KFF analysis of DYNASIM data, 2019. | |||
Table 3
Average Equity Share Among Households Ages 65 And Older With Any Savings, 2016
| Equity share of total savings | |
| Average | 18.4% |
| Bottom savings quintile | 0.8% |
| 2nd savings quintile | 9.9% |
| Middle savings quintile | 17.8% |
| 4th savings quintile | 28.2% |
| Top savings quintile | 35.5% |
| Note: Equity share among households ages 65 and older with any savings. Source: Urban Institute analysis of the 2016 Survey of Consumer Finances. | |