Spending and Utilization of EpiPen within Medicaid
EpiPen is a brand-name epinephrine auto-injector product, used in the event of a severe allergic reaction. It is a reliable, easy-to-use medical device that delivers a life-saving drug. In 2007, Mylan acquired EpiPen from Merck. At the time, the product had a list price of $94. Since then, Mylan has steadily increased EpiPen’s price, listing the product at $608 in summer 2016.1 The price increases have led to public debate, particularly among people who pay the full or a sizeable share of the full list price. However, the effect of EpiPen’s high list price goes beyond individual consumers. Medicare spending before rebates on EpiPen has grown substantially over the 2007-2014 period outpacing the growth in the number of Part D EpiPen users.2
Covering over 70 million people, a large portion of which is children, Medicaid is also a major provider of EpiPen and has been impacted by its increasing price. In this Data Note, we examine utilization, spending before rebates, and spending per prescription of EpiPen and other epinephrine auto-injectors before rebates in the Medicaid program. This analysis does not take into account drug rebates, as that data is proprietary.
EpiPen dominated the Medicaid epinephrine auto-injector market.
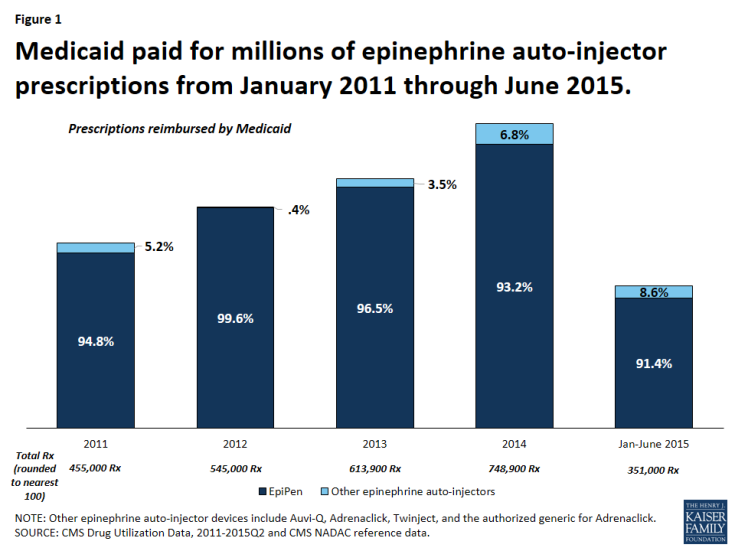
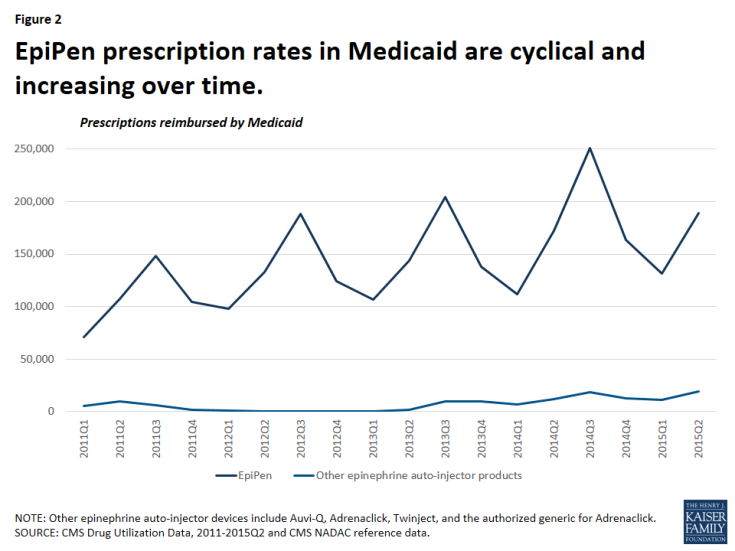
It is not surprising that Medicaid is a major provider of epinephrine auto-injector products, as the program covers over 30 million children.3 From January 2011 through June 2015, Medicaid reimbursed 2.7 million epinephrine auto-injector prescriptions, an average of nearly 600,000 per year.4 Mylan dominated the epinephrine auto-injector market over this period with 95 percent of these reimbursed prescriptions being for EpiPen (Figure 1). At this time, EpiPen’s only competitor in the epinephrine auto-injector market is Adrenaclick’s authorized generic.5 Adrenaclick and its authorized generic provide the same drug, epinephrine, at the same dosage as EpiPen, but through a different type of auto-injector device. A pharmacist cannot automatically substitute either Adrenaclick or the Adrenaclick authorized generic for a prescription for EpiPen.6 In 2013, Sanofi launched another epinephrine auto-injector, Auvi-Q, which is captured in this analysis. However, Sanofi voluntarily recalled the product in October 2015 after problems with the dosing of the drug. Between 2011 and 2015, prescriptions for EpiPen have grown. Within each year, EpiPen prescription rates are cyclical, peaking from July to September each year (Figure 2). Parents of children with severe allergies tend keep epinephrine auto-injectors both at home and at school. Additionally, EpiPen has a shelf life of 18 months, but is usually replaced annually.7 These two factors generate an increase of prescriptions at the start of the school year. Mylan has increased the list price of EpiPen in May or July each year since 2011, just before this annual spike in EpiPen prescriptions.8

Figure 1: Medicaid paid for millions of epinephrine auto-injector prescriptions from January 2011 through June 2015.
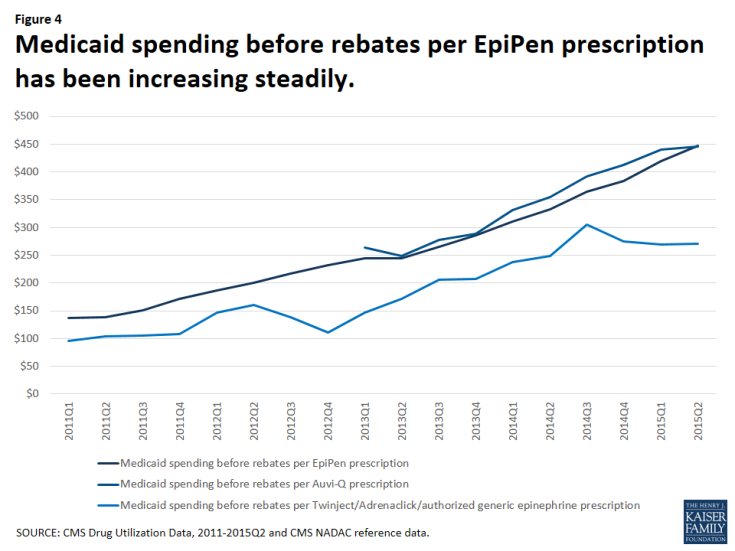
Medicaid spending before rebates per EpiPen prescription has increased over 200% in four years.
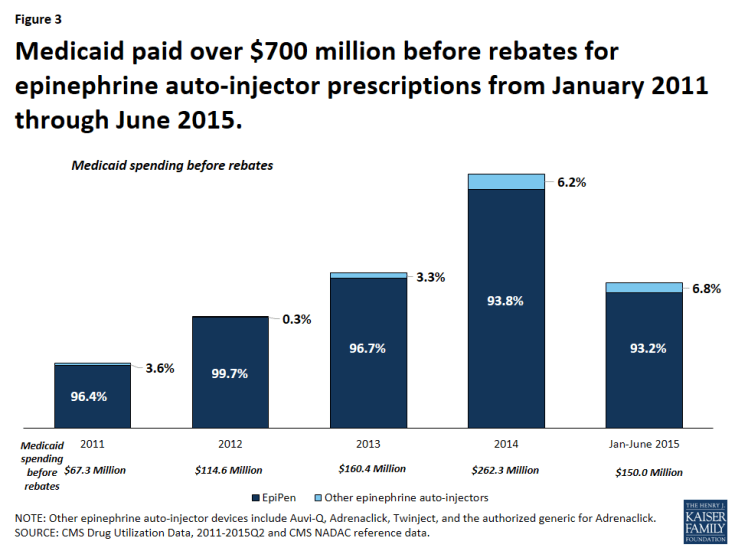
From January 2011 through June 2015, Medicaid paid over $720 million before rebates for EpiPen and nearly $754 million before rebates for all epinephrine auto-injectors (Figure 3). This accounts for 0.4% of all Medicaid outpatient drug spending over the period.9 From January through June of 2011, Medicaid paid $24.5 million before rebates for EpiPen prescriptions. Four years later, from January through June of 2015, Medicaid paid $139.7 million before rebates for EpiPen prescriptions, an increase of over 450%. In comparison, Medicaid outpatient drug spending over this period increased 38%.

Figure 3: Medicaid paid over $700 million before rebates for epinephrine auto-injector prescriptions from January 2011 through June 2015.
The increase in Medicaid’s spending on EpiPen reflects both the increased number of prescriptions as well as the increased amount Medicaid paid per prescription over this period. In the first quarter of 2011, Medicaid paid an average of $137 before rebates per EpiPen prescription. By the second quarter of 2015, the most recent period for which we have data, Medicaid paid an average of $447 before rebates per EpiPen prescription, reflecting an increase in spending per prescription of 227%.
Much attention is being given to the EpiPen price increases. However, over the January 2011 through June 2015 period, Medicaid spending before rebates on EpiPen prescriptions has not always been higher than other competitors in the field. In fact, from the second quarter of 2013 through the second quarter of 2015, Medicaid paid comparable amounts before rebates per prescription for Auvi-Q (Figure 4). Because rebates are proprietary, we are unable to account for their impact on overall Medicaid spending or on spending per prescription.
Reports have recently surfaced that Mylan has been paying rebates to the states as if EpiPen were a generic product and in an October 5th letter to Senator Ron Wyden, ranking member of the Senate Finance Committee, CMS confirmed this.10 All manufacturers are required to enter into a rebate agreement with the Secretary of HHS to secure Medicaid reimbursement. Rebates for brand drugs are larger than rebates for generic drugs. Additionally, rebates for brand drugs take into account when brand drug prices increase faster than inflation, but rebates for generic drugs do not.11 Thus, although we can see that Medicaid spending per prescription between Auvi-Q and EpiPen was comparable before rebates, we do not know how rebates have affected this.
Policy Implications
Medicaid provides coverage for a diverse population, a large share of whom are children, many of whom require epinephrine. However, as the number of prescriptions for the product, as well as the spending per prescription has been rising in recent years, overall spending on the product has been ballooning. To the extent that Medicaid can control its outpatient prescription drug spending, it is able to do so in large part through the Medicaid Drug Rebate Program. Additionally, state Medicaid programs are better able to acquire supplemental rebates when there is competition in the drug class.12 As policy makers discuss the effect of high EpiPen prices, this analysis shows that Medicaid is a major provider of the drug, and that the Medicaid program is bearing the high cost of the product.
Methodology
In this analysis, we used CMS State Utilization Data from 2011 through 2015 quarter 2, the most recent period for which data for all states are available. We downloaded this data from the CMS website in February 2016. In its letter to Senator Ron Wyden, CMS published annual spending and spending per prescription for EpiPen and other epinephrine auto-injector products from 2011 through the end of 2015. However, CMS has not yet made public all of the raw data files underlying these calculations in the second half of 2015. Our analysis largely aligns with the CMS analysis. We identified all epinephrine auto-injectors on the market by compiling a list from the final and draft NADAC weekly reference data and CMS Drug Product data. We estimated data by averaging the surrounding quarters in certain states for given quarters that through this and previous analysis13 we had determined unreliable.
| Table 1: Medicaid Spending and Utilization of Epinephrine Auto-injector Products | |||||||||
| Prescriptions | Spending Before Rebates | Spending Per Prescription Before Rebates | |||||||
| Quarter | EpiPen | Auvi-Q | Twinject/ Adrenaclick/ authorized generic epinephrine |
EpiPen | Auvi-Q | Twinject/ Adrenaclick/ authorized generic epinephrine |
EpiPen | Auvi-Q | Twinject/ Adrenaclick/ authorized generic epinephrine |
| 2011Q1 | 71,247 | N/A | 5,424 | $9,748,836 | N/A | $516,456 | $137 | N/A | $95 |
| 2011Q2 | 107,371 | N/A | 10,072 | $14,793,856 | N/A | $1,046,447 | $138 | N/A | $104 |
| 2011Q3 | 148,238 | N/A | 6,076 | $22,451,007 | N/A | $642,229 | $151 | N/A | $106 |
| 2011Q4 | 104,713 | N/A | 1,928 | $17,934,763 | N/A | $208,632 | $171 | N/A | $108 |
| 2012Q1 | 97,629 | N/A | 923 | $18,175,997 | N/A | $135,811 | $186 | N/A | $147 |
| 2012Q2 | 133,020 | N/A | 654 | $26,600,453 | N/A | $104,862 | $200 | N/A | $160 |
| 2012Q3 | 188,359 | N/A | 275 | $40,739,968 | N/A | $38,058 | $216 | N/A | $138 |
| 2012Q4 | 123,955 | N/A | 166 | $28,794,145 | N/A | $18,506 | $232 | N/A | $111 |
| 2013Q1 | 106,488 | 330 | 45 | $26,085,724 | $87,264 | $6,582 | $245 | $264 | $147 |
| 2013Q2 | 143,752 | 1,600 | 225 | $35,201,288 | $398,220 | $38,580 | $245 | $249 | $172 |
| 2013Q3 | 204,504 | 5,498 | 4,152 | $54,343,339 | $1,522,469 | $854,492 | $266 | $277 | $206 |
| 2013Q4 | 137,888 | 5,175 | 4,279 | $39,479,128 | $1,496,035 | $889,239 | $286 | $289 | $208 |
| 2014Q1 | 111,655 | 3,226 | 3,942 | $34,666,016 | $1,069,702 | $938,169 | $310 | $332 | $238 |
| 2014Q2 | 171,956 | 4,869 | 7,273 | $57,247,746 | $1,729,246 | $1,810,741 | $333 | $355 | $249 |
| 2014Q3 | 250,990 | 9,186 | 9,402 | $91,350,556 | $3,601,643 | $2,868,081 | $364 | $392 | $305 |
| 2014Q4 | 163,724 | 5,243 | 7,458 | $62,848,044 | $2,162,877 | $2,045,460 | $384 | $413 | $274 |
| 2015Q1 | 131,610 | 4,465 | 6,886 | $55,133,394 | $1,965,601 | $1,854,181 | $419 | $440 | $269 |
| 2015Q2 | 189,122 | 7,294 | 11,686 | $84,616,159 | $3,246,980 | $3,158,015 | $447 | $445 | $270 |
| Total | 2,586,219 | 46,886 | 80,865 | $720,210,418 | $17,280,036 | $17,174,542 | |||
| NOTE: “N/A“ indicates that Auvi-Q was not on the market during this time. It was voluntarily removed from the market in October 2015, after the period of analysis. SOURCE: CMS State Drug Utilization Data 2011- 2015Q2, NADAC final and draft reference data and CMS Drug Product data used to identify epinephrine auto-injector NDCs. |
|||||||||
Endnotes
Juliette Cubanski, Tricia Neuman, and Anthony Damico, How Much Has Medicare Spent on the EpiPen Since 2007? (Washington DC: Kaiser Family Foundation, September 2016), https://www.kff.org/medicare/issue-brief/how-much-has-medicare-spent-on-the-epipen-since-2007/.
Ibid.
Kaiser Commission on Medicaid and the Uninsured and Urban Institute estimates based on data from FY 2011 MSIS.
This average is calculated per year from 2011 through 2014, as full year data for 2015 was unavailable.
Douglas Throckmorton, Reviewing the Rising Price of EpiPens: Statement of Douglas C. Throckmorton, M.D., Before the Committee on Oversight and Government Reform, September 21, 2016, https://oversight.house.gov/wp-content/uploads/2016/09/2016-09-21-Throckmartin-FDA-Testimony.pdf.
“Generic Epinephrine Injector May Cause Confusion,” accessed October 6, 2016, http://acaai.org/resources/connect/letters-editor/letters-to-web-editor-6.
Carolyn Y. Johnson, “Why EpiPens expire so quickly,” The Washington Post, September 27, 2016, https://www.washingtonpost.com/news/wonk/wp/2016/09/27/why-epipens-expire-so-quickly/.
Ed Silverman, “Mylan price hikes on many other drugs eclipsed EpiPen increases,” Stat News, August 24, 2016, https://www.statnews.com/pharmalot/2016/08/24/mylan-generic-drug-price-hikes/.
CMS State Drug Utilization Data 2011-2015Q2.
Andrew Slavik, Letter from Andrew Slavik to the Honorable Ron Wyden, October 5, 2016, http://www.finance.senate.gov/imo/media/doc/Wyden%20EpiPen%20Medicaid%20Letter%20from%20CMS%2010.5.16.pdf.
Beginning in 2017, generic drug rebates will take inflation into account, as a result of the Bipartisan Budget Act of 2015.
Alissa Mooney DeBoy, “Assuring Medicaid Beneficiaries Access to Hepatitis C (HCV) Drugs,” Medicaid Drug Rebate Program Notice, Release No. 172, CMS, November 5, 2015, https://www.medicaid.gov/Medicaid-CHIP-Program-Information/By-Topics/Benefits/Prescription-Drugs/Downloads/Rx-Releases/State-Releases/state-rel-172.pdf.
K Young, R Rudowitz, R Garfield, M Musumeci, “Medicaid’s Most Costly Outpatient Drugs,” (Washington DC: Kaiser Commission on Medicaid and the Uninsured, July 2016), https://www.kff.org/health-costs/issue-brief/medicaids-most-costly-outpatient-drugs/.


