Quick Look: Antiretroviral Price Increases in Medicare Part D
Key Facts
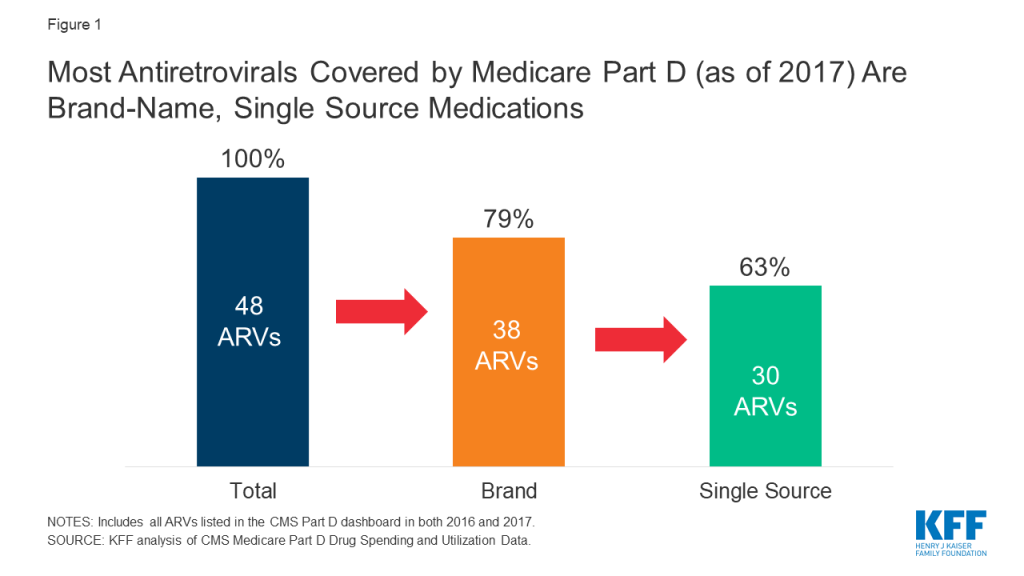
Drug price concerns in the U.S., including for antiretrovirals, the mainstay of HIV treatment and, increasingly prevention, have prompted the introduction of several policy proposals. One proposal would require manufacturers to provide a rebate to Medicare if prices increase faster than inflation. As a drug class, ARVs lack competition in the U.S. market and few generic options are available, leading to particular concerns over their pricing. We assessed list price changes between 2016 and 2017 for ARVs under Medicare Part D, which is required to cover all or substantially all ARVs. During this period, 48 ARVs were covered by Part D, 38 of which were brand medications and 30 were single source.
According to our analysis:
- Almost three quarters (73% or 35 medications) had list price increases that exceeded the inflation rate between July 2016 and July 2017 (1.7%). This compares to 60% of Part D medications overall. Most of these were brand-name medications (32), and the vast majority were single source (27).
- Of the 8 ARVs that had price decreases over the period, all were available as generics.
- ARVs with the highest total Medicare spending and enrollee utilization had price increases exceeding inflation by at least 5 percentage points. All of these were brand name, single source drugs.
These findings suggest that current proposals that seek to control Part D prices relative to inflation could yield savings.
Background
Ongoing concerns about prescription drug pricing and affordability in the United States have prompted the introduction of policy proposals from the White House, members of Congress, and presidential candidates. Some of these proposals would require drug manufacturers to pay a rebate to the federal government if their prices for drugs covered under Medicare Part B and Part D increase by more than the rate of inflation. Indeed, a recent KFF analysis found that list price increases for more than half of Medicare Part D drugs exceeded inflation in 2017, in some cases by a substantial margin, suggesting opportunities for significant savings under these plans.
We used the same methodology to assess price changes for antiretroviral medications (ARVs) under Part D, which is required to cover all or substantially all ARVs as one of six protected drug classes. ARVs are the mainstay of HIV treatment and, increasingly prevention. National treatment guidelines recommend initiating ARV treatment upon an HIV diagnosis; for those at high risk, pre-exposure prophylaxis, or PrEP, with ARVs is recommended to prevent HIV acquisition.
While only a small share of people in the U.S. have HIV or are on PrEP, spending on ARVs has an outsized impact on prescription drug spending across payers. In addition, concerns have been raised about ARV drug pricing and affordability specifically, where list prices for a typical recommended HIV treatment regimen could range from $22,000 to $38,000 per year. High prices are, in part, driven by the lack of manufacturer competition and minimal availability of generic substitutes within the U.S. ARV market, the very types of drugs targeted by several of the prescription drug policy proposals.
To assess changes in the list prices of ARVs covered by Medicare Part D relative to inflation, we used data from the CMS Medicare Part D Spending Dashboard to identify ARVs used in the two most recent years available (2016 and 2017). List price changes were measured by one-year (2016-2017) changes in average spending per dosage unit amounts reported. Our analysis is based on unit prices that do not reflect manufacturer rebates and discounts to plans, which are considered proprietary and therefore not publicly available (the major proposals being considered are not based on post-rebate prices). Inflation was measured over the same period using the Consumer Price Index for all urban consumers (CPI-U), which was 1.7% between 2016 and 2017. A full methodology can be found here.
Findings
The 2019 Medicare Part D Spending Dashboard includes 48 antiretrovirals that were utilized in 2016 and 2017, including both brand and generic drugs (see Table 1). Most ARVs (38 or 79%) were brand medications and almost two-thirds (30 or 63%) were single source, meaning they had no generic alternative (see Figure 1).
Of the 48 ARVs reported in the 2017 Part D dashboard, almost three-quarters (35 drugs or 73%) had list price increases that exceeded inflation between July 2016 and July 2017 (1.7%). This compares to 60% of Part D medications overall. Most of these price increases were more than 3 times the rate of inflation. Almost all drugs with price increases exceeding inflation were brand-name medications (32), and the vast majority were single source (27). Of the remaining ARVs, 10% (or 5 drugs) had list price increases below inflation between 2016 and 2017, and 17% (8 drugs) had price decreases over this period. All 8 of the ARVs with price decreases were available as generics (see Figure 2).

We examined price increases for ARVs with the highest spending and utilization among Part D enrollees. Among the 10 ARVs with the highest Part D spending in 2017, all were brand-name, single source medications, and all had list price increases exceeding inflation by at least 5 percentage points (see Figure 3). For instance, Genvoya, the ARV with the highest Part D spending, had a price increase of 7.4%. Triumeq, the ARV with the second highest spending, had a price increase of 9.6%, nearly six times the rate of inflation. Truvada, used for HIV treatment as well as PrEP, had the fourth highest Part D spending, and a list price increase of 7.5%. Until 2019, Truvada was the only ARV approved for PrEP.

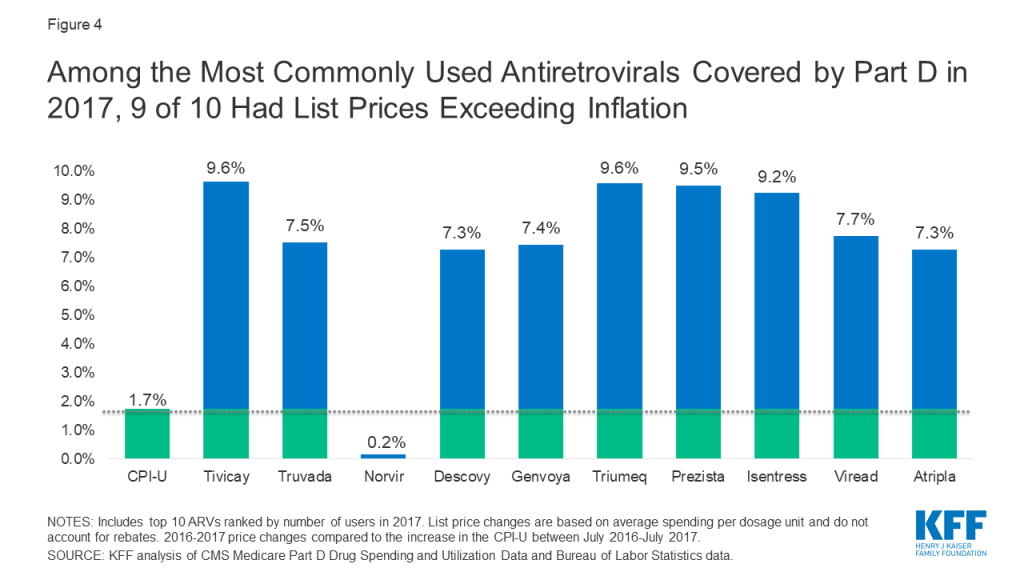
Among the top 10 most commonly used ARVs, 9 had list price increases exceeding inflation by at least 5 percentage points and, as with spending, all were brand-name, single source drugs (see Figure 4). The top two most commonly used ARVs – Tivicay and Truvada, each with over 36,000 users in 2017 – had list prices that increased by 9.6% and 7.5%, respectively.
Conclusion
As with Medicare Part D drugs overall, the majority of ARVs had price increases that exceeded the rate of inflation by several percentage points. Moreover, reflecting the lack of competition within the U.S. ARV market, most of these were brand-name, single source medications, including those with the highest spending and greatest utilization, the very types of medications targeted by current policy proposals. These findings suggest that such proposals could yield savings for public and private payers and for patients. However, proposals that place limits on year-to-year drug price increases may incentivize manufactures to introduce newer medications at higher prices. This could present particular challenges in the case of HIV, where several newer treatment and prevention regimens are on the near-term horizon.
| Table 1: List Price Changes Between 2016-2017 for ARVs by Total Medicare Part D Spending in 2017 | |||
| Drug Name | Total Part D Spending in 2017 | Number of Users in 2017 | 2016-2017 List Price Change |
| Genvoya | $689,941,011.34 | 28,632 | 7.4% |
| Triumeq | $650,941,450.22 | 27,561 | 9.6% |
| Tivicay | $518,431,674.93 | 36,611 | 9.6% |
| Truvada | $416,800,910.94 | 36,552 | 7.5% |
| Atripla | $415,313,758.64 | 18,148 | 7.3% |
| Descovy | $404,070,231.27 | 31,533 | 7.3% |
| Prezista | $350,738,609.34 | 27,211 | 9.5% |
| Isentress | $320,942,015.53 | 25,667 | 9.2% |
| Odefsey | $228,725,946.87 | 10,664 | 7.2% |
| Prezcobix | $223,824,222.87 | 16,153 | 9.0% |
| Stribild | $171,008,928.08 | 7,411 | 8.4% |
| Viread | $166,748,054.55 | 20,409 | 7.7% |
| Reyataz | $145,194,479.40 | 11,682 | 6.6% |
| Complera | $109,054,960.06 | 5,263 | 8.3% |
| Norvir | $100,716,172.19 | 35,212 | 0.2% |
| Intelence | $99,729,416.45 | 9,108 | 10.2% |
| Sustiva | $57,430,302.28 | 6,195 | 7.5% |
| Selzentry | $49,645,406.08 | 3,282 | 9.4% |
| Kaletra | $38,421,347.87 | 4,721 | 7.1% |
| Abacavir-Lamivudine | $36,163,620.28 | 9,471 | -30.2% |
| Edurant | $33,470,096.30 | 3,957 | 9.1% |
| Evotaz | $32,508,946.37 | 2,426 | 7.4% |
| Epzicom | $26,139,505.74 | 4,150 | -2.0% |
| Lexiva | $17,792,125.43 | 1,541 | 9.1% |
| Abacavir | $16,159,350.36 | 8,022 | -5.8% |
| Lamivudine | $12,136,669.35 | 9,734 | -7.3% |
| Abacavir-Lamivudine-Zidovudine | $10,164,840.09 | 973 | 3.2% |
| Emtriva | $9,769,395.38 | 2,828 | 0.2% |
| Lamivudine-Zidovudine | $8,943,870.54 | 4,035 | -20.1% |
| Nevirapine ER | $8,783,702.01 | 2,042 | -10.1% |
| Viracept | $7,356,137.42 | 799 | 8.9% |
| Fuzeon | $5,917,901.94 | 198 | 6.5% |
| Invirase | $3,824,859.01 | 350 | 6.6% |
| Aptivus | $2,780,380.01 | 196 | 7.8% |
| Combivir | $1,129,748.72 | 165 | 2.0% |
| Nevirapine | $956,975.66 | 2,585 | 1.4% |
| Didanosine | $885,882.06 | 522 | 10.8% |
| Ziagen | $861,764.65 | 331 | -6.5% |
| Trizivir | $799,844.30 | 94 | 3.6% |
| Viramune XR | $757,400.11 | 212 | 7.3% |
| Zidovudine | $562,555.68 | 1,857 | -0.5% |
| Crixivan | $510,444.65 | 145 | 0.2% |
| Epivir | $437,552.20 | 466 | 58.3% |
| Viramune | $437,525.85 | 86 | 5.4% |
| Stavudine | $310,975.88 | 531 | 7.0% |
| Tybost | $182,986.76 | 163 | 6.7% |
| Rescriptor | $104,025.14 | 24 | 7.3% |
| Videx EC | $8,506.46 | — | 0.6% |
| NOTE: List price changes are based on average spending per dosage unit and do not account for rebates. – indicates data not available due to small sample size.SOURCE: KFF analysis of CMS Medicare Part D Drug Spending and Utilization Data, 2016-2017. | |||