Kaiser Health Tracking Poll: November 2014
Kaiser Health Tracking Poll: November 2014 Findings
The latest Kaiser Health Tracking Poll finds that just prior to the Affordable Care Act (ACA) open enrollment beginning this past Saturday, the uninsured remained largely unaware of its start, although about half of the uninsured expect to get health insurance in the next few months and seven in ten say that health insurance is something they need. Opinion on the law remains similar to past months – 46 percent say they have an unfavorable view of the law and 37 percent say they have a favorable view. Americans are divided as to what Congress should do next on the law – 29 percent say they support repealing the law entirely, 17 percent say they support scaling back what the law does, 20 percent support moving ahead with the law as is, and 22 percent feel that the law should be expanded. But like opinion on the law overall, partisans fall on opposite ends of the spectrum. The public has no expectation that debate on the ACA will die down soon; a finding that Democrats and Republicans agree on. Most say that now that the midterm elections are over the amount of partisan debate will increase or stay about the same. Finally, on the heels of the midterm elections, few voters (9 percent) named health care as one of the two most important factors in their vote, ranking 5th behind partisan control of Congress (27 percent), a candidate’s platform (18 percent), the economy and jobs (17 percent), dissatisfaction with government (16 percent) and similar to a candidate’s personal characteristics (9 percent).
The Uninsured And Open Enrollment Round Two
Many Uninsured Are Unaware Of Open Enrollment Period
As the second open enrollment period under the Affordable Care Act (ACA) began this month, the uninsured remained largely unaware of the renewed opportunity to purchase or enroll in health insurance. Similar to last month, about 9 in 10 (89 percent) are unsure of when open enrollment starts, including about three quarters (77 percent) who say they don’t know and 12 percent who gave an answer other than November 2014.

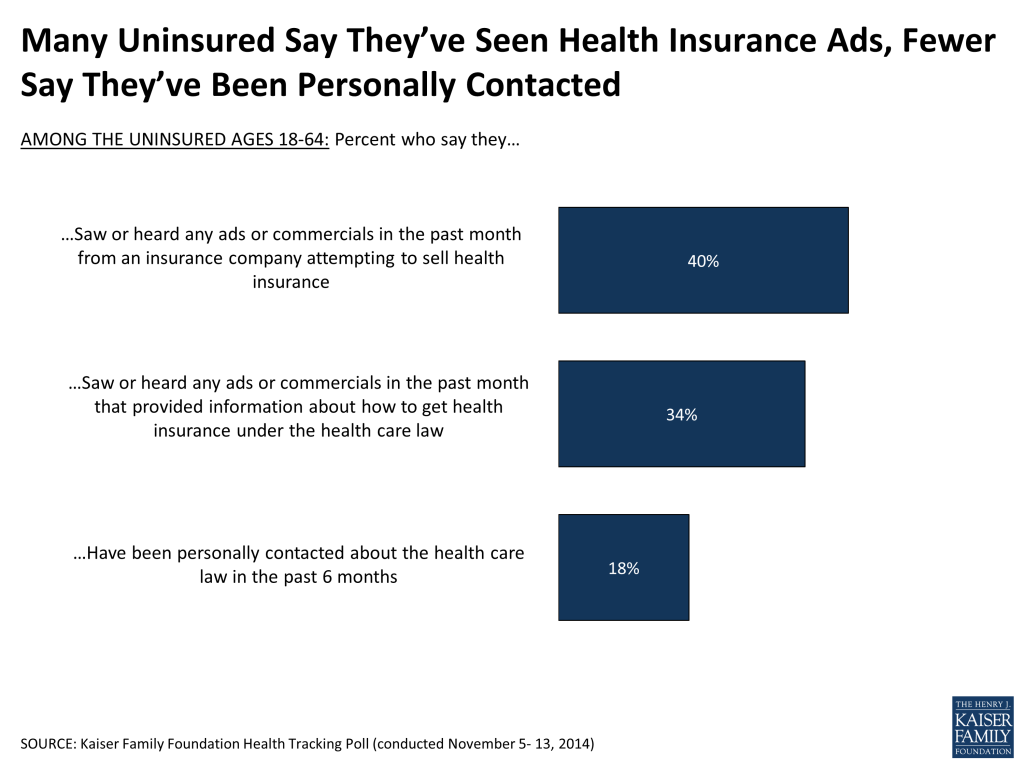
Visibility Of Outreach And Advertising
At this early point in the open enrollment season, about 1 in 5 uninsured (18 percent) say they have been personally contacted in the last six months about the health care law.
Many more uninsured, however, report seeing advertising about how to enroll in health coverage or health insurance products more generally. Four in 10 (40 percent) of the uninsured say they have recently seen or heard an ad from an insurer about health insurance. About a third (34 percent) of the uninsured say they have seen or heard an ad in the past month that provided information about how to get insurance under the health care law. These shares are similar to reports among the uninsured in the October tracking poll.
Plans To Get Coverage
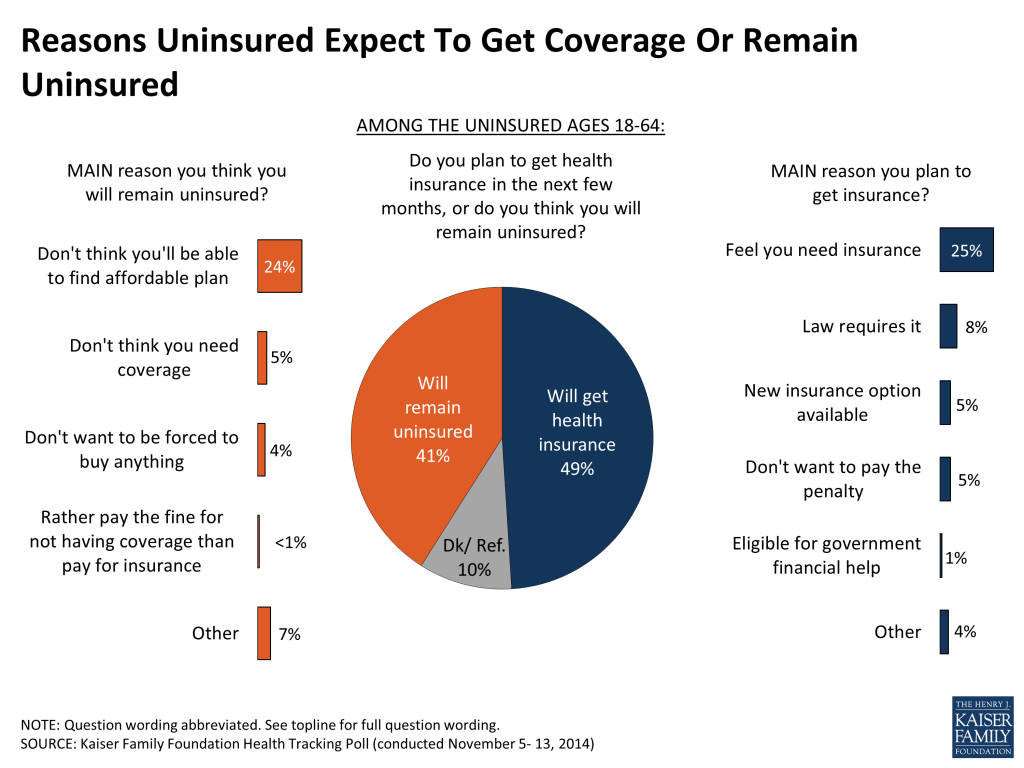
Looking ahead, the uninsured are divided on whether they plan on getting insurance in the next few months — 49 percent say they think they will obtain coverage and 41 percent say they think they will remain uninsured while 10 percent aren’t sure. The most common reason the uninsured say they will obtain health insurance is because they feel it is something they need (25 percent among all uninsured), while many fewer say that the law’s requirement to have health insurance (8 percent) or the penalty for not having coverage (5 percent) is the main factor. Those who expect to remain uninsured are most likely to say the main reason they won’t get insurance is because they don’t think they will be able to find an affordable plan (24 percent among all uninsured).
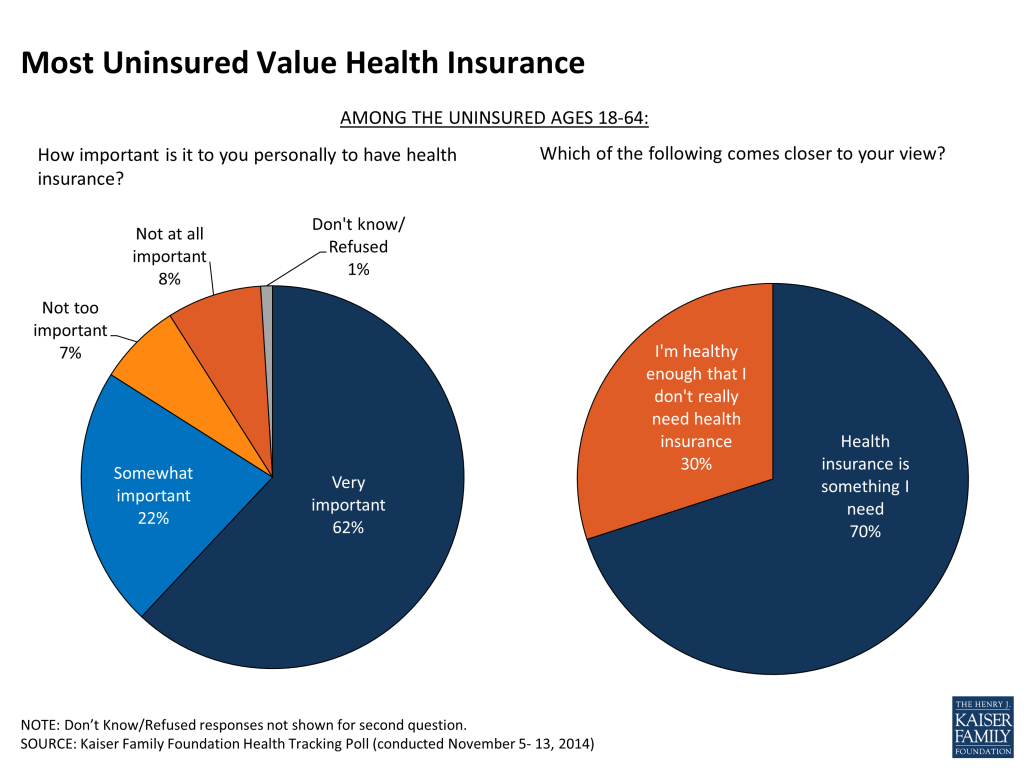
Uninsured Value Insurance
While the uninsured are split on whether they will get health insurance in the next few months, large majorities of the uninsured say that having health insurance is important to them and is something they need. More than 8 in 10 (84 percent) of the uninsured say that it is at least “somewhat important” to them to have health insurance, including over 6 in 10 (62 percent) who say it is “very important.” And, 7 in 10 (70 percent) of the uninsured say health insurance is something they need; more than twice the share who chose “I’m healthy enough that I don’t really need health insurance.”
Who Are The Uninsured?
Characteristics common among the uninsured can often make this group difficult to reach and enroll in health insurance. About 4 in 10 (38 percent) of the uninsured are under age 30 and 63 percent report family income of less than $30,000 a year. Many (59 percent) say they have been uninsured for 2 years or more and about 3 in 10 (29 percent) report being in only “fair” or “poor” health. In addition, a third (33 percent) identify as Hispanic and 15 percent chose to take the survey in Spanish.
Overall ACA Opinion
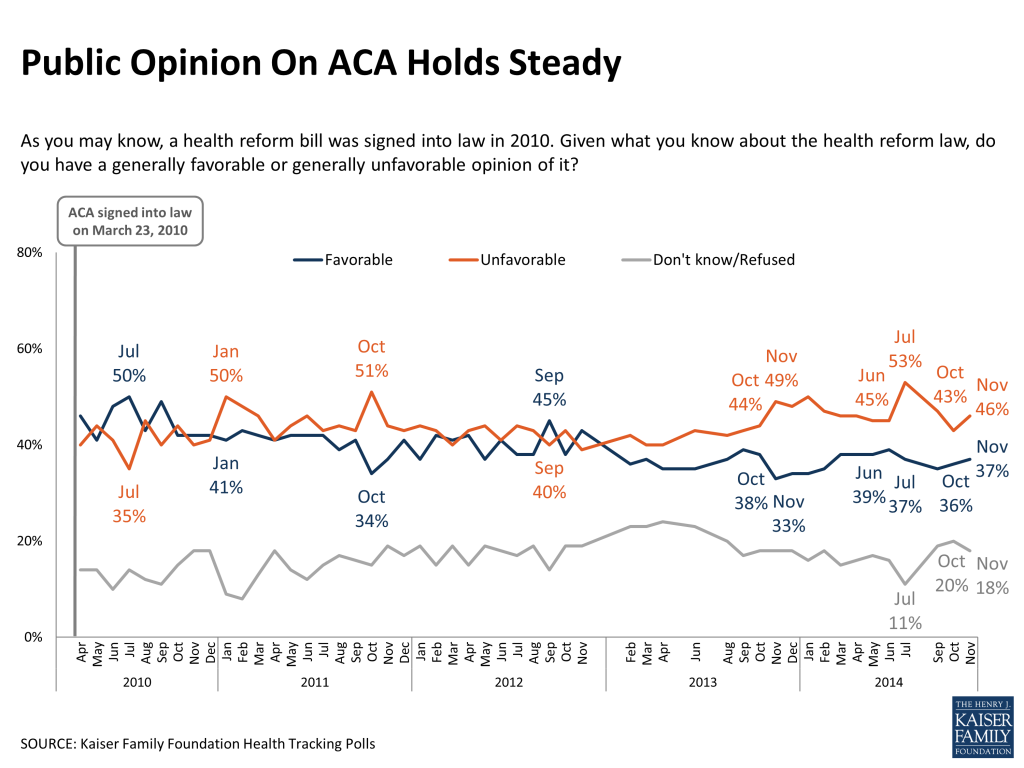
Opinion On ACA Remains Steady
Opinion on the law continues to tilt negative. Forty-six percent say they have a negative view of the law and 37 percent report a favorable view, similar to last month. Opinion continues to be closely tied to partisanship with about three-quarters (74 percent) of Republicans reporting an unfavorable view of the law, including just over half (53 percent) who say they have a very unfavorable opinion, compared to two-thirds (67 percent) of Democrats reporting a favorable view of the law. Independents fall in the middle, but tilt more negative toward the law.
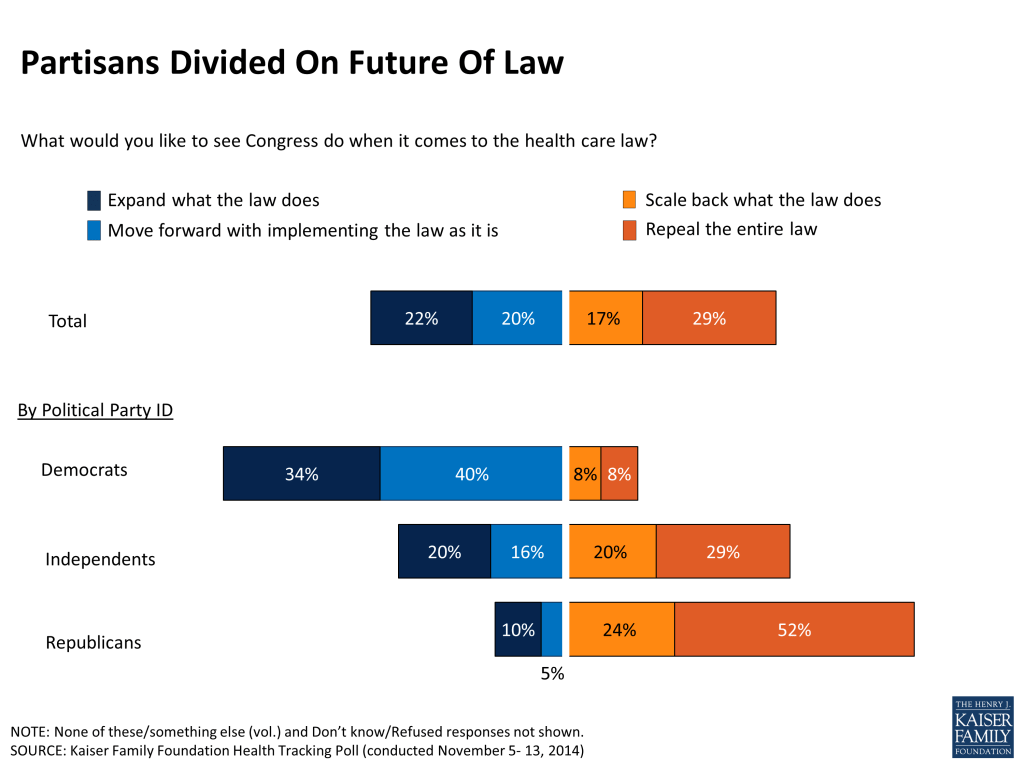
The Public Is Divided On Future Of Law
Americans express a variety of opinions about what Congress should do next when it comes to the health care law. About 3 in 10 (29 percent) say they’d like Congress to repeal it outright and another 17 percent say they support scaling the law back. In addition, about 1 in 5 each support moving ahead with the law as is (20 percent) and expanding the law (22 percent).
But like opinion of the law overall, views on what should come next vary greatly across party. At opposite ends of the debate are Democrats with a third (34 percent) saying they support expanding what the law does and Republicans with about half (52 percent) saying they favor repealing the law entirely. Independents have more mixed views, but still 2 in 10 (20 percent) say they want it expanded while about 3 in 10 (29 percent) say they want the law repealed entirely.
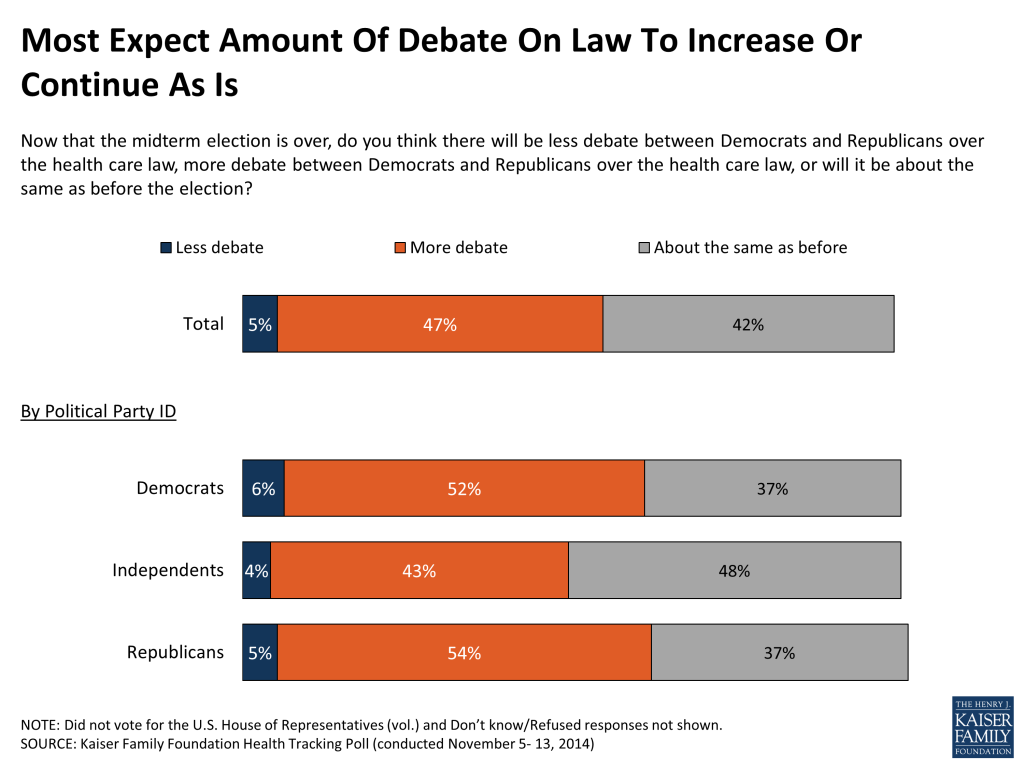
Most Expect Debate About Law To Increase Or Hold Steady
Now that the midterm election is over, about half (47 percent) of the general public expects there will be more debate between Republicans and Democrats over the health care law, about 4 in 10 (42 percent) say the amount of debate will be about the same as before the election, and very few (5 percent) say it will decrease. Democrats and Republicans agree that they expect more debate over the law (52 percent of Democrats and 54 percent of Republicans).
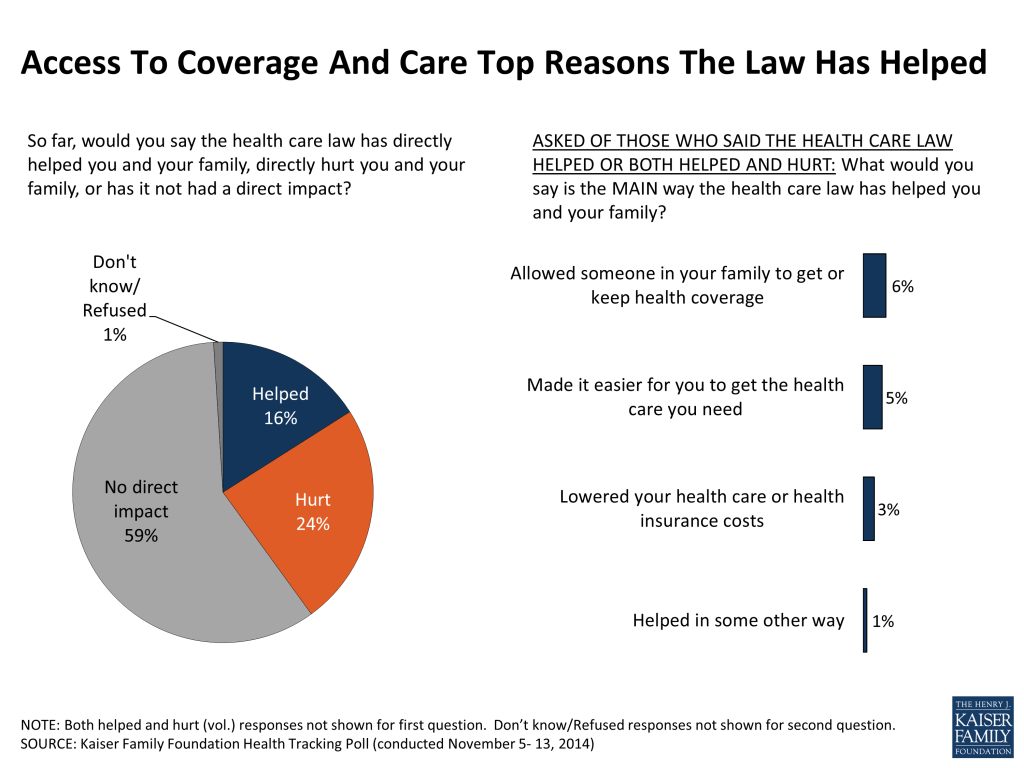
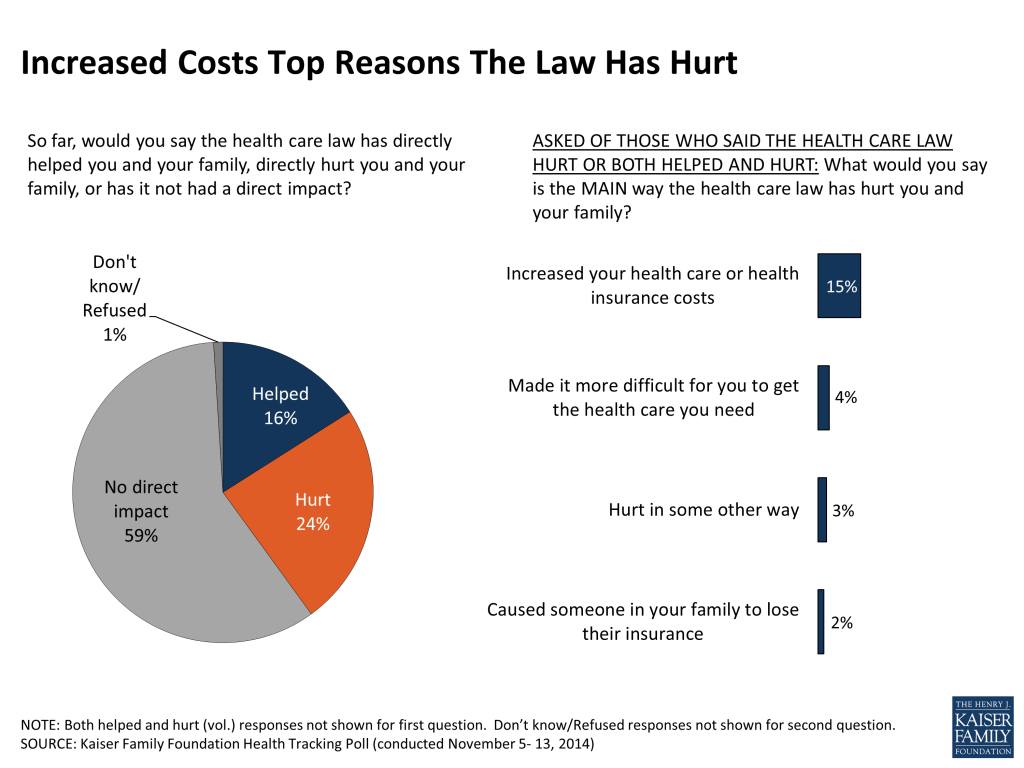
Views Of Personal Impact Divided By Party
Most of the general public (59 percent) reports that their families haven’t been directly impacted by the health care law. For those who say they have been impacted, more say they have been hurt by the law than say they have been helped (24 percent vs. 16 percent). Republicans are more likely to say they have been hurt by the law (42 percent) while Democrats are more likely to say they have been helped (30 percent). Independents fall in the middle but more say they have been hurt than helped (22 percent vs. 12 percent).

Most of those who report having been helped by the law say it allowed someone in their family to get or keep health coverage (6 percent), made it easier to get the health care they need (5 percent), or lowered their health care costs (3 percent).
On the other hand, 15 percent say they have been hurt by the law because it increased their health care or health insurance costs. Others say it made it more difficult to get the health care they need (4 percent) or caused someone in their family to lose their health insurance (2 percent).
ACA And The 2014 Midterm Election
ACA Was Not A Top Issue To Voters In 2014 Midterm Election
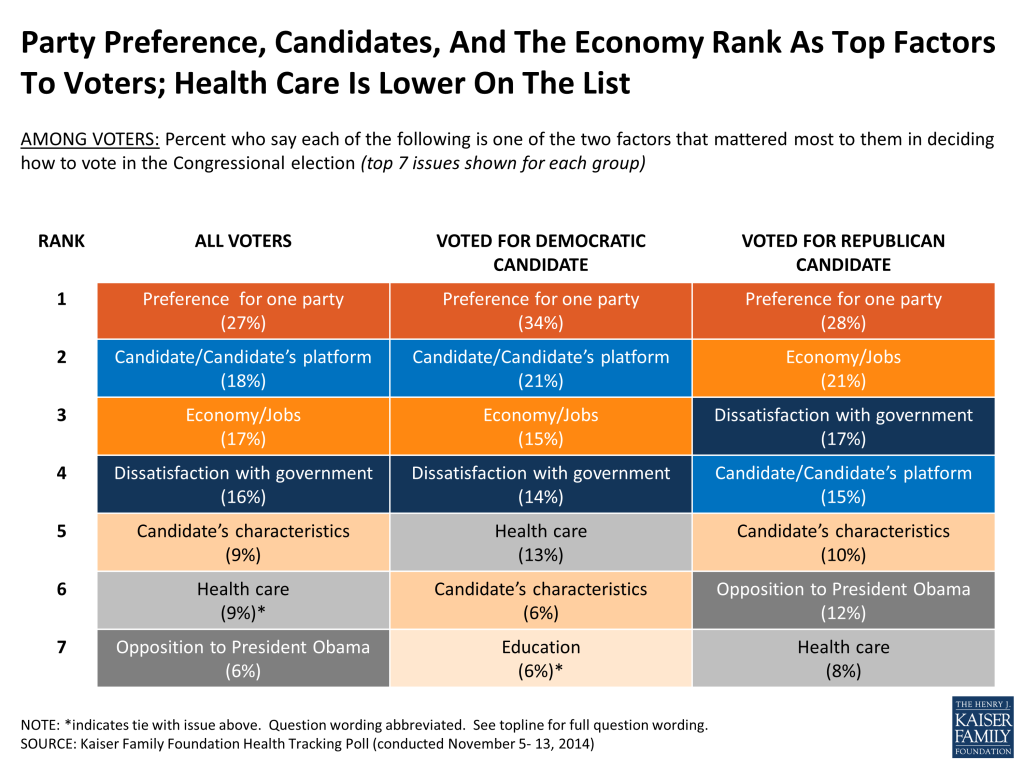
When asked to name in their own words what the two most important factors were in their vote for Congress, party loyalty rises to the top. About a quarter (27 percent) of voters responded that what mattered most to them was voting for their preferred party and party control in the House and Senate. After party loyalty, similar shares named factors such as a candidate’s platform or track record (18 percent), the economy and jobs (17 percent), dissatisfaction with government (16 percent). Further down the list was health care with 9 percent of voters naming it as an important factor in their vote, including 6 percent who specifically referenced the Affordable Care Act.
Similar shares of people who voted for the Democratic candidate and those who voted for the Republican candidate mentioned health care as one of their two top voting issues (13 percent and 8 percent, respectively). Five percent of voters who report choosing the Republican candidate specifically mentioned opposition to the ACA, while 3 percent of Democratic voters specially referred to the ACA in a positive way.
Those who feel their families have personally benefited from the law are more likely to say health care was a major factor in their vote – 1 in 5 voters compared to 7 percent of those voters who say they have been hurt by the law or haven’t been impacted.
Kaiser Health Tracking Poll: November 2014 Methodology
This Kaiser Health Tracking Poll was designed and analyzed by public opinion researchers at the Kaiser Family Foundation (KFF). The survey was conducted November 5-13, 2014, among a nationally representative random digit dial telephone sample of 1,501 adults ages 18 and older, living in the United States, including Alaska and Hawaii (note: persons without a telephone could not be included in the random selection process). Computer-assisted telephone interviews conducted by landline (751) and cell phone (750, including 456 who had no landline telephone) were carried out in English and Spanish by Princeton Data Source under the direction of Princeton Survey Research Associates International (PSRAI). Both the random digit dial landline and cell phone samples were provided by Survey Sampling International, LLC. For the landline sample, respondents were selected by asking for the youngest adult male or female currently at home based on a random rotation. If no one of that gender was available, interviewers asked to speak with the youngest adult of the opposite gender. For the cell phone sample, interviews were conducted with the adult who answered the phone. KFF paid for all costs associated with the survey.
The combined landline and cell phone sample was weighted to balance the sample demographics to match estimates for the national population using data from the Census Bureau’s 2012 American Community Survey (ACS) on sex, age, education, race, Hispanic origin, nativity (for Hispanics only), and region along with data from the 2010 Census on population density. The sample was also weighted to match current patterns of telephone use using data from the July-December 2013 National Health Interview Survey. The weight takes into account the fact that respondents with both a landline and cell phone have a higher probability of selection in the combined sample and also adjusts for the household size for the landline sample. All statistical tests of significance account for the effect of weighting.
The margin of sampling error including the design effect for the full sample is plus or minus 3 percentage points. Numbers of respondents and margin of sampling error for key subgroups are shown in the table below. For results based on other subgroups, the margin of sampling error may be higher. Sample sizes and margin of sampling errors for other subgroups are available by request. Note that sampling error is only one of many potential sources of error in this or any other public opinion poll. Kaiser Family Foundation public opinion and survey research is a charter member of the Transparency Initiative of the American Association for Public Opinion Research.
| Group | N (unweighted) | M.O.S.E. |
| Total | 1,501 | ±3 percentage points |
| Party Identification | ||
| Democrats | 434 | ±6 percentage points |
| Republicans | 441 | ±6 percentage points |
| Independents | 452 | ±5 percentage points |
| Insurance Status | ||
| Uninsured, ages 18-64 | 154 | ±9 percentage points |
| Insured, ages 18-64 | 867 | ±4 percentage points |
| Voters | ||
| All voters | 953 | ±4 percentage points |
| Voted for Democratic Candidate | 381 | ±6 percentage points |
| Voted for Republican Candidate | 456 | ±6 percentage points |