The Wisconsin Health Care Landscape
Wisconsin has long been a leader among states in expanding coverage to its low-income residents since even before the major coverage provisions of the Affordable Care Act (ACA) took effect on January 1, 2014. While Governor Scott Walker decided not to adopt the Medicaid expansion, thousands of previously uninsured Wisconsinites have enrolled in health coverage through the state’s broad BadgerCare Medicaid waiver, which increases coverage to low-income populations, and through the new Health Insurance Marketplace. This fact sheet provides an overview of population health, health coverage, and the health care delivery system in Wisconsin in the era of health reform.
Demographics
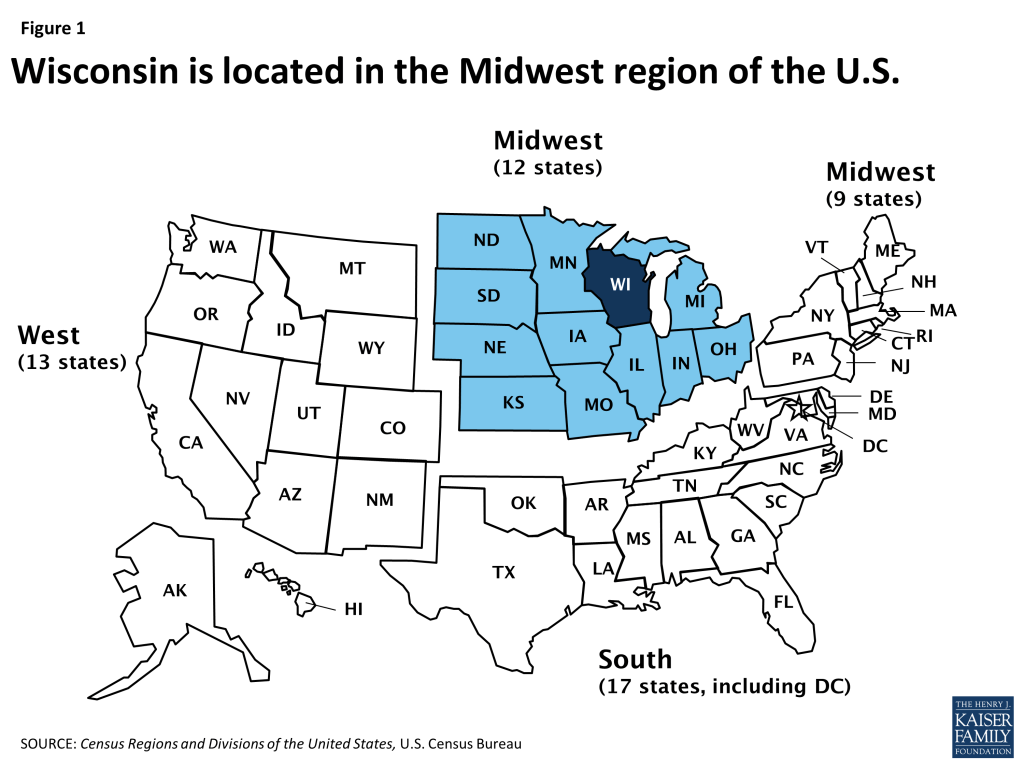
Wisconsin is home to over 5.6 million people, making it the 20th most populous state in the U.S.1 Encompassing just over 54,000 square miles, Wisconsin is the 25th largest state in geographic terms.2 Wisconsin is bordered by four states and is one of 12 states located in the country’s Midwest region (Figure 1).3 Wisconsin’s topography is mostly flat, with hills rolling along the western third of the state.4 On the east and north, the state is bordered by two of the Great Lakes: Lake Michigan and Lake Superior. The western border is defined by the St. Croix and Mississippi Rivers.
Much of Wisconsin is rural, but the majority of the population lives in metropolitan areas. Among the state’s 72 counties, four (Milwaukee, Dane,5 Waukesha, and Brown) have total populations of 200,000 or more (Appendix, Figure 10).6 A majority (74%) of the state’s population lives in metropolitan areas;7 more than one-third of the state’s total population resides in the four large counties.8
The socio-demographic profile of Wisconsinites varies across the state, but it is generally more homogeneous than in other states in the Midwest and the U.S. overall (Table 1). A larger share of Wisconsinites identify as White compared to the national average (84% versus 62%), while half as many identify as Black (6% in Wisconsin versus 12% nationally) and less than half as many identify as Hispanic (7% in Wisconsin versus 17% nationally). Additionally, there are 11 federally recognized American Indian tribes in Wisconsin, who account for approximately 1% of Wisconsin’s population.9 One in four Wisconsin residents are children; nearly all (97%) are U.S.-born citizens. Over one-quarter (28%) of nonelderly adults have at least a college degree and three in four residents live in a household with at least one full-time worker.10
| Table 1: Selected Demographic Characteristics of the Wisconsin Population,Compared to the Midwest and United States Overall, 2013 | |||
| Wisconsin | Midwest | United States | |
| Race/Ethnicity | |||
| White | 84% | 78% | 62% |
| Black | 6% | 10% | 12% |
| Hispanic | 7% | 7% | 17% |
| Other Race/Ethnicity | NSD | 5% | 8% |
| Age | |||
| 0-18 | 25% | 25% | 25% |
| 19-64 | 59% | 60% | 61% |
| 65+ | 16% | 15% | 14% |
| Citizenship Status | |||
| U.S.-Born Citizen | 97% | 93% | 87% |
| Naturalized Citizen | NSD | 3% | 6% |
| Non-Citizen | NSD | 4% | 7% |
| Educational Attainment of Adults (19-64) | |||
| High School Graduate or Less | 38% | 41% | 41% |
| Some College/Assoc. Degree | 34% | 31% | 29% |
| College Grad or Greater | 28% | 28% | 30% |
| Employment Characteristics of Nonelderly | |||
| Households with at Least 1 Full-time Worker | 75% | 74% | 73% |
| NOTE: Data may not sum to 100% due to rounding and data restrictions.SOURCE: Kaiser Family Foundation estimates based on the Census Bureau’s March 2014 Current Population Survey (CPS: Annual Social and Economic Supplement). | |||
Milwaukee County is more racially/ethnically diverse than other parts of Wisconsin. For example, over a quarter (26%) of Milwaukee County’s residents identifies as Black, versus 6% across the state. Additionally, the majority of the black population in Wisconsin is concentrated in Milwaukee. Almost three-quarters (71%) Wisconsin residents who identify as Black reside in Milwaukee County.11 At the same time, about one in ten of Milwaukee County’s residents identify as Hispanic, compared to 7% statewide, and approximately a third (37%) of the state’s residents who identify has Hispanic live in Milwaukee County.
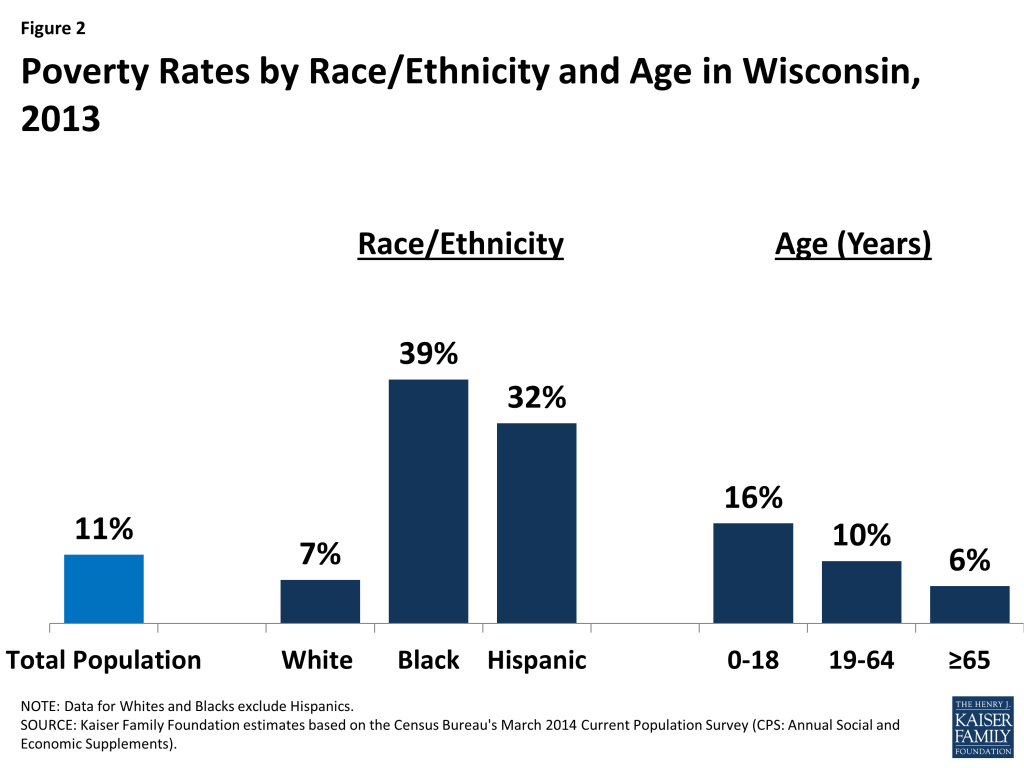
While the overall share of Wisconsinites living in poverty is slightly lower than the national average (11% vs. 15%), Wisconsin has wide disparities in poverty rates by race/ethnicity and age. In Wisconsin, Blacks are more than five times as likely and Hispanics are more than four times as likely as Whites to be poor (Figure 2). As in most other states, children in Wisconsin are also substantially more likely than adults to live in a poor household. As of 2013, one in six (16%) Wisconsin children under age 19 were living in poverty, compared to one in ten nonelderly adults (10%) and 6% of individuals age 65 and over.12
State Economy
Wisconsin’s economy continues to recover after the recession. As of August 2015, Wisconsin had a lower unemployment rate (4.5%) than the national average (5.1%).13 In 2014, Wisconsin’s total Gross Domestic Product (GDP) was $293 billion, making it the 20th largest state economy in the country.14 Wisconsin’s GDP increased 2.9% between 2013 and 2014, less than national average GDP growth (3.9%) during the same time period.15 The health care and social assistance sectors are major contributors to the state economy, accounting for around four percent of the total increase in GDP between 2013 and 2014.16 Other major private industries in Wisconsin include manufacturing and real estate.17
Population Health
Wisconsin ranks above the national average in key measures of state population health. Wisconsin ranks 23rd among the 50 states in the United Health Care Foundation’s report, America’s Health Rankings 2014.18 In the Commonwealth Fund rankings of state health system performance, Wisconsin moved up from 9th to 7th place between 2009 and 2014.19 According to the CDC, heart diseases, diabetes, and homicide death rates in Wisconsin are below national averages.20 However, Wisconsin has higher death rates for Parkinson’s disease and alcohol-induced causes.21 Wisconsin has among the lowest teen pregnancy rates in the country. Teen pregnancy has been decreasing steadily, and the rate is almost half of what it was two decades ago.22
Disparities in health and health care access exist in Wisconsin. As in other states across the country, measures of health status in Wisconsin vary by race/ethnicity, and the patterns of variation are similar to those observed at the national level (Table 2, on the next page). Almost one-third (31%) of Black residents report being in fair or poor general health, compared to 14% of those who identify as White. Over four in ten (43%) Hispanics and about half (51%)of Blacks report having frequent mental distress, compared to one-third (34%) of Whites. Additionally, Blacks are more likely to smoke (31%) and have diabetes (15%) than Whites (18% and 9%, respectively). Disparities in access to care also exist in Wisconsin. As is the case nationally, Blacks in Wisconsin are more likely than Whites to report having no usual source of care (26% versus 17%). However, Whites in the state are more likely than Blacks not to have had a doctor visit in the past two years (17% versus 10%).
| Table 2: Selected Measures of Health Status and Health Access by Race/Ethnicity in Wisconsin Compared to the United States, 2013 | ||||||
| Share reporting that they: | Wisconsin | United States | ||||
| White | Black | Hispanic | White | Black | Hispanic | |
| Have fair or poor general health | 14% | 31% | NSD | 16% | 23% | 27% |
| Are overweight or obese | 67% | 76% | 67% | 63% | 73% | 68% |
| Smoke | 18% | 31% | NSD | 19% | 20% | 14% |
| Have frequent mental distress | 34% | 51% | 44% | 33% | 36% | 34% |
| Have no usual source of care | 17% | 26% | NSD | 18% | 26% | 41% |
| Have not had a checkup in the past 2 years | 17% | 10% | NSD | 17% | 11% | 22% |
| Have diabetes | 9% | 15% | NSD | 10% | 15% | 13% |
| Data may not sum to 100% due to rounding and data restrictions. Data for Whites and Blacks exclude Hispanics.SOURCE: KCMU analysis of the Centers for Disease Control and Prevention (CDC)’s Behavioral Risk Factor Surveillance System (BRFSS) 2014 Survey Results. | ||||||
The infant mortality rate within the state also varies by race/ethnicity. The number of deaths per 1,000 live births for Black infants in Wisconsin is more than double that for either White or Hispanic infants (13.9 for Blacks versus 5.3 for Whites and 5.6 for Hispanics). Additionally, while the infant mortality rates for Whites and Hispanics in Wisconsin are almost identical to the national rates, the infant mortality rate for Blacks is higher in Wisconsin than in the nation overall (13.9 versus 12.2 deaths per 1,000 live births).23
Geographic disparities in health and health care access also exist across the state. A report by the Wisconsin Center for Health Equity gave lower grades for overall health to Wisconsinites living in rural communities and large urban communities, such as Milwaukee County, than to those living in suburbs or small cities.24 Large urban communities have higher death rates and higher rates of “unhealthy days” than rural or small and suburban communities. 25
State and local efforts are underway to address health disparities in Wisconsin. The Wisconsin Department of Health Services (DHS) includes a Minority Health Program that aims to improve the health of vulnerable populations in Wisconsin by providing state-level leadership on policy measures and aligning efforts to address health disparities across state agencies. The program serves communities directly through a number of activities, including administering community grants (since 2006), running the minority public health information campaign, publishing the Minority Health Reports, and supporting the Minority Health Leadership Council.26 Between April 2011 and April 2012, the state also convened the Health Disparities Task Force to discuss how to coordinate efforts to reduce health disparities across DHS. Educational institutions in the state are also working to understand health disparities throughout Wisconsin. For example, the University of Wisconsin Population Health Institute’s (UWPHI) Making Wisconsin the Healthiest State project identifies disparities in health outcomes, health behaviors, and clinical care by gender, race/ethnicity, geography, and socioeconomic status. The disparities that are identified provide a basis for developing targeted interventions.27
Health Coverage in Wisconsin Prior to the ACA
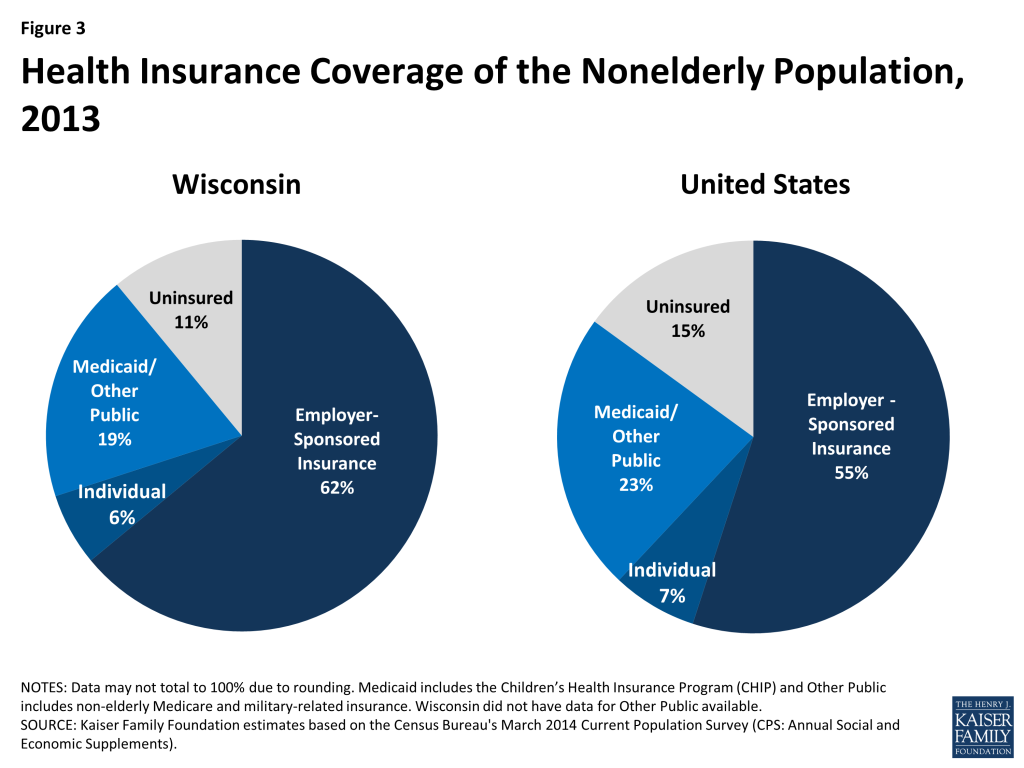
In 2013, prior to the implementation of the ACA, the majority (87%) of Wisconsinites had health insurance. The insured population includes about six in 10 (62%) with employer-sponsored insurance (ESI), nearly 20% enrolled in Medicaid or the Children’s Health Insurance Program (CHIP), and six percent purchasing coverage directly (Figure 3).
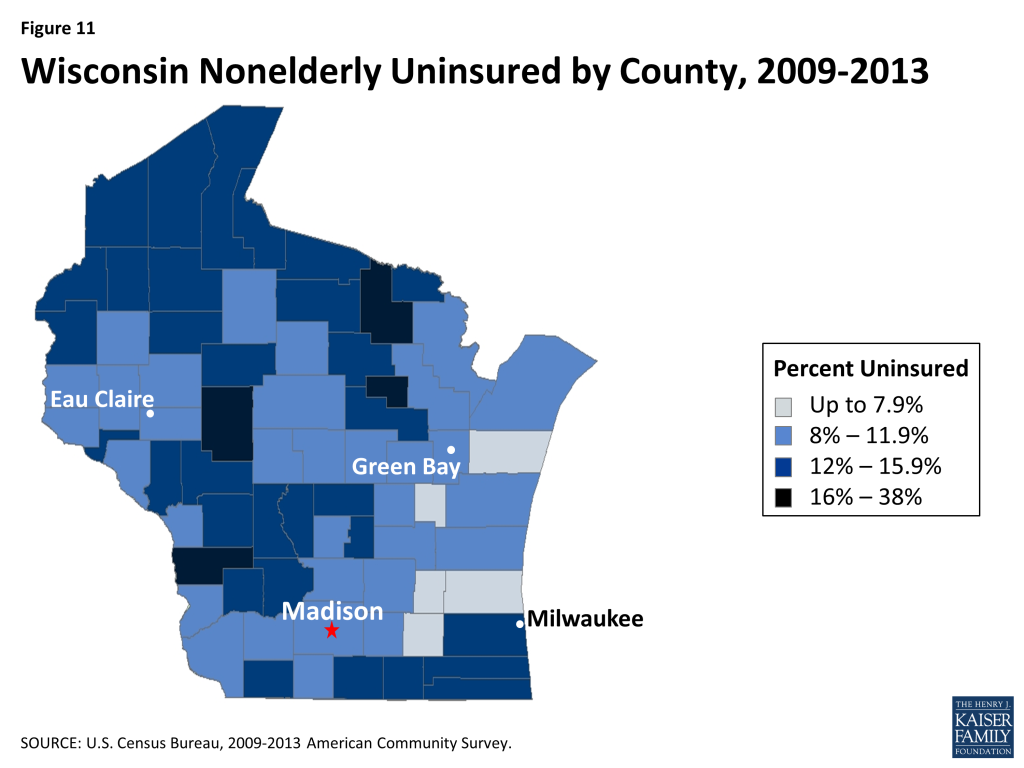
Prior to the implementation of the ACA, 11% of nonelderly adults and children in Wisconsin – more than half a million people – were uninsured (Figure 3).28 This uninsured rate was lower than the national average uninsured rate of 15% (which reflects state uninsured rates ranging from 4% in Massachusetts to 23% in Nevada and Texas). As shown in Figure 11 (Appendix), the nonelderly uninsured population in Wisconsin was unevenly distributed across the state’s counties. Individuals with lower incomes were also more likely to lack coverage than those with higher income – the uninsured rate among nonelderly individuals was 20% among those with income below 100%FPL, but 5% among those with income of 400%FPL or more. As in other states, uninsured rates in Wisconsin varied by family work status, with nonelderly individuals in families without a full-time worker more likely to be uninsured than those in families with a full-time worker. Hispanics were also more like to be uninsured (17%) than either Whites (9%) or Blacks (11%) (Figure 4).29

Medicaid and CHIP help to fill gaps in access to private coverage. Since 1999, Wisconsin’s Medicaid program has been shaped by a Medicaid Section 1115 waiver called BadgerCare, which provides a health coverage safety-net for low-income families transitioning from welfare to work.30 In 2008, BadgerCare Plus was created to expand Medicaid coverage to all uninsured children (through age 18), pregnant women with incomes below 300% FPL, and parents and caretaker relatives with incomes below 200% FPL. In 2009, childless adults with incomes below 200% FPL were added, but enrollment was capped and a wait list was established, and this population was provided with a more limited benefit plan called the BadgerCare Plus Core Plan. In 2012, the state imposed monthly premiums on parents and caretakers with incomes above 133% FPL. Although Wisconsin expanded coverage for low-income parents and other adults, the program still plays a larger role for children than adults. As of 2013, almost one-third of Wisconsin children (32%) were enrolled in Medicaid or CHIP, compared to one in ten nonelderly adults (10%).31

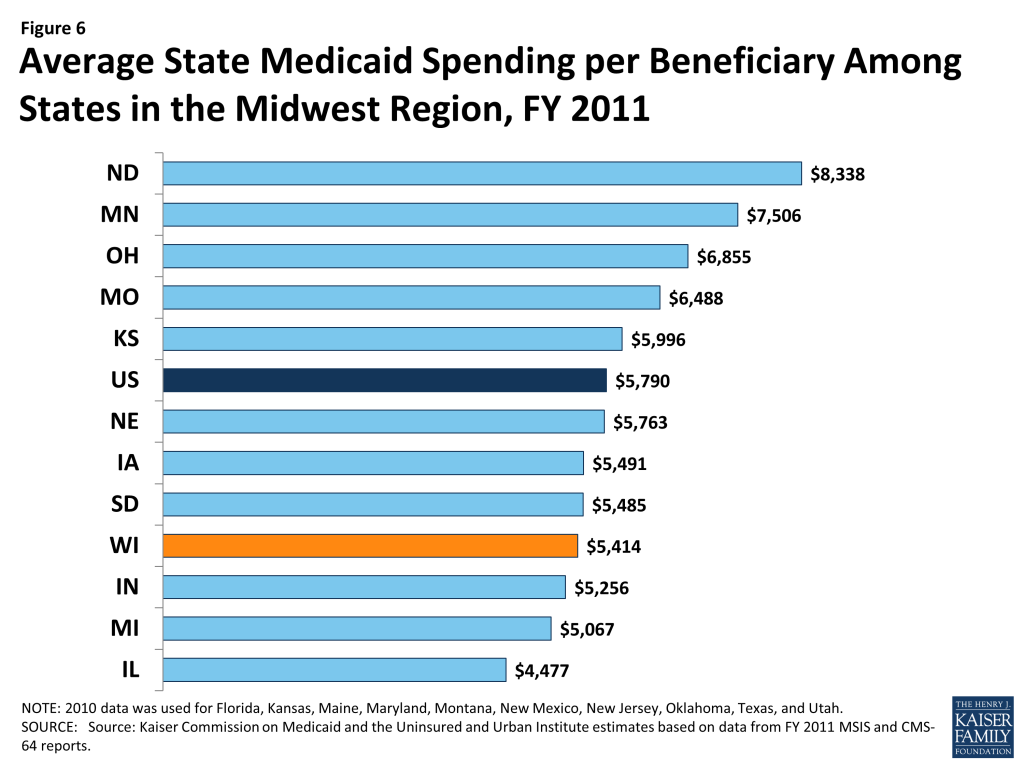
While a majority of Medicaid enrollees in Wisconsin are children and non-elderly adults, the elderly and people with disabilities account for most of the expenditures in the program. As of Fiscal Year 2011, children made up 40% of Medicaid enrollees in Wisconsin, but accounted for about one-tenth (12%) of total Medicaid expenditures (Figure 5).32 In contrast, the elderly and people with disabilities accounted for one-quarter (25%) of enrollees, but 70% of total program expenditures. Average spending per beneficiary in Wisconsin was $5,414, the fourth lowest in the Midwest and lower than the national average of $5,790 (Figure 6).33
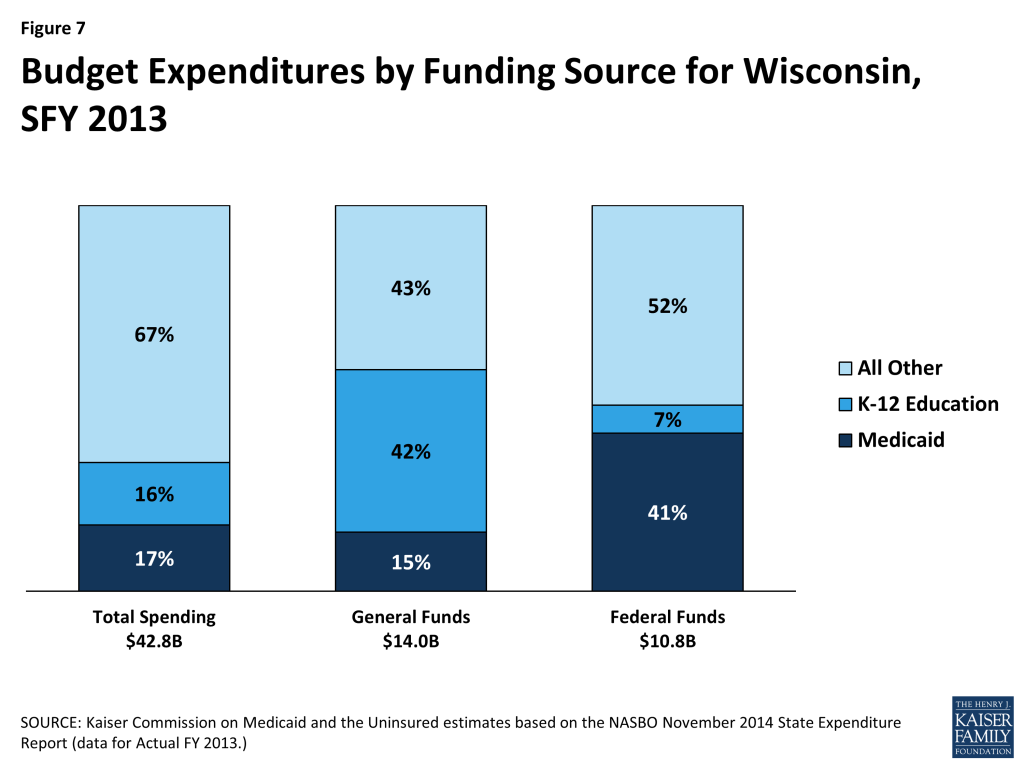
Medicaid costs are shared by the state and the federal government, with the federal government paying more than half (60%) of the cost of Wisconsin Medicaid. For every dollar that Wisconsin spends on Medicaid, the federal government sends $1.39 in matching funds to the state.34 Medicaid spending accounted for 17% of total state spending in SFY 2013, 15% of state general fund spending, and 41% of all federal funds spent by the state (Figure 7).35 Medicaid is the second largest category of state general fund spending behind elementary and secondary education, but it is the single largest source of federal funds flowing into the state.36
The Affordable Care Act in Wisconsin
As implemented in 2014, a main goal of the Affordable Care Act (ACA) was to extend health coverage to many of the 47 million nonelderly individuals across the country who were uninsured in 2013, including many of the 500,000 uninsured Wisconsinites. The ACA accomplishes this goal through insurance market reforms and by establishing new coverage pathways, including an expansion of Medicaid to cover nearly all nonelderly adults up to 138% FPL ($16,242 for an individual and $27,724 for a family of three in 2015) and by providing premium subsidies to most individuals with incomes from 100 to 400% FPL to purchase coverage on the Health Insurance Marketplace. The Supreme Court decision on the ACA’s constitutionality effectively made the adult Medicaid expansion a state option, and Wisconsin is one of 20 states that has not adopted the expansion.37 , 38
Effects of the ACA on BadgerCare
Wisconsin made changes to BadgerCare, its existing Medicaid waiver for adults, following implementation of the ACA, but the state did not implement the ACA Medicaid expansion. As noted, prior to the ACA, Wisconsin had already extended coverage to parents and other adults with incomes up to 200% FPL under a demonstration waiver. However, the state capped enrollment and provided a more limited benefit package than the full Medicaid benefit package for other adults. Following implementation of the ACA, Wisconsin reduced BadgerCare eligibility levels for parents and childless adults to 100% FPL. At the same time, the state also removed the enrollment cap and provided a more comprehensive benefit package to childless adults than previously applied.39 Many adults who lost Medicaid eligibility are eligible for subsidies for the purchase of Marketplace coverage established by the ACA. However, these adults are likely to face higher out-of-pocket costs under Marketplace coverage than in BadgerCare.
Because Wisconsin has not implemented the full ACA Medicaid expansion up to 138% FPL, the state does not receive the enhanced federal matching funds available to states for newly eligible adults under the ACA. As such, it is forgoing significant federal funding. However, unlike in other states that have not implemented the Medicaid expansion, in Wisconsin, there is no “coverage gap” for adults below 100%FPL. The Wisconsin Hospital Association continues to advocate for accepting the Medicaid expansion to retain dollars the state loses by continuing not to expanding.40 For more information about Wisconsin’s current waiver, see Wisconsin’s BadgerCare Program and the ACA.
Overall, Medicaid enrollment in Wisconsin has increased since the implementation of the ACA, although different populations have had different enrollment trends. Between Summer 2013 and June 2015, total Medicaid enrollment in Wisconsin increased by 6%, or over 62,000 individuals.41 While eligibility for childless adults decreased from 200% FPL to 100% FPL, enrollment increased almost eight fold, or 765%, from 16,774 individuals in Summer 2013 to 145,098 individuals in June 2015 reflecting removal of the enrollment cap on this population.42 In contrast, enrollment for parents decreased by 28%, from 222,060 individuals in Summer 2013 to 160,128 individuals in June 2015, reflecting the eligibility reduction from 200% FPL to 100% FPL.43 Enrollment of children with incomes above poverty, whose parents lost eligibility, also has declined by almost 6% since September 2013.44
While Wisconsin’s enrollment system was already more sophisticated and coordinated than other state systems prior to the ACA, ACA requirements prompted the state to further streamline and improve its system. As of January 2015, individuals in Wisconsin could apply for both Medicaid and Health Insurance Marketplace coverage through multiple pathways, including in-person, over the phone, by mail, and online.45 Wisconsin also has an online portal through which users can apply for a variety of services including Medicaid, Supplemental Nutrition Assistance Program (SNAP), cash assistance, and child care subsidies.46
Health Insurance Marketplace
During the first two ACA open enrollment periods, Wisconsinites were able to shop for health plans through HealthCare.gov, the federal Health Insurance Marketplace. Under the ACA, states had the option to establish their own State-based Marketplace, build a Marketplace in partnership with the federal government, or default to the Federally-facilitated Marketplace. Governor Scott Walker announced in January 2012 that Wisconsin would not set up a State-based Marketplace, making the state one of 27 for which the federal government has established and is running the Health Insurance Marketplace.47 ,48 Thirteen insurers offered Qualified Health Plans (QHPs) in the Wisconsin Marketplace in 2014 and fifteen offered them in 2015.49 In 2015, the monthly premium for the benchmark QHP in Milwaukee before tax credits was $333 for an individual. This premium was fifth highest compared to premiums in the largest city in other states.50
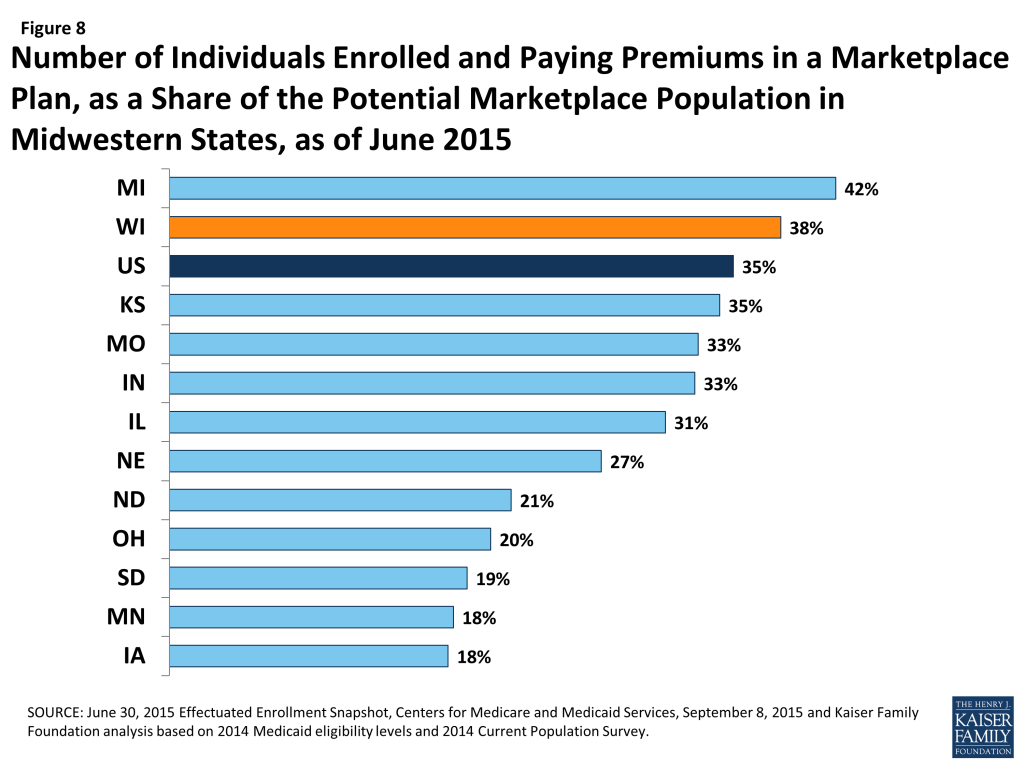
As of June 2015, 183,682 Wisconsinites had enrolled in Marketplace coverage during the 2014-2015 open enrollment period, most (90%) of whom received premium subsidies to purchase coverage.51 Almost one third (32%) of Marketplace enrollees in Wisconsin were under age 35.52 While the majority (56%) of total individuals enrolling in the 2014-2015 open enrollment period were reenrolling, over four in ten (44%) Wisconsinites who enrolled in Marketplace coverage were new customers.53 ,54 Among all states, Wisconsin had the 17th largest share of the potential Marketplace population enrolled in a Marketplace plan (53% ) and had the second largest share in the Midwest, after Michigan (Figure 8).55
Support for outreach and enrollment in Wisconsin is being provided by the federal government and private organizations. In August 2013, the federal government provided just over $1 million in grant funding to six Navigator entities operating in Wisconsin.56 During the second open enrollment period (2014-2015), only three consumer agencies received funding: The Board of Regents of the University of Wisconsin System, Partners for Community Development, Inc., and Northwest Wisconsin Concentrated Employment program, Inc. Together, the three agencies in the second open enrollment period received just over $1 million in Navigator grant funding.57 In September 2015, the Centers for Medicare and Medicaid Services announced the Navigator grantees for the third open enrollment period (2015-2016), and Wisconsin will continue to have three grantees – Forest County Potawatomi Community, Northwest Wisconsin Concentrated Employment Program, Inc., and The Board of Regents of the University of Wisconsin System – receiving approximately $1.3 million.58 Wisconsin’s community health centers have also played an important role in helping individuals enroll in coverage. The U.S. Department of Health and Human Services awarded federally-qualified health centers (FQHCs) in Wisconsin more than $2.6 million for Fiscal Years 2013 and 2014 to assist with outreach and enrollment under the ACA.59
Delivery System and the Safety Net
More than half of Medicaid and CHIP beneficiaries in Wisconsin are enrolled in comprehensive risk-based managed care plans. As of July 2015, over 750,000 beneficiaries, or 63% of the total Medicaid and CHIP population in Wisconsin, were enrolled in one of the state’s 19 managed care plans.60 Of the 19 managed care plans operating in the state, six plans are owned by a multi-state parent firm (including Anthem, Humana, Centene, Molina, and United Health Group).61 Nearly half of the Medicaid and CHIP beneficiaries enrolled in a managed care plan are enrolled in one of these six plans.62
Wisconsin is focused on delivery and payment reform to improve health outcomes, reduce disparities, and contain costs. Under the State Innovation Models (SIM) initiative, CMS has awarded grants to states to design, implement, and evaluate multi-payer health care delivery and payment reforms aimed at improving quality of care and health system performance while decreasing costs for Medicaid, CHIP, and Medicare beneficiaries. In December 2014, Wisconsin was awarded a one-year $2.49 million SIM Model Design grant to develop a State Health Care Innovation Plan (SHIP) – a state-level plan for health system transformation.63
The Wisconsin Department of Health Services (DHS) in partnership with the Wisconsin Statewide Value Committee (SVC), a committee formed in 2011 to accelerate progress in health care value, is leading the state’s SIM Model Design effort. Through the development of the SHIP, the state plans to: identify best practices in care delivery; align value-based purchasing and payment strategies across public and private payers; establish standardized quality and cost measures; and address regulatory barriers to coordinated, high-quality health care. The state’s SHIP will also include a special focus on strategies to improve access to behavioral health care and improve care coordination between behavioral and physical health.64
In the late 1990s, Wisconsin implemented two programs to expand options and streamline care for seniors and persons with disabilities. Family Care Partnership, which began in 1996, provides Medicaid long-term services and supports and Medicare acute care through a single integrated health plan. As of July 2015, 3,000 dual eligible beneficiaries across 14 counties were voluntarily enrolled in one of four Family Care Partnership managed care plans.65 Family Care, which started in 1999, integrates institutional care with home and community-based services, such as Medicaid personal care and home health services in a single benefit plan (acute/primary Medicaid and Medicare services are excluded).66 ,67 As of July 2015, over 40,000 people in 58 counties were voluntarily enrolled in one of eight Family Care health plans.68
To improve birth outcomes, reduce infant mortality, and strengthen families, the Milwaukee Health Department has deployed an evidence-based nurse home visiting program called Nurse-Family Partnership. In 2011, 100 babies died before their first birthday in Milwaukee, making Milwaukee’s infant mortality rate among the highest in the world.69 Nurse-Family Partnership is a voluntary program for low-income women pregnant with their first child. Nurse home visits begin during pregnancy and occur on a weekly, bi-weekly, or monthly basis until the child is two years old.70 Nurses work with women to improve pregnancy health, develop parenting skills, ensure the home environment is safe, and connect women to community resources (job training, child care etc.) to improve family self-sufficiency. Nurse-Family Partnership Program effects identified in the research literature include: improved prenatal health, reduction in childhood injuries, and increased maternal employment, among others.71 In addition to Nurse-Family Partnership, the Milwaukee Health Department has developed and implemented several other direct service programs to reduce infant mortality.
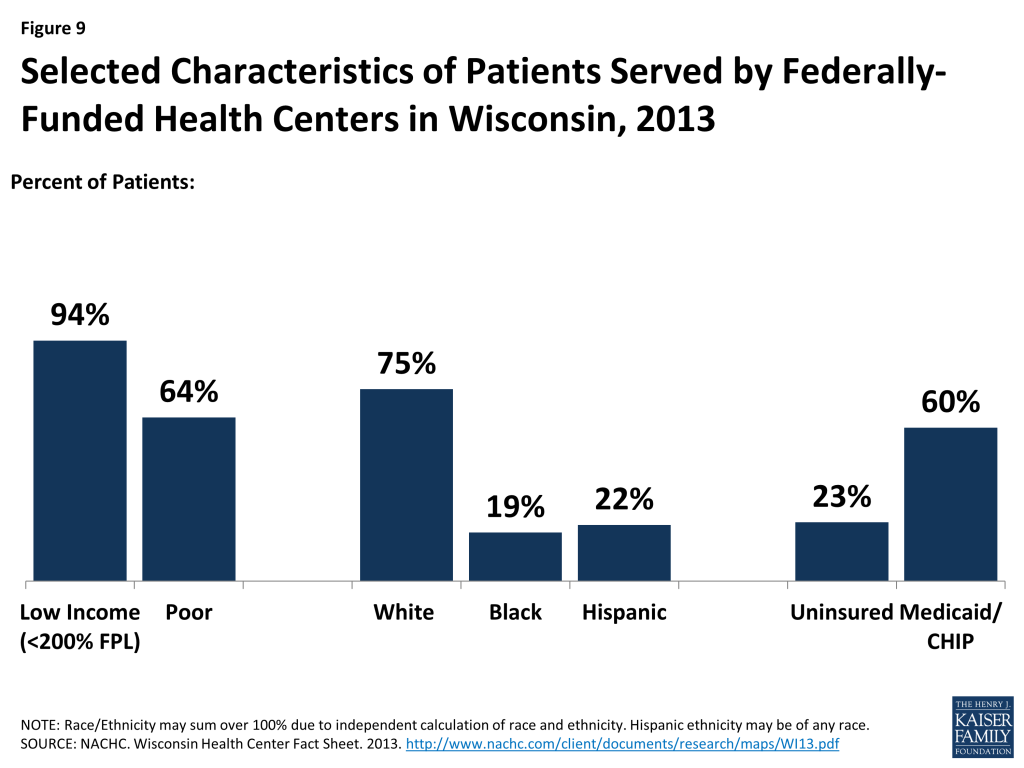
Wisconsin’s safety-net providers play an important role in delivering health care to vulnerable populations. Wisconsin’s community health centers and hospitals provide access to primary, preventive, and acute care services for low-income and underserved residents. There are 16 Federally Qualified Health Centers (FQHCs) in Wisconsin that operate 96 sites throughout the state. In 2013, FQHCs saw over 280,000 patients and provided more than 1.1 million patient visits. Nearly a quarter (23%) of FQHC patients were uninsured and 60% had Medicaid or CHIP coverage. Nearly all (94%) had incomes below 200% FPL, including about two-thirds (64%) who had incomes below the federal poverty level (Figure 9). One FQHC in Wisconsin, Family Health Center of Marshfield, saw nearly one-third of all health center patients in the state in 2013.72 Family Health Center of Marshfield serves a predominantly rural area in North Central Wisconsin.73
Even with Wisconsin’s safety-net providers, there are Health Professional Shortage Areas (HPSAs) and unmet needs for care. As of April 2014, there were 104 federally designated primary care Health Professional Shortage Areas (HPSAs), and just 71% of the need for primary health care in Wisconsin was being met. The state had 95 dental care and 103 mental health care HPSAs,74 and less than half (43%) of the dental health care need and just over 20% of the mental health care need was being met. Approximately half of physicians completing graduate medical education in Wisconsin remain in-state to practice, which is very similar to the national average (46% in Wisconsin versus 47% nationally).75 Wisconsin is one of numerous states whose licensure laws limit the autonomy of nurse practitioners in at least one area of practice.76
Looking Ahead
There is much to watch in Wisconsin. Individuals who have newly gained coverage in the Marketplace are beginning to interact with their new health plans and seek care. By preserving its limited Medicaid expansion, Wisconsin continues to forgo significant federal funding available for coverage of adults. However, there is no gap in coverage for adults in Wisconsin unlike other states that have not implemented the Medicaid expansion and Wisconsin could elect to move forward with the full expansion in the future. Meanwhile, the health care system and providers in Wisconsin, as in all states, is evolving in response to new demands, changing health care markets, and emerging models of health care delivery and payment. It remains to be seen how these and other changes under the ACA will affect the health, health care access, and health care utilization of Wisconsinites in the long term.
Appendix

- The Kaiser Family Foundation’s State Health Facts. Data Source: Kaiser Family Foundation estimates based on the Census Bureau’s March 2014 Current Population Survey (CPS: Annual Social and Economic Supplement). Accessed August 28, 2015. “Total Number of Residents,” https://modern.kff.org/other/state-indicator/total-residents/. ↩︎
- World Atlas, United States, http://www.worldatlas.com/aatlas/infopage/usabysiz.htm. ↩︎
- U.S. Department of Commerce, Economics, and Statistics Administration, Census Regions and Divisions of the United States (U.S. Census Bureau), http://www.census.gov/geo/maps-data/maps/pdfs/reference/us_regdiv.pdf. ↩︎
- World Atlas, Wisconsin, http://www.worldatlas.com/webimage/countrys/namerica/usstates/wiland.htm. ↩︎
- Madison, Wisconsin is in Dane County, Wisconsin. ↩︎
- US Census Bureau, 2009-2013 American Community Survey, County Total Population Estimates. ↩︎
- The Kaiser Family Foundation’s State Health Facts. Data Source: Kaiser Family Foundation estimates based on the Census Bureau’s March 2014 Current Population Survey (CPS: Annual Social and Economic Supplements). Accessed September 9, 2015. “Population Distribution by Metropolitan Status,” https://modern.kff.org/other/state-indicator/metropolitan-distribution/. ↩︎
- US Census Bureau, 2009-2013 American Community Survey, County Total Population Estimates. ↩︎
- Wisconsin Department of Health Services, Healthiest Wisconsin 2020 Baseline and Health Disparities Report, Demographic Overview Powerpoint (January 2014). ↩︎
- Kaiser Family Foundation estimates based on the Census Bureau’s March 2014 Current Population Survey (CPS: Annual Social and Economic Supplements). ↩︎
- Kaiser Family Foundation estimates based on the Census Bureau’s March 2014 Current Population Survey (CPS: Annual Social and Economic Supplement). ↩︎
- Kaiser Family Foundation estimates based on the Census Bureau’s March 2014 Current Population Survey (CPS: Annual Social and Economic Supplements). ↩︎
- Local Area Unemployment Statistics (August 2015), http://www.bls.gov/web/laus/laumstrk.htm. ↩︎
- U.S. Bureau of Economic Analysis, Current-Dollar GDP by State, Wisconsin, 2014 (June 10, 2015). ↩︎
- Ibid. ↩︎
- Ibid. ↩︎
- Ibid. ↩︎
- United Health Care Foundation, America’s Health Rankings (2014), http://www.americashealthrankings.org/ ↩︎
- The Commonwealth Fund. Aiming Higher: Scorecard on State Health System Performance, 2014. http://www.commonwealthfund.org/publications/fund-reports/2014/apr/2014-state-scorecard ↩︎
- Ibid. ↩︎
- The Centers for Disease Control and Prevention (CDC), National Center for Health Statistics, Division of Vital Statistics, National Vital Statistics Reports (NVSR) Volume 63, Number 9, Table 19, August 31, 2015, http://www.cdc.gov/nchs/data/nvsr/nvsr63/nvsr63_09.pdf. ↩︎
- K. Host and S. Henshaw. “U.S. Teen Pregnancies, Births and Abortions, 2010: National and State Trends by Age, Race and Ethnicity.” http://www.guttmacher.org/pubs/USTPtrends10.pdf ↩︎
- Matthews, TJ, M.S., et. al. Infant Mortality Statistics from the 2010 Period Linked Birth/Infant Death Data Set. Division of Vital Statistics. National Vital Statistics Report, Vol 62, No. 8, December 8, 2013. As published on State Health Facts at Infant Mortality Rate (Deaths per 1,000 Live Births) by Race/Ethnicity. ↩︎
- Wisconsin Center for Health Equity (April 2014) Health Disparities. Madison, WI. ↩︎
- Ibid. ↩︎
- Wisconsin Department of Health Services, Minority Health Program, https://www.dhs.wisconsin.gov/minority-health/index.htm ↩︎
- University of Wisconsin Population Health Institute, Health Disparity Graphs, https://uwphi.pophealth.wisc.edu/programs/match/healthiest-state/progress-report/2014/disparity.htm ↩︎
- Kaiser Family Foundation estimates based on the Census Bureau’s March 2014 Current Population Survey (CPS: Annual Social and Economic Supplements). ↩︎
- Ibid. ↩︎
- Prior to the Affordable Care Act (ACA), states could only cover childless adults and receive federal Medicaid funds by obtaining a Section 1115 waiver which allowed states to operate their Medicaid programs in ways not otherwise allowed under federal laws to promote the objectives of the program. ↩︎
- Ibid. ↩︎
- Kaiser Commission on Medicaid and the Uninsured and Urban Institute estimates based on data from FY 2011 MSIS. ↩︎
- Ibid. ↩︎
- 79 Fed. Reg. 71426-71428 (Dec. 2, 2014) , at http://www.gpo.gov/fdsys/pkg/FR-2014-12-02/pdf/2014-28398.pdf. ↩︎
- Kaiser Commission on Medicaid and the Uninsured estimates based on the NASBO November 2014 State Expenditure Report (actual data for SFY 2013). ↩︎
- Ibid. ↩︎
- MaryBeth Musumeci, A Guide to the Supreme Court’s Affordable Care Act Decision (Kaiser Family Foundation, June 2012), https://modern.kff.org/health-reform/issue-brief/a-guide-to-the-supreme-courts-affordable/. ↩︎
- State Health Facts, Status of State Action on the Medicaid Expansion Decision, 2015 (September 1, 2015), https://modern.kff.org/health-reform/state-indicator/state-activity-around-expanding-medicaid-under-the-affordable-care-act/. ↩︎
- Childless adults will not be offered family planning services or tuberculosis-related services. Additionally, both childless adults and TMA adults will not receive pregnancy related services, but will be assessed for pregnancy related Medicaid coverage. ↩︎
- Wisconsin Hospital Association, “The Valued Voice”, January 9, 2015, Volume 59, Issue 1, http://www.wha.org/Data/Sites/1/pubarchive/valued_voice/WHA-Newsletter-1-9-2015.pdf ↩︎
- State Health Facts. “Total Medicaid and CHIP Child Enrollment, January 2014 – January 2015” (Kaiser Family Foundation, March 20, 2015), https://modern.kff.org/health-reform/state-indicator/total-monthly-medicaid-and-chip-enrollment/. ↩︎
- Affordable Care Act and Medicaid Reform in Wisconsin Enrollment and Coverage Trends Chartpack, (University of Wisconsin Population Health Institute, July 2015), http://uwphi.pophealth.wisc.edu/programs/health-policy/ebhpp/health-reform/chartpack-summer-2015.pdf ↩︎
- Affordable Care Act and Medicaid Reform in Wisconsin Enrollment and Coverage Trends Chartpack, (University of Wisconsin Population Health Institute, July 2015), http://uwphi.pophealth.wisc.edu/programs/health-policy/ebhpp/health-reform/chartpack-summer-2015.pdf ↩︎
- Affordable Care Act and Medicaid Reform in Wisconsin Enrollment and Coverage Trends Chartpack, (University of Wisconsin Population Health Institute, July 2015), http://uwphi.pophealth.wisc.edu/programs/health-policy/ebhpp/health-reform/chartpack-summer-2015.pdf ↩︎
- Tricia Brooks, Joe Touschner, Samantha Artiga, Jessica Stephens, and Alexandra Gates, Modern Era Medicaid: Findings from a 50-State Survey of Eligibility, Enrollment, Renewal, and Cost-Sharing Policies in Medicaid and CHIP as of January 2015 (January 2015), https://modern.kff.org/health-reform/report/modern-era-medicaid-findings-from-a-50-state-survey-of-eligibility-enrollment-renewal-and-cost-sharing-policies-in-medicaid-and-chip-as-of-january-2015/ ↩︎
- Ibid. ↩︎
- State Health Facts. “State Decisions for Creating Health Insurance Marketplaces” (Kaiser Family Foundation, February 19, 2015), http://modern.kff.org/health-reform/state-indicator/health-insurance-exchanges/. ↩︎
- “Governor Walker Turns Down ObamaCare Funding.” Press release from Governor Scott Walker. January 18, 2012. http://walker.wi.gov/newsroom/press-release/governor-walker-turns-down-obamacare-funding ↩︎
- State Health Facts, “Number of Issuers Participating in the Individual Health Insurance Marketplaces” (Kaiser Family Foundation), https://modern.kff.org/other/state-indicator/number-of-issuers-participating-in-the-individual-health-insurance-marketplace/. ↩︎
- State Health Facts, “Monthly Silver Premiums for a 40 Year Old Non-Smoker Making $30,000/Year” (Kaiser Family Foundation, 2014-2015), https://modern.kff.org/other/state-indicator/monthly-silver-premiums-for-a-40-year-old-non-smoker-making-30000year-2014-2015/. ↩︎
- Office of the Assistant Secretary for Planning and Evaluation (ASPE), Health Insurance Marketplaces 2015 Open Enrollment Period: March Enrollment Report, 11-15-14 to 2-15-15 (including SEP activity reported through 2-22-15)(HHS, March 10, 2015), http://aspe.hhs.gov/health/reports/2015/MarketPlaceEnrollment/Mar2015/ib_2015mar_enrollment.pdf. ↩︎
- Ibid. ↩︎
- Ibid. ↩︎
- According to ASPE’s March 2015 Enrollment Report: “New Consumers” are those individuals who selected a 2015 plan through the Marketplaces (with or without the first premium payment having been received directly by the issuer) and did not have an active 2014 Marketplace plan selection as of November 1, 2014. ↩︎
- State Health Facts. “Marketplace Enrollment as a Share of the Potential Marketplace Population” (Kaiser Family Foundation, April 19, 2014), https://modern.kff.org/health-reform/state-indicator/marketplace-enrollment-as-a-share-of-the-potential-marketplace-population/ ↩︎
- 2013 Grantees: Partners for Community Development, Inc., Northwest Wisconsin Concentrated Employment Program, Inc., Legal Action of Wisconsin, Inc./SeniorLAW, National Council of Urban Indian Health, National Healthy Start Association, and R&B Receivables Management Corporation DBA R&B Solutions ↩︎
- Center for Consumer Information and Insurance Oversight, “2014 Navigator Grant Recipients”, (Centers for Medicare and Medicaid Services, September 8, 2014), http://www.cms.gov/CCIIO/Programs-and-Initiatives/Health-Insurance-Marketplaces/Downloads/Navigator-Grantee-Summaries_UPDATED-with-Subgrantees-12-05-2014_pdf.pdf ↩︎
- Center for Consumer Information and Insurance Oversight, “2015 Navigator Grant Recipients”, (Centers for Medicare and Medicaid Services, September 2, 2015), https://www.cms.gov/CCIIO/Programs-and-Initiatives/Health-Insurance-Marketplaces/Downloads/2015_Navigator_Grantee_Summaries_FINAL_09-01-2015.pdf ↩︎
- HRSA, Wisconsin: Health Center Outreach and Enrollment Assistance, http://www.hrsa.gov/about/news/2013tables/outreachandenrollment/wi.html. ↩︎
- Wisconsin Department of Human Services, ForwardHealth Monthly HMO Enrollment Reports (accessed on September 10, 2015), https://www.forwardhealth.wi.gov/WIPortal/Tab/42/icscontent/managed%20care%20organization/reports_data/ monthlyreports/index.htm.spage. ↩︎
- State Health Facts, “Medicaid MCOs and their Parent Firms” (Kaiser Family Foundation), https://modern.kff.org/other/state-indicator/medicaid-mcos-and-their-parent-firms/. ↩︎
- Wisconsin Department of Human Services, ForwardHealth Monthly HMO Enrollment Reports (accessed on September 10, 2015), https://www.forwardhealth.wi.gov/WIPortal/Tab/42/icscontent/managed%20care%20organization/reports_data/ monthlyreports/index.htm.spage. ↩︎
- Wisconsin Department of Human Services, State Innovation Models Initiative — Wisconsin Round Two Model Design Award (accessed on September 8, 2015), https://www.dhs.wisconsin.gov/sim/index.htm. ↩︎
- Wisconsin SHIP Application – Project Narrative, https://www.dhs.wisconsin.gov/sim/project-narrative.pdf. ↩︎
- Wisconsin Department of Human Services, ForwardHealth Monthly HMO Enrollment Reports (accessed on September 10, 2015), https://www.forwardhealth.wi.gov/WIPortal/Tab/42/icscontent/managed%20care%20organization/reports_data/ monthlyreports/index.htm.spage. ↩︎
- Wisconsin Department of Human Services, Key Differences Between Family Care and Family Care Partnership (accessed September 10, 2015), https://www.dhs.wisconsin.gov/familycare/differences.htm. ↩︎
- Wisconsin Department of Human Services, Services included in IRIS, Family Care, Partnership and PACE, https://www.dhs.wisconsin.gov/publications/p0/p00570.pdf. ↩︎
- Wisconsin Department of Human Services, ForwardHealth Monthly HMO Enrollment Reports (accessed on September 10, 2015), https://www.forwardhealth.wi.gov/WIPortal/Tab/42/icscontent/managed%20care%20organization/reports_data/ monthlyreports/index.htm.spage. ↩︎
- City of Milwaukee Health Department. Getting to Know City of Milwaukee Health Department – 2012. http://city.milwaukee.gov/ImageLibrary/Groups/healthAuthors/ADMIN/PDFs/MHDOVERVIEW_publicrev07-20-12.pdf ↩︎
- Milwaukee Health Department. Nurse Family Partnership. http://city.milwaukee.gov/health/nurseFamilyPartnersh23828.htm#.VgAlE99VhBf ↩︎
- Milwaukee Health Department. Nurse Family Partnership. http://city.milwaukee.gov/health/nurseFamilyPartnersh23828.htm#.VgAlE99VhBf ↩︎
- U.S. Department of Health and Human Services, Health Resources and Services Administration (HRSA), Health Center Program Grantee Data, http://bphc.hrsa.gov/uds/datacenter.aspx?q=d&bid=050840&state=WI&year=2014. ↩︎
- Health Affairs Blog, Teaching Health Centers: Targeted Expansion for Immediate GME Reform (April 2015), http://healthaffairs.org/blog/2015/04/24/teaching-health-centers-targeted-expansion-for-immediate-gme-reform/. ↩︎
- Bureau of Clinician Recruitment and Service, Health Resources and Services Administration (HRSA), U.S. Department of Health & Human Services, HRSA Data Warehouse: Designated Health Professional Shortage Areas Statistics, as of April 28, 2014. ↩︎
- https://www.aamc.org/download/362168/data/2013statephysicianworkforcedatabook.pdf. ↩︎
- American Association of Nurse Practitioners, State Practice Environment 2014, http://www.aanp.org/legislation-regulation/state-legislation-regulation/state-practice-environment. ↩︎