The Georgia Health Care Landscape
The Affordable Care Act (ACA) went into full effect on January 1, 2014, ushering in health insurance reforms and new health coverage options in Georgia and elsewhere across the country. Thousands of Georgians have enrolled in health coverage through the new Health Insurance Marketplace, but Georgia has not implemented the Medicaid expansion, and many low-income adults in the state will likely remain uninsured. This fact sheet provides an overview of the population health, health coverage, and health care delivery system in Georgia in the era of health reform.
Demographics

Georgia, located in the southern region of the United States, is home to over 9.6 million people, making it the ninth most populous state in the U.S. and the third most populous state in the South, after Texas and Florida. With nearly 58,000 square miles, Georgia is the 30th largest state.1 Much of Georgia is rural, including 37 of the state’s 159 counties that are part of the Appalachian region. However, a majority of the state’s population (87%) lives in metropolitan areas. Georgia’s three most populous counties (Fulton, Gwinett, and Cobb) account for over one-quarter (26%) of the state population.2
Georgia is racially and ethnically diverse. People of color account for 44% of the state’s population compared to 37% of the national population (Figure 2). In particular, compared to the U.S. overall, a much larger share of Georgians identify as Black (30% vs. 12% nationally). Nearly 8% of all Blacks in the United States live in Georgia. Hispanics account for 8% of the population in Georgia, which is less than the share in the US overall (17%), but the Hispanic population in Georgia has grown significantly over the past decade.3 Over half of Georgia’s population (56%) identifies as non-Hispanic White.

Other social and demographic population patterns in Georgia, including citizenship status and age distribution, mirror other states in the South and the United States overall (Table 1). Nearly three in ten Georgian residents (28%) are children, more than nine in ten (91%) are U.S.-born citizens, and approximately three in ten nonelderly adults (31%) have at least a college degree. Three-quarters of residents (75%) live in a household with at least one full-time worker.
| Table 1: Selected Demographic Characteristics of the Georgian Population,Compared to the South and United States Overall, 2011-2012 | |||
| Georgia | South | United States | |
| Age | |||
| 0-18 | 28% | 26% | 25% |
| 19-34 | 22% | 21% | 22% |
| 35-54 | 28% | 27% | 27% |
| 55-64 | 11% | 12% | 12% |
| 65+ | 11% | 14% | 14% |
| Citizenship Status | |||
| U.S.-Born Citizen | 91% | 89% | 87% |
| Naturalized Citizen | 4% | 5% | 6% |
| Non-Citizen | 6% | 7% | 7% |
| Educational Attainment of Adults (19-64) | |||
| Less than High School | 11% | 13% | 11% |
| High School Graduate | 29% | 31% | 29% |
| Some College/Assoc. Degree | 29% | 28% | 31% |
| College Grad or Greater | 31% | 27% | 30% |
| Employment Characteristics of Nonelderly | |||
| Households with at Least 1 Full-time Worker | 75% | 77% | 76% |
| NOTE: Data may not sum to 100% due to rounding and data restrictions.SOURCE: KCMU/Urban Institute analysis of 2013 and 2012 ASEC Supplements to the CPS. | |||
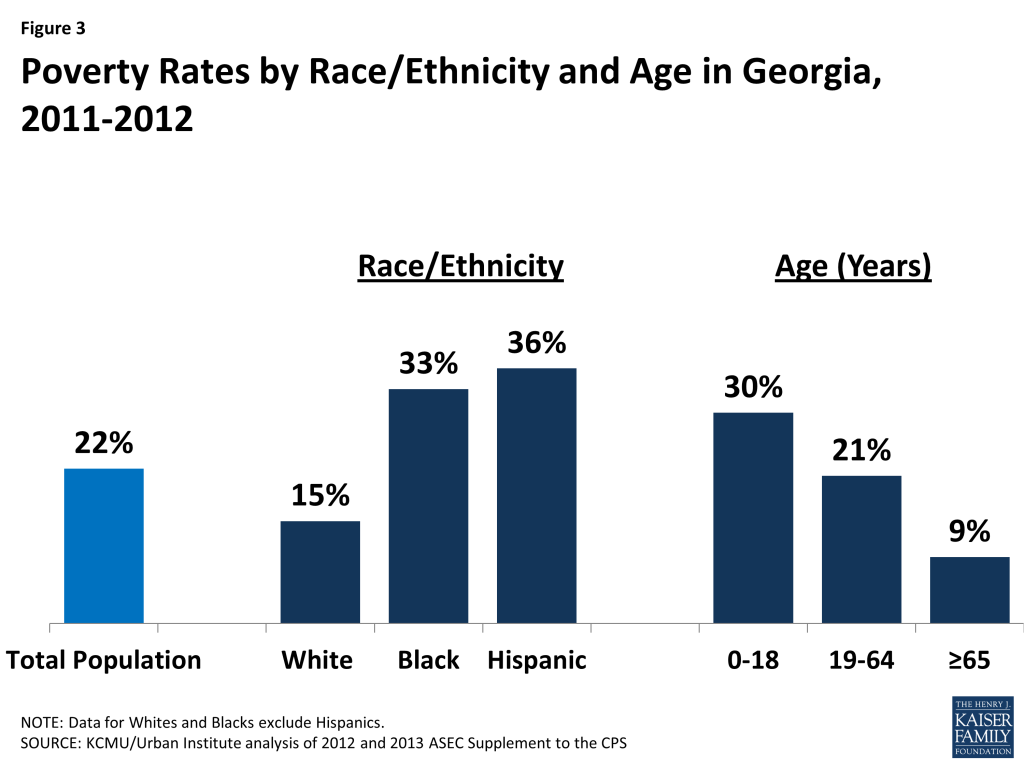
While the overall share of Georgians living in poverty is only slightly higher than the national average (22% vs. 20% nationally), Georgia has wide disparities in poverty rates by race/ethnicity and age. Blacks and Hispanics are more than twice as likely as Whites in Georgia to be poor (Figure 3). Children in Georgia are also substantially more likely than adults to live in a poor household. As of 2012, three in ten Georgian children under age 19 were living in poverty, compared to one in five nonelderly adults (21%) and 9% of seniors age 65 and over.4
State Economy
Georgia’s economy continues to recover slowly after the recent recession, but unemployment remains high. As of August 2014, Georgia has the highest unemployment rate in the country (8.1%), which is much higher than the national unemployment rate of 6.1%.5 Nevertheless, there has been moderate economic recovery in Georgia over the last few years, and state budget officials predict continued steady economic growth over the next fiscal year.6 In 2013, Georgia’s total state Gross Domestic Product (GDP) was $425 billion, making it the 11th largest economy in the country. 7 Georgia also experienced a 1.8% increase in its GDP between 2012 and 2013, equal to the national average.8 Health care and social assistance are major industries in the state, accounting for one-quarter of the total increase in GDP between 2012 and 2013.9 Other major private industries in Georgia include manufacturing and real estate.10
Population Health
Georgia falls below national averages in rankings of state population health. Georgia ranks 38th among the 50 states in the United Health Care Foundation’s report, America’s Health Rankings 2013, and ranks 40th for health among seniors. 11 In the Commonwealth Fund rankings of state health system performance, Georgia dropped from 35th to 45th between 2007 and 2012.12 Compared to other states, Georgia has a high HIV-related mortality rate, as well as death rates from diabetes and heart disease that are above national averages.13 Conversely, suicide rates and alcohol and drug-related death rates in Georgia are below national averages.14 While Georgia has among the highest teen pregnancy rates in the country, the number of teen pregnancies has been decreasing steadily, and the rate is less than half of what it was two decades ago.15
Disparities in health and health care access exist in Georgia. As in other states across the country, measures of health status in Georgia vary by race/ethnicity (Table 2). Compared to Blacks and Hispanics, a higher share of White residents in Georgia smoke and report frequent mental distress, but Whites are less likely to be obese or have diabetes. White residents in Georgia are nearly twice as likely as Blacks not to have had a doctor visit in the past 2 years but are more likely than Blacks and Hispanics in the state to report having a usual source of health care. Over half (56%) of Hispanics in Georgia report that they do not have a usual source of care, compared to less than one-quarter (24%) of Whites. These trends are mostly consistent with national data on health status and access by race and ethnicity.
| Table 2: Selected Measures of Health Status and Health Access by Race/Ethnicity in Georgia Compared to the United States, 2011-2012 | ||||||
| Share reporting that they: | Georgia | United States | ||||
| White | Black | Hispanic | White | Black | Hispanic | |
| Have fair or poor general health | 15% | 16% | NSD | 13% | 20% | 25% |
| Have diabetes | 7% | 9% | NSD | 7% | 10% | 8% |
| Are overweight or obese | 63% | 69% | 71% | 62% | 73% | 70% |
| Smoke | 25% | 20% | NSD | 24% | 25% | 17% |
| Have frequent mental distress | 38% | 24% | 28% | 40% | 40% | 38% |
| Have no usual source of care | 24% | 30% | 56% | 21% | 38% | 42% |
| Have not had a checkup in the past 2 years | 21% | 11% | NSD | 13% | 14% | 23% |
| NSD= Not sufficient data. Data have been suppressed for confidentiality or are unreliable due to small sample size. Data may not sum to 100% due to rounding and data restrictions. Data for Whites and Blacks exclude Hispanics.SOURCE: KCMU analysis of the Center for Disease Control and Prevention (CDC)’s Behavioral Risk Factor Surveillance System (BRFSS) 2012 Survey Results | ||||||
Health Coverage in Georgia Prior to the ACA
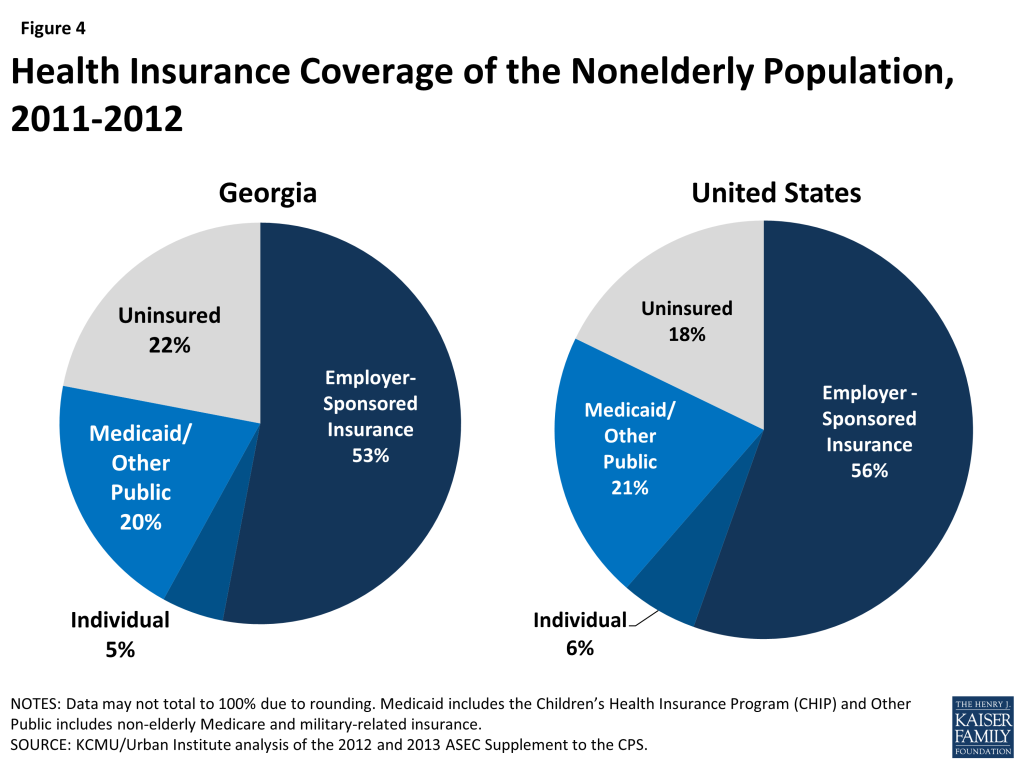
As in other states, most Georgians are covered by private health insurance. As of 2012, nearly six in ten (58%) were covered under an employer plan or on the individual private market (Figure 4).
One in five Georgians (20%) are enrolled in Medicaid or the Children’s Health Insurance Program (CHIP), also known in Georgia as PeachCare for Kids. Medicaid and CHIP help to fill gaps in the availability of private coverage, mostly for children, since Medicaid eligibility for adults has historically been limited to parents with very low incomes. As of 2012, four in ten Georgian children (40%) were enrolled in Medicaid or CHIP, compared to about one in ten nonelderly adults (11%).16 Georgia has been particularly successful in promoting enrollment in its children’s coverage programs through outreach and the adoption of a number of enrollment process simplifications that made it easier for families to apply for and retain coverage. In 2011, the Georgia Department of Community Health received a $2.5 million federal grant to implement technological improvements that streamlined enrollment and renewal for Medicaid and PeachCare for Kids.17 However, prior to 2014, approximately 182,000 uninsured children in Georgia were eligible for Medicaid or CHIP but had not enrolled.18
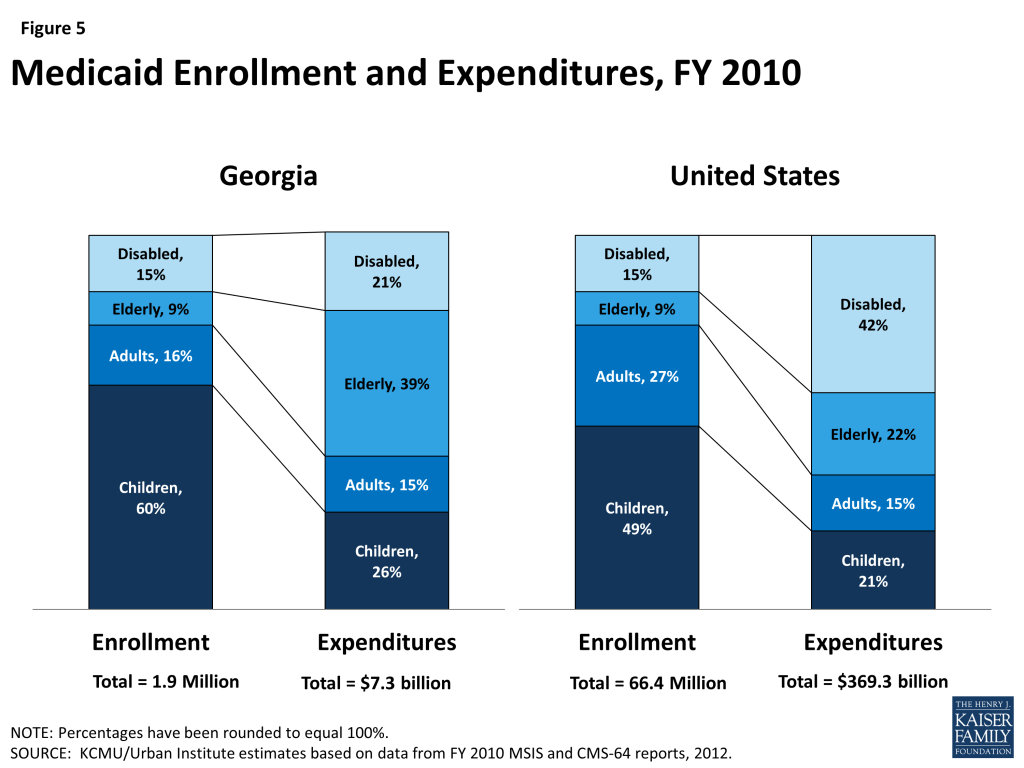
While a majority of Medicaid enrollees in Georgia are children, the elderly and disabled account for most of the expenditures in the program. As of Fiscal Year 2010, children made up 60% of Medicaid enrollees in Georgia, but accounted for about one-quarter (26%) of total Medicaid expenditures (Figure 5).19 Conversely, the elderly and people with disabilities accounted for less than one-quarter (24%) of enrollees, but 60% of total program costs. Average spending per beneficiary in Georgia was $3,916, the second lowest in the country after California, and much less than the national average of $5,563.20
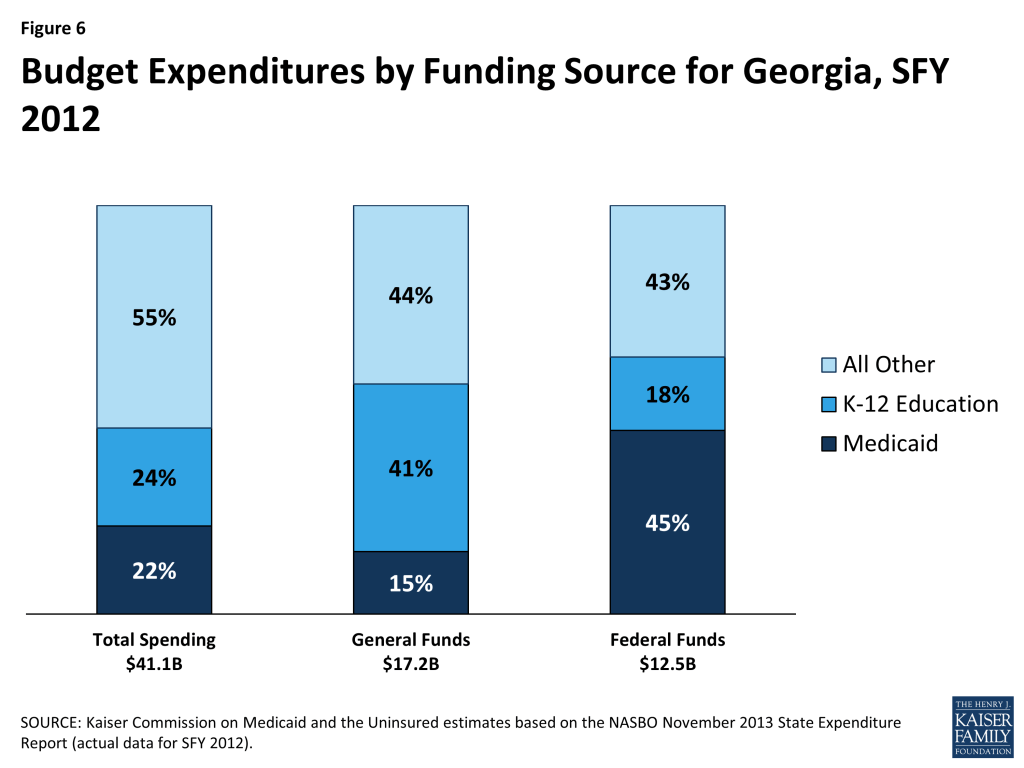
Medicaid costs are shared by the state and the federal government, with the federal government paying more than two-thirds (67%) of the cost of Georgia Medicaid. For every dollar that Georgia spends on Medicaid, the federal government sends $2.02 in matching funds to the state.21 Georgia also provides coverage to children with income up to 252% FPL through a separate CHIP program, for which the federal government pays 78% of the cost.22 Medicaid spending accounted for 22% of total state spending in FY 2013, 15% of state general fund spending, and 45% of all federal funds spent by the state (Figure 6).23 Medicaid is the second largest category of state general fund spending behind elementary and secondary education, but it is the single largest source of federal funds flowing into the state.24
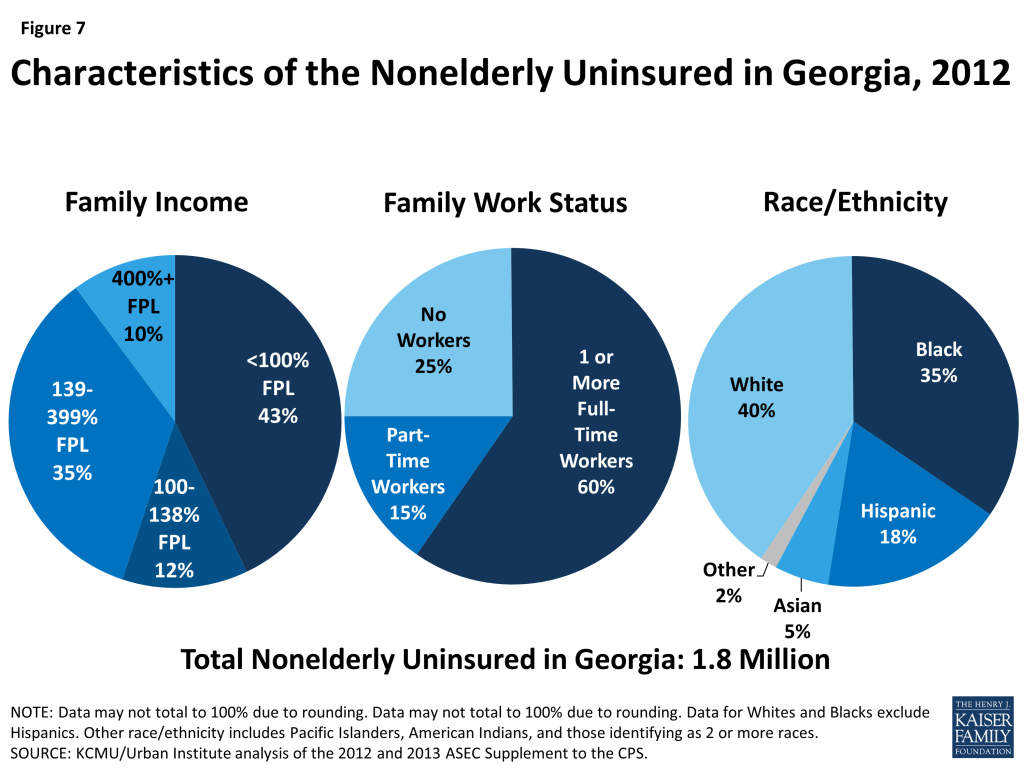
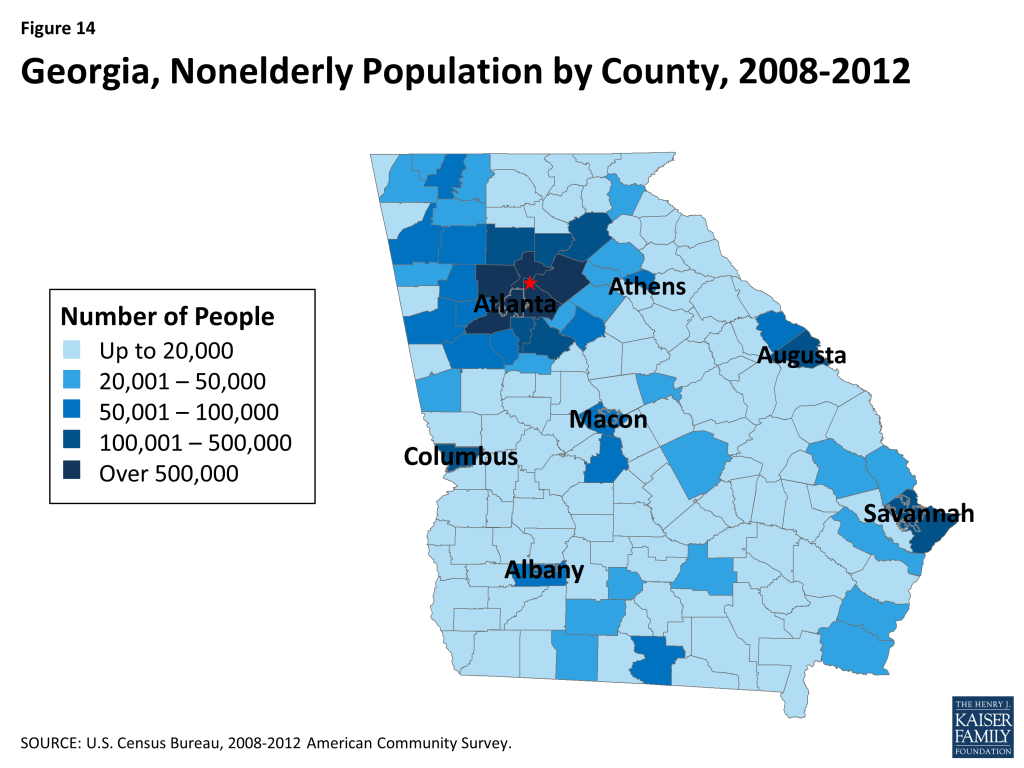
Although Medicaid and CHIP play an important role in coverage for some populations in Georgia, many individuals remain uninsured. As of 2012, Georgia had among the highest uninsured rates in the country, with more than one in five nonelderly residents lacking coverage (see Figure 4). More than one in five Georgians (22%) (1.8 million people) were uninsured – the 7th highest uninsured rate in the country. More recent estimates of the uninsured in 2014 suggest that Georgia’s uninsured rate is increasing relative to other states. Similar to the uninsured in other states, most uninsured Georgians are low-income individuals from working households. Nine in ten uninsured people in Georgia (90%) have income below 400% FPL, and three-quarters (75%) of the uninsured have at least one full-time worker in their household (Figure 7).25 Four in ten uninsured people in Georgia are White, but people of color make up a larger share (60%) of the uninsured. Specifically, Blacks account for about one-third (35%) and Hispanics account for about one-fifth (18%) of the uninsured in the state. As shown in Figure 14 (Appendix), the nonelderly uninsured in Georgia are not equally distributed across the state’s counties, with the southern and central counties having higher uninsured rates than other areas of the state.
The Affordable Care Act in Georgia
A main goal of the Affordable Care Act (ACA) is to extend health coverage to many of the 47 million nonelderly uninsured individuals across the country, including many of the 1.8 million uninsured Georgians. The ACA accomplishes this through insurance reforms and by establishing new coverage pathways, including an expansion of Medicaid to cover nearly all nonelderly adults up to 138% FPL ($16,105 for an individual and $27,310 for a family of three in 2014) and by providing premium subsidies to most individuals with incomes up to 400% FPL to purchase coverage on the Health Insurance Marketplace. The Supreme Court decision on the ACA effectively made the Medicaid expansion to adults a state option, and Georgia is not currently implementing the expansion.26 , 27 As described below, Georgia’s decision not to implement the expansion has significant implications for the availability of health coverage for poor uninsured adults in Georgia. However, many uninsured Georgians are still eligible for financial assistance to enroll in coverage, particularly through the Marketplace.
Medicaid
Georgia is one of 23 states not currently implementing the ACA Medicaid expansion, which could, if implemented, extend Medicaid coverage to nearly 600,000 low-income uninsured adults in the state.28 In addition to expanding coverage to many uninsured Georgians, studies suggest that the expansion could result in a number of positive economic benefits. The federal government pays 100% of the cost of coverage for those newly eligible through 2016, and then phases payments down to 90% in 2020 and beyond. A 2013 study from Georgia State University estimated that with the Medicaid expansion, Georgia would receive $40.5 billion in additional Medicaid funds from 2014-2023.29 Additional Medicaid spending would also support over 70,000 jobs and an average of $277 million in increased tax revenue annually. However, citing concerns about state costs, Georgia Governor, Nathan Deal, announced in 2012 that Georgia would not implement the expansion. Many state legislative officials have also opposed the expansion, and in early 2014, the state General Assembly passed HB 990 prohibiting Medicaid expansion without prior legislative approval.30
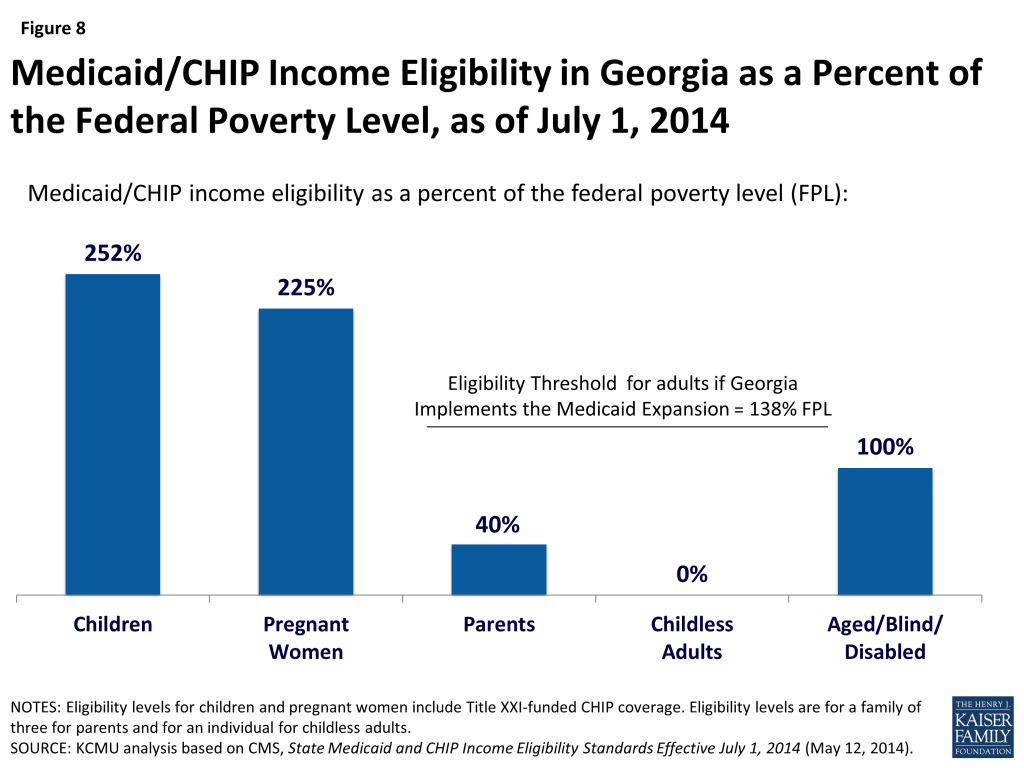
Without the Medicaid expansion, Medicaid eligibility for adults remains very limited (Figure 8). As of July 2014, children in Georgia with family income up to 252% FPL ($49,870 for a family of three) are eligible for Medicaid or CHIP and pregnant women with income up to 225% FPL ($44,527 for a family of three) are eligible for Medicaid. However, Medicaid eligibility remains limited to parents with very low incomes (40% FPL, or $7,913, for a parent in a family of three), and non-disabled adults without dependent children remain ineligible for Medicaid, regardless of their income.
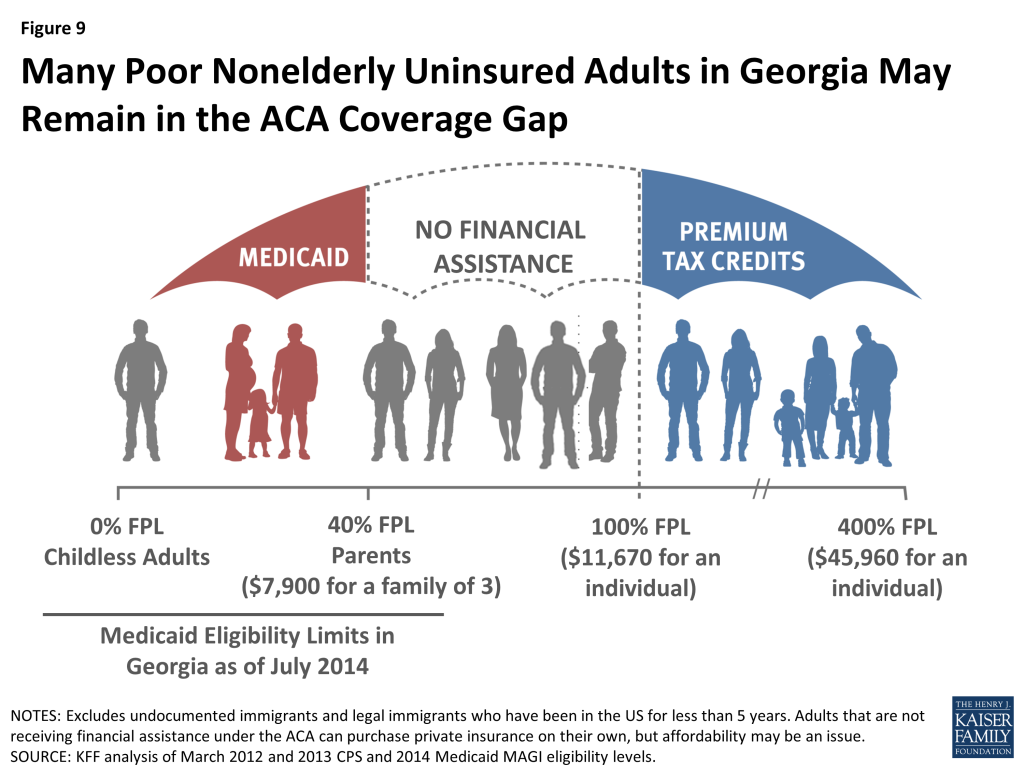
More than 409,000 uninsured poor adults who would have been eligible for Medicaid under the expansion fall into a coverage gap. Adults with income below poverty and above Medicaid limits in Georgia are ineligible for Medicaid or for financial assistance to obtain private coverage through the Marketplace (Figure 9). Consequently, more than three in ten uninsured adults in Georgia (31%) who would have been eligible for Medicaid are left without an affordable coverage option and will likely remain uninsured. 31 Nearly one in ten (9%) of the 4.5 million people in the coverage gap nationally lives in Georgia.32
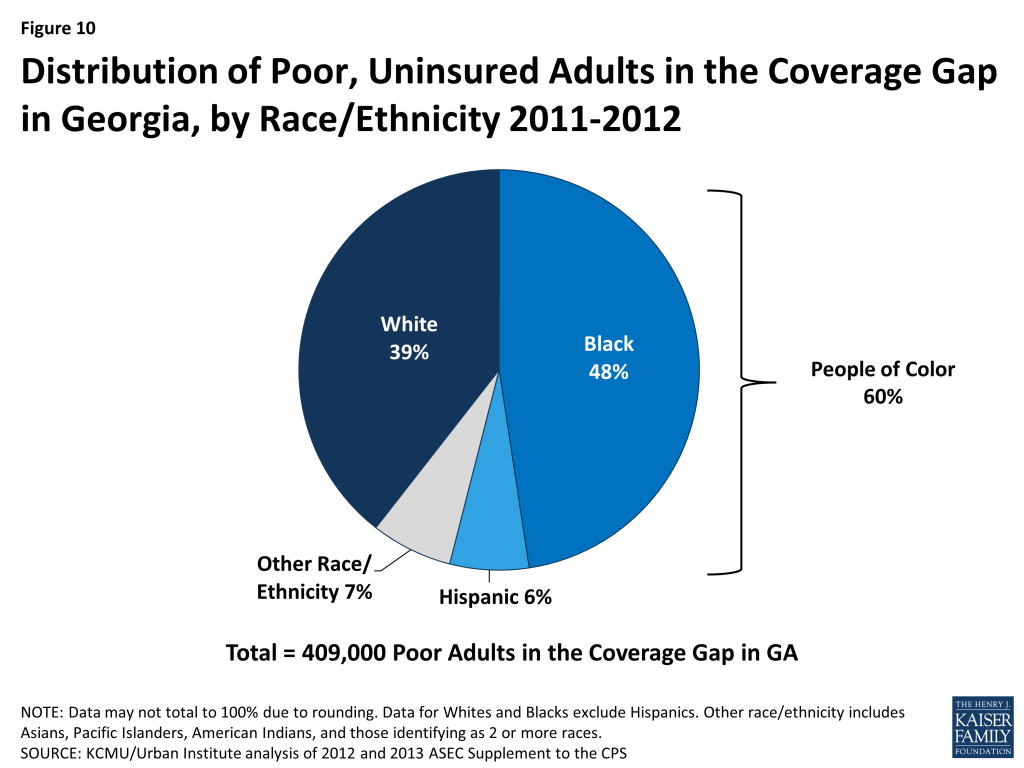
In Georgia, the coverage gap has a disproportionate effect on people of color. Nearly half (48%) of uninsured, poor Georgian adults in the coverage gap are Black, and 6% are Hispanic (Figure 10). Overall, people of color make up 60% of people in the coverage gap in Georgia. About four in ten Georgians in the gap (39%) are White.
Regardless of a state’s Medicaid expansion decision, the ACA required all states, including Georgia, to implement new simplified eligibility and enrollment processes. These simplifications, which included new requirements to streamline the Medicaid application process, were expected to promote increased enrollment among individuals who were already eligible for Medicaid or CHIP before the ACA but had not enrolled, many of whom are children. In Georgia, Medicaid enrollment as of June 2014 has increased by 13% compared to the monthly average during the pre-open enrollment period (July-September 2013).33 Children account for a substantial share (71%) of total enrollment as of July 2014.34 The enrollment increases in Georgia cannot all necessarily be attributed to the ACA, however, as they may reflect additional factors including underlying base program enrollment growth, seasonal fluctuations, changing economic conditions, and overall population growth.
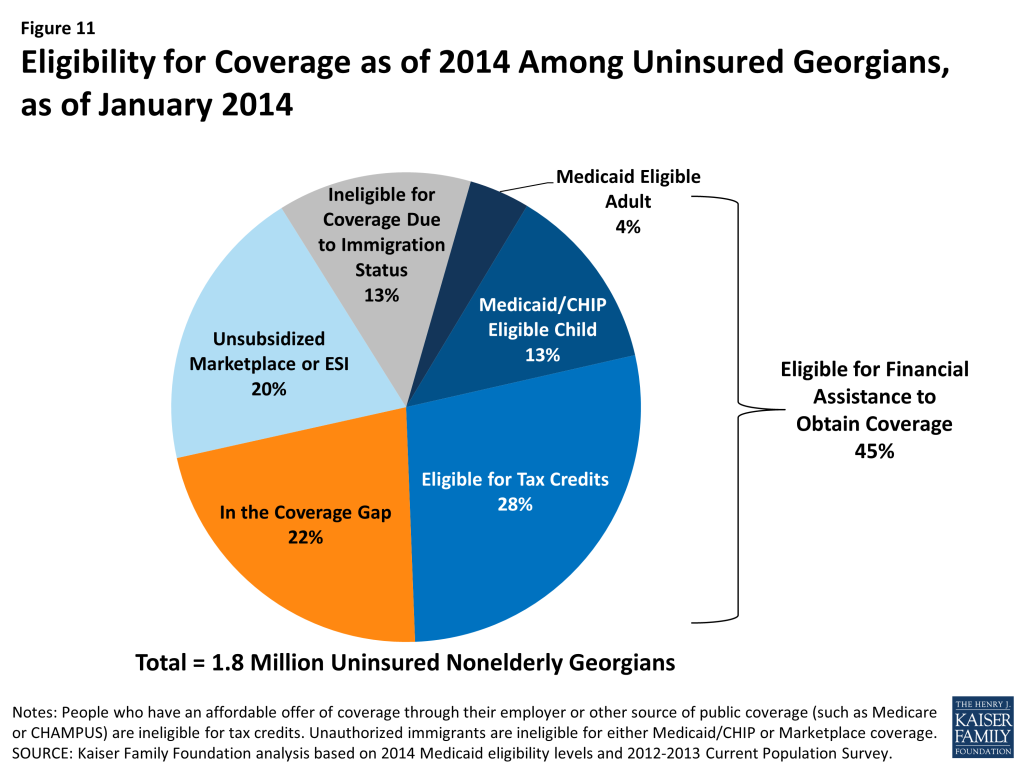
Even without the Medicaid expansion, nearly half (45%) of uninsured Georgians are eligible for some financial assistance to obtain coverage under the ACA, largely through the Marketplace. Nearly one in five (17%) are eligible for coverage through existing eligibility pathways in Medicaid and CHIP, though most of these individuals are children. More than one-quarter (28%) are eligible for premium tax credits to help them purchase private coverage in the Marketplace, and 20% may benefit from employer-sponsored insurance or access to unsubsidized coverage in the Marketplace (Figure 11).35
Health Insurance Marketplace
As of April 2014, 84,601 Georgians had enrolled in Marketplace coverage, most (87%) of whom received premium subsidies to purchase coverage. 36 About one-third (36%) of Marketplace enrollees in Georgia were under age 35.37 Nearly six in ten (57%) were female.38 Over seven in ten enrollees (71%) selected a silver level plan.39 Among all states, Georgia had the 12th largest share of Marketplace-eligible people enroll in a Marketplace plan as of April 2014 (30%) and had the fourth largest share in the South, after Florida, North Carolina, and the District of Columbia (Figure 12).40 Ongoing litigation may potentially affect the availability of premium subsidies in states with a Federally-facilitated Marketplace, such as Georgia; however, until the issue is resolved in court, the federal government will continue to provide premium subsidies.41
During the first ACA open enrollment period, Georgians were able to shop for health plans through HealthCare.gov, the federal Health Insurance Marketplace. Under the ACA, states had the option to establish their own State-based Marketplace, build a Marketplace in partnership with the federal government, or default to the Federally-facilitated Marketplace. Governor Deal announced in November 2012 that Georgia would not set up a State-based Marketplace, making the state one of 27 for which the federal government has established and is running the Health Insurance Marketplace. 42 ,43 Five insurers offered Qualified Health Plans (QHPs) in the Georgia individual Marketplace in 2014, although only one insurer offered plans statewide. At $250 per month, the monthly premium for a Benchmark QHP in Atlanta before tax credits was below the median monthly amount ($258) among major cities across the country.44 Nine insurers in Georgia have proposed to offer plans in the Marketplace for 2015, including three with statewide options. On average, proposed QHP premiums for 2015 show a 7% decrease compared to 2014.45

Support for outreach and enrollment in Georgia is being provided by the federal government and private organizations such as Enroll America. In August 2013, the federal government provided approximately $3.9 million in grant funding to two statewide Navigator entities operating in Georgia– Structured Employment Economic Development Organization (SEEDCO) and the University of Georgia. Both groups worked with networks of partners to help consumers enroll in coverage through the Marketplace and in Medicaid and CHIP. In April 2014, however, the Georgia State Assembly passed HB 707, prohibiting any state-funded entity, including the University of Georgia, from applying for grants to assist consumers with the Affordable Care Act. During the 2014-2015 open enrollment period, Health Care Central Georgia Community Health Works, a consortium of six cancer coalitions throughout the state, will join SEEDCO as the lead consumer assistance agencies in the state. Together, the two agencies received $3.3 million in Navigator grant funding. Georgia’s community health centers have also played an important role in helping individuals enroll into health coverage options. The Department of Health and Human Services awarded federally-qualified health centers (FQHCs) in Georgia more than $5.1 million for Fiscal Years 2013 and 2014 to assist with outreach and enrollment under the ACA.46
Delivery System and the Safety Net
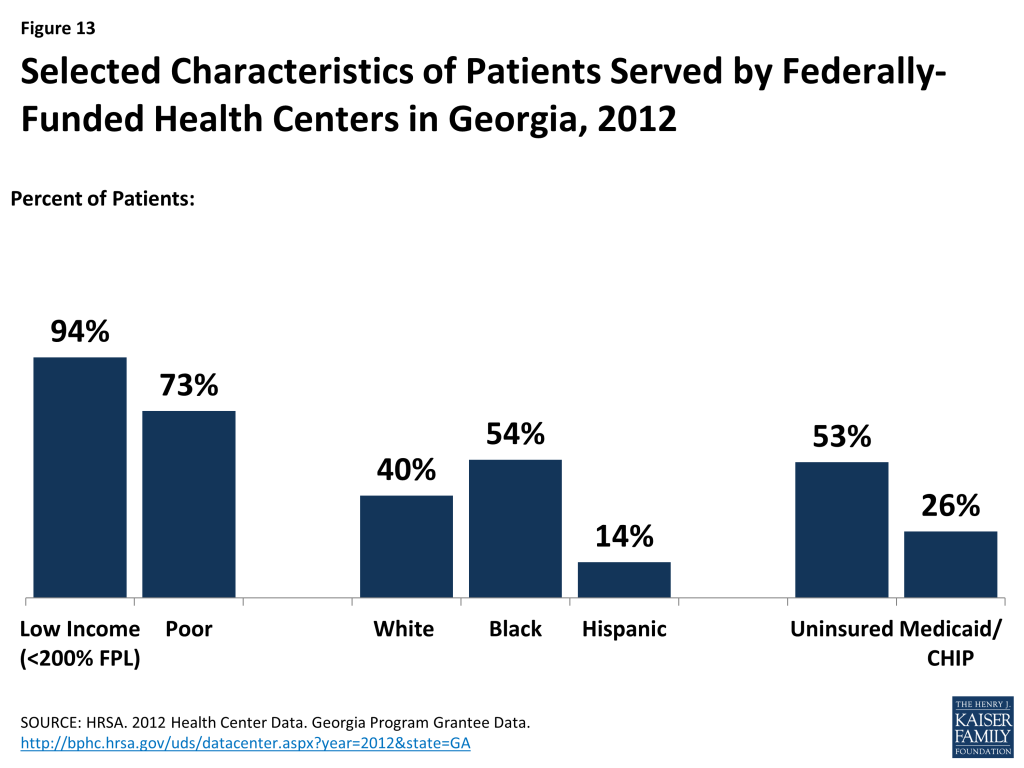
Georgia’s health care delivery system, including its safety net providers, will continue to play an important role in delivering health care to the state’s vulnerable populations. Georgia’s community health centers and hospitals provide access to needed primary, preventive, and acute care services for low-income and underserved residents. Georgia is home to 29 federally qualified health centers (FQHCs), together operating 161 clinic sites throughout the state.47 In 2012, the state’s FQHCs saw over 320,000 patients and had nearly 1 million patient visits.48 Over half (53%) of patients were uninsured, while 26% had Medicaid or CHIP.49 Nearly all (96%) were low-income, including about three-quarters (73%) who had income below poverty.50 (Figure 13).
Despite Georgia’s existing safety net, there are Health Professional Shortage Areas (HPSAs) and unmet need for care. As of August 2014, 59% of the primary health care need in Georgia was being met and Georgia had 193 primary care HPSAs.51 Only 45% of the need for mental health care services and 28% of the need for dental services were being met, and the state had 92 mental health and 181 dental HPSAs.52 There are five medical schools in Georgia, with ten teaching hospitals and over 2,300 residency positions within the state.53 As of 2011, Georgia ranked 41st in the country for the ratio of residents to 100,000 population (20 in GA, compared to 35.8 nationally). However, nearly half (49%) of physicians completing their graduate medical education in Georgia remain in-state to practice – a rate similar to the national average of 48%.54 Georgia is one of 12 states with laws restricting the autonomy of nurse practitioners in at least one area of their practice.55
Recent financial challenges and rising costs for caring for uninsured patients have led several Georgia hospitals to close in recent years. Georgia has 57 safety net hospitals and 21 rural hospitals.56 In FY 2012, the state spent $15,817,421, or 5% of total Medicaid spending that year on Disproportionate Share Hospital (DSH) payments, which are intended for hospitals treating the uninsured and underinsured.57 Reductions in funding and increased costs for caring for the uninsured have led four large rural hospitals in Georgia to close in the past two years. Eight hospitals in the state have shut down since 2000. These closures may increase pressures on existing hospitals in the state and further reduce the ability of patients to access needed care, particularly in rural areas.
Looking Ahead
With over 9.6 million residents, Georgia is one of the most populous states in the U.S., and the health and health care of its people have important implications for the South and the nation at large. More than one in five nonelderly people in Georgia is uninsured, and high unemployment rates and poorer than average health care outcomes for many measures suggest a greater need for health coverage among many low-income Georgians.. The ACA provides the opportunity to extend coverage to the majority of these uninsured individuals; however, since the state is not expanding its Medicaid program at this time, nearly one in five uninsured individuals (22%) may remain without affordable health coverage options. Outreach and education at the state and local level are important in engaging those who are eligible for new coverage under the ACA to enroll and appropriately access and utilize care. Further, the state’s safety net providers remain an important source of health care services both to the newly insured and to those who remain without affordable health coverage options.
There is much to watch in Georgia looking forward. Individuals who have newly gained coverage in the Marketplace are beginning to interact with their new health plans and seek needed care. Georgia may decide to revisit its Medicaid expansion decision and broaden coverage for low-income uninsured adults. Meanwhile, the health care system in Georgia, like all states, is evolving and changing to meet new demands as providers adapt to the changing health coverage landscape. It remains to be seen how these and other changes under the ACA will affect the health, health care access, and health care utilization of Georgians in the long term.
Appendix

- World Atlas, United States, http://www.worldatlas.com/aatlas/infopage/usabysiz.htm. ↩︎
- U.S. Census Bureau: State and County QuickFacts. Data derived from Population Estimates, American Community Survey, Census of Population and Housing, State and County Housing Unit Estimates, County Business Patterns, Nonemployer Statistics, Economic Census, Survey of Business Owners, Building Permits ↩︎
- Ibid. ↩︎
- KCMU/Urban Institute analysis of 2012 and 2013 ASEC Supplement to the CPS. ↩︎
- Georgia and state figures from Table 3, Civilian Labor Force and Unemployment by State and Selected Area, Seasonally Adjusted (August 18, 2014), http://www.bls.gov/news.release/laus.t03.htm. U.S. figure from Bureau of Labor Statistics, Unemployment Rate (Seasonally Adjusted) (August 18, 2014), http://data.bls.gov/cgi-bin/surveymost?bls. ↩︎
- Governor Nathan Deal, The Governor’s Budget Report, Fiscal Year 2015, https://opb.georgia.gov/sites/opb.georgia.gov/files/related_files/document/FY2015GovernorsReport.pdf. ↩︎
- Ibid. ↩︎
- Bureau of Economic Analysis, Gross Domestic Product by State 2014 (June 6, 2013). ↩︎
- Ibid. ↩︎
- U.S. Bureau of Economic Analysis, Current-Dollar GDP by State, Georgia, 2005:I-2013:IV ↩︎
- United Health Care Foundation, America’s Health Rankings-Senior Report: State Ranking Overview: 2014 (2014), http://www.americashealthrankings.org/rankings. ↩︎
- The Commonwealth Fund. Scorecard on State Health System Performance, 2014. http://www.commonwealthfund.org/publications/fund-reports/2014/apr/2014-state-scorecard ↩︎
- The Centers for Disease Control and Prevention (CDC), National Center for Health Statistics, Division of Vital Statistics, National Vital Statistics Reports (NVSR) Volume 61, Number 4, Table 19, May 8, 2013, http://www.cdc.gov/nchs/data/nvsr/nvsr61/nvsr61_04.pdf). ↩︎
- The Centers for Disease Control and Prevention (CDC), National Center for Health Statistics, Division of Vital Statistics , National Vital Statistics Reports (NVSR) Volume 61, Number 4, Table 19, May 8, 2013, http://www.cdc.gov/nchs/data/nvsr/nvsr61/nvsr61_04.pdf). ↩︎
- K. Kost and S. Henshaw. “U.S. Teenage Pregnancies, Births and Abortions, 2010: National and State Trends by Age, Race and Ethnicity.” http://www.guttmacher.org/pubs/USTPtrends10.pdf. ↩︎
- KCMU/Urban Institute analysis of 2012 and 2013 ASEC Supplement to the CPS. ↩︎
- Georgia Department of Community Health . Press Release. DCH Receives $2.5 Million Grant to Enhance Medicaid, Peachcare for Kids. August 25, 2011. http://dch.georgia.gov/press-releases/2011-08-25/dch-receives-25-million-grant-enhance-medicaid-peachcare-kids ↩︎
- G. Kenney, N. Anderson, and V. Lynch. Medicaid/CHIP Participation Rates Among Children: An Update. September 2013. ↩︎
- KCMU/Urban Institute estimates based on data from FY 2010 MSIS and CMS-64 reports, 2012. ↩︎
- Kaiser Commission on Medicaid and the Uninsured and Urban Institute estimates based on data from FY 2010 MSIS and CMS-64 reports. ↩︎
- Federal Register, November 30, 2012 (Vol 77, No. 231), pp 71420-71423, at http://www.gpo.gov/fdsys/pkg/FR-2012-11-30/pdf/2012-29035.pdf. ↩︎
- Martha Heberlein, Tricia Brooks, Joan Alker, Samantha Artiga, and Jessica Stephens, Getting into Gear for 2014: Findings from a 50-State Survey of Eligibility, Enrollment, Renewal, and Cost-Sharing Policies in Medicaid and CHIP, 2012-2013 (January 2013), http://modern.kff.org/medicaid/report/getting-into-gear-for-2014-findings-from-a-50-state-survey-of-eligibility-enrollment-renewal-and-cost-sharing-policies-in-medicaid-and-chip-2012-2013/ and Federal Register, November 30, 2012 (Vol 77, No. 231), pp 71420-71423. ↩︎
- National Association of State Budget Officers (NASBO), State Expenditure Report (November 2013), http://www.nasbo.org/sites/default/files/State%20Expenditure%20Report%20%28Fiscal%202011-2013%20Data%29.pdf. ↩︎
- NASBO, State Expenditure Report (November 2013). ↩︎
- Ibid. ↩︎
- MaryBeth Musumeci, A Guide to the Supreme Court’s Affordable Care Act Decision (Kaiser Family Foundation, June 2012), https://modern.kff.org/health-reform/issue-brief/a-guide-to-the-supreme-courts-affordable/. ↩︎
- State Health Facts, Status of State Action on the Medicaid Expansion Decision, 2014 (August 28, 2014), https://modern.kff.org/health-reform/state-indicator/state-activity-around-expanding-medicaid-under-the-affordable-care-act/. ↩︎
- Kaiser Commission on Medicaid and the Uninsured, A Closer Look at the Impact of State Decisions Not to Expand Medicaid on Coverage for Uninsured Adults (Kaiser Family Foundation, April 2014), https://modern.kff.org/medicaid/fact-sheet/a-closer-look-at-the-impact-of-state-decisions-not-to-expand-medicaid-on-coverage-for-uninsured-adults/ ↩︎
- The Economic Impact of Medicaid Expansion in Georgia, William S. Custer, Ph.D. Institute of Health Administration, J. Mack Robinson College of Business, Georgia State University, February 2013 ↩︎
- http://gov.georgia.gov/sites/gov.georgia.gov/files/related_files/document/HB%20990.pdf ↩︎
- Kaiser Commission on Medicaid and the Uninsured, The Coverage Gap: Uninsured Poor Adults in States that Do Not Expand Medicaid (Kaiser Family Foundation, October 2013), http://modern.kff.org/health-reform/issue-brief/the-coverage-gap-uninsured-poor-adults-in-states-that-do-not-expand-medicaid/. ↩︎
- Ibid. ↩︎
- CMS, Medicaid & CHIP Monthly Applications, Eligibility Determinations, and Enrollment Reports: March 2014 (Updated); April 2014 (Updated); May 2014 (Updated), June 2014 (Updated), and July 2014; as of September 22, 2014. ↩︎
- State Health Facts. “Total Medicaid and CHIP Child Enrollment, January- July 2014” (Kaiser Family Foundation, August 8,2014), https://modern.kff.org/other/state-indicator/total-medicaid-and-chip-child-enrollment-2/ ↩︎
- KCMU analysis based on 2014 Medicaid eligibility levels and 2012-2013 CPS. ↩︎
- Office of the Assistant Secretary for Planning and Evaluation (ASPE), Profiles of Affordable Care Act Coverage Expansion Enrollment For Medicaid/CHIP and the Health Insurance Marketplace, 10-1-13 to 3-31-14 (HHS, May 1, 2014), http://aspe.hhs.gov/health/reports/2014/MarketPlaceEnrollment/Apr2014/Marketplace_StateSum.cfm. ↩︎
- State Health Facts. “Marketplace Enrollees by Age” (Kaiser Family Foundation, April 19, 2014), https://modern.kff.org/other/state-indicator/marketplace-enrollees-by-age/ ↩︎
- State Health Facts. “Marketplace Enrollees by Gender” (Kaiser Family Foundation, April 19, 2014), https://modern.kff.org/other/state-indicator/marketplace-enrolles-by-gender/ ↩︎
- State Health Facts. “Marketplace Enrollees by Metal Level” (Kaiser Family Foundation, April 19, 2014), https://modern.kff.org/other/state-indicator/marketplace-enrollees-by-metal-level/ ↩︎
- State Health Facts. “Marketplace Enrollment as a Share of the Potential Marketplace Population” (Kaiser Family Foundation, April 19, 2014), https://modern.kff.org/health-reform/state-indicator/marketplace-enrollment-as-a-share-of-the-potential-marketplace-population/ ↩︎
- Larry Levitt and Gary Claxton, The Potential Side Effects of Halbig (Kaiser Family Foundation, July 31, 2014), https://modern.kff.org/health-reform/perspective/the-potential-side-effects-of-halbig/. ↩︎
- State Health Facts. “State Decisions for Creating Health Insurance Marketplaces” (Kaiser Family Foundation, May 28, 2013), http://modern.kff.org/health-reform/state-indicator/health-insurance-exchanges/. ↩︎
- “Georgia Will Not Set Up Exchange.” Press release from Governor Nathan Deal. November 16, 2012.http://gov.georgia.gov/press-releases/2012-11-16/deal-georgia-will-not-set-state-exchange ↩︎
- State Health Facts, “ 2014 Monthly Premiums for a Single 40-Year-Old at 250 Percent of Poverty in a Major City in Each State” (Kaiser Family Foundation), https://modern.kff.org/other/state-indicator/2014-monthly-premiums-for-a-single-40-year-old-at-250-percent-of-poverty-in-a-major-city-in-each-state/. ↩︎
- http://www.georgiahealthnews.com/2014/07/early-encouraging-glimpse-15-exchange-rates/ ↩︎
- HRSA, Georgia: Health Center Outreach and Enrollment Assistance, http://www.hrsa.gov/about/news/2013tables/outreachandenrollment/ut.html. ↩︎
- HRSA, Health Center and Look-alike Sites Facility Directory (March 3, 2014), http://findahealthcenter.hrsa.gov/Search_HCC.aspx?byCounty=1. ↩︎
- National Association of Community Health Centers, Incorporated (NACHC) analysis of the 2011 Uniform Data System, Bureau of Primary Health Care, Health Resources and Services Administration, Department of Health and Human Services, Special Data Request, March 2013, http://www.nachc.com/client//2012%20Key%20data.pdf. ↩︎
- NACHC analysis of the 2011 Uniform Data System. ↩︎
- National Association of Community Health Centers, Georgia Health Center Fact Sheet, http://www.nachc.com/client/documents/research/GA12.pdf. ↩︎
- Bureau of Clinician Recruitment and Service, Health Resources and Services Administration (HRSA), U.S. Department of Health & Human Services, HRSA Data Warehouse: Designated Health Professional Shortage Areas Statistics, as of August 29, 2014, http://ersrs.hrsa.gov/reportserver/Pages/ReportViewer.aspx?/HGDW_Reports/BCD_HPSA/. ↩︎
- Ibid. ↩︎
- Georgia Board for Physician Workforce, Spotlight on Graduate Medical Education, February 2012 , https://gbpw.georgia.gov/sites/gbpw.georgia.gov/files/imported/GBPW/ ↩︎
- Association of American Medical Colleges. 2011 State Physician Workforce Data Book, November 2011 https://www.aamc.org/download/263512/data/statedata2011.pdf ↩︎
- American Association of Nurse Practitioners, State Practice Environment 2013, http://www.aanp.org/legislation-regulation/state-legislation-regulation/state-practice-environment. ↩︎
- http://dch.georgia.gov/sites/dch.georgia.gov/files/related_files/document/Safety_Net_Hospitals_2011_Survey_Cycle.pdf ↩︎
- State Health Facts. “Distribution of Medicaid Spending by Service, FY 2012” (Kaiser Family Foundation, September 16, 2014), https://modern.kff.org/medicaid/state-indicator/distribution-of-medicaid-spending-by-service/ ↩︎