The California Health Care Landscape
The Affordable Care Act (ACA) went into full effect on January 1, 2014, ushering in health insurance reforms and new health coverage options in California and elsewhere across the country. Prior to 2014, under a waiver, California undertook an early expansion of Medi-Cal, the state’s Medicaid program, and enacted innovative strategies to redesign the health care delivery system within its safety net. In 2014 and 2015, millions more gained coverage through Covered California, the state’s health insurance Marketplace, and through further expansions in Medi-Cal. Building on these reforms, the state is continuing to expand eligibility and redesign delivery systems with the goal of providing efficient, high-quality care to state residents. This fact sheet provides an overview of population health, health coverage, and the health care delivery system in California in the era of health reform.
Demographics
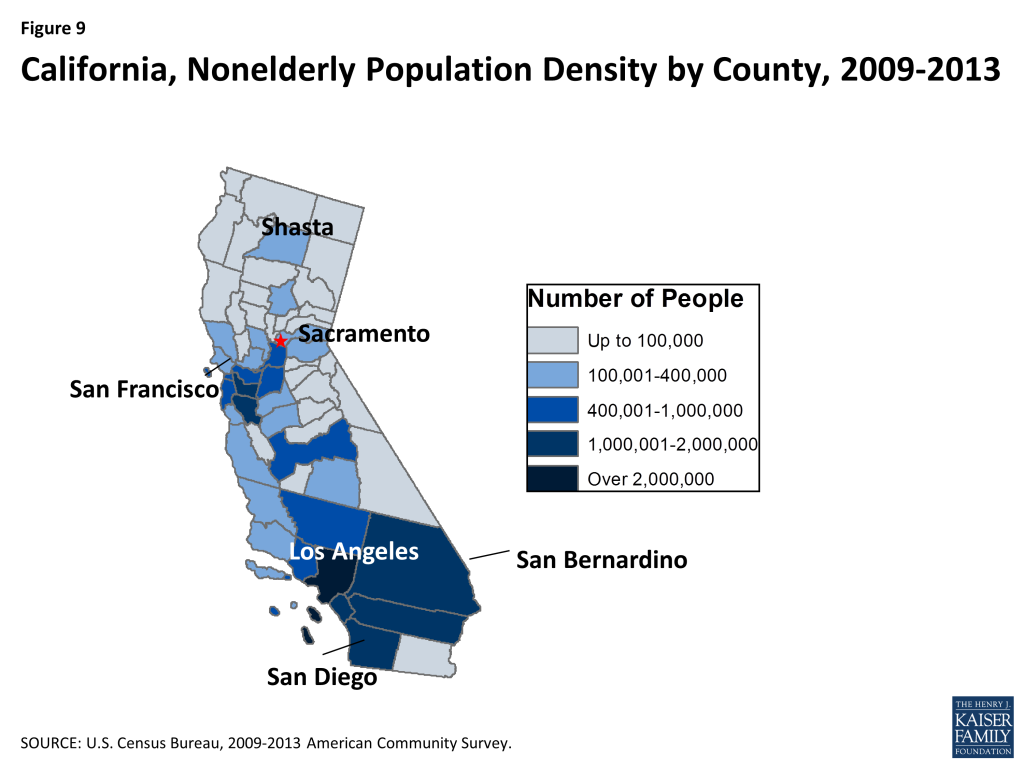
California is home to over 38 million people, making it the most populous state in the U.S. With nearly 156,000 square miles, California is the 3rd largest state in terms of geography.1 While about a third of the state’s total surface area is made up of forest,2 the vast majority of state residents (95%) live in urban areas, and half are concentrated in Southern California in just 5 of the state’s 58 counties. Los Angeles and San Diego counties alone account for a third of the state’s population.3
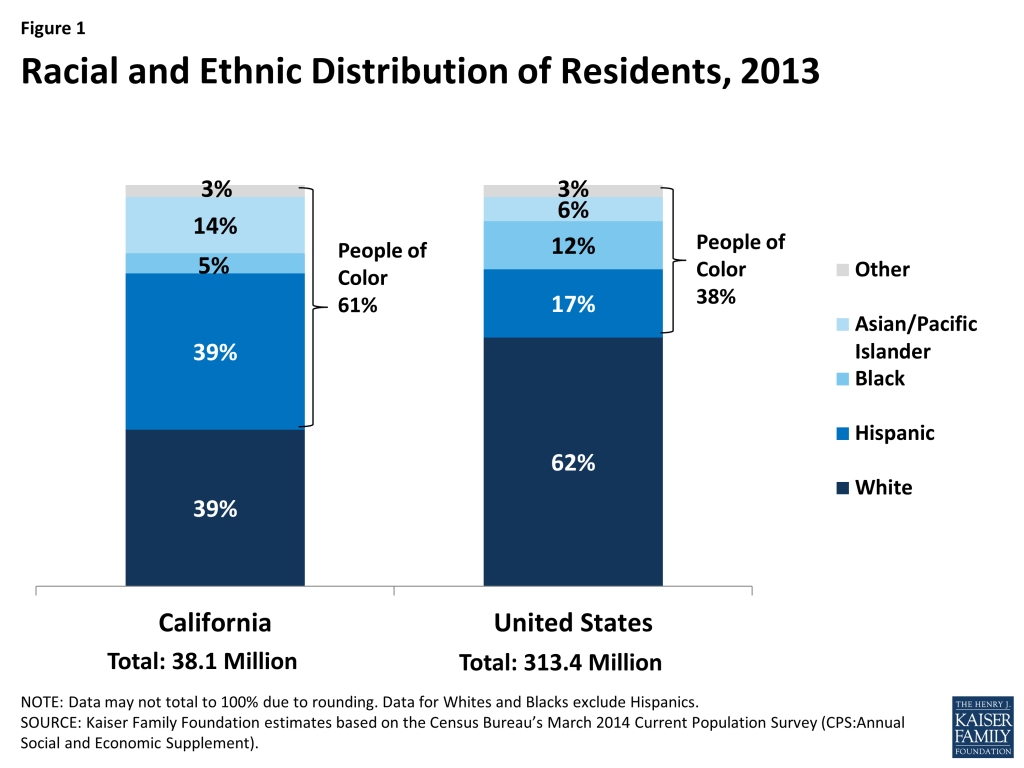
California’s population is highly diverse (Table 1). Unlike most states in the U.S., California’s population is majority minority, with 39% of residents identifying as White, another 39% as Hispanic, 14% as Asian, 5% as Black, and 3% as another race/ethnicity (Figure 1).4 Over a quarter (27%) of the population is foreign born5 and 12% are non-citizens, representing approximately 22% of non-citizens nationally.6 Over four in ten (44%) residents speak a language other than English in the home, a rate more than double that of the national average (21%),7 and nearly one in five (19%) speak English less than “very well.”8 By contrast, the age distribution in the state resembles national averages, with nonelderly adults representing the majority of the population (62%) followed by children (25%) and the elderly (12%).
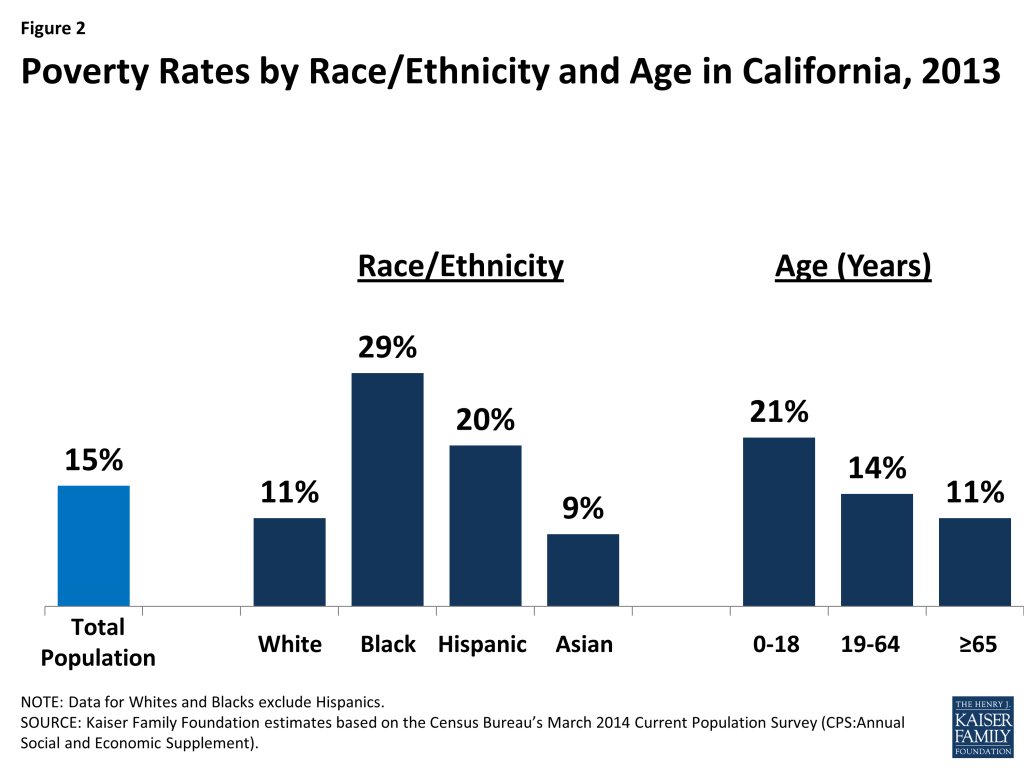
Poverty rates in California reflect national averages and vary by race/ethnicity and age (Table 1). In 2013, over 5.7 million Californians, or 15% of the state’s population, were living in poverty, a decrease since 2011 when the poverty rate reached 17%.9 Blacks (29%) and Hispanics (20%) in California are significantly more likely to be poor than Whites (11%) and Asians (9%).10 The overall poverty rate and rates by race/ethnicity are consistent with national averages. However, the cost of living in California is among the top four highest in the country, so low-income people in California may have a harder time making ends meet than in other places; a family of four in California would need to earn $137,643 in a middle cost urban area to have purchasing power equal to 400% of the federal poverty level ($97,000).11 As in most other states, children in California are more likely than adults to live in a poor household and as of 2013, over one in five (21%) children in the state were living in poverty, compared to 14% of nonelderly adults and 11% of seniors (Figure 2).12
| Table 1: Selected Demographic Characteristics of the Californian Population,Compared to the United States Overall, 2013 | ||
| California | United States | |
| Race/Ethnicity | ||
| White | 39% | 62% |
| Black | 5% | 12% |
| Hispanic | 39% | 17% |
| Asian | 14% | 6% |
| Other Race/Ethnicity | 3% | 3% |
| Age | ||
| 0-18 | 25% | 25% |
| 19-64 | 62% | 61% |
| 65+ | 12% | 14% |
| Citizenship Status | ||
| Citizen | 88% | 93% |
| Non-Citizen | 12% | 7% |
| Distribution of Population byFederal Poverty Level | ||
| Under 100% | 15% | 15% |
| 100-199% | 21% | 19% |
| 200-399% | 28% | 30% |
| 400% + | 36% | 36% |
| NOTE: Data may not sum to 100% due to rounding and data restrictions.SOURCES: Kaiser Family Foundation estimates based on the Census Bureau’s March 2014 Current Population Survey (CPS: Annual Social and Economic Supplement). | ||
State Economy
California’s economy continues to recover after the recession, but unemployment remains high. California, like most states, experienced a decline in GDP during the Great Recession, but the economy has experienced marked improvements since then. In 2014, California’s per capita real GDP was $54,462 compared with the national average of $49,469.13 While the national real GDP grew by 2.2% from 2013 to 2014, California’s grew by 2.8%, placing it among the top nine highest GDP growth rates in the US.14 The largest industry sector in the state is finance, insurance, real estate, rental and leasing, which accounted for 21% of total GDP in 2014. Education, health care and social assistance contributed to 7% of total GDP, a share slightly less than the national average (8%).15 The unemployment rate has also significantly improved since the recession, declining from a height of 12.2% in October 2010 to 6.3% in June 2015.16 However, California’s unemployment rate remains well above the national rate of 5.3% with nearly 1.2 million people in California remaining unemployed as of June 2015.17
Budget actions, tax increases and a strengthening economy have helped to improve California’s fiscal outlook since 2012. In addition to state actions to control costs and raise revenues, the state’s economy also improved. Economic recovery resulted in sharp increases in personal income tax collection and soaring stock prices in 2013, which led to higher than projected revenues.18 After nearly a decade of recurring budget deficits, the peak of which was $45.5 billion in FY2010,19 California experienced a budget surplus in FY 2015 and projected a surplus for FY 2016.20
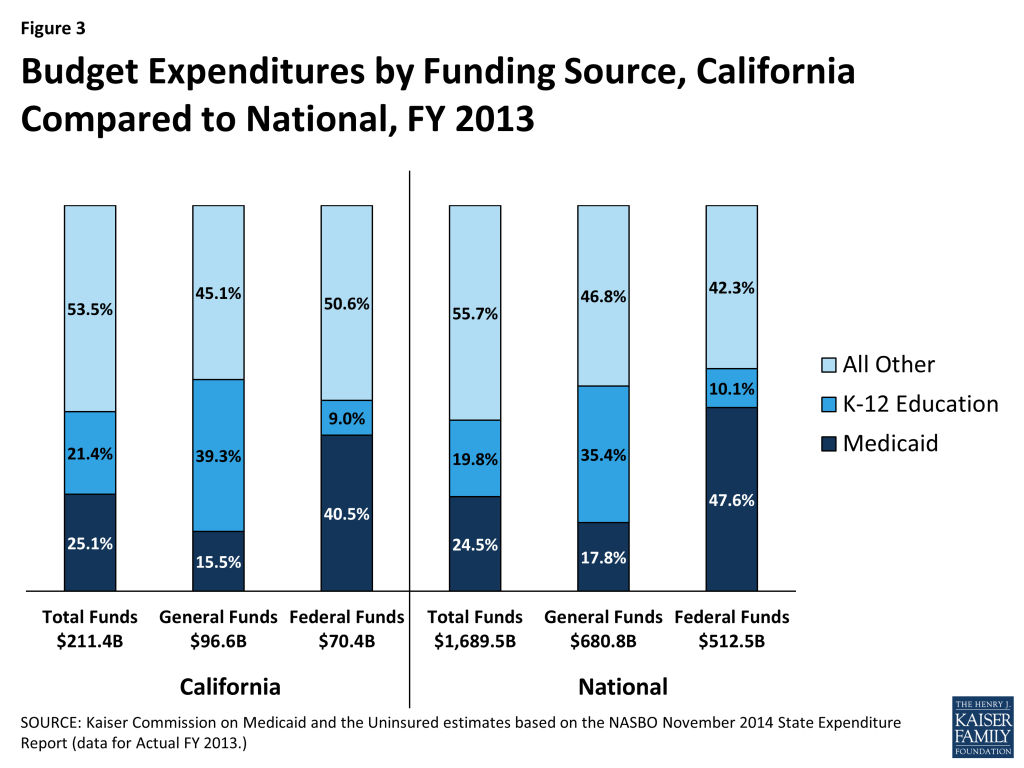
Medi-Cal acts as both a source of state budget expenditures as well as a source of federal revenue. In FY2013, California spent just over a quarter (25.1%) of its total funds on Medi-Cal, compared to the national average of 24.5%. However, because Medicaid is jointly funded by states and the federal government, California gets at least $1 in federal funds for every $1 it spends from its own resources on the program. Due to this funding structure as well as state constitutional requirements related to K-12 funding in California, Medi-Cal represents only 15.5% of total general fund spending, a far second to K-12 education. Meanwhile, Medi-Cal represents the largest share of federal funds flowing into the state (40.5%) Provider taxes and local funds, among other funding sources, contributed to Medi-Cal funding in FY2013.
Population Health
California ranks above the national average on many measures of population health but faces substantial environmental health challenges. On overall health measures, California ranks 17th among the 50 states in the United Health Foundation’s report, America’s Health Rankings 2014.21 Compared to other states, California has among the five lowest rates of smoking, obesity, and physical inactivity, and violent crime has decreased by 54% since 1990.22 However, high levels of air pollution as well as an extended period of severe and unprecedented droughts23 present continuous public health challenges to the state.
Disparities in health access and outcomes exist in California (Table 2). As in other states across the country, measures of health status and access vary by race/ethnicity in California (Table 2). Whites (14%) are more likely to smoke than Hispanics (10%) and nearly as likely as Blacks (15%) to do so, but a smaller share of Whites report being in fair or poor health, poor mental health, having diabetes, or being overweight or obese compared to Blacks and Hispanics. In addition, Hispanics (57%) and Asians (74%) in California are less likely than Whites (81%) to report having a usual source of care. Disparities in health factors and outcomes also exist across California’s 58 counties, with poor rural counties, especially those in the north and Central Valley, faring worse than urban ones on measures such as life expectancy, health behaviors, clinical care and environmental factors.24
| Table 2: Selected Measures of Health Status and Health Access for Adults by Race/Ethnicity in California Compared to the United States, 2013 | |||||||||
| Health Indicators | California | United States | |||||||
| White | Black | Hispanic | Asian | White | Black | Hispanic | Asian | ||
| Fair or poor health | 13% | 20% | 29% | 12% | 16% | 23% | 26% | 10% | |
| Mental Distress | 36% | 39% | 38% | 35% | 33% | 36% | 34% | 30% | |
| Smoke | 14% | 15% | 10% | 10% | 19% | 20% | 14% | 11% | |
| Diabetes | 8% | 20% | 12% | 10% | 9% | 14% | 11% | 8% | |
| Are overweight or obese | 57% | 74% | 69% | 40% | 63% | 73% | 68% | 41% | |
| Have a usual source of care | 81% | 82% | 57% | 74% | 82% | 74% | 59% | 72% | |
| Data may not sum to 100% due to rounding and data restrictions. Data for Whites and Blacks exclude Hispanics.SOURCES: Center for Disease Control and Prevention (CDC)’s Behavioral Risk Factor Surveillance System (BRFSS) 2013 Survey Results. | |||||||||
State and local efforts are underway to address health disparities in California. California’s Office of Health Equity (OHE) was integrated into the California Department of Health in 2012 to provide a leadership role in reducing health and mental health disparities among vulnerable communities, including racial minorities, the LGBT community, persons with disabilities, and undocumented immigrants. Among its major initiatives, the OHE has launched the California Reducing Health Disparities Project (CRDP), an initiative to reduce mental health disparities in the state. The Office also has a Climate Change and Public Health Team which has issued two reports on how to reduce the impact of climate change with an emphasis on vulnerable communities.25 In addition, through the leadership of OHE, the state is encouraging Health in All Policies (HiAP), a collaborative approach to improving the health of all people by incorporating health, equity, and sustainability considerations into decision-making across sectors and policy areas.26
Health Coverage in California Before the ACA
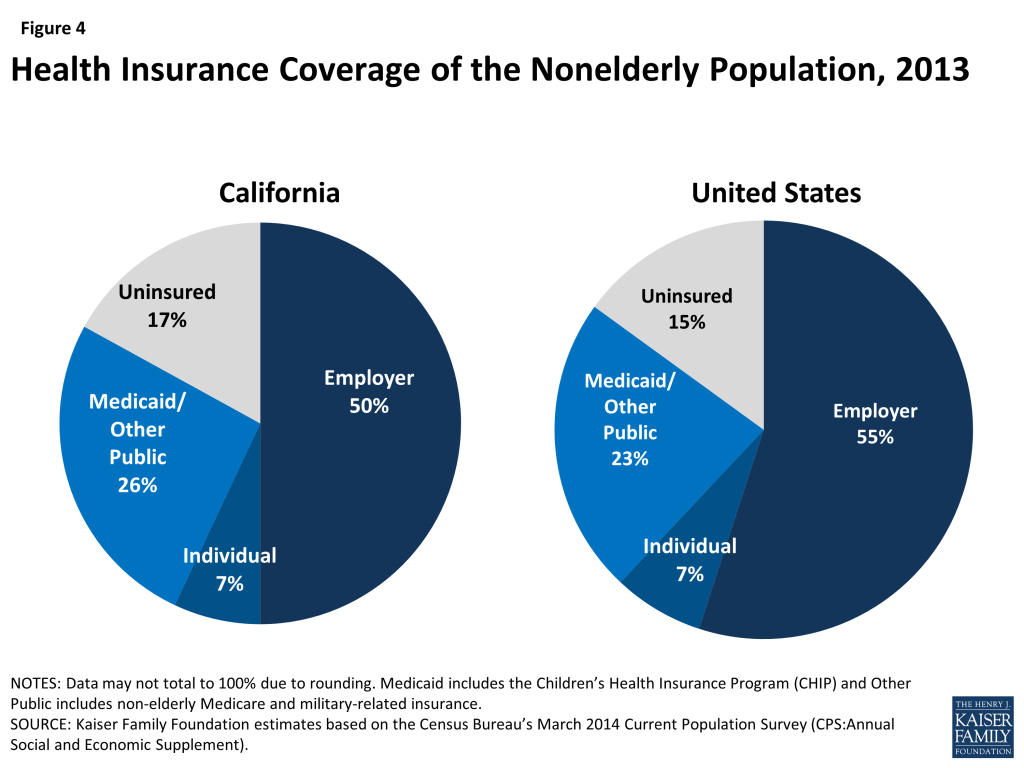
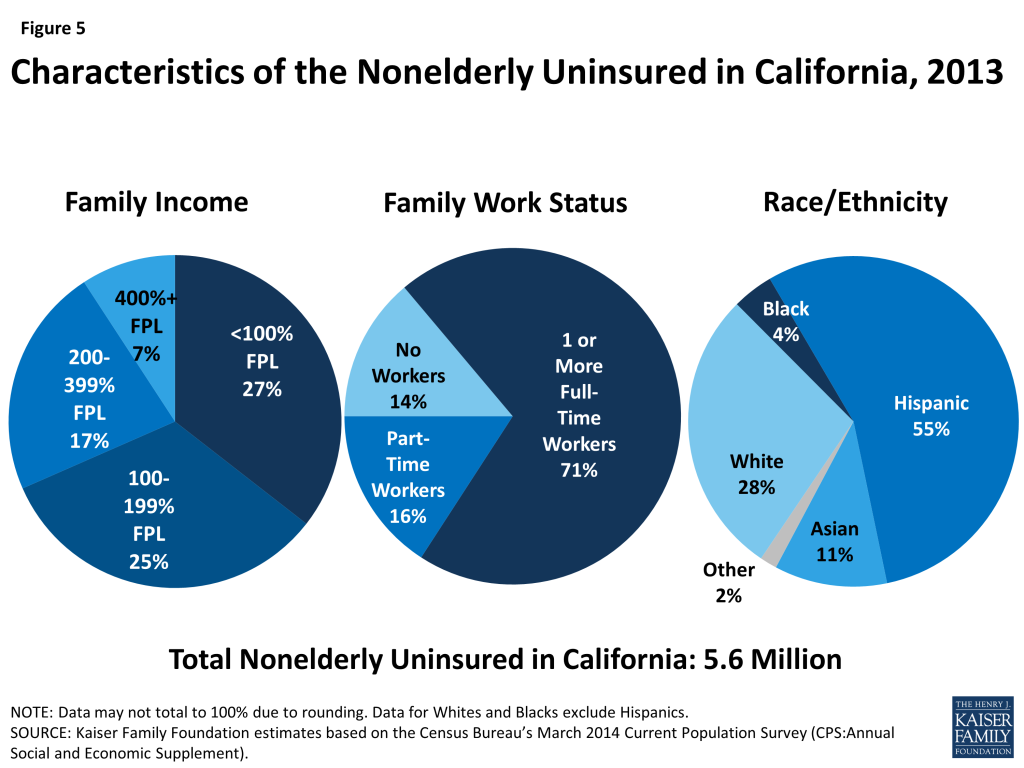
Prior to ACA implementation, California had the largest number of uninsured of any state in the country. In 2013, just before the major coverage expansions of the ACA went into effect, 5.8 million nonelderly Californians (15%) were uninsured, and California alone accounted for 14% of all nonelderly uninsured people nationwide.27 In 2013, half of nonelderly Californians were covered under an employer plan, while over a quarter (26%) were enrolled in Medi-Cal, or other public coverage (Figure 4).28 Private coverage rates in the state were low due to a combination of high unemployment (which limited access to employer coverage) and high premium costs for non-group coverage29 (which made such coverage unaffordable for many). Pre-ACA public coverage through Medi-Cal was limited to only some groups of low-income adults, leaving many without an affordable coverage option.
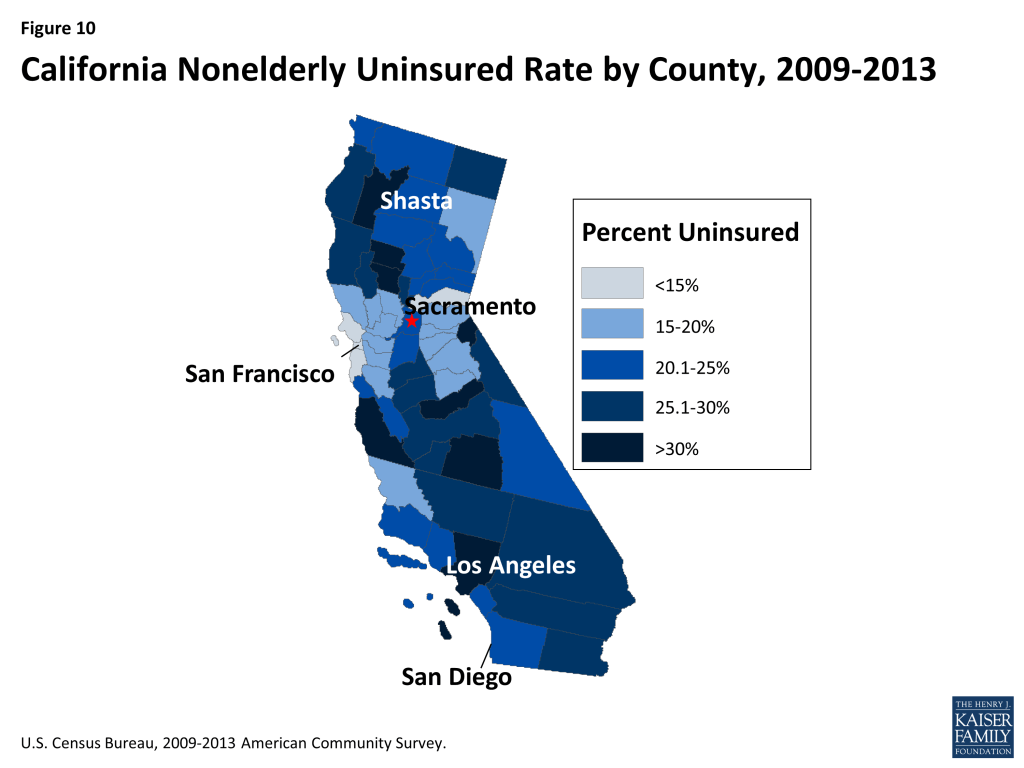
As in other states across the U.S., the majority of nonelderly uninsured people in California had at least one full-time worker in their household (71%), and more than half (52%) had incomes below 200% FPL. Over half (55%) of nonelderly uninsured Californians identify as Hispanic, over a quarter (28%) identify as White, 4% as Black, 11% as Asian, and 2% as another race/ethnicity (Figure 5).30 As shown in Figure 10 (Appendix), the nonelderly uninsured in California are not equally distributed across the state, with the San Francisco Bay Area and surrounding counties generally having lower rates of uninsured than other areas of the state.
Before the ACA, Medi-Cal helped fill gaps in the availability of private coverage but was limited to certain groups. As of 2013, 41% of children were enrolled in Medi-Cal compared to 15% of nonelderly adults, reflecting differences in eligibility levels, as well as poverty levels, between these two groups.31 Historically, Medi-Cal eligibility for adults has been limited to parents with very low income. In 2013 children up to 250% FPL and pregnant women up to 300% FPL (under the CHIP unborn child option) were eligible for Medi-Cal or CHIP, while eligibility for working parents was 106% FPL (100% for non-working parents).32 Adults without dependent children were not eligible for Medi-Cal. However, since 2010, parents and other adults living in a county participating in the Low-Income Health Program (LIHP) were eligible for coverage under a waiver that provided more limited benefits than Medi-Cal (discussed in more detail below). Medi-Cal also covered individuals with disabilities and provided wrap-around coverage for many elderly in the state.
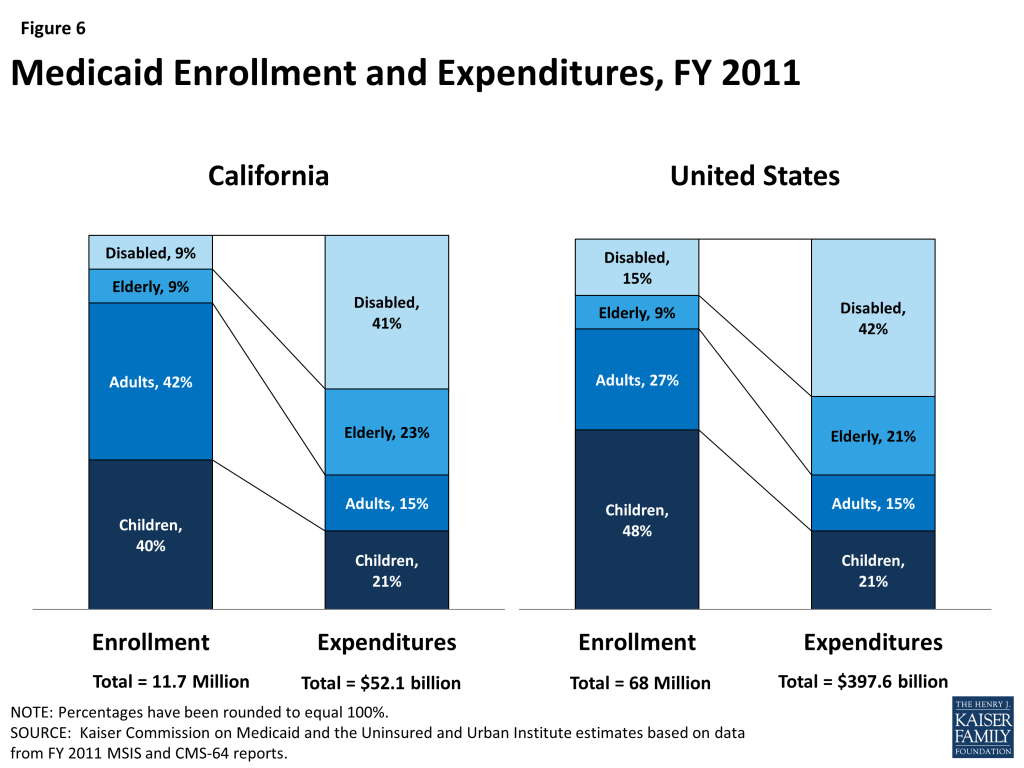
In 2011, the majority of Medi-Cal beneficiaries were children and non-elderly adults, but the elderly and people with disabilities accounted for most of the program’s expenditures. While most Medi-Cal enrollees in 2011 were children and adults (82%),33 they accounted for slightly over a third (36%) of total Medi-Cal expenditures.34 Conversely, the elderly and people with disabilities accounted for less than one-fifth (18%) of enrollees35 but nearly two-thirds (64%) of total program costs (Figure 6).36 Average spending per beneficiary in California in 2011 was $4,468, the fifth lowest in the country and below the national average of $5,790.37 Medicaid costs are shared by states and the federal government; for most services and groups before the ACA, the federal government paid 50% of Medi-Cal costs in California.38
In January 2013, children enrolled in California’s separate CHIP program began transitioning to Medi-Cal. Prior to 2013, California had a separate Children’s Health Insurance Program (CHIP) called the Healthy Families Program (HFP). Beginning in January 2013, the state phased out this program and transitioned over 750,000 children from HFP into Medi-Cal. The state continues to receive enhanced CHIP matching funds for children in the income group previously covered through Healthy Families.39 While some access issues resulting from the transition were reported, the majority of children maintained access to the same primary care provider that they had while enrolled in HFP and still receive comprehensive health, dental, mental health and substance abuse services under Medi-Cal, according to a comprehensive report issued by the California Department of Health Care Services.40
Health Coverage Under The Affordable Care Act in California
A main goal of the Affordable Care Act (ACA) was to extend health coverage to many of the 42 million nonelderly uninsured individuals across the country, including many of the 5.8 million who lived in California.41 The ACA accomplishes this through insurance market reforms and by establishing new coverage pathways, including expanding Medicaid and providing premium subsidies to most individuals with incomes from 100 to 400% FPL to purchase coverage on the Health Insurance Marketplace. California expanded Medi-Cal to cover nearly all nonelderly adults with incomes at or below 138% FPL ($16,242 per year for an individual and $27,724 for a family of three in 2015) and established its own marketplace, called Covered California.
Leading up to and throughout ACA implementation, the state invested heavily in outreach and enrollment efforts for both Medi-Cal and Covered California. These efforts included statewide marketing campaigns, community mobilization, provider training, and targeted efforts to reach vulnerable populations who may be newly eligible for coverage. Covered California also established an Assisters Program and worked with community organizations to provide direct assistance to consumers to help them enroll in coverage. In addition, the state received extensive federal and private funds, most of which were distributed to localities, for local outreach efforts. These local outreach efforts included support for Medi-Cal Certified Enrollment Counselors, outreach to hard-to-reach populations, and marketing to increase awareness and understanding of new coverage options.42 , 43 , 44 In addition, 125 health centers operating over 1,000 sites throughout the state received federal grants to help with outreach and enrollment assistance.45 Supported by federal funding under the ACA, new grants in 2015 provided funding for the existing Covered California Outreach and Education Program, in-person enrollment assistance programs, and community outreach campaigns.46
Medi-Cal Expansion
California was one of a handful of states to undertake an early expansion of its Medicaid program in anticipation of full expansion in 2014. The state did so under its five-year “Bridge to Reform” §1115 Medicaid Demonstration Waiver, which was approved by the federal government in 2010. In addition to other provisions, the waiver allowed for federal matching funds for the creation of a county-based coverage expansion program, known as the Low-Income Health Program (LIHP), which covered low-income adults who were not otherwise eligible for Medi-Cal. The majority of counties participated in LIHP, and by the end of 2013, over 650,000 adults were enrolled in the program.47 The benefits provided under the waiver were more limited than Medi-Cal. These individuals were either auto-enrolled in Medi-Cal or transferred to Covered California when ACA coverage expansions became available in January 2014.48
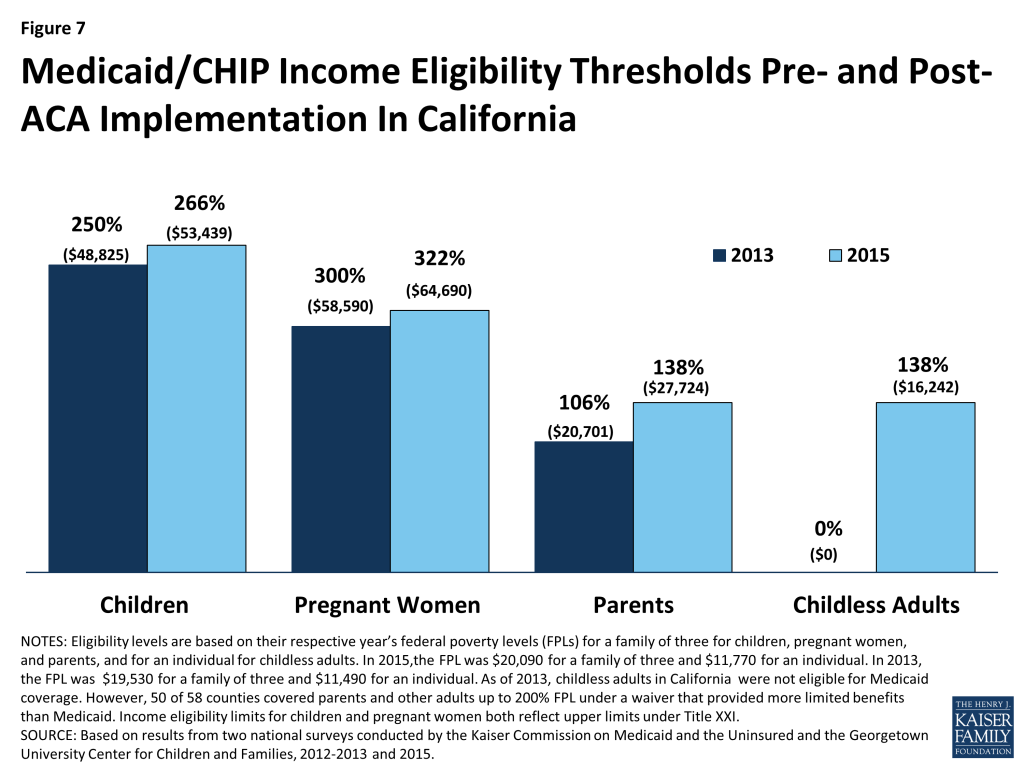
The ACA Medicaid expansion resulted in increased Medi-Cal income eligibility levels for parents and other adults. Under the ACA expansion, nearly all citizens and legal immigrants who have been in the country for over five years with income at or below 138% FPL ($16,242 per year for an individual or $27,724 for a family of three in 2015) are eligible for Medicaid, and states receive substantially enhanced federal matching funds for this expansion population. As a result, eligibility levels for parents and childless adults increased after full ACA implementation.49 ,50 The ACA also changed the method for determining financial eligibility for Medicaid for children, pregnant women, parents, and adults and CHIP to a standard based on modified adjusted gross income (MAGI). As a result, existing Medicaid income limits for these groups were converted to MAGI-equivalent limits (Figure 7). While the converted 2014 standards appear higher than 2013 levels, they are intended to approximate the existing eligibility levels using different methodology for determining income. Enrollment in the Medi-Cal program grew by 37%, or 3.4 million people, between October 2013 and May 2015.51 While some enrollees may have been eligible for Medi-Cal before the ACA, many were likely newly-eligible under the adult expansion.52
Undocumented immigrants and some lawfully-residing immigrants remain ineligible to enroll in Medi-Cal. Under federal law, undocumented immigrants remain ineligible to enroll in federally-funded full Medi-Cal coverage. In addition, many lawfully present immigrants are subject to a five-year waiting period before they may enroll in Medi-Cal, and some groups of lawfully present immigrants remain ineligible regardless of their length of time in the country. However, the state has taken several actions to expand eligibility for immigrants. For example, it has taken up the options available to states to eliminate the five-year waiting period for lawfully-residing immigrant children and pregnant women. In addition, it extends coverage to pregnant women with incomes up to 322% FPL regardless of immigration status through the CHIP unborn child option.53 Recent state legislation would further expand coverage for undocumented immigrants. Senate Bill 4, known as the Health Care for All Act, passed the State Senate in June 2015. This bill would provide fully state-funded Medi-Cal coverage for children age 19 and under, regardless of immigration status.54 Some local programs in the state also cover immigrant children regardless of immigration status.
Under the ACA, all states are required to implement new simplified eligibility and enrollment processes. To implement these new processes, the state received federal funding to create a single online portal, available in Spanish and English, where users can apply and receive eligibility determinations for Medi-Cal or Marketplace insurance. The application can also be completed in-person, by phone, fax or mail, and paper applications are available in thirteen languages. In addition, the state adopted the Express Lane Enrollment Project to target adults and children enrolled in California’s Supplemental Nutrition Assistance Program (SNAP), known as CalFresh. Covered California’s online application system, also known as the California Health Care Eligibility, Enrollment and Retention System (CalHEERS), coordinates with county social services departments through an online system called Statewide Automated Welfare Systems (SAWS).55 However, like many states, California experienced outreach and enrollment challenges in 2014, including a shortage of in-person assisters,56 problems with cultural and linguistic resources,57 technological issues with the Covered California website,58 and a Medi-Cal backlog,59 which led to delayed or abandoned applications. Through late 2014 and 2015, the state took action to address many of the challenges it faced during the first open enrollment period, though some challenges remain.
Covered California
California operates its own state-based insurance marketplace, known as Covered California. Through Covered California, individuals who do not have access to another source of affordable coverage are eligible to purchase individual coverage directly from insurers. People with incomes above Medi-Cal eligibility but below 400% of poverty are eligible for premium tax credits, and people with incomes up to 250% of poverty are additionally eligible for cost-sharing subsidies. Legal, permanent residents who have been living in the country for less than five years may purchase health insurance through Covered California and may receive subsidies, but undocumented immigrants are currently prohibited from purchasing insurance in the Marketplace. If SB4, the “Health Care for All” Act is passed in its current form, undocumented Californians would be able to purchase unsubsidized insurance through Covered California.60 In addition, small businesses (up to 50 workers) can offer coverage to their workers via Covered California’s Small Business Health Options Program (SHOP). Beginning on October 1, 2013, individuals and small businesses could begin shopping for health insurance plans, and coverage began in January 2014. Ten health insurance companies offered plans in the Marketplace in both 2014 and 2015. Statewide in 2014, the average premium rate for the lowest cost Bronze plan was $219 per month and $304 per month for the lowest cost silver plan.61 The statewide average rate increased by 4.2% between 2014 and 2015 across plans and benefit designs: 16% of consumers saw their premium remain constant or decrease while the majority (71%) saw increases of up to 8%. In response to consumer feedback, some health plans expanded their provider networks in 2015.62
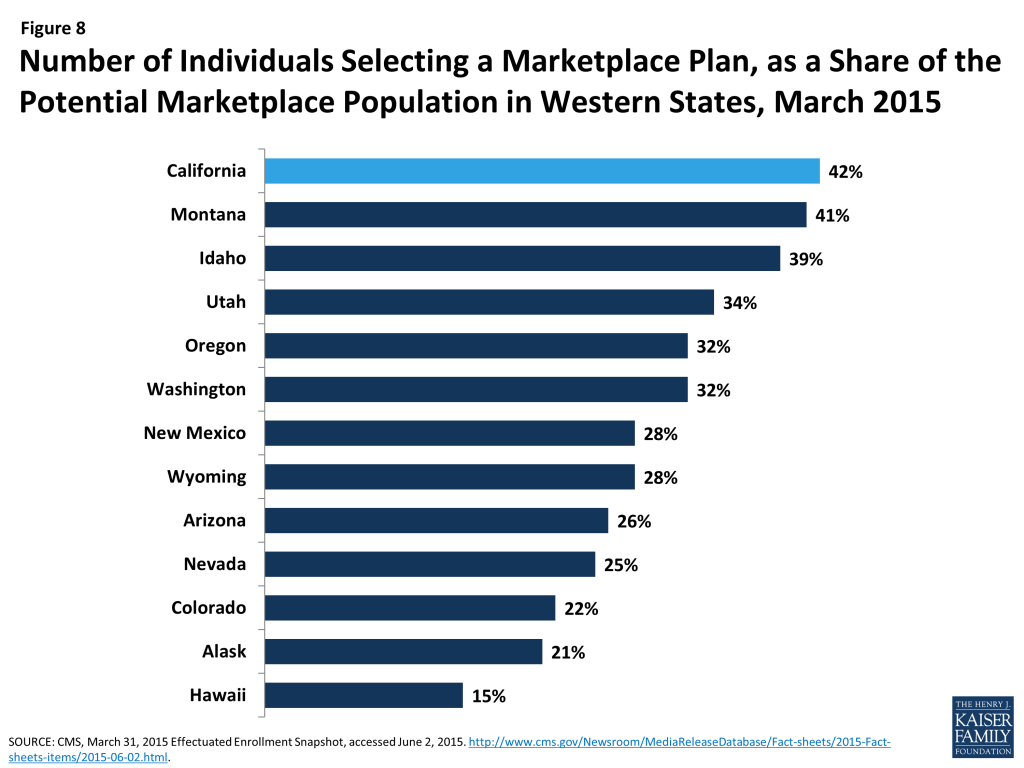
As of March 2015, nearly 1.4 million people were enrolled in a Covered California health plan, representing 42% of the potential Marketplace population (Figure 8).63 Two-thirds (65%) of those enrolling during the second open enrollment period (2014-2015 period) were reenrolling, and over half were between the ages of 45 and 64 (51%).64 Almost nine out of ten (88%) enrollees are receiving premium tax subsides, while half (51%) are additionally receiving cost-sharing subsidies.65
Delivery System and the Safety Net
California’s counties play an important role in the structure and delivery of the state’s health care safety net. Counties in California are required by state law to be the health care providers of last resort for people who are medically indigent. However, significant variation exists with respect to the services provided, the method of delivery and the populations served. Twelve counties are “provider” counties, meaning they own and operate inpatient hospitals and clinics and generally provide coverage to broader groups of people than other counties.66 Five “payer” counties contract with private hospitals and/or clinics for care delivery, and six “hybrid” counties deliver outpatient care in their own clinics but contract with private hospitals for inpatient care. County Medical Service Program (CMSP) counties are part of an association of 35 primarily rural counties that collectively pay private providers for care. County programs are funded by a complicated mix of local, state, and federal funds, including Medi-Cal funds, and are also primary providers of public health services and behavioral health services for low-income, underserved, and uninsured populations.67 In addition, California is home to 129 federally-funded health center organizations, together running 1,225 delivery sites throughout the state. In 2015, the state’s health centers served nearly 3.5 million patients, 38.5% of whom were uninsured.68
California is in the process of reforming its payment and delivery system for safety-net programs with funding from a Medicaid Delivery System Reform Incentive Pool (DSRIP). In 2010, California was the first state to secure a DSRIP waiver designed in large part to continue supplemental payments to public hospitals while also ensuring a level of accountability for the funds. The DSRIP initiative was included in the Bridge to Reform §1115 waiver. California’s $6.67 billion dollar DSRIP initiative ties funding for the public hospitals to projects and milestones in one or more of five priority areas: infrastructure development; innovation and redesign; population-focused improvement; urgent improvement in care; and HIV transition projects.69 ,70 On average, each public hospital system is carrying out 15 simultaneous projects with an average of 217 milestones per year.71
On March 27, 2015, California submitted a renewal application for its Medicaid §1115 waiver, which is being renamed “Medi-Cal 2020.” The renewal requests authority for a series of delivery system transformation and alignment programs, including a continuation of DSRIP funding for public hospital systems. However, the proposed waiver expands the scope of DSRIP-eligible institutions to 42 safety net institutions run by health care districts (referred to as “non-designated public hospitals”). These institutions are predominantly located in rural areas and are often the only hospitals serving their communities. The delivery system transformation and alignment programs also seek to transform and improve the managed care system; improve the fee-for-service system used to pay for dental and maternity care; spur workforce development; increase access to supportive services and housing; and promote regionally-based “whole-person” integrated care pilot projects.72
Medi-Cal Managed Care
The majority of Medi-Cal beneficiaries receive their health care through a managed care plan. In May 2015, over 9.5 million people,73 or a little over three-quarters of the Medi-Cal population, were enrolled in a managed care plan. The state uses six different models of managed care, which vary with respect to how many plans operate in a county, whether the plans are private or county-operated, and whether there is a fee-for-service option. Each county is served by a single managed care model. In 35 counties, individuals may choose from between two and five plans, with at least one commercial plan option. In 22 counties, everyone is in the same managed care plan that is operated by the county, and one county (San Benito) offers a choice between one commercial plan and traditional fee-for-service.74
California has recently expanded mandatory enrollment in managed care to certain seniors and persons with disabilities (SPDs). Under California’s “Bridge to Reform” waiver, mandatory enrollment of Medi-Cal-only SPDs in California began in June 2011 in some non-rural counties.75 Goals of the transition included care coordination, better management of chronic conditions, improved health outcomes and cost savings. Dual eligible beneficiaries, those receiving long term care services, as well as certain other groups were excluded from this requirement. Since June 2011, approximately 340,000 SPDs in 16 counties were transitioned from fee-for-service (FFS) to managed care.76 Findings from a beneficiary survey of over 1,500 SPDs found that approximately two-thirds of SPD beneficiaries reported satisfactory experiences with the transition, while one third did not. Some key issues were identified in the notification and distribution of materials to beneficiaries as well as beneficiaries’ knowledge of plan navigation and consumer protections.77 The state and advocates are looking at the experiences from this transition to inform similar transitions in an additional 19 (rural) counties78 and the transition of dually eligible beneficiaries into managed care, both of which began in 2014.
The Coordinated Care Initiative (CCI) is changing the way seniors and persons with disabilities receive health care and long term services and supports (LTSS) in California. The goal of CCI is to enhance health outcomes and beneficiary satisfaction for SPDs and those dually eligible for both Medicare and Medi-Cal. CCI, which is being implemented in seven counties,79 contains two major components: Cal MediConnect and Managed Medi-Cal Long-Term Supports and Services (MLTSS).
Cal MediConnect is a three-year demonstration to integrate care and align financing for beneficiaries eligible for both Medicare and Medi-Cal. California is one of twelve states carrying out such a demonstration, which began in the state in April 2014.80 Cal MediConnect plans are responsible for the delivery and coordination of all Medicare and Medi-Cal medical, behavioral health, and long-term services and supports (LTSS) for their enrollees. Participation in the demonstration is voluntary for purposes of Medicare managed care enrollment, while all beneficiaries must enroll in managed care for purposes of their Medi-Cal benefits. Cal MediConnect enrollment is passive, and individuals must actively notify the state if they choose not to enroll. As of July 2015, the opt-out rate, excluding Los Angeles County, was 33%, consistent with most other states participating in the demonstration. Los Angeles had an unusually high opt-out rate of 51%.81
Under the Managed Medi-Cal MLTSS initiative, all Medi-Cal beneficiaries, including dual eligible beneficiaries, are required to join a Medi-Cal managed care plan to receive LTSS and other Medi-Cal-covered benefits. Managed care plans are required to provide care coordination for MLTSS beneficiaries. Some stakeholders have been concerned about the transition of SPDs to managed care because of the complicated nature of their health care needs and their use of multiple providers and medications.
Looking Ahead
With over 38 million residents, California is the most populous state in the U.S, and the health and health care of its residents have important implications for the nation at large. Through ACA implementation and changes to its Medi-Cal program over the past five years, the state expanded coverage to millions of the previously uninsured and developed the foundation for the state’s managed care infrastructure. Moving forward, the state continues to invest in its health care delivery system and infrastructure and to address the health care needs of the remaining uninsured and medically indigent populations. The state’s proposed “Medi-Cal 2020” waiver focuses on programs aimed at delivery system transformation and alignment, including an extension with some changes to the DSRIP program.82
Despite all of California’s efforts and successes, many challenges lie ahead. While substantial coverage gains were achieved under the ACA, millions of people are still uninsured and will likely rely on California’s public clinics and health centers when they need care, which will require ongoing support.83 Individuals who have newly gained coverage through Medi-Cal or the Marketplace are beginning to use their new health plans and seek care, but some are reporting access barriers and health literacy issues.84 These challenges notwithstanding, California has made substantial progress in reducing the number of uninsured in the state. From 2013 to 2014, the uninsured rate among the nonelderly in California dropped from 19.1 percent to 13.4 percent, with an even bigger drop among nonelderly adults targeted by ACA expansions.85 These coverage gains, combined with delivery system transformation, payment reform and continued support to the health care safety net will likely impact the health, health care access, and health care utilization of Californians in the long term.
Appendix
- World Atlas, United States, http://www.worldatlas.com/aatlas/infopage/usabysiz.htm. ↩︎
- University of California, Forest Research and Outreach. Accessed July 1, 2015. http://ucanr.edu/sites/forestry/California_forests/. ↩︎
- U.S. Census Bureau, 2010 Census. http://factfinder.census.gov/faces/tableservices/jsf/pages/productview.xhtml?pid=DEC_10_SF1_P2&prodType=table ↩︎
- Kaiser Family Foundation estimates based on the Census Bureau’s March 2014 Current Population Survey (CPS: Annual Social and Economic Supplement). ↩︎
- U.S. Census Bureau, 2013 American Community Survey 1-year estimates. http://factfinder.census.gov/faces/tableservices/jsf/pages/productview.xhtml?pid=ACS_13_1YR_S0501&prodType=table. ↩︎
- Kaiser Family Foundation estimates based on the Census Bureau’s March 2014 Current Population Survey (CPS: Annual Social and Economic Supplement). Accessed June 26, 2015, https://modern.kff.org/other/state-indicator/distribution-by-citizenship-status/. ↩︎
- U.S. Census Bureau: State and County QuickFacts. Data derived from Population Estimates, American Community Survey, Census of Population and Housing, State and County Housing Unit Estimates, County Business Patterns, Nonemployer Statistics, Economic Census, Survey of Business Owners, Building Permits , http://quickfacts.census.gov/qfd/states/06000.html. ↩︎
- U.S. Census Bureau, 2013 American Community Survey 1-year estimates, http://factfinder.census.gov/faces/tableservices/jsf/pages/productview.xhtml?pid=ACS_13_1YR_S0501&prodType=table. ↩︎
- U.S. Bureau of the Census, Current Population Survey, Annual Social and Economic Supplements, 2011-2013, Table 19, http://www.census.gov/hhes/www/poverty/data/historical/people.html. ↩︎
- Ibid. ↩︎
- Kaiser Commission on Medicaid and the Uninsured analysis based on the Council for Community and Economic Research (C2ER)’s ACCRA Cost of Living Index (COLI) for the first quarter of 2015. https://modern.kff.org/other/state-indicator/cost-of-living-variation/ ↩︎
- Kaiser Family Foundation estimates based on the Census Bureau’s March 2014 Current Population Survey (CPS: Annual Social and Economic Supplements). https://modern.kff.org/other/state-indicator/poverty-rate-by-age/. ↩︎
- U.S Department of Commerce, Bureau of Economic Analysis (BEA), Per Capital real GDP by state (chained $2009), http://www.bea.gov/iTable/iTable.cfm?reqid=70&step=1&isuri=1&acrdn=1#reqid=70&step=4&isuri=1&7003=1000&7001=11000&7002=1&7090=70. ↩︎
- Ibid. ↩︎
- U.S. Bureau of Economic Analysis (BEA), Bearfacts, California. http://www.bea.gov/regional/bearfacts/pdf.cfm?fips=06000&areatype=STATE&geotype=3. ↩︎
- United States Department of Labor, Bureau of Labor Statistics (BLS), June 2015, http://www.bls.gov/lau/ ↩︎
- Ibid. ↩︎
- Legislative Analyst’s Office. The 2014-15 Budget: Overview of the Governor’s Budget (January 13, 2014) http://www.lao.ca.gov/reports/2014/budget/overview/budget-overview-2014.aspx. ↩︎
- Center on Budget and Policy Priorities, June 27, 2012.”States Continue to Feel Recession’s Impact,” http://www.cbpp.org/research/states-continue-to-feel-recessions-impact?fa=view&id=711 ↩︎
- 2015-16 Governor’s Budget Summary (California Department of Finance, January 2015), http://www.ebudget.ca.gov/2015-16/pdf/BudgetSummary/FullBudgetSummary.pdf. ↩︎
- United Health Care Foundation, America’s Health Rankings (2014), http://www.americashealthrankings.org/. ↩︎
- United Health Care Foundation, America’s Health Rankings (2014), http://cdnfiles.americashealthrankings.org/SiteFiles/StateSummaries/California-Health-Summary-2014.pdf. ↩︎
- California Environmental Protection Agency, State Water Resources Control Board, accessed June 30, 2015. http://www.waterboards.ca.gov/drinking_water/certlic/drinkingwater/DroughtPreparedness.shtml. ↩︎
- County Health Rankings, 2015, A Robert Wood Johnson Foundation program. “County Health Rankings & Roadmaps.” http://www.countyhealthrankings.org/app/california/2015/overview. ↩︎
- California Department of Public Health, http://www.cdph.ca.gov/programs/Pages/ClimateChange.aspx. ↩︎
- California Strategic Growth Council, California Health in All Policies, http://sgc.ca.gov/s_hiap.php. ↩︎
- Kaiser Family Foundation estimates based on the Census Bureau’s March 2014 Current Population Survey (CPS: Annual Social and Economic Supplements). https://modern.kff.org/other/state-indicator/total-population/ ↩︎
- Kaiser Family Foundation estimates based on the Census Bureau’s March 2014 Current Population Survey (CPS: Annual Social and Economic Supplements). https://modern.kff.org/other/state-indicator/total-population/ ↩︎
- California Health Care Almanac, California Employer Health Benefits Survey: Workers Feel the Pinch (California HealthCare Foundation, January 2014), http://www.chcf.org/publications/2014/01/employer-health-benefits ↩︎
- Kaiser Family Foundation estimates based on the Census Bureau’s March 2014 Current Population Survey (CPS: Annual Social and Economic Supplements). https://modern.kff.org/other/state-indicator/total-population/ ↩︎
- Kaiser Family Foundation estimates based on the Census Bureau’s March 2014 Current Population Survey (CPS: Annual Social and Economic Supplements), https://modern.kff.org/medicaid/state-indicator/rate-by-age-3/. ↩︎
- Heberlein M, Brooks T, Artiga S, Stephens J, Kaiser Family Foundation and Georgetown University Center for Children and Families, November 2013. “Getting into Gear for 2014: Shifting New Medicaid Eligibility and Enrollment Policies into Drive,” https://modern.kff.org/medicaid/report/getting-into-gear-for-2014-shifting-new-medicaid-eligibility-and-enrollment-policies-into-drive/. ↩︎
- Kaiser Commission on Medicaid and the Uninsured and Urban Institute estimates based on data from FY 2011 MSIS. https://modern.kff.org/medicaid/state-indicator/distribution-of-medicaid-enrollees-by-enrollment-group/. ↩︎
- Kaiser Commission on Medicaid and the Uninsured and Urban Institute estimates based on data from FY 2011 MSIS and CMS-64 reports, https://modern.kff.org/medicaid/state-indicator/medicaid-spending-by-enrollment-group/. ↩︎
- Kaiser Commission on Medicaid and the Uninsured and Urban Institute estimates based on data from FY 2011 MSIS and CMS-64 reports, https://modern.kff.org/medicaid/state-indicator/medicaid-spending-per-enrollee/. ↩︎
- 79 Fed. Reg. , 71426-71428 (Dec. 2, 2014). ↩︎
- Ibid. ↩︎
- California Department of Health Care Services. Healthy Families Program Transition to Medi-Cal, Final Comprehensive Report, February 2014, http://www.dhcs.ca.gov/provgovpart/Documents/Waiver%20Renewal/AppendixCHFP.PDF. ↩︎
- Kaiser Family Foundation estimates based on the Census Bureau’s March 2014 Current Population Survey (CPS: Annual Social and Economic Supplements). https://modern.kff.org/other/state-indicator/total-population/. ↩︎
- California Department of Health Care Services, Outreach and Enrollment Workgroup (November 2013), http://www.dhcs.ca.gov/services/medi-cal/eligibility/Pages/OEworkgroup.aspx ↩︎
- California Health Benefit Exchange. Outreach and Education Grant Webinar (September 27, 2012), http://www.healthexchange.ca.gov/StakeHolders/Pages/2012StakeholderArchive.aspx ↩︎
- California Health Benefit Exchange. Outreach and Education Grant Webinar (September 27, 2012), http://www.healthexchange.ca.gov/StakeHolders/Pages/2012StakeholderArchive.aspx ↩︎
- Health Resources and Services Administration, California: Health Center Outreach & Enrollment Assistance, (FY 2014) http://www.hrsa.gov/about/news/2013tables/outreachandenrollment/ca.html ↩︎
- Covered California, September 2014. “Covered California Announces Community Outreach Campaign for 2015.” http://news.coveredca.com/2014/09/covered-california-announces-community.html ↩︎
- California Department of Health Care Services. LIHP September2013 Monthly Enrollment (November 15, 2013). ↩︎
- California Department of Health Care Services, “California’s Low Income Health Program Transitions Hundreds of Thousands of New Members to Medi-Cal” (December, 2013), http://www.dhcs.ca.gov/formsandpubs/publications/opa/Documents/2013/13-07%20LIHP%20Medi-Cal%20Expansion%2012-31-13%20Final%20Version.pdf ↩︎
- Heberlein M, Brooks T, Alker J, Artiga S, Stephens J, Georgetown University Center for Children and Families and Kaiser Commission on Medicaid and the Uninsured, January 2013. “Getting into Gear for 2014: Findings from a 50-State Survey of Eligibility, Enrollment, Renewal, and Cost-Sharing Policies in Medicaid and CHIP, 2012-2013,” https://modern.kff.org/medicaid/report/getting-into-gear-for-2014-findings-from-a-50-state-survey-of-eligibility-enrollment-renewal-and-cost-sharing-policies-in-medicaid-and-chip-2012-2013/. ↩︎
- Brooks T, Touschner J, Artiga S, Stephens J, Gates A, Georgetown University Center for Children and Families and Kaiser Commission on Medicaid and the Uninsured, January 2015. “Modern Era Medicaid: Findings from a 50-State Survey of Eligibility, Enrollment, Renewal, and Cost-Sharing Policies in Medicaid and CHIP as of January 2015,” http://files.kff.org/attachment/report-modern-era-medicaid-findings-from-a-50-state-survey-of-eligibility-enrollment-renewal-and-cost-sharing-policies-in-medicaid-and-chip-as-of-january-2015. ↩︎
- CMS, Medicaid & CHIP Monthly Application, Eligibility Determination, and Enrollment Reports and Updated Data, March 2014 – May, 2015 (preliminary), as of July 28, 2015. Enrollment reports and updated data are available from CMS, http://www.medicaid.gov/medicaid-chip-program-information/program-information/medicaid-and-chip-enrollment-data/medicaid-and-chip-application-eligibility-determination-and-enrollment-data.html. ↩︎
- California Department of Health Care Services, California Eligibility and Enrollment Report: Insurance Affordability Programs for October 2013 through September 2014, http://www.dhcs.ca.gov/formsandpubs/Documents/Legislative%20Reports/CA_EligibilityandEnroll_ABx1_1-Quarterly.pdf ↩︎
- Brooks T, Touschner J, Artiga S, Stephens J, Gates A, Georgetown University Center for Children and Families and Kaiser Commission on Medicaid and the Uninsured, January 2015. “Modern Era Medicaid: Findings from a 50-State Survey of Eligibility, Enrollment, Renewal, and Cost-Sharing Policies in Medicaid and CHIP as of January 2015,” http://files.kff.org/attachment/report-modern-era-medicaid-findings-from-a-50-state-survey-of-eligibility-enrollment-renewal-and-cost-sharing-policies-in-medicaid-and-chip-as-of-january-2015. ↩︎
- California State Senate Majority Caucus, State Senator Ricardo Lara, Historic Senate Bipartisan Vote Advances Nation’s First Bill to Expand Health Care Coverage for Undocumented Californians. June 2, 2015, http://sd33.senate.ca.gov/news/2015-06-02-historic-senate-bipartisan-vote-advances-nation%E2%80%99s-first-bill-expand-health-care. ↩︎
- Garfield R, Majerol M, Young K, Kaiser Family Foundation, 2015. “Coverage Expansions and the Remaining Uninsured: A Look at California During Year One of ACA Implementation.” https://modern.kff.org/health-reform/report/coverage-expansions-and-the-remaining-uninsured-a-look-at-california-during-year-one-of-aca-implementation/. ↩︎
- California Senate Committee on Health, First Open Enrollment for Affordable Care Act Implementation, Summary of Outcomes and Challenges, http://shea.senate.ca.gov/sites/shea.senate.ca.gov/files/Outreach%20%20Enrollment%20White%20Paper%20Final.pdf ↩︎
- California Senate Committee on Health, First Open Enrollment for Affordable Care Act Implementation, Summary of Outcomes and Challenges, http://shea.senate.ca.gov/sites/shea.senate.ca.gov/files/Outreach%20%20Enrollment%20White%20Paper%20Final.pdf ↩︎
- California Pan-Ethnic Health Network, Improving Enrollment of Communities of Color in Health Coverage: Recommendations from First Responders to Covered California and Medi-Cal.( June, 2014), http://shea.senate.ca.gov/sites/shea.senate.ca.gov/files/CPEHN_ImprovingEnrollmentforCommunitiesofColor_2014.pdf ↩︎
- California Health Line, Judge Rules on Medi-Cal Backlog Suit, Orders State to Adhere to 45-Day Deadline (January 2015), http://www.californiahealthline.org/capitol-desk/2015/1/judge-finally-rules-on-backlog-lawsuit-orders-state-to-adhere-to-45-day-deadline ↩︎
- California State Senate Majority Caucus, State Senator Ricardo Lara, Historic Senate Bipartisan Vote Advances Nation’s First Bill to Expand Health Care Coverage for Undocumented Californians. June 2, 2015, http://sd33.senate.ca.gov/news/2015-06-02-historic-senate-bipartisan-vote-advances-nation%E2%80%99s-first-bill-expand-health-care. ↩︎
- Covered California, Health Plans Booklet (2014), https://www.coveredca.com/PDFs/CC-health-plans-booklet-rev4.pdf. ↩︎
- Covered California, October 2014. “Health Insurance Companies and Plan Rates for 2015,” https://www.coveredca.com/PDFs/CC-health-plans-booklet-2015.pdf. ↩︎
- CMS, March 31, 2015 Effectuated Enrollment Snapshot, accessed June 2, 2015. http://www.cms.gov/Newsroom/MediaReleaseDatabase/Fact-sheets/2015-Fact-sheets-items/2015-06-02.html. ↩︎
- Office of the Assistant Secretary for Planning and Evaluation (ASPE), Health Insurance Marketplaces 2015 Open Enrollment Period: March Enrollment Report, 11-15-14 to 2-15-15 (including SEP activity reported through 2-22-15)(HHS, March 10, 2015). ↩︎
- CMS, March 31, 2015 Effectuated Enrollment Snapshot, accessed June 2, 2015. http://www.cms.gov/Newsroom/MediaReleaseDatabase/Fact-sheets/2015-Fact-sheets-items/2015-06-02.html. ↩︎
- Insure the Uninsured Project, 2014. “Children’s Health Coverage Under the ACA, Executive Summary,” http://lpfch-cshcn.org/wp-content/uploads/2014/02/ITUP-Full-Report.pdf. ↩︎
- Legislative Analyst’s Office. The 2013-2014 Budget: Examining the State and County Roles in the Medi-Cal Expansion (February 19, 2013) http://www.lao.ca.gov/analysis/2013/health/ACA/medi-cal-expansion-021913.aspx. ↩︎
- National Association of Community Health Centers, State Maps, California, 2015, Accessed on August 18, 2015. http://www.nachc.com/state-healthcare-data.cfm?State=CA. ↩︎
- California Association of Public Hospitals and Health Systems and California Health Care Safety Net Institute, 2014. “Leading the Way: California’s Delivery System Reform Incentive Program (DSRIP),” http://caph.org/wp-content/uploads/2014/09/Leading-the-Way-CA-DSRIP-Brief-September-2014-FINAL.pdf. ↩︎
- Guyer J, Shine N, Rudowitz R, Gates A. The Kaiser Family Foundation, 2015. “Key Themes From Delivery System Reform Incentive Payment (DSRIP) Waivers in 4 States,” https://modern.kff.org/report-section/key-themes-from-delivery-system-reform-incentive-payment-dsrip-waivers-in-4-states-issue-brief/. ↩︎
- California Association of Public Hospitals and Health Systems and California Health Care Safety Net Institute, 2015. “California’s Delivery System Reform Incentive Program,” http://caph.org/wp-content/uploads/2015/06/CA-DSRIP-2010-2015-Successes.pdf. ↩︎
- Ibid. ↩︎
- California Department of Health Care Services, Medi-Cal Managed Care Enrollment Report, May 2015. Data Source: CAPMAN Capitation Report. http://www.dhcs.ca.gov/dataandstats/reports/Documents/MMCD_Enrollment_Reports/MMCEnrollRptMay2015.pdf ↩︎
- California Department of Health Care Services, 2014. Medi-Cal Managed Care Program Fact Sheet- Managed Care Models. http://www.dhcs.ca.gov/provgovpart/Documents/MMCDModelFactSheet.pdf. ↩︎
- The counties that participated in this transition are Alameda, Contra Costa, Fresno, Kern, Kings, Los Angeles, Madera, Riverside, Sacramento, San Bernadino, San Diego, San Francisco, San Joaquin, Santa Clara, Stanislaus, and Tulare. Source: California Department of Health Care Services, http://www.dhcs.ca.gov/individuals/Pages/MMCDSPDEnrollment.aspx. ↩︎
- McDonnell D and Graham C, Health Affairs, 2015. “Medicaid Beneficiaries in California Reported Less Positive Experiences When Assigned To a Managed Care Plan.” 34 (3) 447-454. ↩︎
- Graham C, McDonnel, D, Foster K, Ivey S, University of California at Berkeley, Health Research for Action, March 2014. “The Transition of Senior and People with Disabilities to Medi-Cal Managed Care: The beneficiary perspective”, http://www.healthresearchforaction.org/sites/default/files/SPDTransitions_FNL_Rpt_Web%20Mar%2014.pdf. ↩︎
- The counties that participated in this second transition are Alpine, Amador, Butte, Calaveras, Colusa, El Dorado, Glenn, Imperial, Inyo, Mariposa, Mono, Nevada, Placer, Plumas, Sierra, Sutter, Tehama, Tuolumne, and Yuba. Source: California Department of Health Care Services, http://www.dhcs.ca.gov/individuals/Pages/SPDRegional_Imperial_Imp.aspx. ↩︎
- The counties participating in the Coordinate Care Initiative are Los Angeles, Orange, Riverside, San Bernadino, San Diego, San Mateo, and Santa Clara. Alameda was originally slated to participate but is no longer moving forward with CCI. SourceL Department of Health Care Services, http://www.dhcs.ca.gov/provgovpart/Pages/CoordinatedCareIntiatiave.aspx. ↩︎
- Musumeci M, Kaiser Family Foundation, August 2014. “One Year into the Duals Demo Enrollment: Early Expectations Meet Reality,” https://modern.kff.org/medicaid/perspective/one-year-into-duals-demo-enrollment-early-expectations-meet-reality/. ↩︎
- California Department of Health Care Services, July 2015. “Cal Medi-Connect Monthly Enrollment Dashboard,” http://www.calduals.org/wp-content/uploads/2015/07/CMC-Enrollment-Dashboard-July-2015-Final.pdf. ↩︎
- California Department of Health Care Services, March 2015. “Medi-Cal 2020: Key Concepts for Renewal,” http://www.dhcs.ca.gov/provgovpart/Documents/Waiver%20Renewal/FinalDraftMediCal2020WaiverRenewal.pdf. ↩︎
- Garfield R, Majerol M, Young K, Kaiser Family Foundation, May 2015. “Coverage Expansions and the Remaining Uninsured: A Look at California During Year One of ACA Implementation,” https://modern.kff.org/health-reform/report/coverage-expansions-and-the-remaining-uninsured-a-look-at-california-during-year-one-of-aca-implementation/. ↩︎
- Ibid. ↩︎
- Centers for Disease Control and Prevention, “National Health Interview Survey Early Release Program,” State Tables 2013 and 2014, http://www.cdc.gov/nchs/data/nhis/earlyrelease/State_estimates_insurance_2013_2014.pdf ↩︎