The Burden of Medical Debt: Results from the Kaiser Family Foundation/New York Times Medical Bills Survey
Overview
This Kaiser Family Foundation/New York Times survey provides an in-depth look at the experiences of Americans ages 18-64 who say they or someone in their household had problems paying medical bills in the past year. The survey explores the causes of medical bill problems and the impacts they have on individuals and their families, finances, and access to health care. To provide context, a shorter companion survey was conducted among those who do not report having medical bill problems.
Read The New York Times Coverage
- Lost Jobs, Houses, Savings: Even Insured Often Face Crushing Medical Debt
- Slideshow: The Weight of Medical Bills
- ‘I Am Drowning.’ The Voices of People With Medical Debt
- How the Poll on Medical Bills was Conducted
- New Online Polling Experiment for the Post-Landline Phone Era
Key Findings
Introduction
The cost of health care has long been a concern in the U.S., on both a national and a personal level. For individuals, this concern plays out most prominently among those who face difficulty paying medical bills or who are unable to pay such bills at all. For people who are uninsured, lack of coverage not only hinders access to care but also leaves them vulnerable to medical bills that cannot be paid. While insurance provides financial protection, that protection can be incomplete for a number of reasons, including rising deductibles and other forms of cost-sharing, out-of-network charges, the growing complexity of insurance that can leave consumers with unexpected bills, and the fact that many people have only modest financial assets to cover medical expenses.
Previous Kaiser surveys have found that about a quarter of people say they or someone in their household had problems paying medical bills in the past year, and a 2014 Kaiser report provided a qualitative look at some of the circumstances and consequences of unpaid medical bills through interviews with people who had sought credit counseling for medical debt.1 But to date, there has been little research providing a quantitative look at the causes of medical bill problems and the impacts they have on people’s families, their finances, and their access to health care.
To fill this gap, the Kaiser Family Foundation and The New York Times conducted an in-depth survey with 1,204 adults ages 18-642 who report that they or someone in their household had problems paying or an inability to pay medical bills in the previous 12 months. To provide context, we also conducted a shorter companion survey with 1,371 adults ages 18-64 who do not report having medical bill problems.
Section 1: Who Has Medical Bill Problems and What Are the Contributing Factors?
Prevalence of problems paying medical bills among different groups
Overall, about a quarter (26 percent) of U.S. adults ages 18-64 say they or someone in their household had problems paying or an inability to pay medical bills in the past 12 months. Though certain groups are more likely than others to report such problems, the survey finds that people from all walks of life can and do experience difficulty paying medical bills.
Insurance status has a strong association with medical bill difficulties, with over half (53 percent) of the uninsured saying they had problems paying household medical bills in the past year. However, as previous surveys have shown, insurance is not a panacea against these problems. Roughly one in five of those with health insurance through an employer (19 percent), Medicaid (18 percent), or purchased on their own (22 percent) also report problems paying medical bills. In fact, overall among all people with household medical bill problems, more than six in ten (62 percent) say the person who incurred the bills was covered by health insurance, while a third (34 percent) say that person was uninsured. Among those with private insurance (either through an employer or self-purchased), their plan’s deductible makes a difference in ability to afford health care bills, with those in higher deductible plans more likely to report medical bill problems than those in plans with lower deductibles1 (26 percent versus 15 percent).
Not surprisingly, problems paying medical bills are also more common among those with lower or moderate incomes. Just under four in ten (37 percent) of those with annual household incomes below $50,000 report experiencing such problems, compared with about a quarter (26 percent) of those with moderate incomes between $50,000 and $100,000, and 14 percent of those in the highest income category.2 Those with poorer health status and greater health needs are also more likely to report facing medical bill problems. This is true among those who say they have a disability that prevents them from participating fully in daily activities (47 percent report problems versus 22 percent of those without such a disability), among those who rate their own health as fair or poor (45 percent versus 22 percent of those in excellent, very good, or good health), and among those who say they’re receiving regular or ongoing medical treatment for a chronic condition (34 percent versus 23 percent of those who are not receiving such treatment).
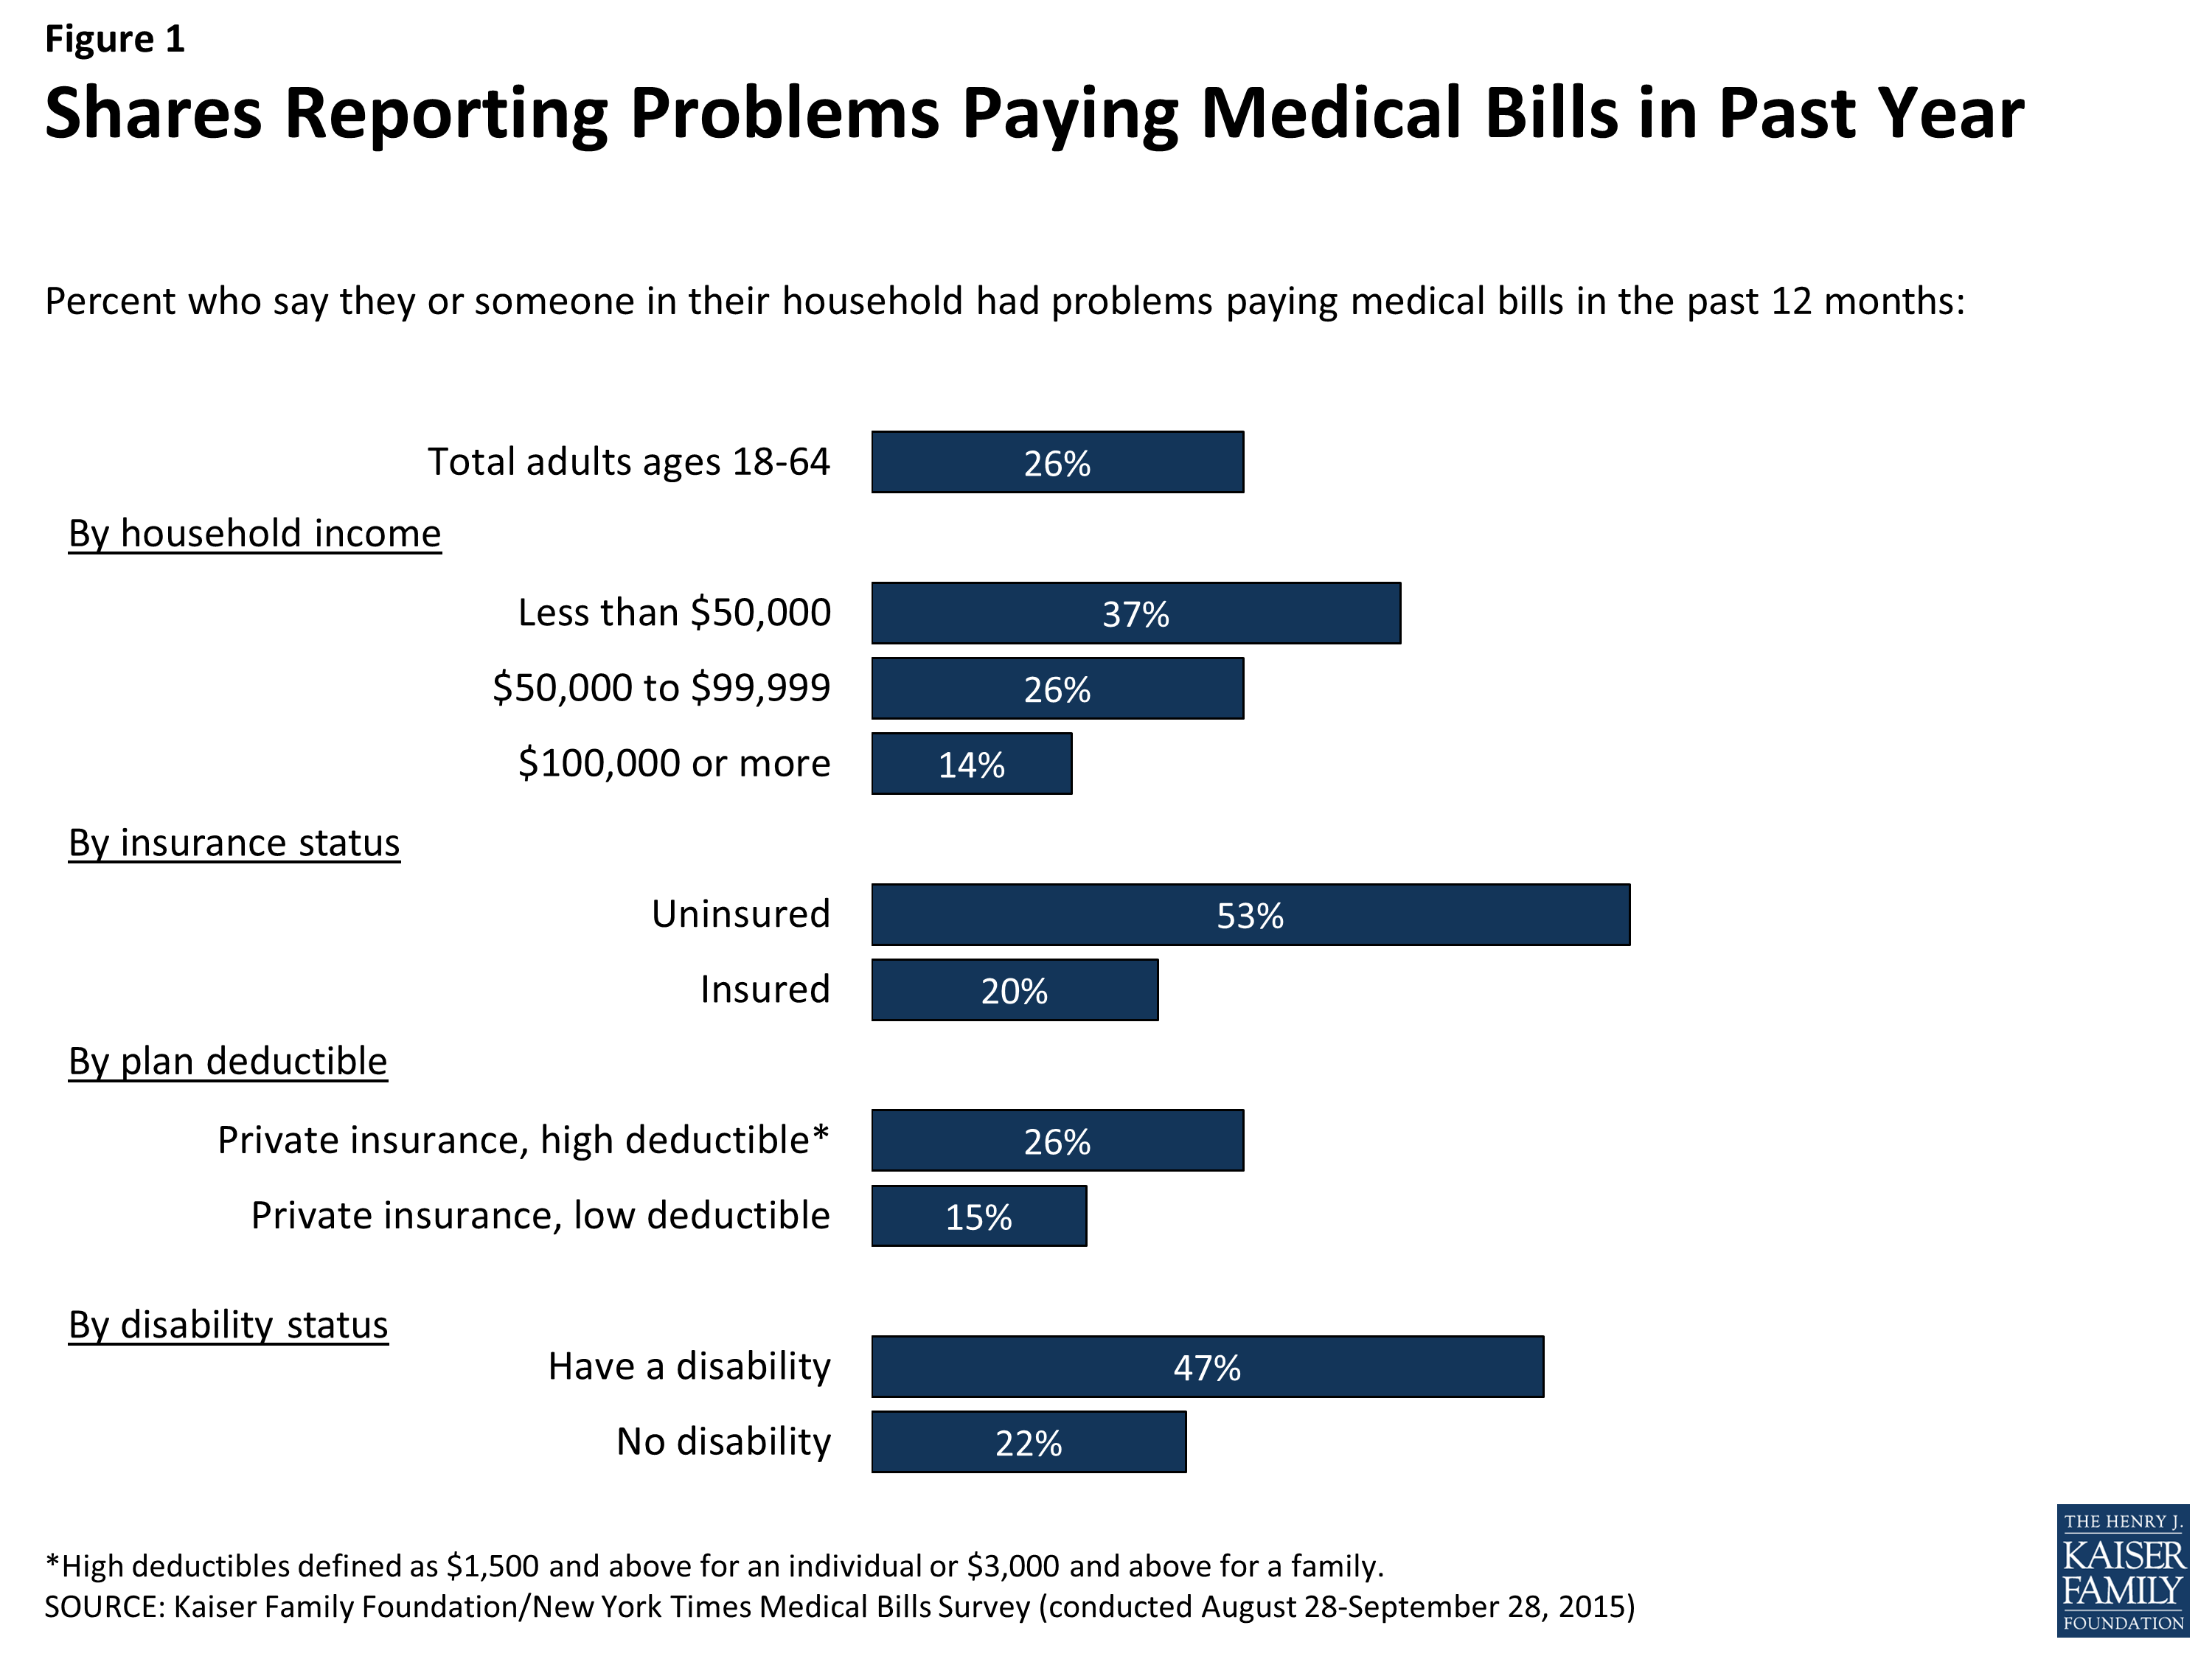
Figure 1: Shares Reporting Problems Paying Medical Bills in Past Year
Beyond insurance, income, and health status, several other demographic differences emerge in the rates at which people report experiencing problems paying medical bills. Women are somewhat more likely than men to report having such problems (29 percent versus 23 percent), as are adults under age 30 compared with those ages 30-64 (31 percent versus 24 percent) and those with children in their household versus those without (29 percent versus 24 percent). Looking by region, residents of the South have the highest share reporting problems (32 percent), while those in the Northeast have the lowest (18 percent). Likely due to differences in income and insurance status, those without a college degree are more likely than college graduates to report medical bill problems, as are Blacks and Hispanics compared with whites. (See Appendix Table 1 for more detail).
To explore these relationships further, we used a statistical technique called logistic regression analysis to isolate which demographic characteristics are the strongest predictors of problems paying medical bills when holding other factors constant. In that analysis, income, insurance status, and all 3 measures of health status (being in fair or poor health and having a disability or chronic condition) had a significant and strong association with problems paying medical bills, even after accounting for the influence of the other demographic factors. Having a private insurance plan with a high deductible also remained a significant predictor, even after controlling for other factors, as did being under age 25 and having minor children at home. Gender, race, and ethnicity were not statistically significant predictors of problems paying medical bills when controlling for other factors, suggesting that the higher rates of reported problems among women, Blacks, and Hispanics have to do with underlying differences in income and insurance status between these groups and their counterparts.
Circumstances leading to problems paying medical bills
Among those who report problems paying medical bills, two-thirds (66 percent) say the bills were the result of a one-time or short-term medical expense such as a hospital stay or an accident, while 33 percent cite bills for treatment of chronic conditions that have built up over time. These shares are similar for people who faced medical bill problems with and without insurance coverage.
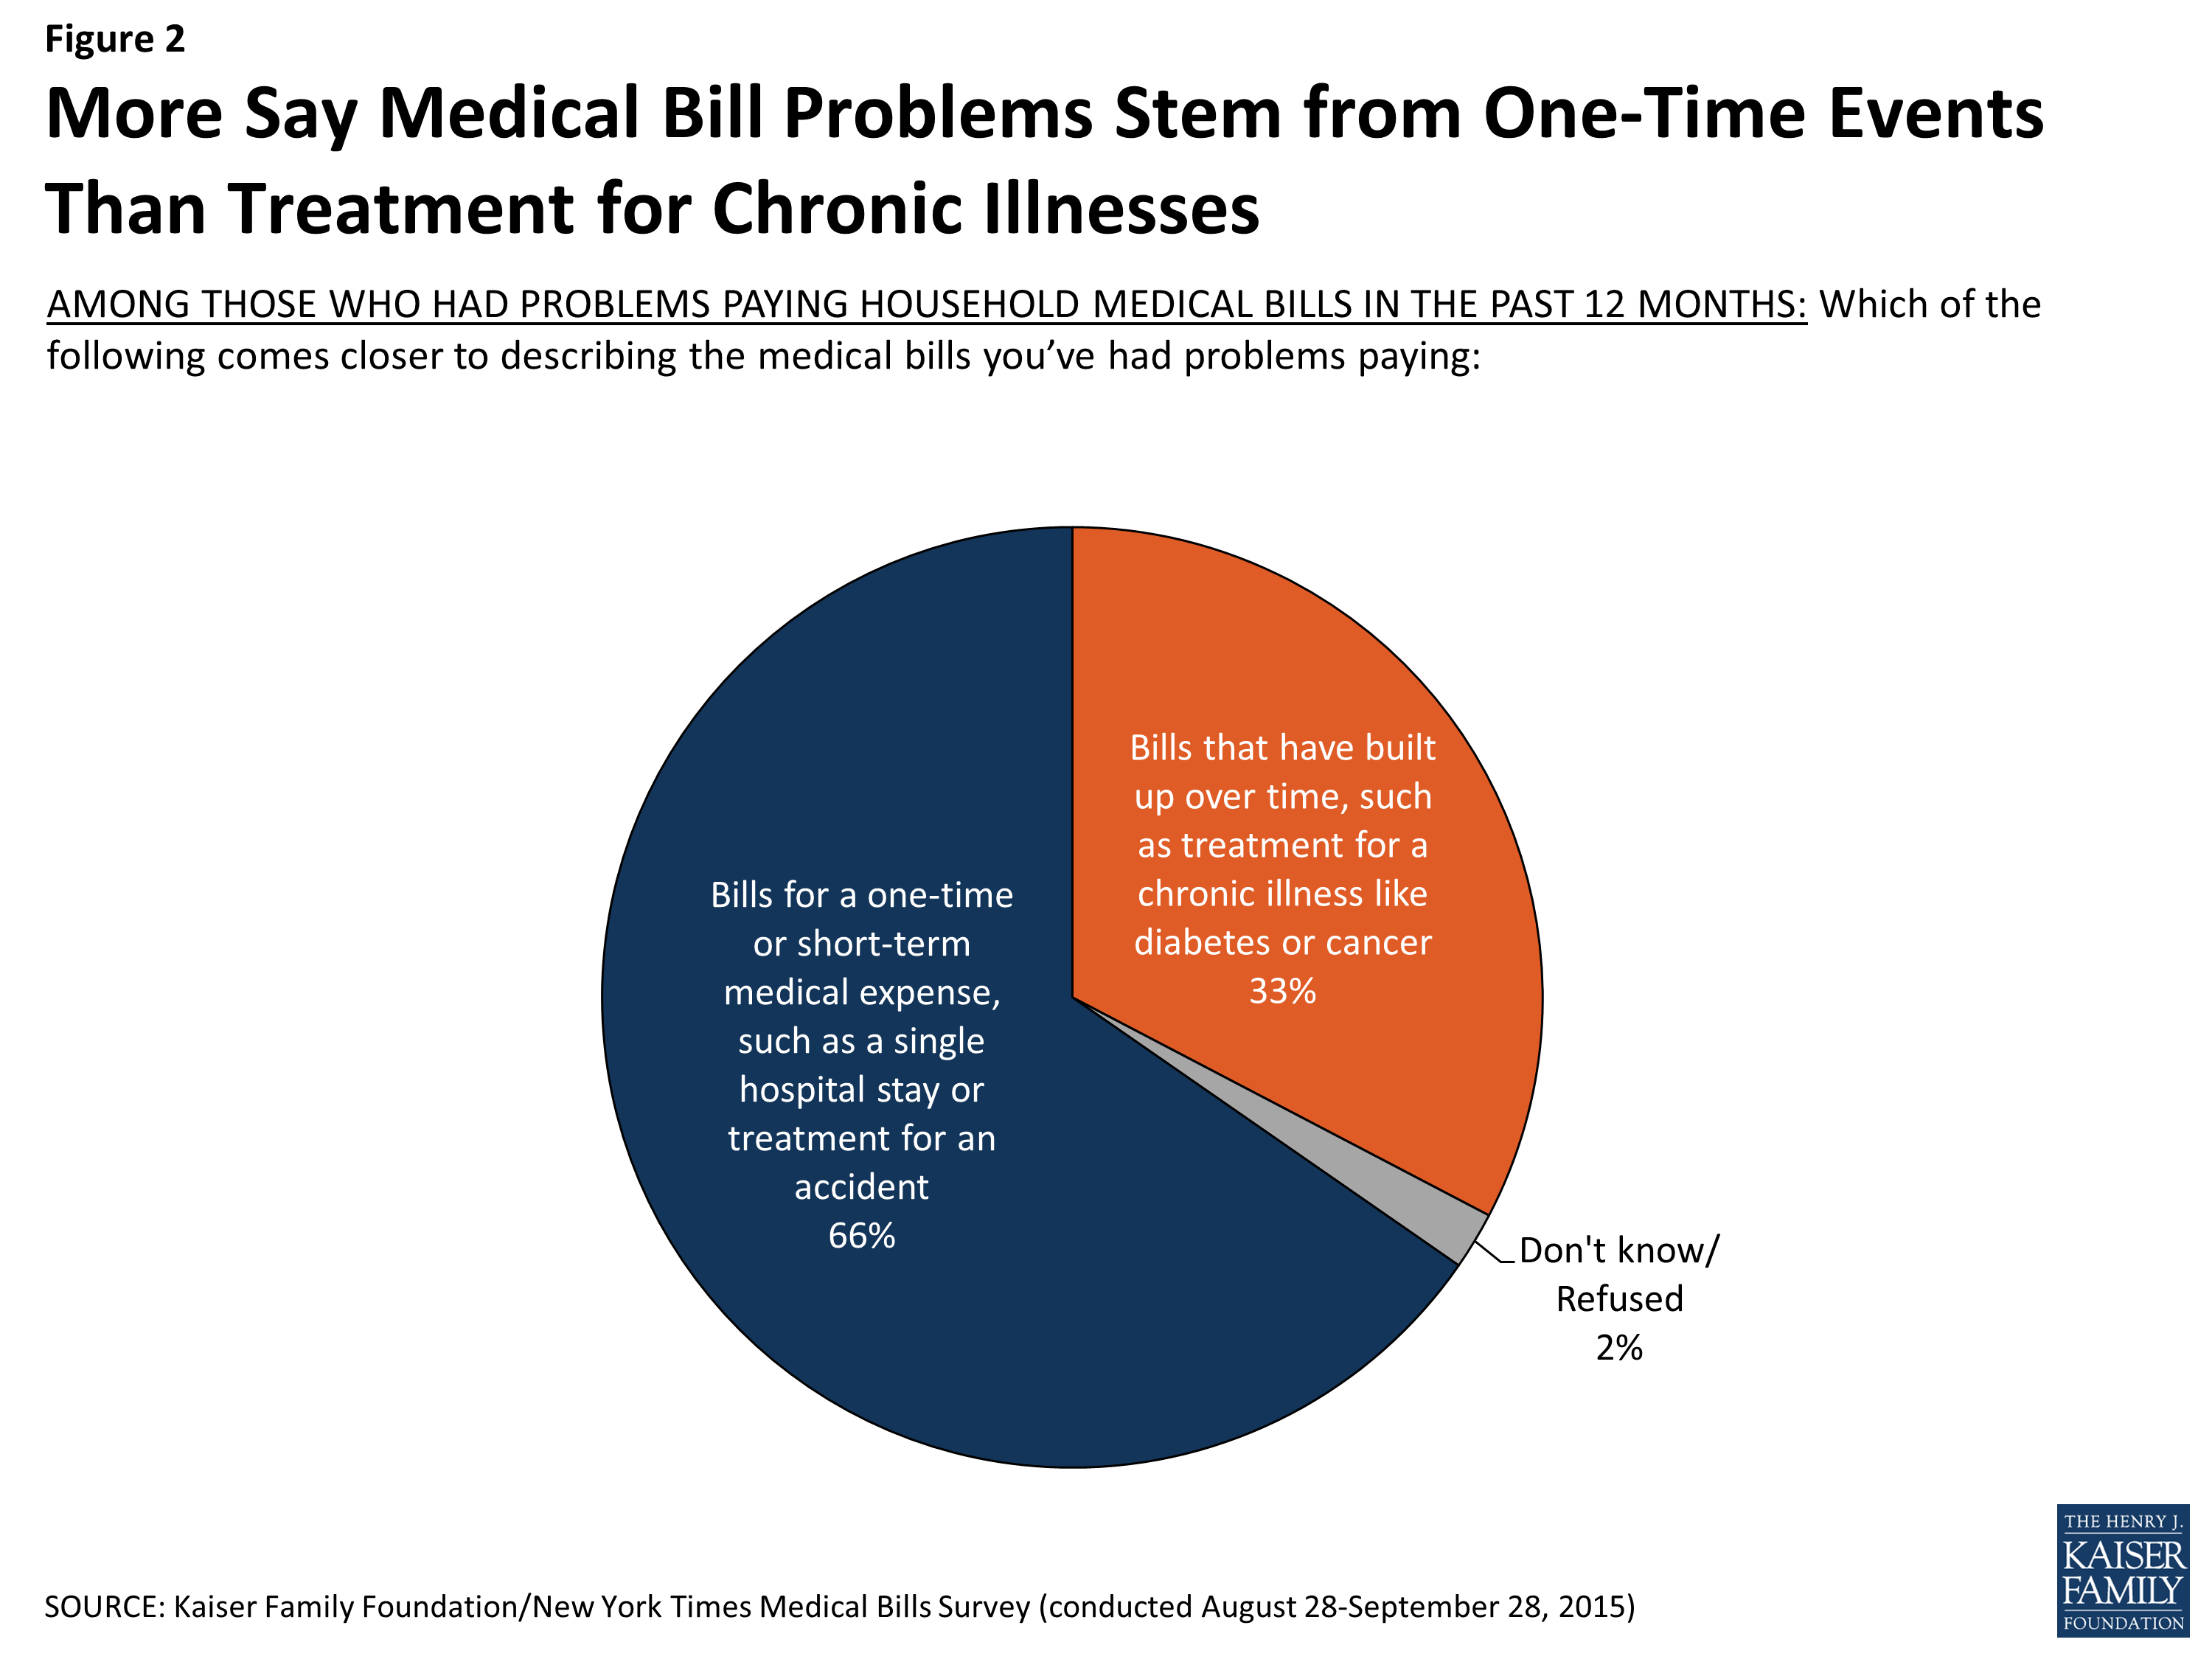
Figure 2: More Say Medical Bill Problems Stem from One-Time Events Than Treatment for Chronic Illnesses
Many are still struggling to pay off bills for treatment that occurred in the past. Over six in ten (63 percent) say they are no longer receiving the medical treatment that led to their problems paying bills, and almost half (46 percent) say the illness or injury that led to the bills occurred more than one year ago.
Most of those with medical bill problems say the bills are the result of their own or their spouse’s medical care. One-quarter (44 percent of those with children under age 18 in their household) say they had problems paying a child’s medical bills, and 10 percent cite another family member. Thirty-five percent say they’ve had problems paying bills for more than one family member.
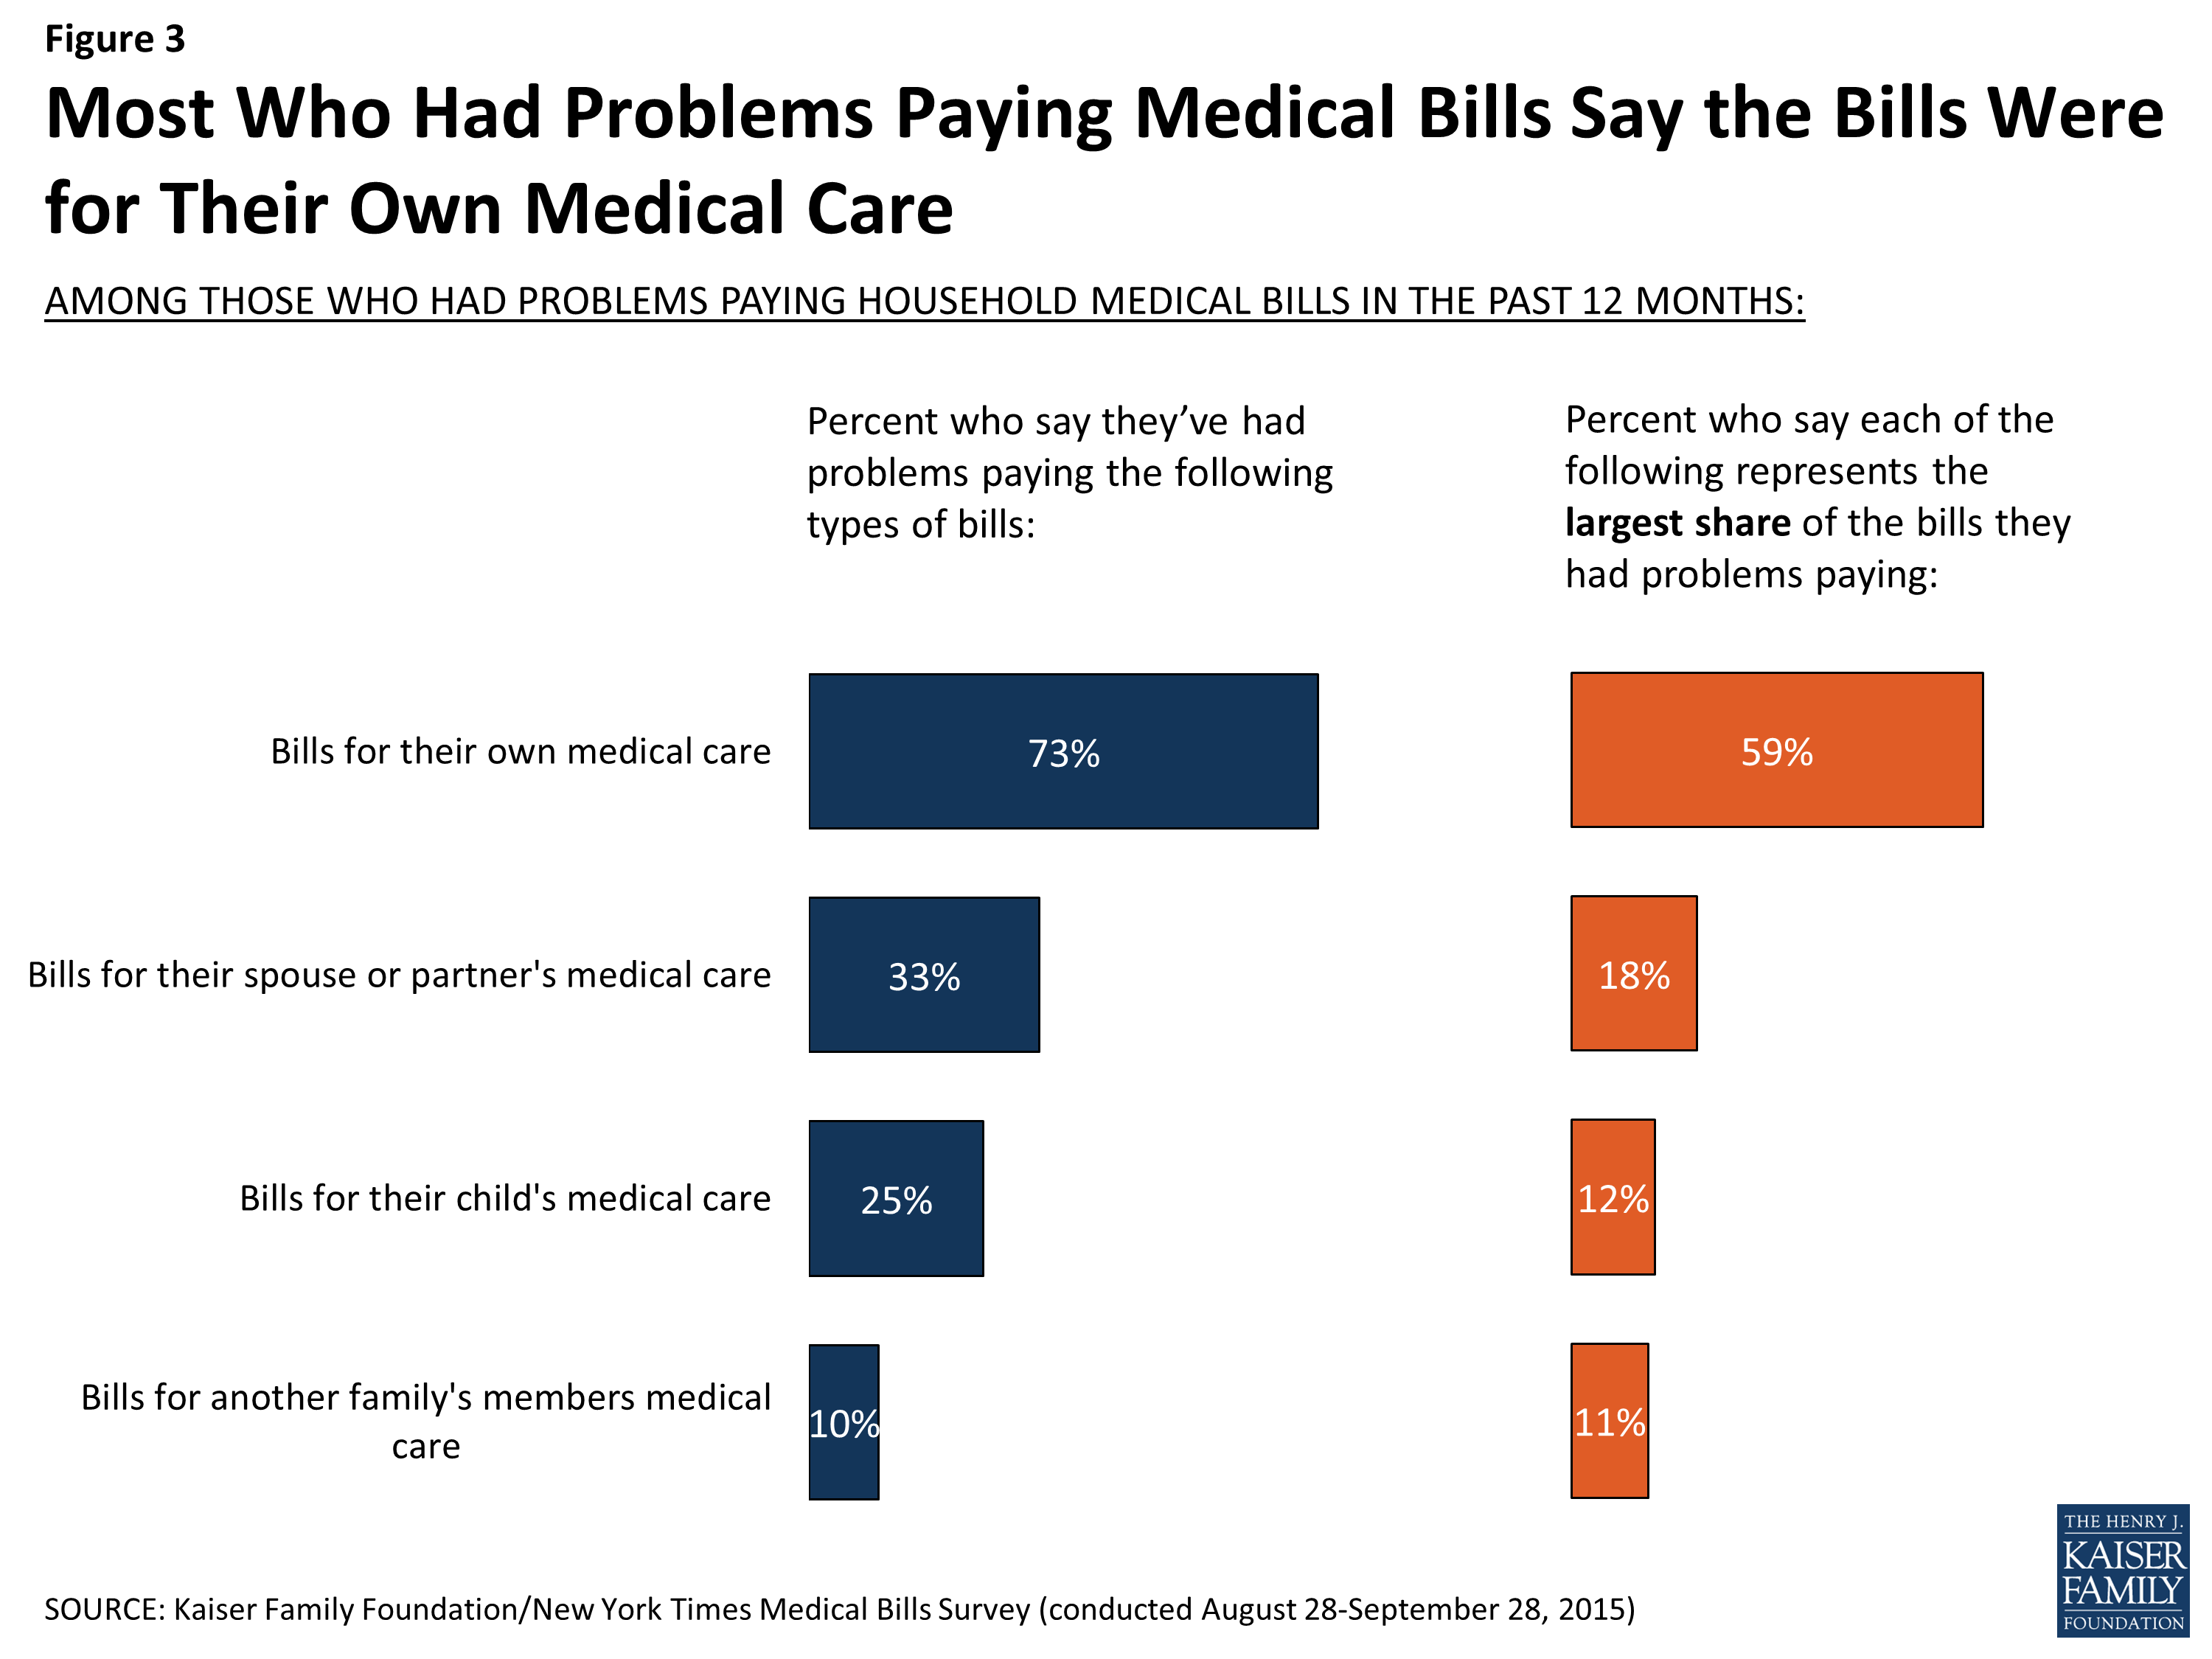
Figure 3: Most Who Had Problems Paying Medical Bills Say the Bills Were for Their Own Medical Care
The medical bills people report facing also come from a variety of sources. More than six in ten of those who had difficulty paying say the medical bills were for doctor visits (65 percent), diagnostic tests (65 percent), lab fees (64 percent) and emergency room visits (61 percent). About half say they had problems with bills for prescription drugs (52 percent), hospitalization (49 percent), and outpatient services (49 percent), while four in ten (41 percent) report problems with bills for dental care. Nearly all of those who had problems paying medical bills (91 percent) report having trouble with bills from at least two of these categories, and over half (53 percent) had problems with bills from five or more different sources.
Asked which types of bills made up the largest share of what they owed, the most common responses are emergency room visits (21 percent) and hospitalization (20 percent), followed by dental care (12 percent) and diagnostic tests like X-rays and MRIs (11 percent). In general, people who had problems paying medical bills with or without insurance report having similar types of bills, however the uninsured are more likely than the insured to say that emergency room bills were the largest source of their bill problems (35 percent versus 15 percent), while those with insurance are more likely than the uninsured to point to diagnostic tests like X-rays and MRIs (14 percent versus 6 percent).
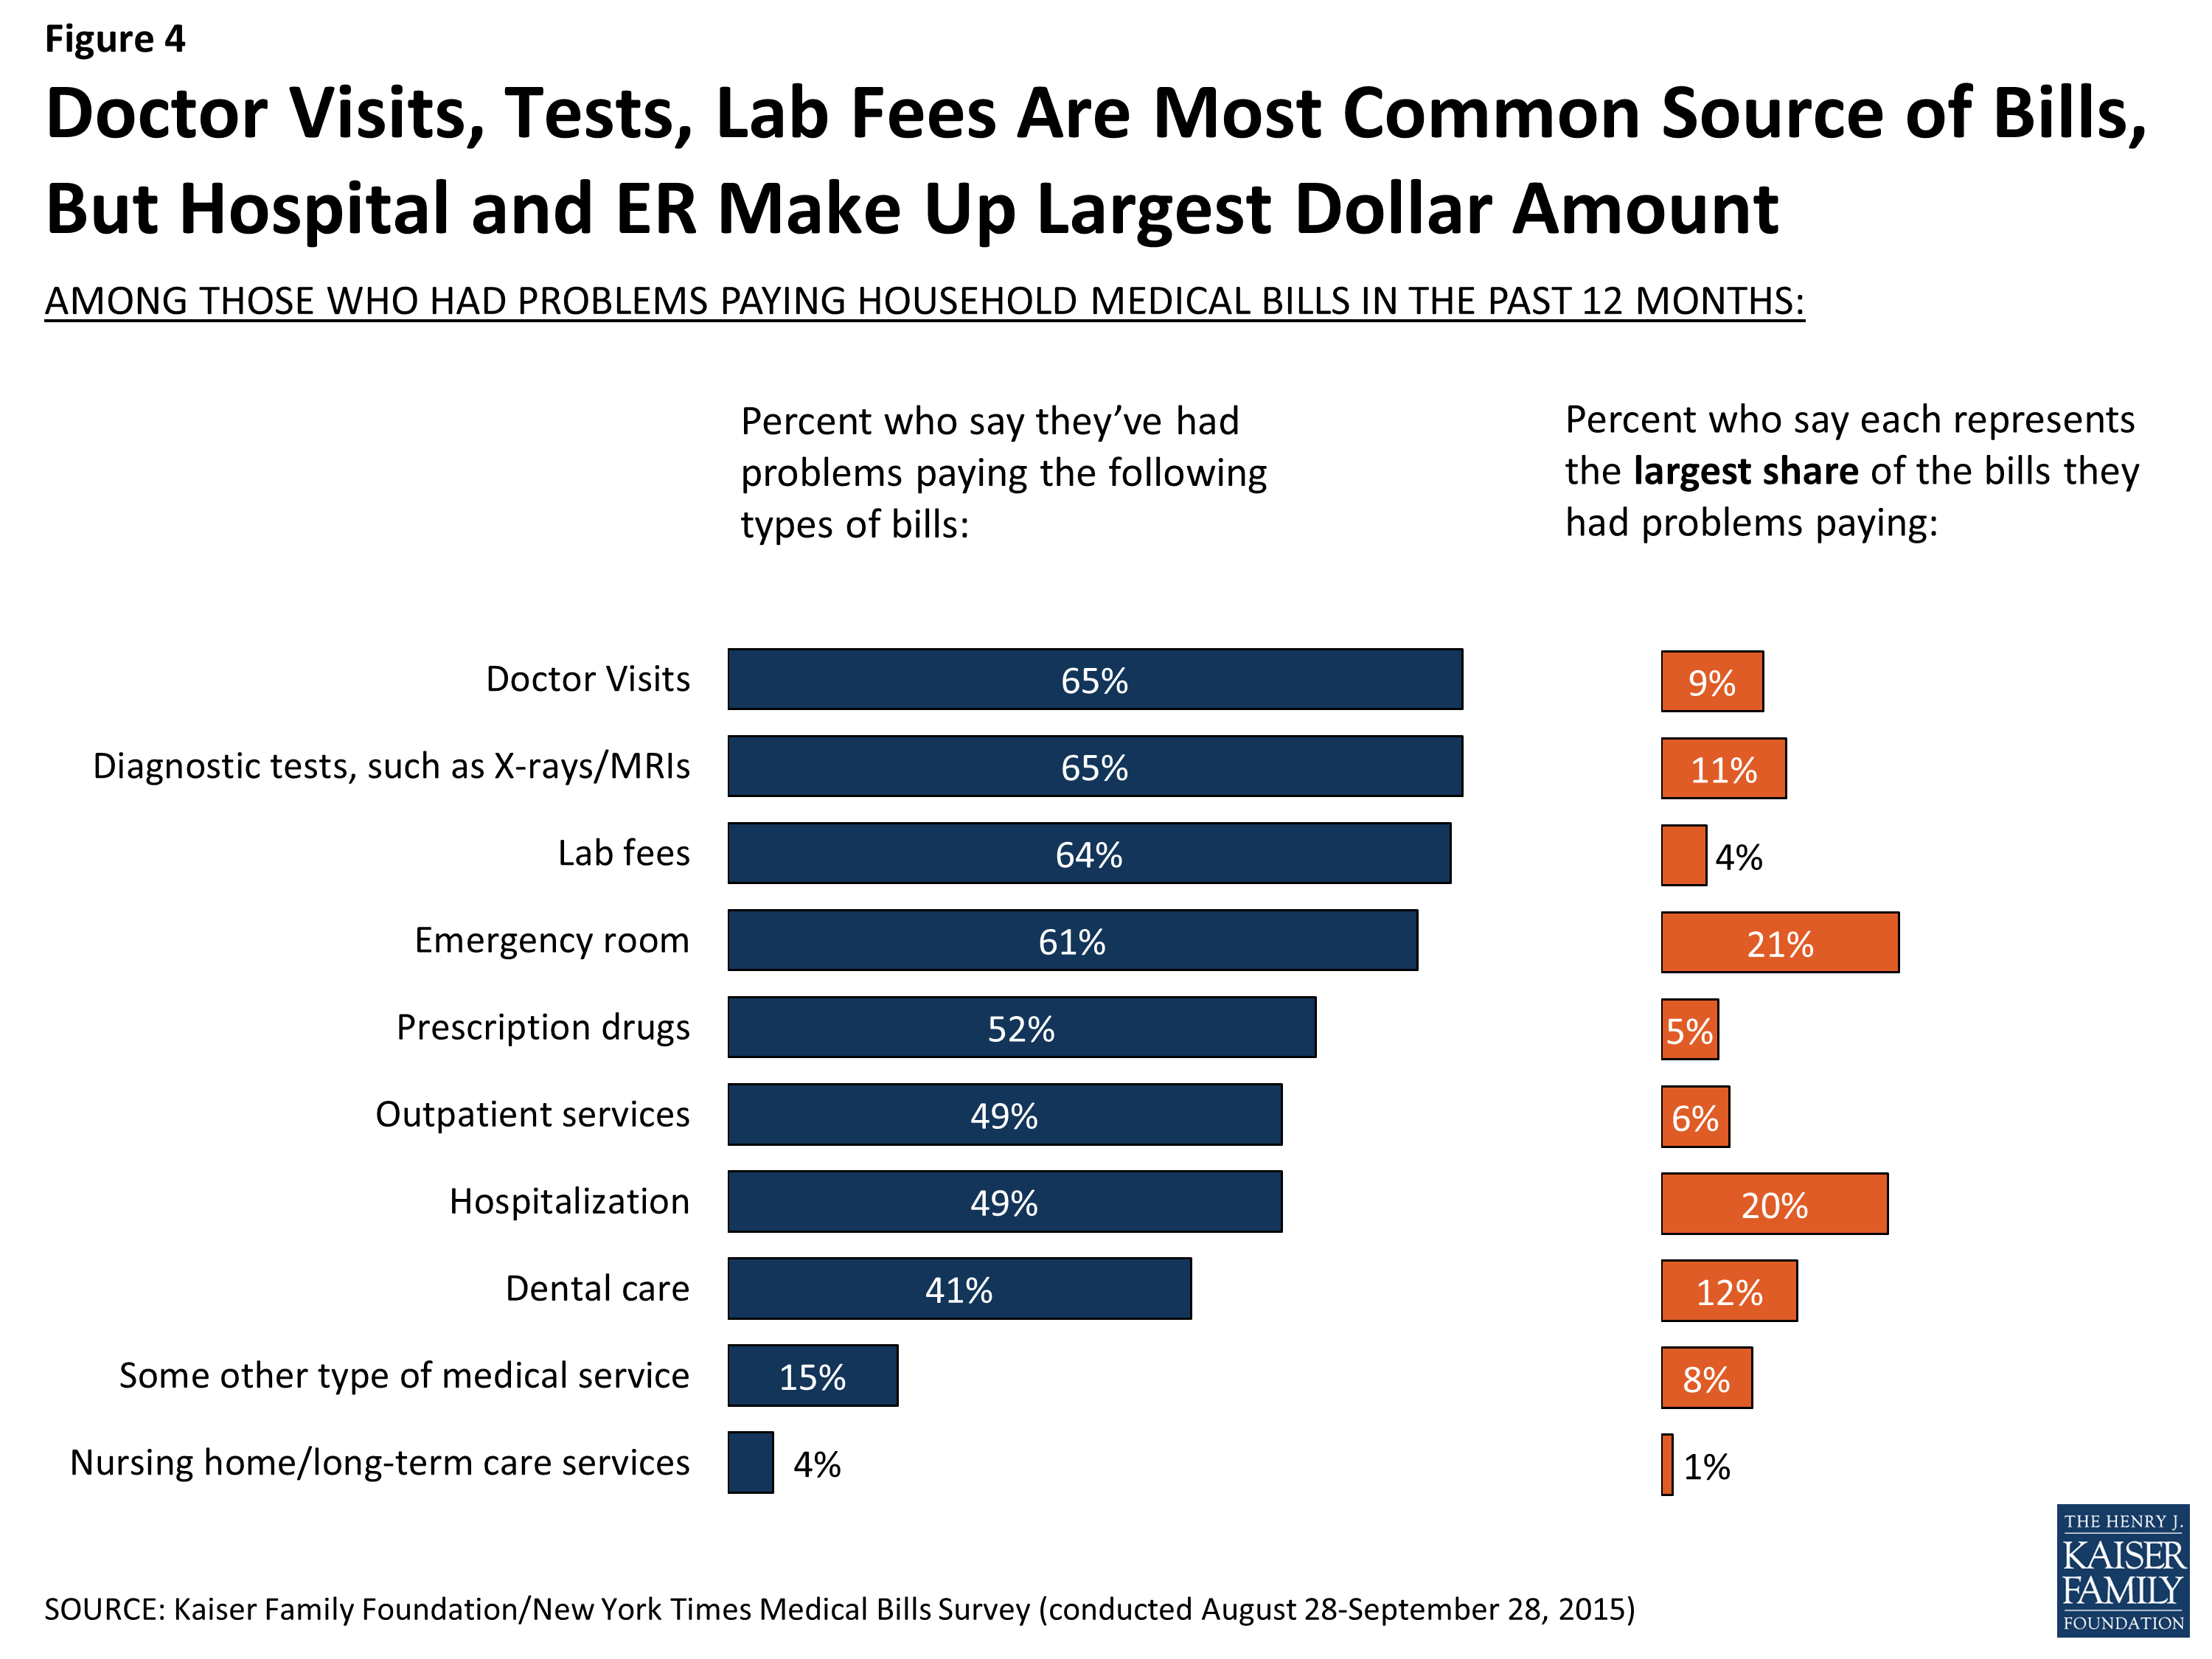
Figure 4: Doctor Visits, Tests, Lab Fees Are Most Common Source of Bills, But Hospital and ER Make Up Largest Dollar Amount
When asked to describe in their own words the illness or injury that led to their medical bill problems, people give a variety of responses. Overall, the largest share (36 percent) name a specific disease, symptom or condition like heart disease or gastrointestinal problems, followed by issues related to chronic pain or injuries (16 percent), accidents and broken bones (15 percent), surgery (10 percent), dental issues (10 percent), and infections like pneumonia and flu (9 percent). Five percent each cite mental health or substance abuse issues and pregnancy or childbirth as the cause of their bills.
Among who say their bill problems were the result of a one-time or short-term medical expense, just under one in five (18 percent) cite an accident as the main cause. Most of the others name illnesses, pain, dental issues, or surgery, suggesting that although most bill problems are caused by one-time events, these events are often acute episodes of illness or expensive surgeries, medications or tests, rather than injuries caused by accidents. Those who say their bills have built up over time are even more likely to cite specific diseases, the most common being cancer (14 percent), heart disease (11 percent), and diabetes (11 percent).
| Table 1: Self-Reported Descriptions of Situations Leading to Medical Bill Problems | |||
| Could you briefly describe the illness or injury that led to [these medical] bills? (open-ended question) | Total | Among those who say bills were for a one-time or short-term medical expense
(66% of total) |
Among those who say bills have built up over time
(33% of total) |
| Diseases/Illnesses/Symptoms (NET) | 36% | 26% | 56% |
| Heart disease/heart attack/stroke | 8 | 6 | 11 |
| Cancer/tumors | 6 | 2 | 14 |
| Gastrointestinal/stomach | 6 | 6 | 8 |
| Allergies/asthma/respiratory disease | 5 | 4 | 7 |
| Diabetes | 4 | 1 | 11 |
| High blood pressure | 4 | 2 | 6 |
| Neurological problems | 3 | 2 | 4 |
| Auto-immune disease | 2 | 1 | 4 |
| Kidney disease/problems | 2 | 2 | 1 |
| Cervical/ovarian/gynecologic problems | 2 | 2 | <1 |
| Thyroid issues | 1 | <1 | 1 |
| Pain/injuries (NET) | 16 | 15 | 17 |
| Arthritis/joint pain/problems | 8 | 8 | 9 |
| Back/neck pain/problems | 6 | 5 | 6 |
| Chronic pain, other/unspecified | 3 | 3 | 4 |
| Accident/Broken bones (NET) | 15 | 18 | 6 |
| Broken bones | 5 | 6 | 2 |
| Accident, car/vehicle | 5 | 6 | 1 |
| Accident, unspecified | 5 | 6 | 2 |
| Accident, job-related | 1 | 1 | <1 |
| Surgery | 10 | 10 | 9 |
| Teeth/Dental | 10 | 11 | 7 |
| Infectious diseases (NET) | 9 | 10 | 7 |
| Pneumonia/lung infection | 3 | 2 | 4 |
| Viral infections | 3 | 5 | 1 |
| Other/unspecified infection | 2 | 3 | 1 |
| Mental Health/Substance abuse | 5 | 4 | 7 |
| Pregnancy/Child birth/Maternity care | 5 | 6 | 3 |
| Cancer screening | 1 | 2 | 1 |
| Vision/Eye Problems | 1 | 1 | 2 |
| Other | 8 | 9 | 6 |
| Don’t know/Refused/Skipped | 5 | 4 | 5 |
| NOTE: Percentages add up to more than 100 because multiple responses were accepted. | |||
In their own words: Could you briefly describe the illness or injury that led to these medical bills?
The open-ended responses to this question show that medical bill problems can arise from single health events or chronic, ongoing conditions. Problems occur among people with and without insurance. They can affect one person or multiple family members at a time. Unexpected bills may arise when people don’t realize how many providers will bill separately for a single treatment event, or when insurance doesn’t pay for care people thought would be covered. Medical bill problems may be short term, or drag on for years.
- “A heart attack (MI) requiring 4 stents being placed. Also an appendectomy. Ongoing: diabetes and heart disease that require monthly visits and prescriptions. My son also has epilepsy which has impacted our medical expenses.”
- “In 2002 I had a pancreatic attack, a tumor in my pancreas removed and my spleen removed, and I broke 2 arms at the same time, partial hysterectomy. And hepatitis.”
- “Cancer. Current treatment not FDA approved for certain cancers, so even though the treatment is working, it is no longer covered by insurance and costs approximately $11,000 per month.”
- “It’s a whole lot. Diabetes and claustrophobic and everything. TIA, a mini stroke, depression, anxiety.”
- “I had a tooth that went bad and had to have it pulled. I now need another tooth in its place. The dentist wants all the money for the procedure up front. I do not have thousands of dollars to give.”
- “Was treated by my family doctor for a MRSA infection which led to C-Diff which I went to the ER for. They ran several tests and diagnosed the illness but sent me home with no treatment. I had made arrangements to pay the bill monthly and came to realize there were several other bills associated with the visit that were specific to Doctor, CT scan, Lab all being separate bills.”
- “I have been diagnosed with osteoarthritis throughout my body, as well as degenerative disc disease. I have had to have at least 6 MRI’s in past 5 years, 3 back injections, 5 foot surgeries, 2 knee surgeries, wrist surgery, torn tendon repair, several joint replacement surgeries, etc.”
- “I was pregnant and miscarried when I was 10.5 weeks a long. Prior to losing the baby, I had an ultrasound which cost $636 and I don’t have insurance. I was eligible for pregnancy-related Medicaid, but it wasn’t billed right and a year and a half later I got the bill. I am still trying to get it straightened out.”
- “Eye glasses not covered. Orthotics not covered. Many different problems with feet.”
- “Insurance not paying for wellness care of any kind, blood work, labs, physical and only 8o% of a mammogram.”
Financial status of those with medical bill problems
About three in ten (31 percent) of those with medical bill problems say the total amount of the bills they had problems paying was $5,000 or more, including 13 percent who report bills adding to at least $10,000. Insurance appears to provide some protection from the highest bills, as the insured are less likely than the uninsured to report having bills of $10,000 or more (8 percent versus 21 percent).
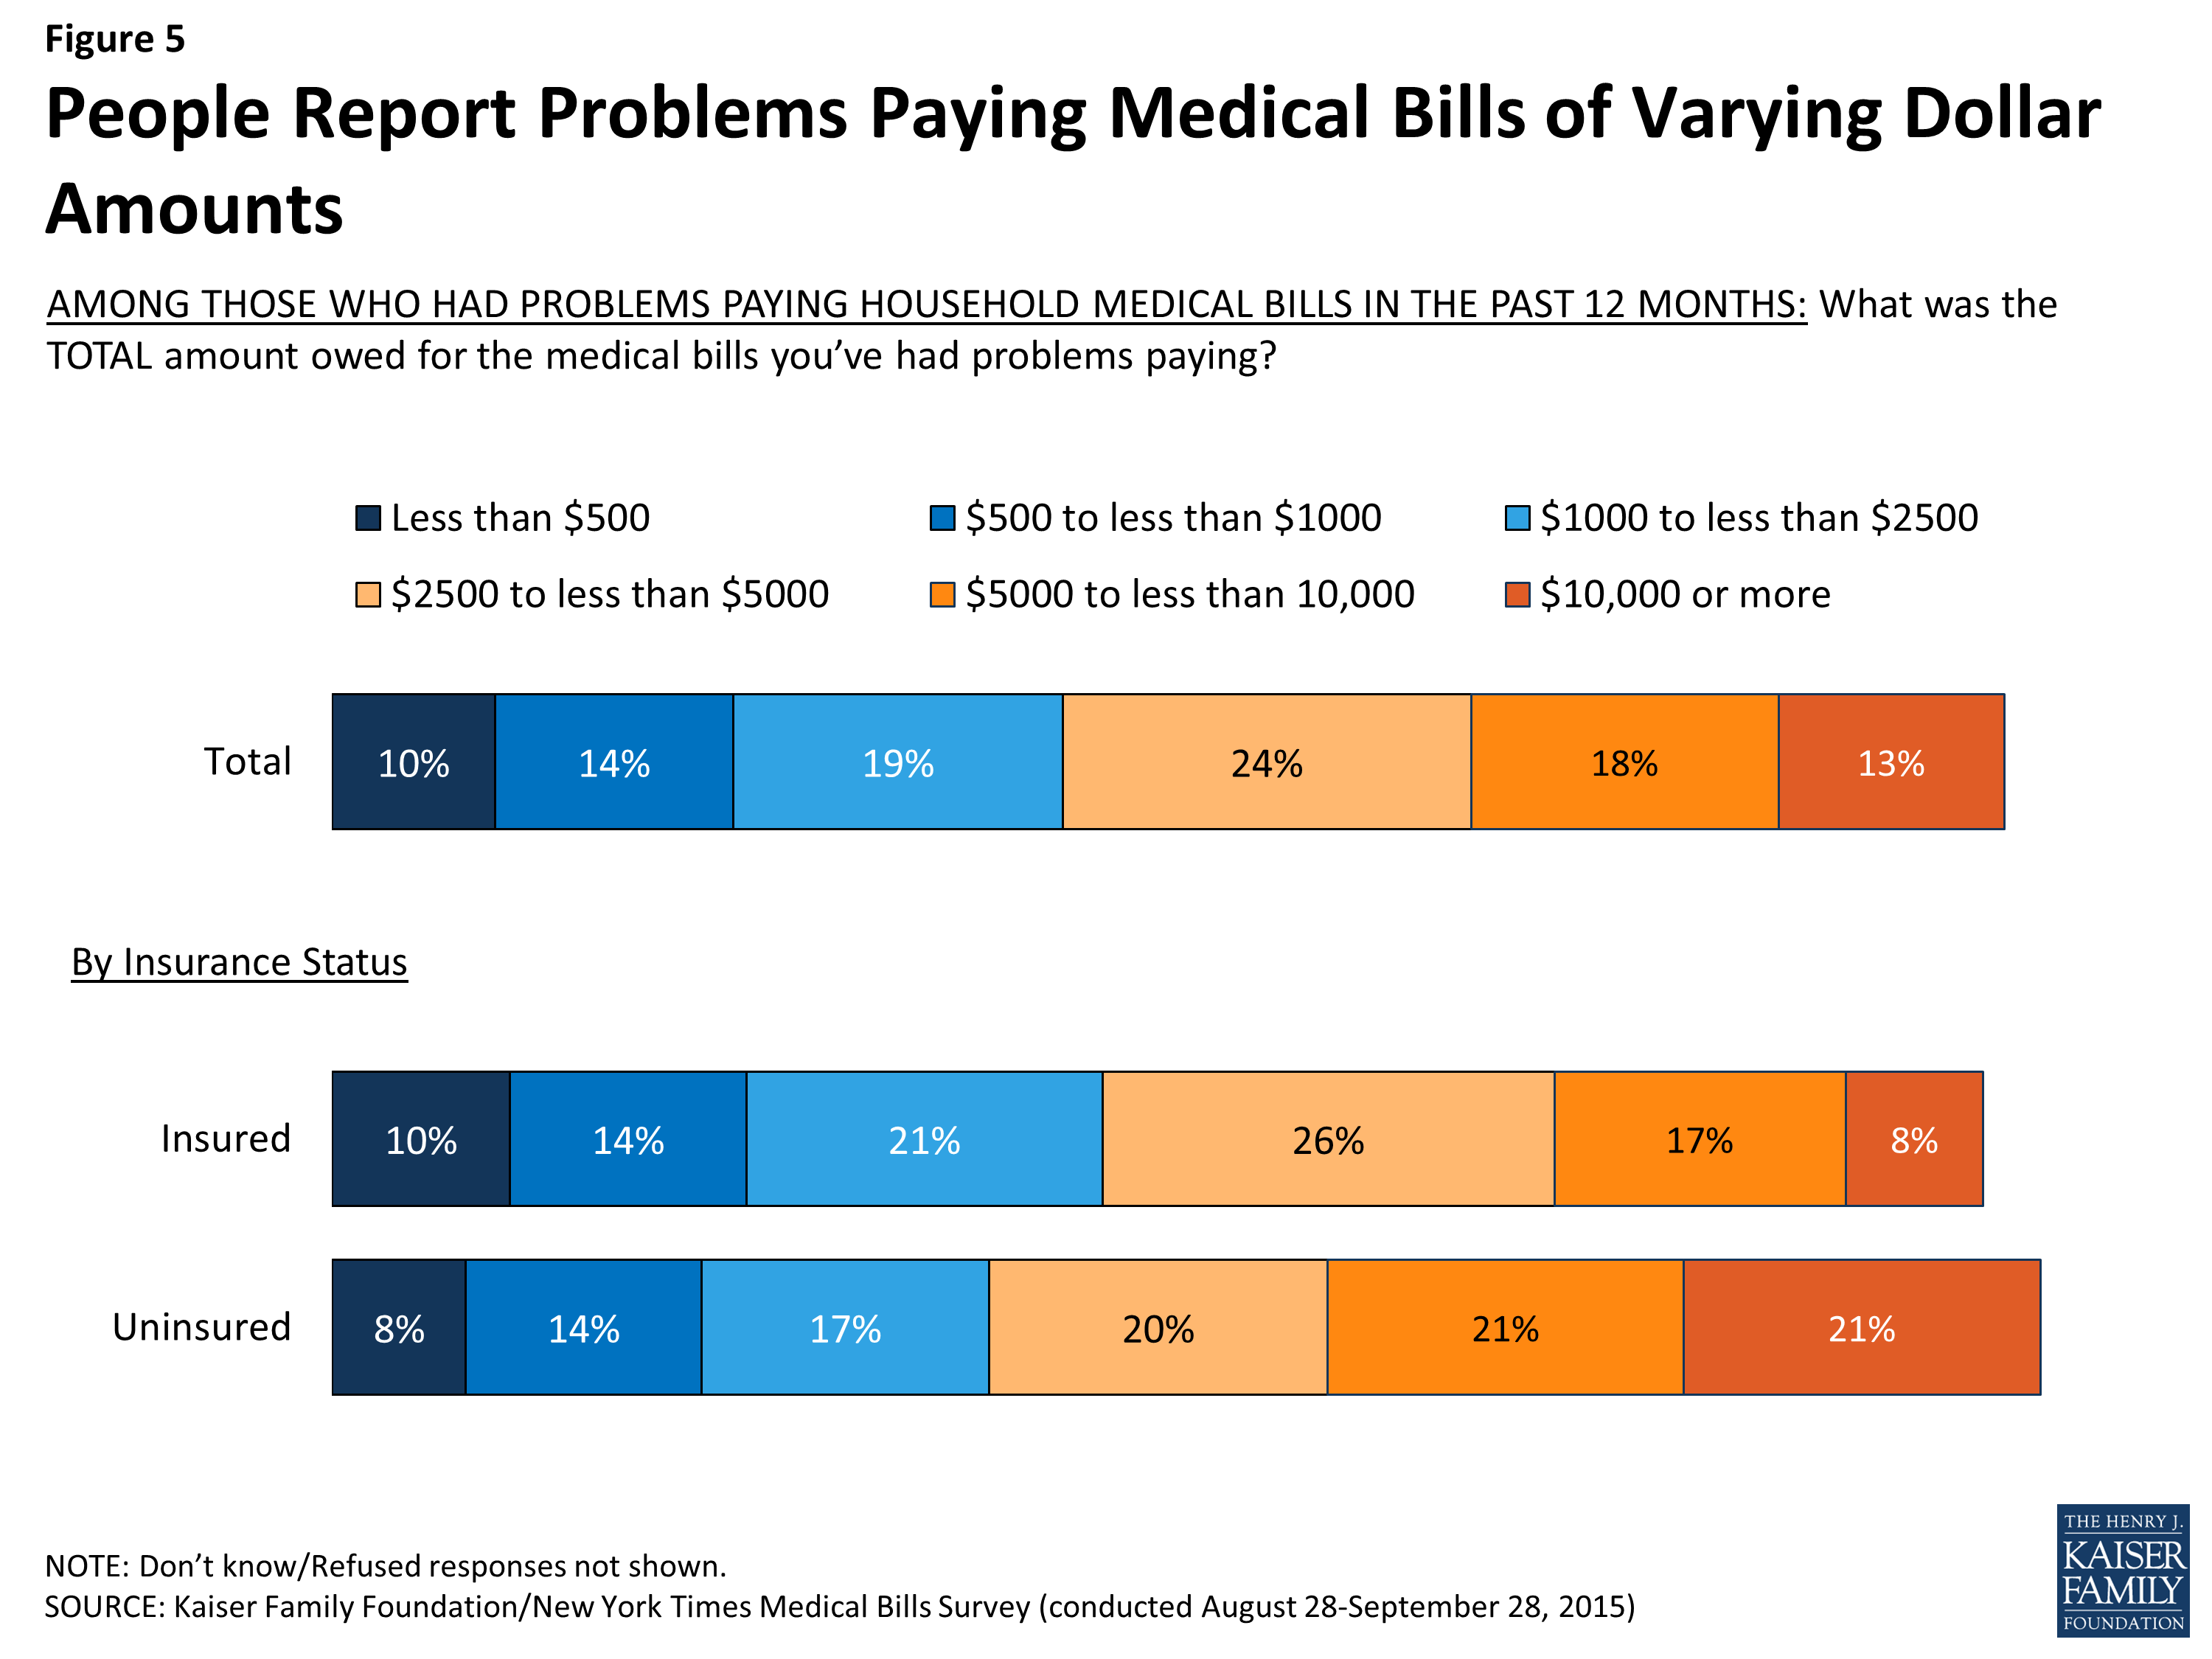
Figure 5: People Report Problems Paying Medical Bills of Varying Dollar Amounts
Many of those with medical bill problems report struggling with bills of lower amounts, including 24 percent of the insured and 22 percent of the uninsured who say their bills amounted to less than $1,000. While these lower amounts may seem small, even a bill of $500 or less can present a major problem for someone who is living paycheck to paycheck. In fact, when asked to describe their financial situation, about six in ten (61 percent) of those who’ve had problems paying medical bills say they either just meet their basic expenses (43 percent) or don’t have enough to meet basic expenses (18 percent). Among the comparison group who did not report problems paying medical bills, just a quarter (24 percent) report such a tenuous financial situation, while the majority say they either live comfortably or meet their basic expenses with a little left over for extras.
Given their differing demographic profiles, it’s not surprising that those with health insurance are less likely than those without insurance to say they struggle to meet basic expenses. However, even among the insured, those who have faced medical bill problems are significantly more likely than their counterparts who haven’t had such problems to say they are either just getting by or don’t have enough to make ends meet (55 percent versus 22 percent).
| Table 2: Most of Those with Medical Bill Problems Report Just Making Ends Meet | ||||||
| Total adults 18-64 | Insured | Uninsured | ||||
| How would you describe your household’s financial situation? | Medical bill problems | No medical bill problems | Medical bill problems | No medical bill problems | Medical bill problems | No medical bill problems |
| Live comfortably | 8% | 35% | 9% | 37% | 6% | 18% |
| Meet your basic expenses with a little left over for extras | 31 | 41 | 36 | 42 | 20 | 36 |
| Just meet your basic expenses | 43 | 18 | 41 | 16 | 46 | 38 |
| Don’t have enough to meet basic expenses | 18 | 6 | 14 | 6 | 26 | 8 |
| NOTE: Don’t know/Refused responses not shown. | ||||||
The financial accounts held by people who’ve had problems paying medical bills also paint a picture of a more fragile financial situation. A large majority (78 percent) say they have a checking or savings account, though this is lower than among those who have not had medical bill problems (90 percent). Compared to those without medical debt, those who’ve had medical bill problems are also less likely to say they have a credit card (53 percent versus 77 percent), a retirement savings account (43 percent versus 62 percent), or some other type of savings (17 percent versus 38 percent). Again, not surprisingly, among those with medical bill problems, the uninsured are less likely than the insured to report having each of these types of accounts.
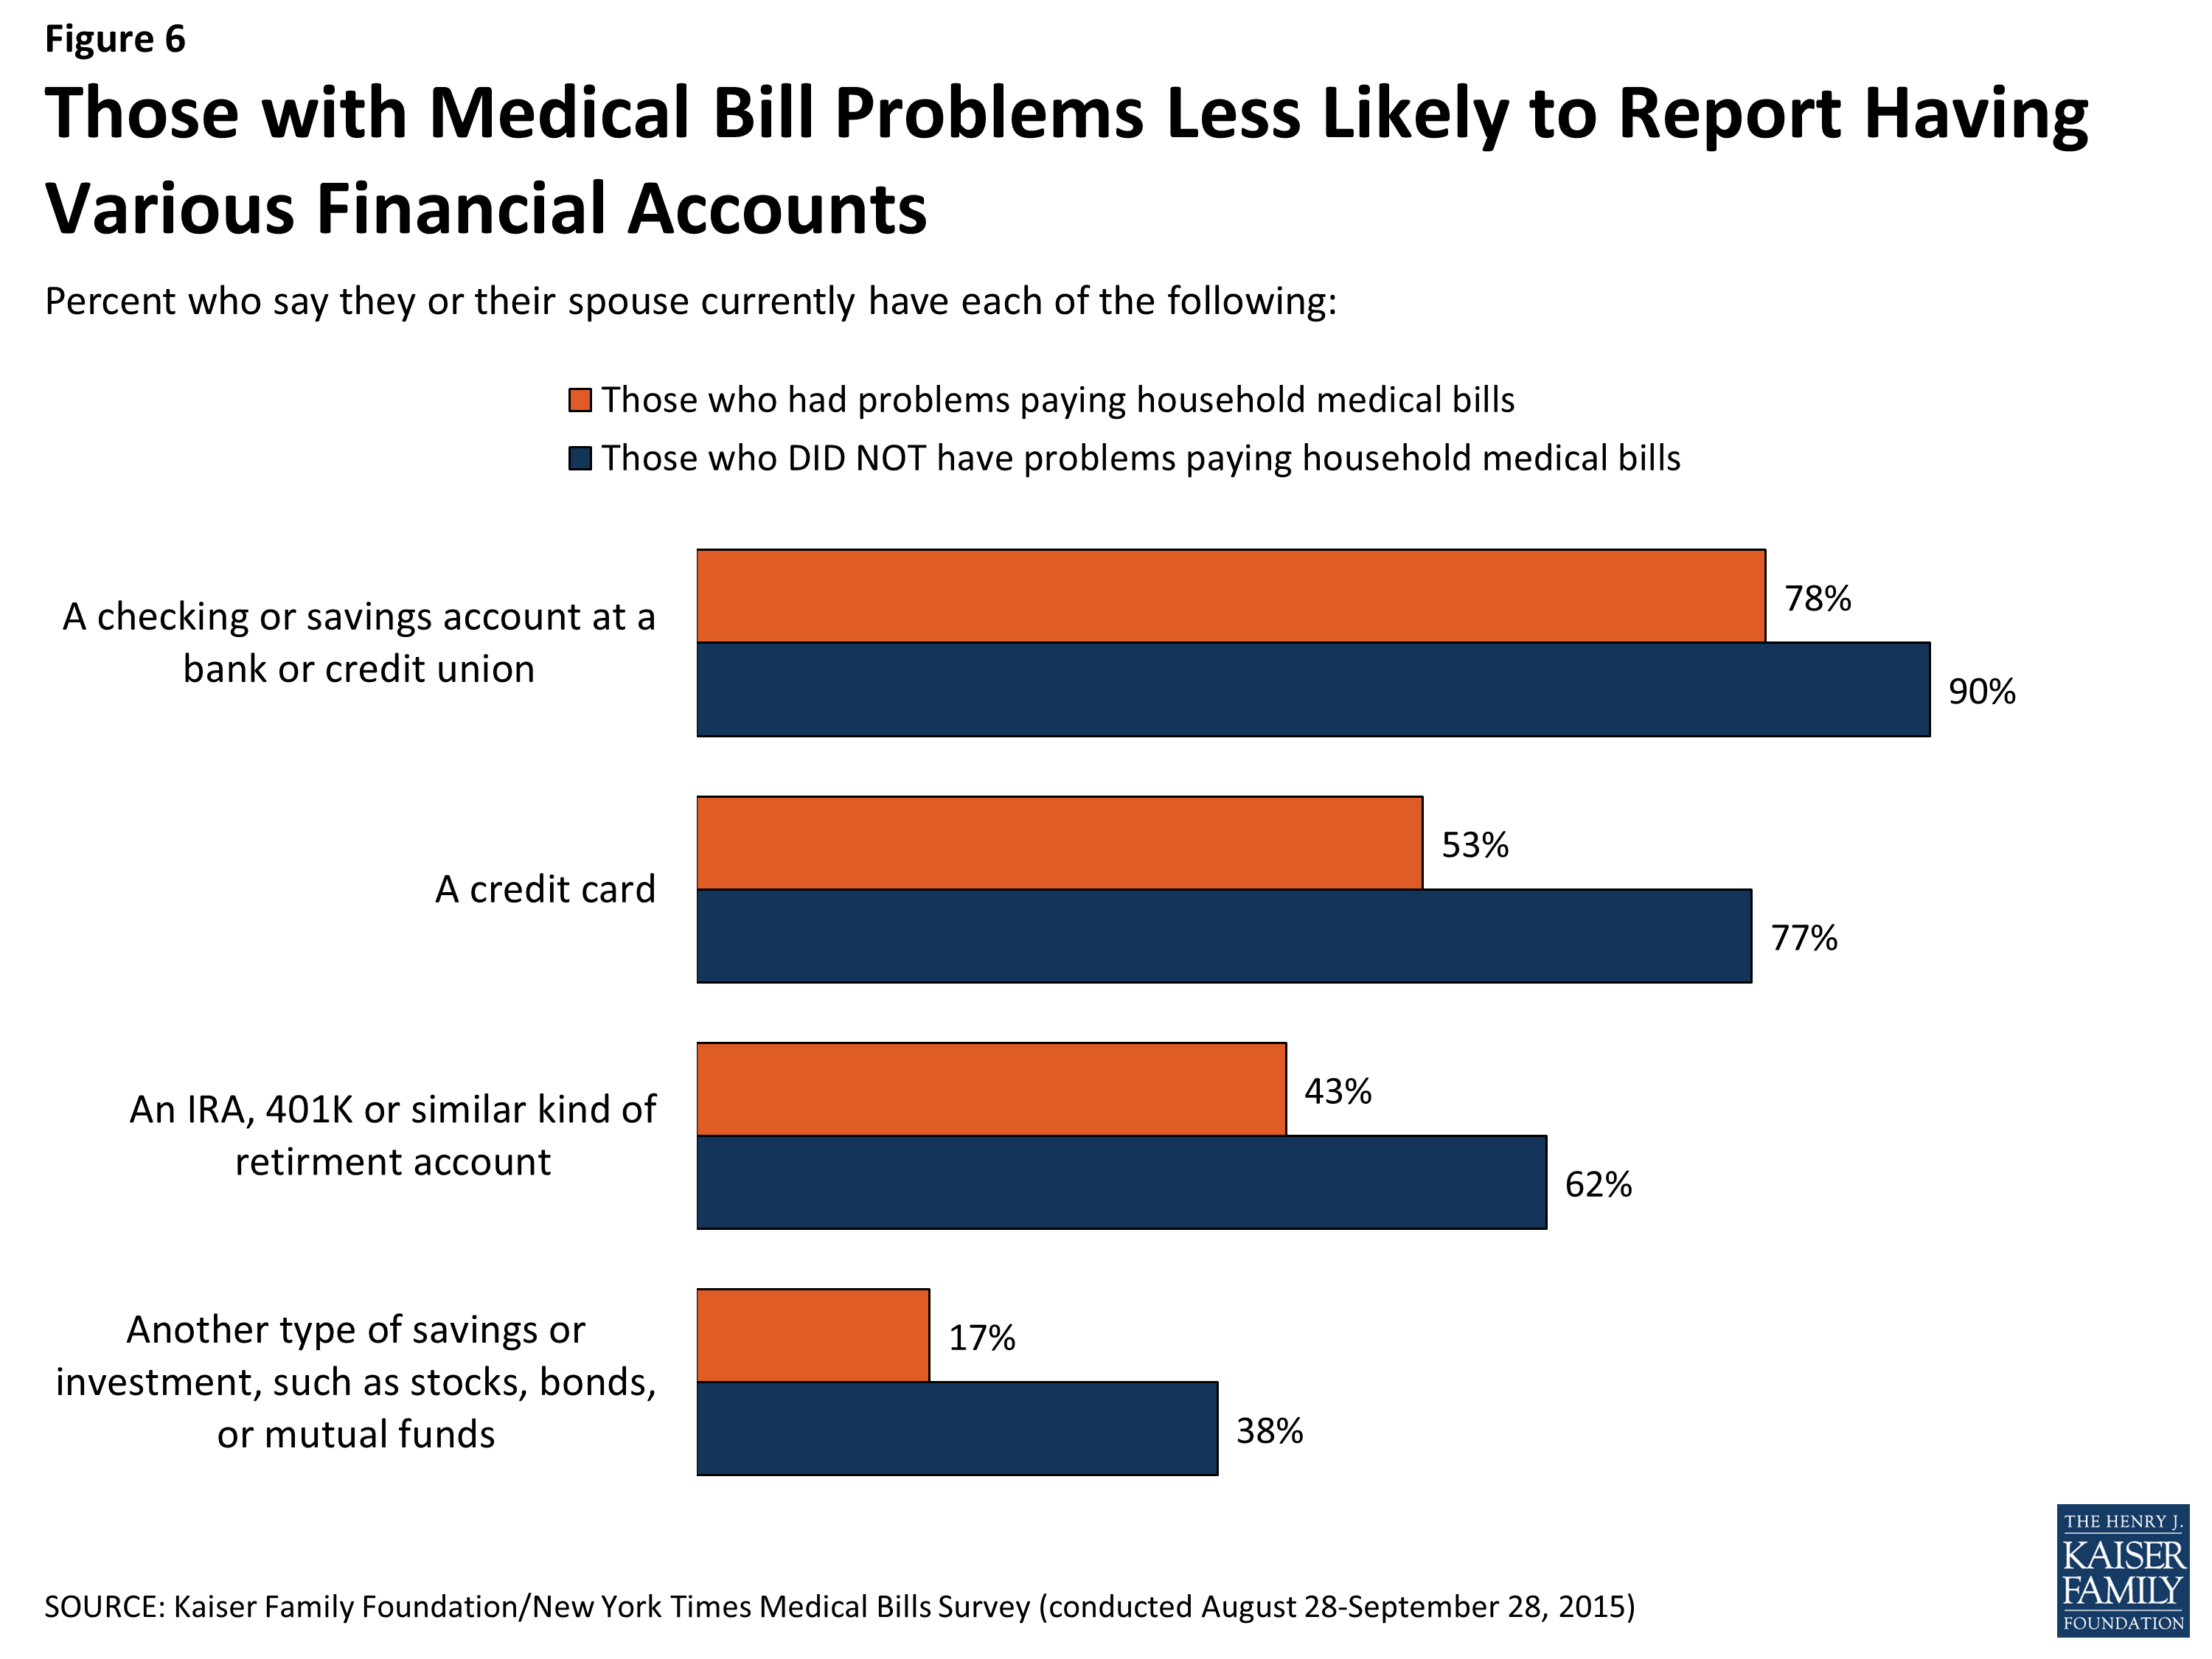
Figure 6: Those with Medical Bill Problems Less Likely to Report Having Various Financial Accounts
Income loss due to illness is another complicating factor for some of those who face medical bill difficulties. About three in ten (29 percent) say that someone in their household had to take a cut in pay or hours as a result of the illness that led to the medical bills, either because of the illness itself or in order to care for the person who was sick. Most of these (19 percent of the total who had problems paying medical bills) say their household income decreased a lot as a result.
The uninsured who had medical bill problems (36 percent) are somewhat more likely to report job losses or pay cuts, but still about a quarter (26 percent) of the insured who had medical bill problems report facing such an adverse employment outcome as a result of the illness that led to their bills.
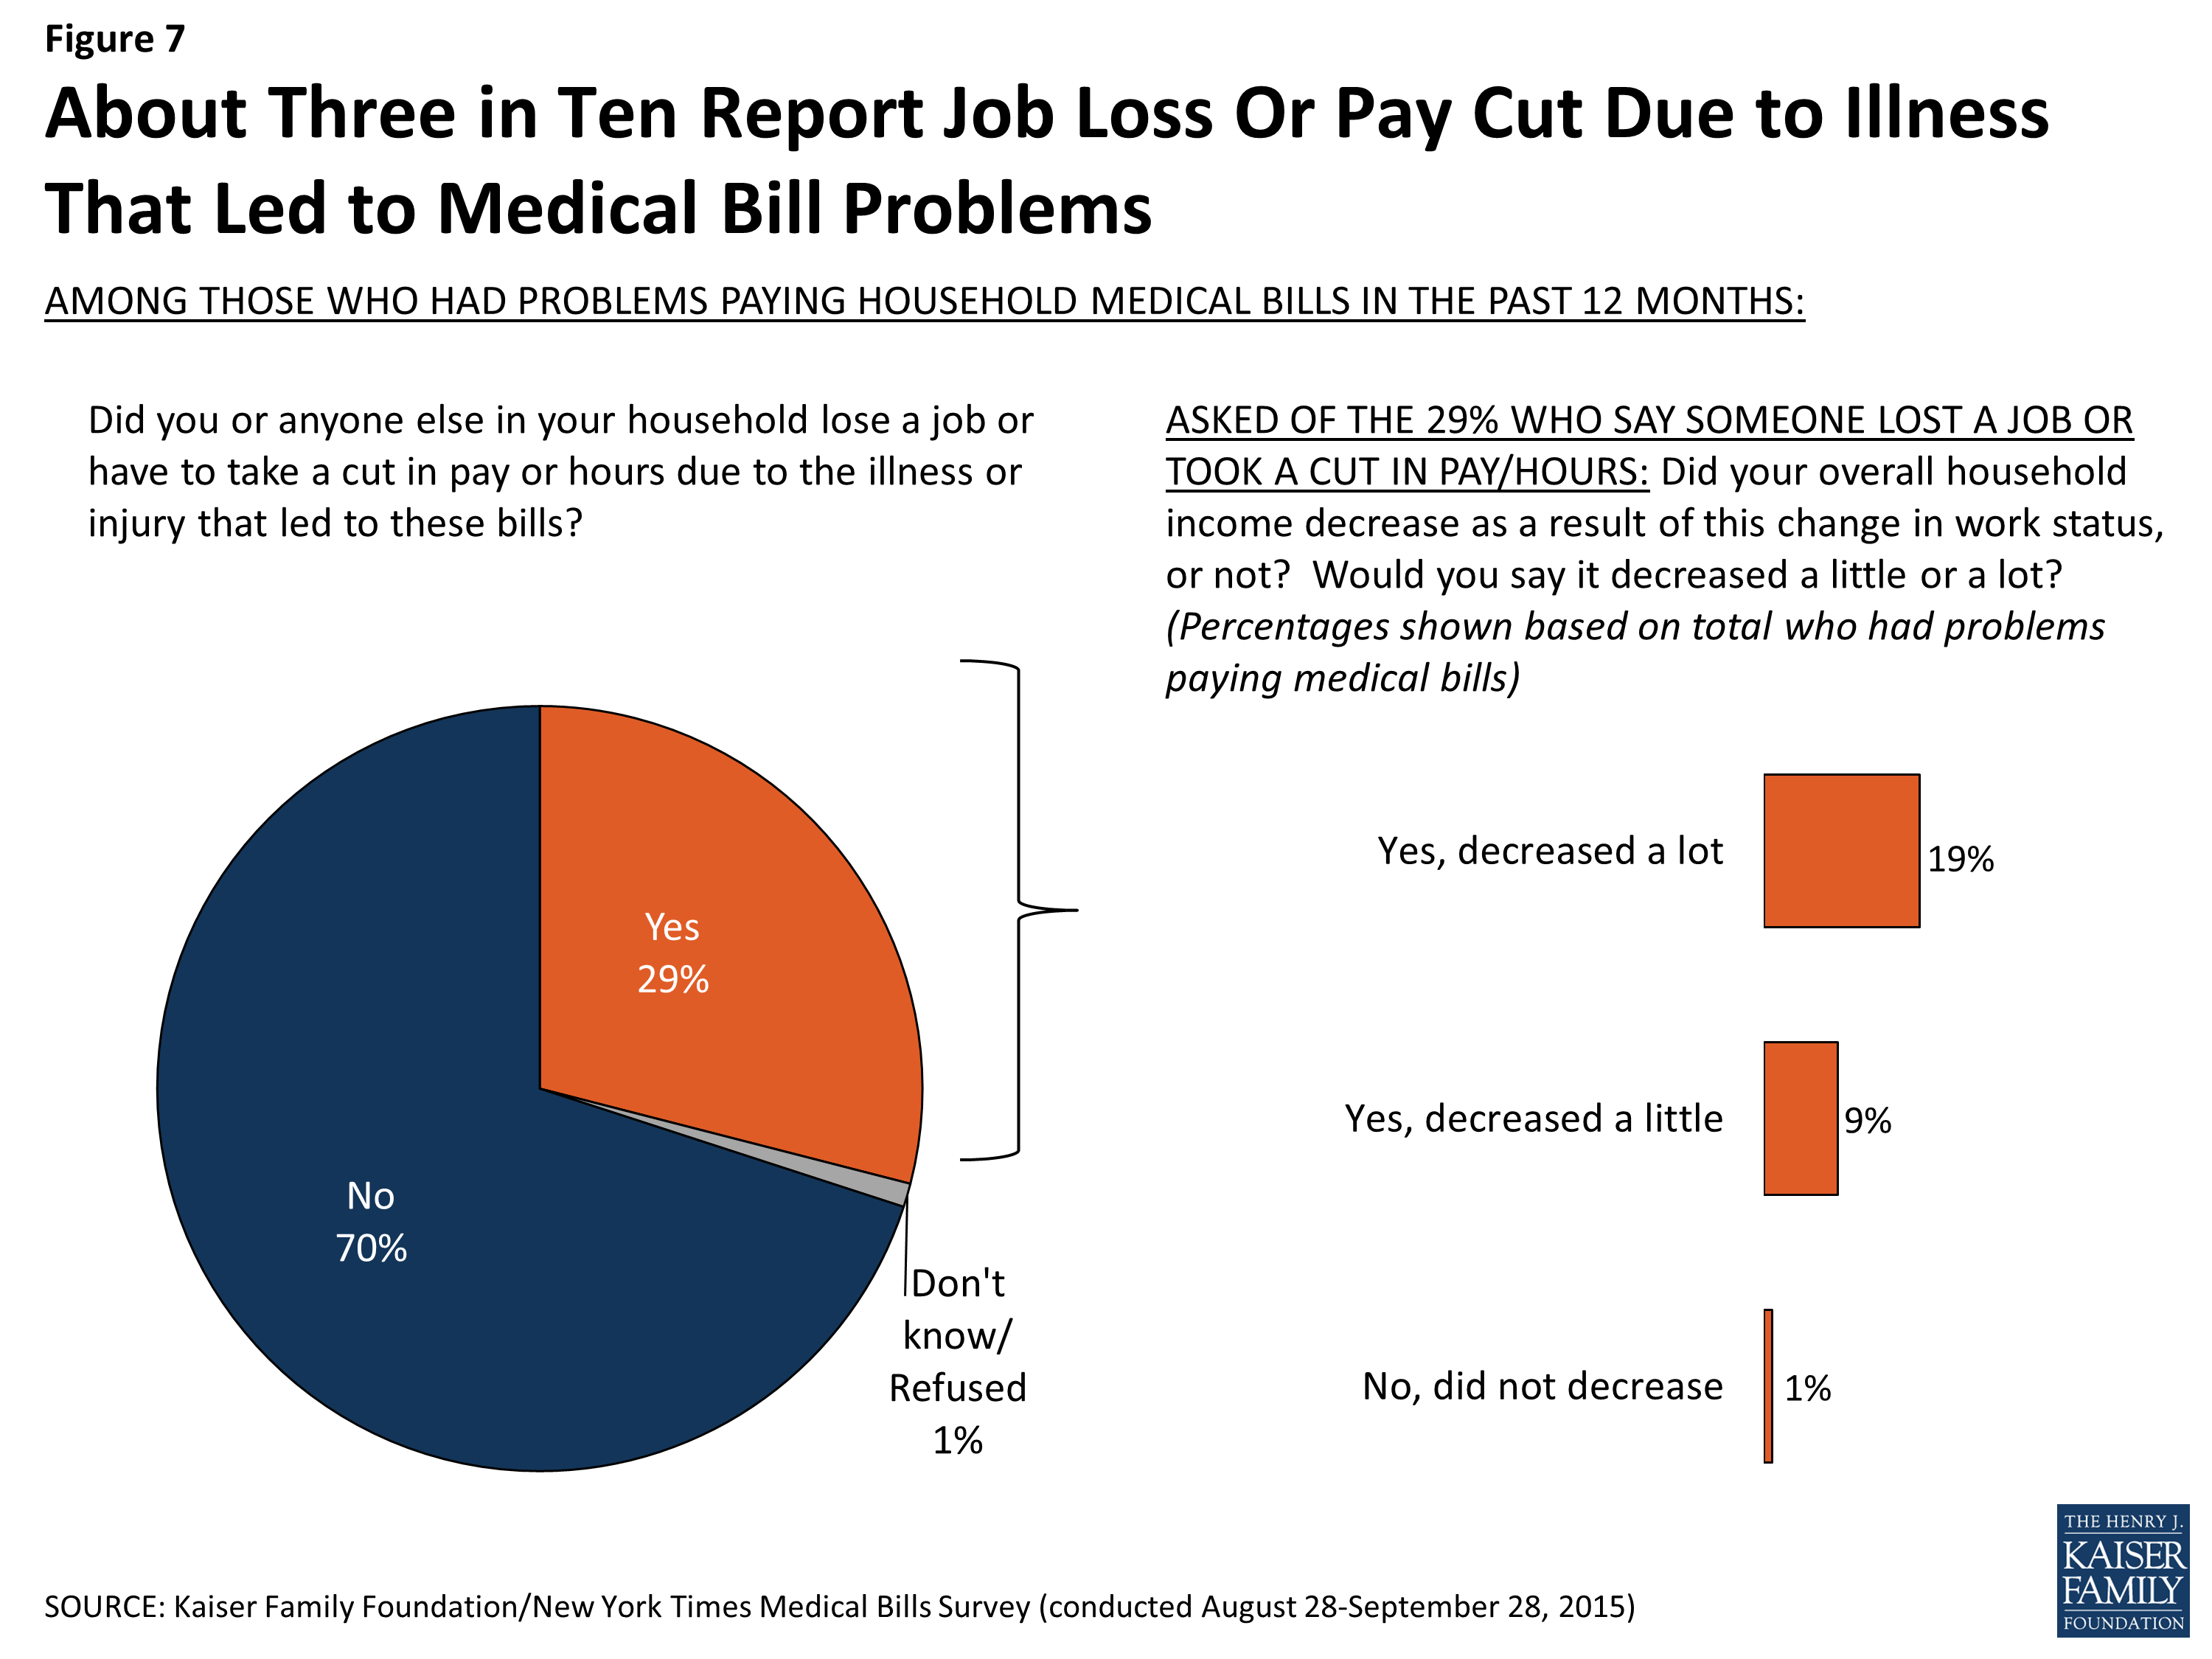
Figure 7: About Three in Ten Report Job Loss Or Pay Cut Due to Illness That Led to Medical Bill Problems
Section 2: The Role of Health Insurance
Medical bill problems among those with health insurance
While problems paying medical bills are more common among the uninsured, more than six in ten (62 percent) of those who had problems paying medical bills say the person who incurred the bills was covered by health insurance when treatment began, with most of that coverage (39 percent of the total) coming through an employer. The vast majority (83 percent) of those who were insured when treatment began say they kept their coverage throughout the treatment period, but 15 percent of them (9 percent of the total) say they lost or dropped coverage at some point, mainly because of job loss or change or because they were no longer eligible for coverage.
Among those with private insurance through an insurer or purchased on their own (46 percent of the total who had problems paying medical bills), about half report having plans with high deductibles (at least $1500 for an individual of $3000 for a family), while the other half report having lower-deductible plans.
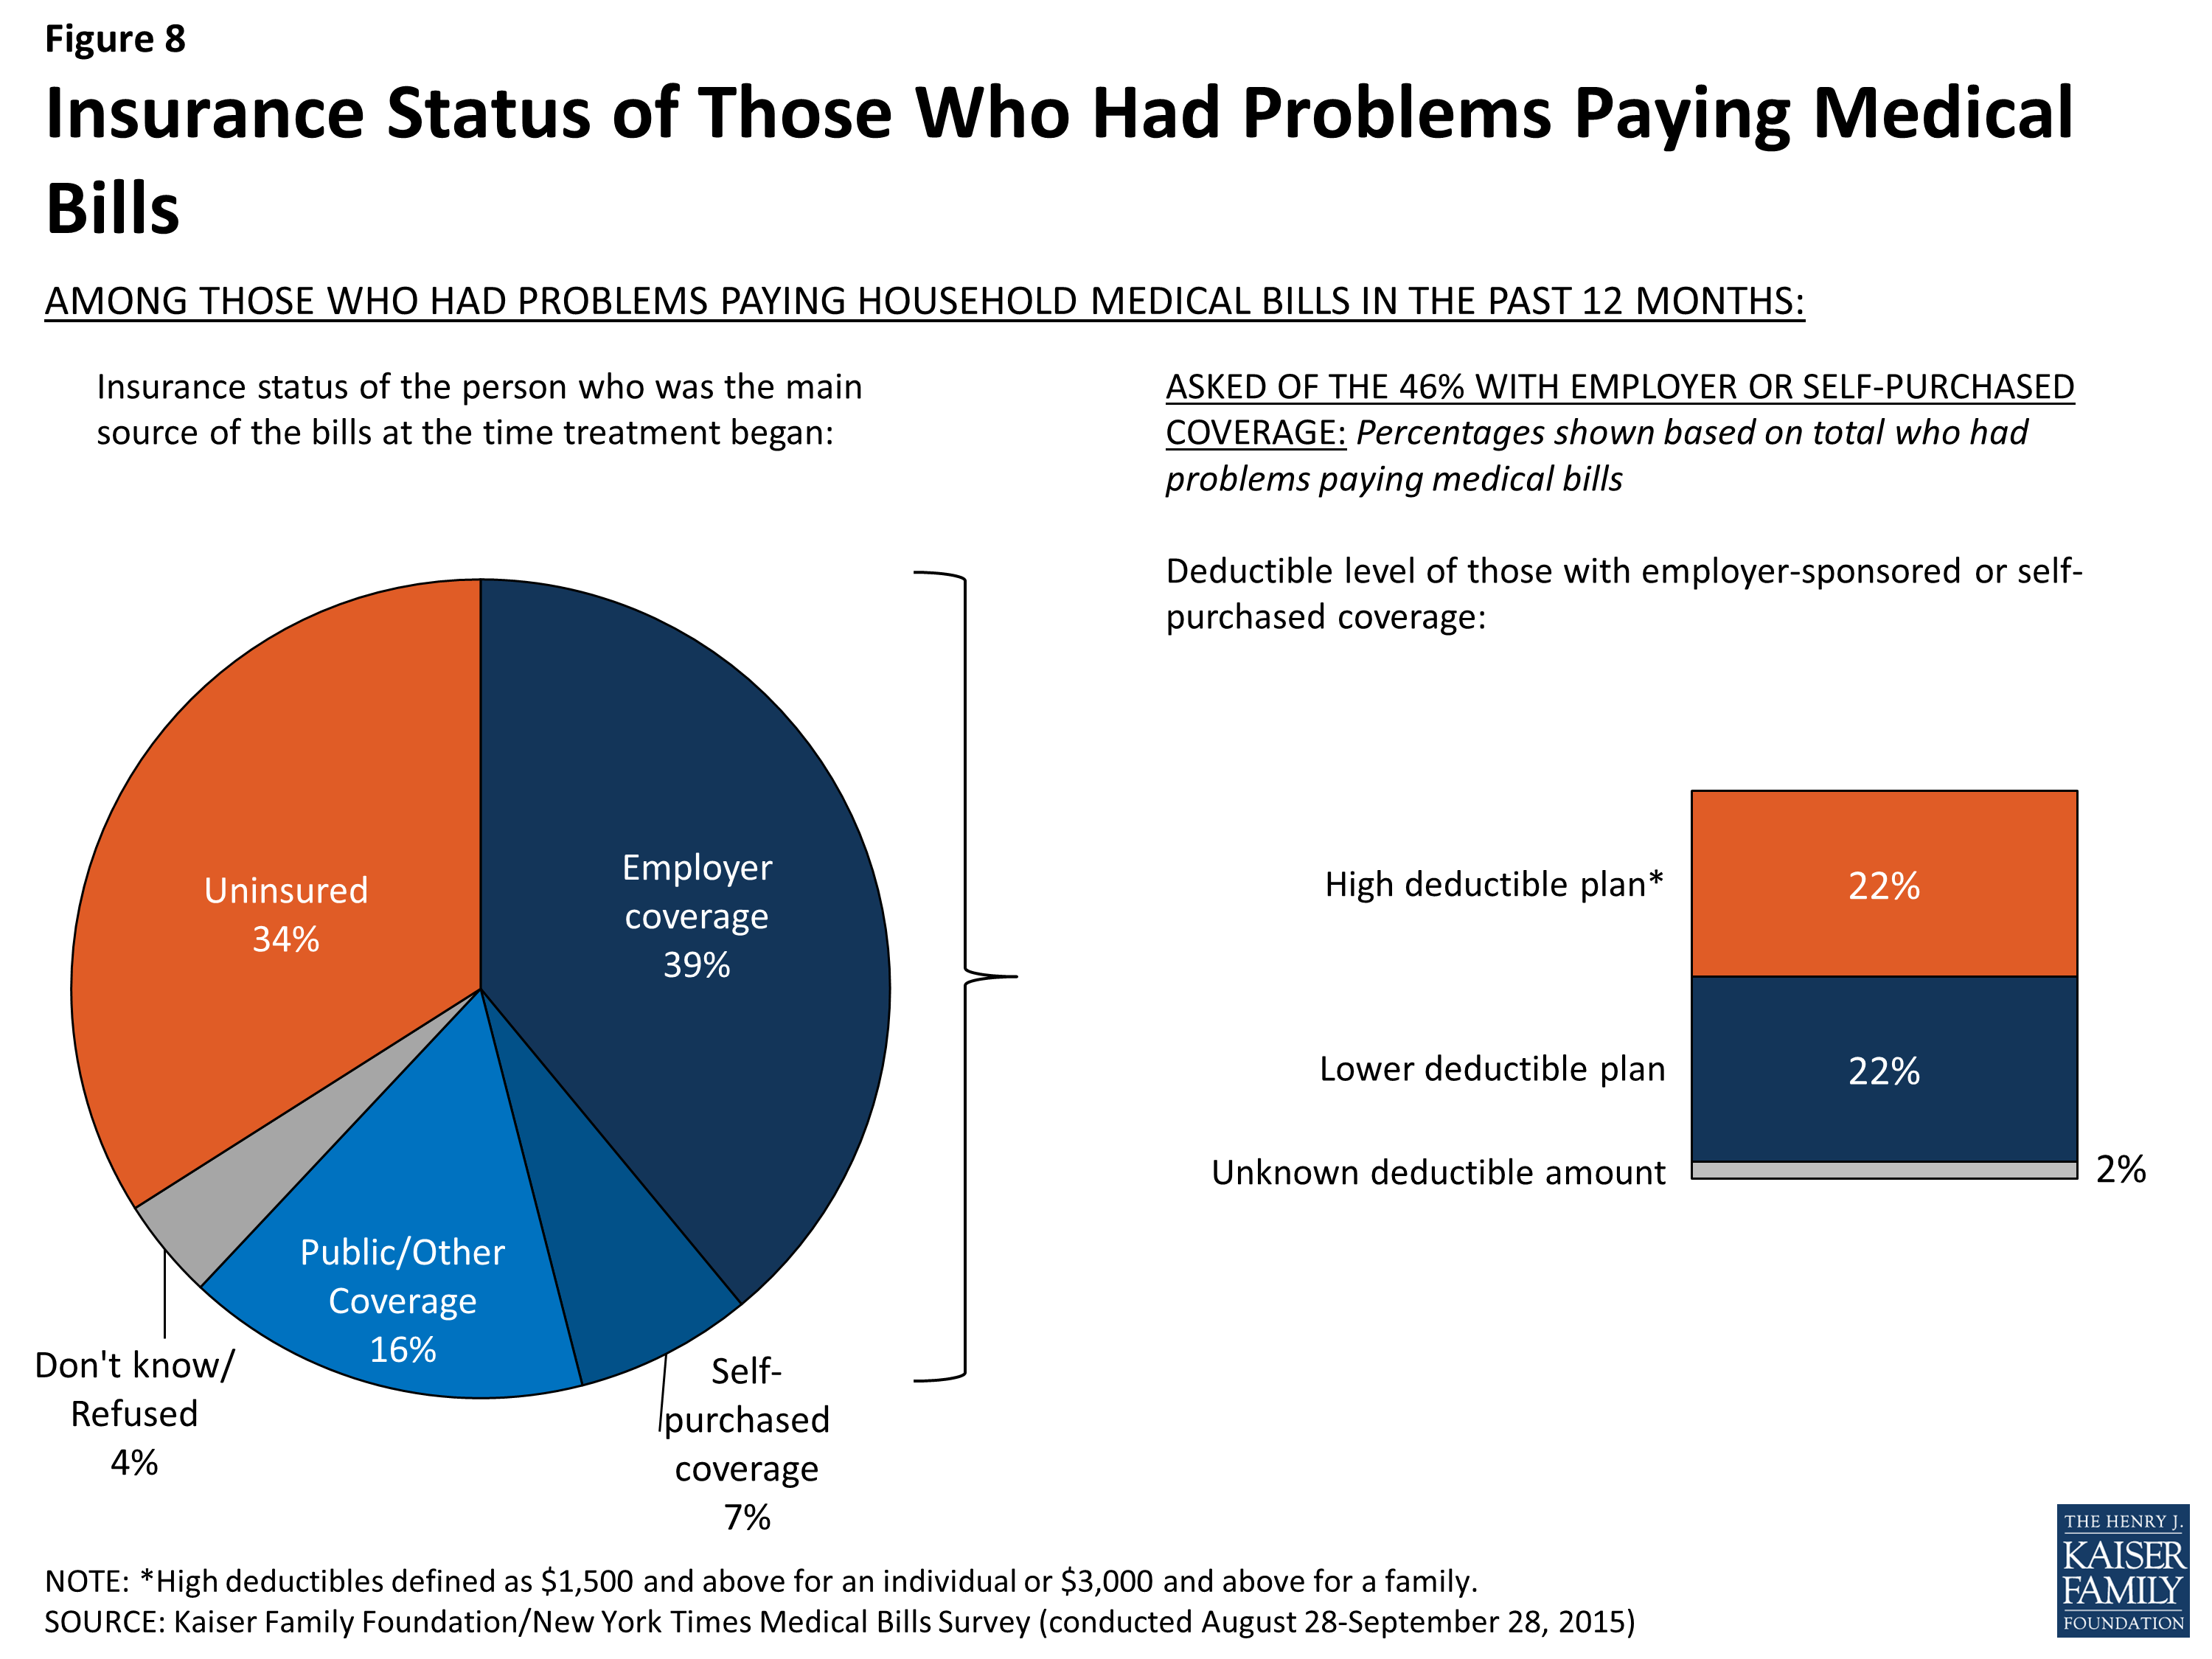
Figure 8: Insurance Status of Those Who Had Problems Paying Medical Bills
Of those who were insured when the bills were incurred, three-quarters (75 percent) say that the amount they had to pay for their insurance copays, deductibles, or coinsurance was more than they could afford. Interestingly, this is true among people in plans with higher deductibles (83 percent) and among those in plans with lower deductibles (76 percent), suggesting that other types of cost-sharing can present a problem even for people in lower-deductible health plans. For example, even under a plan with a relatively low deductible, large medical bills could arise from repeated co-pays or from out-of-network coinsurance. This finding should not be confused with the finding shown in the first section of this report – that people in plans with higher deductibles are more likely to report problems paying medical bills in the first place. However, among insured people who have medical bill problems, most find cost sharing unaffordable regardless of the deductible level.
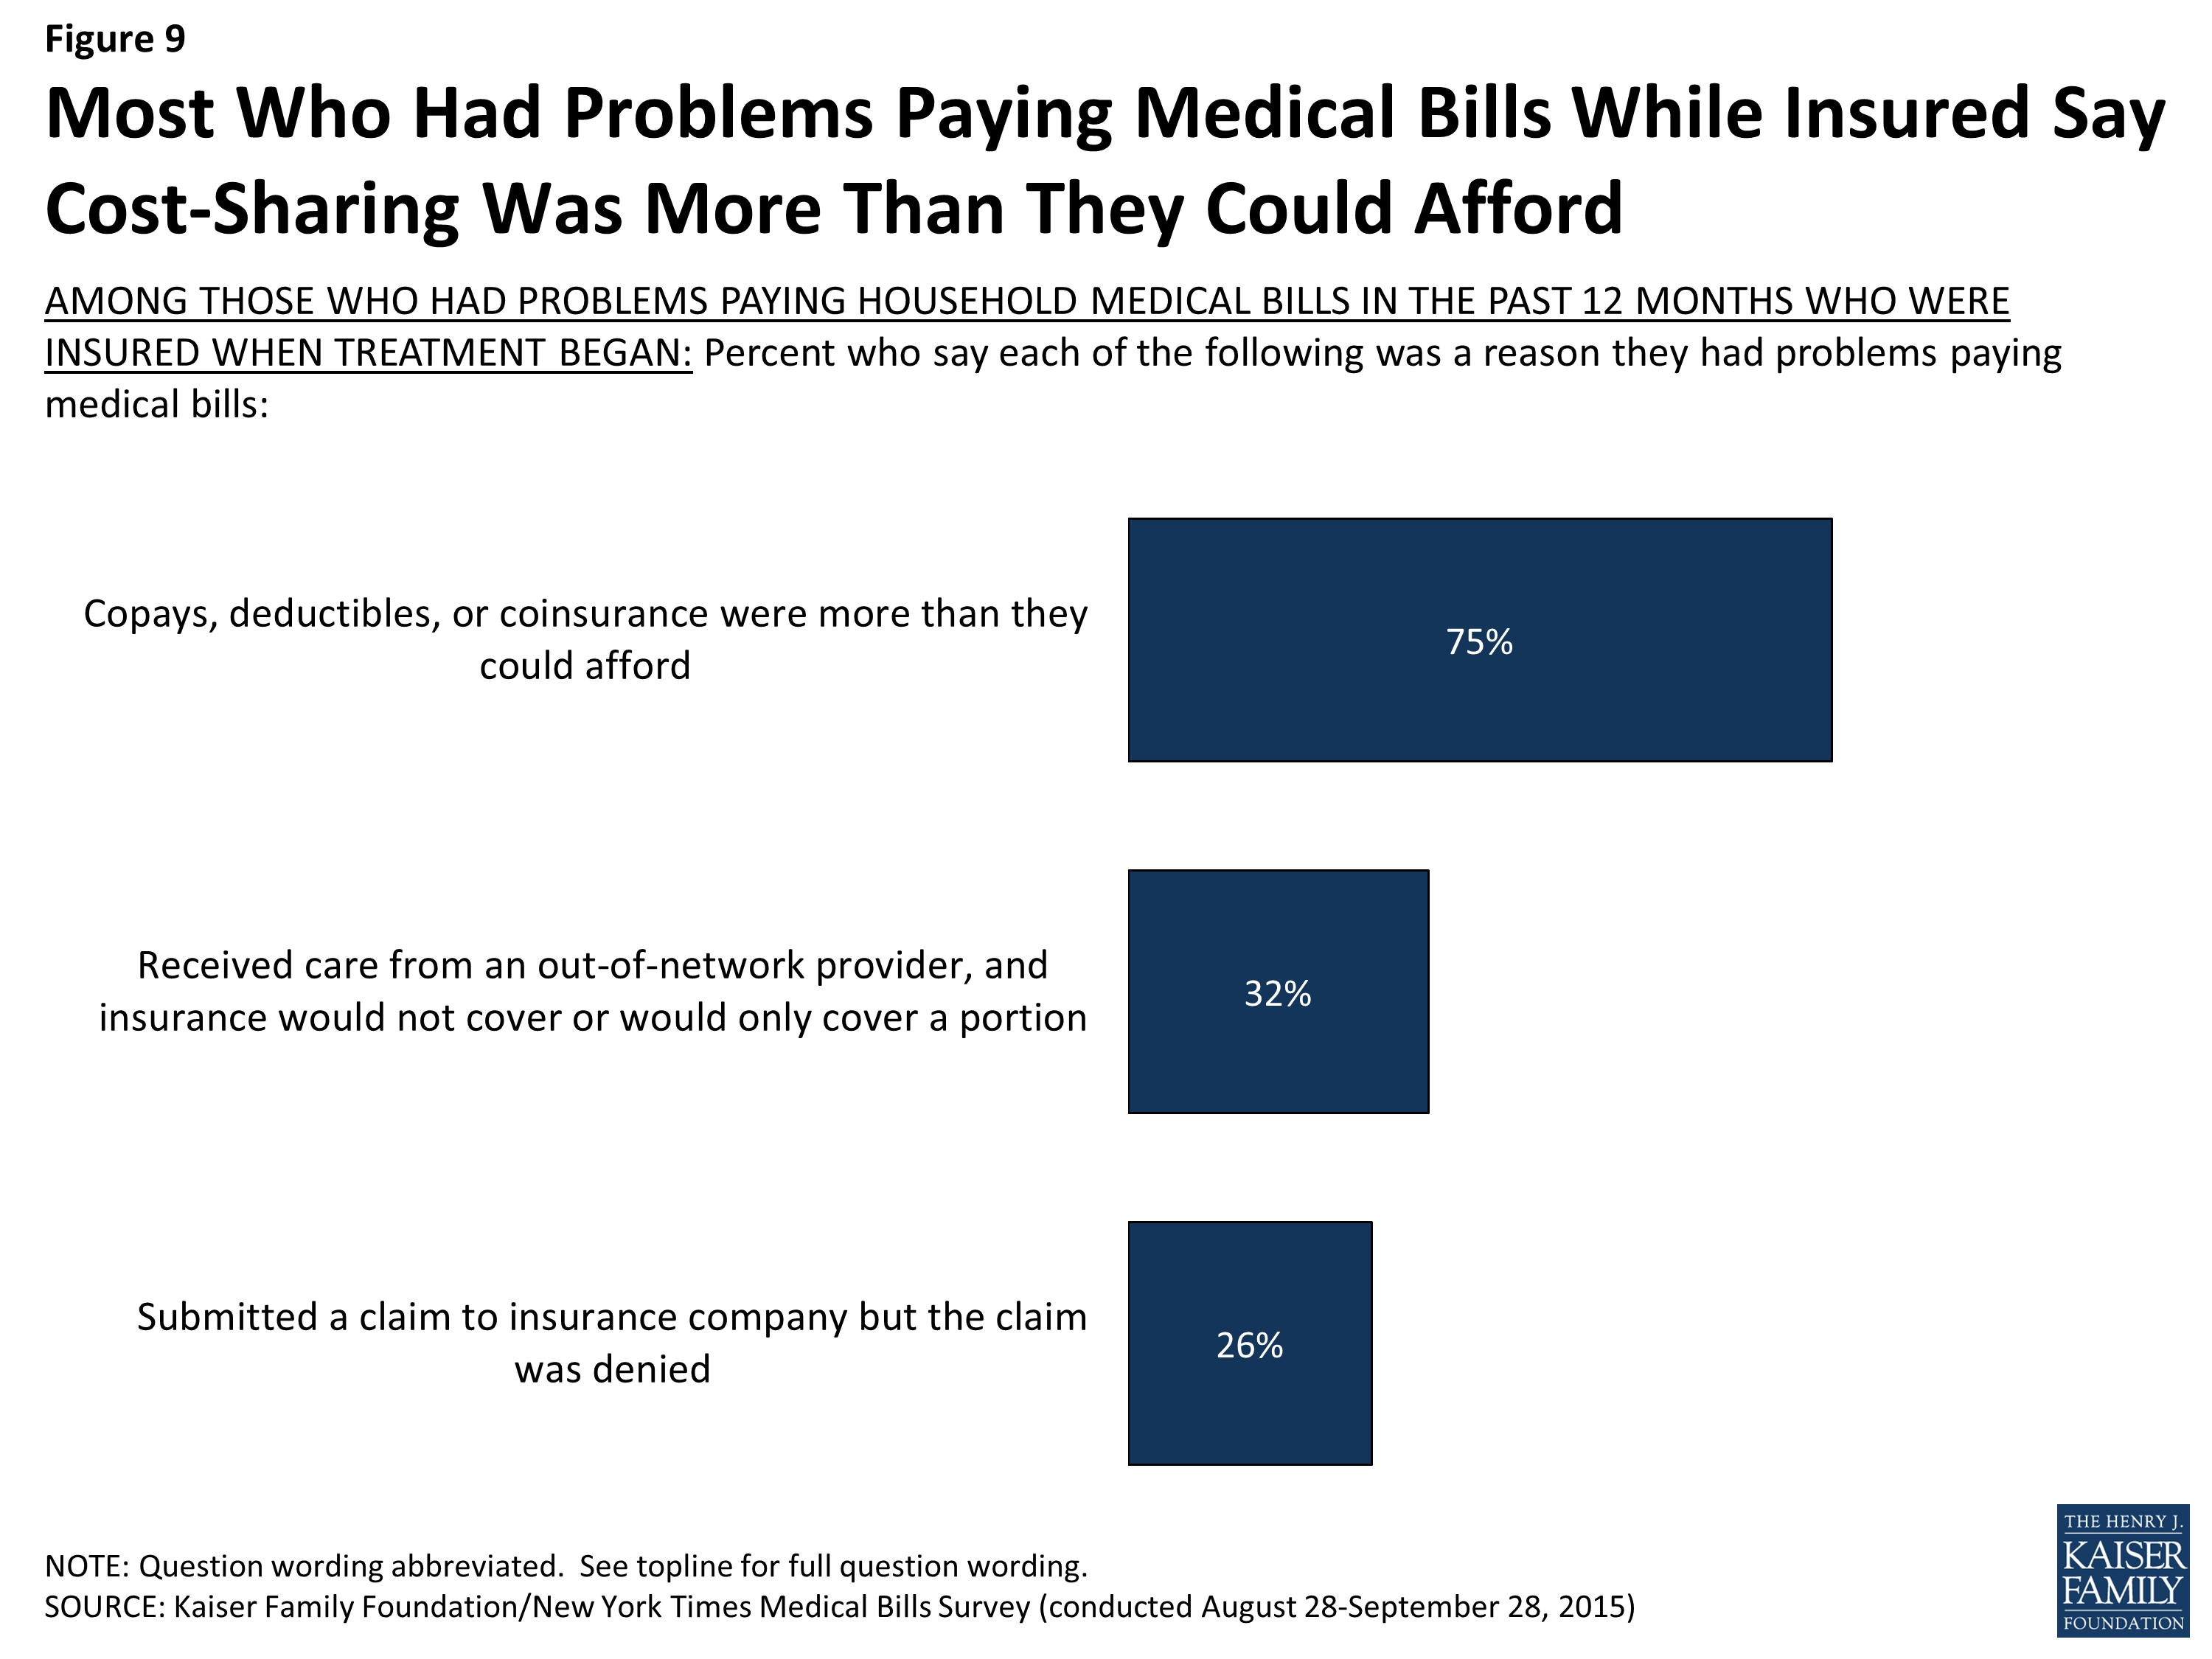
Figure 9: Most Who Had Problems Paying Medical Bills While Insured Say Cost-Sharing Was More Than They Could Afford
About three in 10 (32 percent) of those who had problems paying medical bills while insured say they received care from an out-of-network provider that their insurance wouldn’t pay for. For many, these bills came as a surprise. Seven in 10 (69 percent) of those who had problems paying for care received from an out-of-network provider say they were unaware that the provider was not in their plan’s network when they received the care.
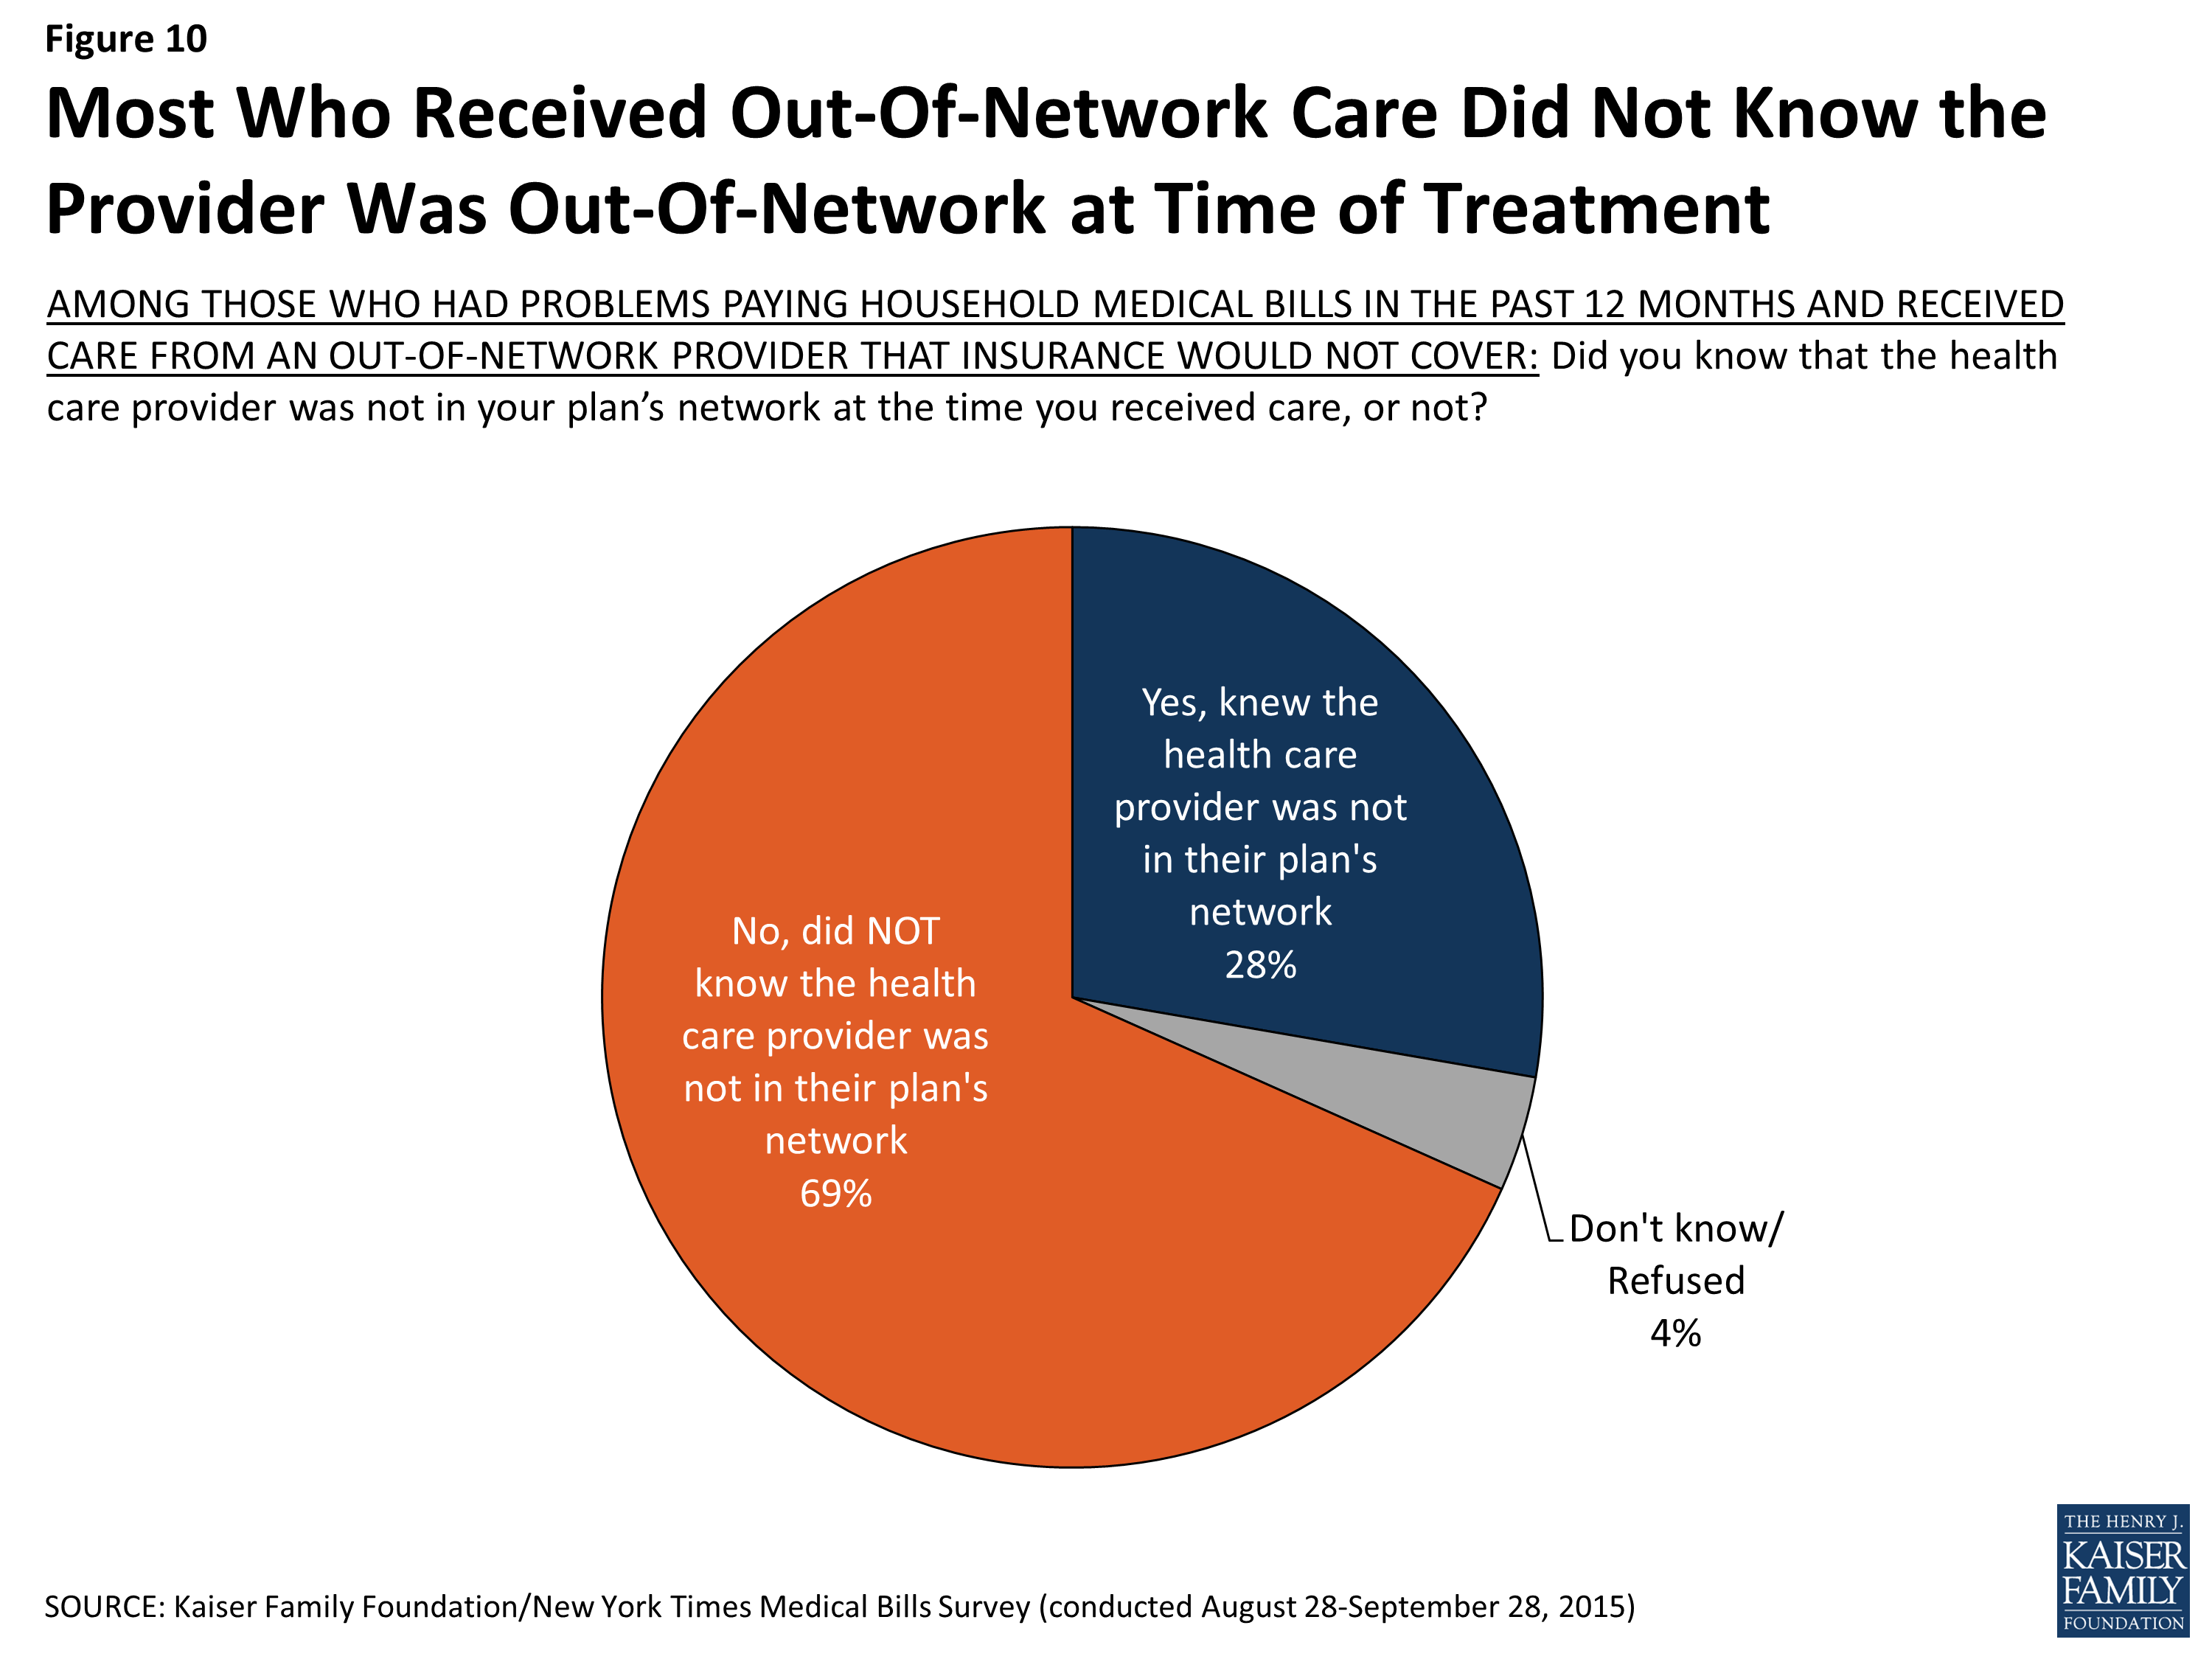
Figure 10: Most Who Received Out-Of-Network Care Did Not Know the Provider Was Out-Of-Network at Time of Treatment
Denied claims also contribute to medical bill problems among those with insurance. About a quarter (26 percent) of the insured who had medical bill problems say they had a claim denied by their insurance company. Common reported reasons for denial include a particular treatment not being covered (25 percent of those with denied claims) and receiving care from an out-of-network provider (14 percent); 21 percent of those who say they had a claim denied did not know or could not provide a reason for the denial.
The uninsured and attempts to get coverage
About a third (34 percent) of those who had problems paying medical bills say they were uninsured when the treatment that led to their medical bill problems began. However, many of these (39 percent, or 13 percent of the total who had problems paying medical bills) say they got coverage at some point while they were receiving treatment, mainly from Medicaid (36 percent of those who were uninsured and gained coverage).
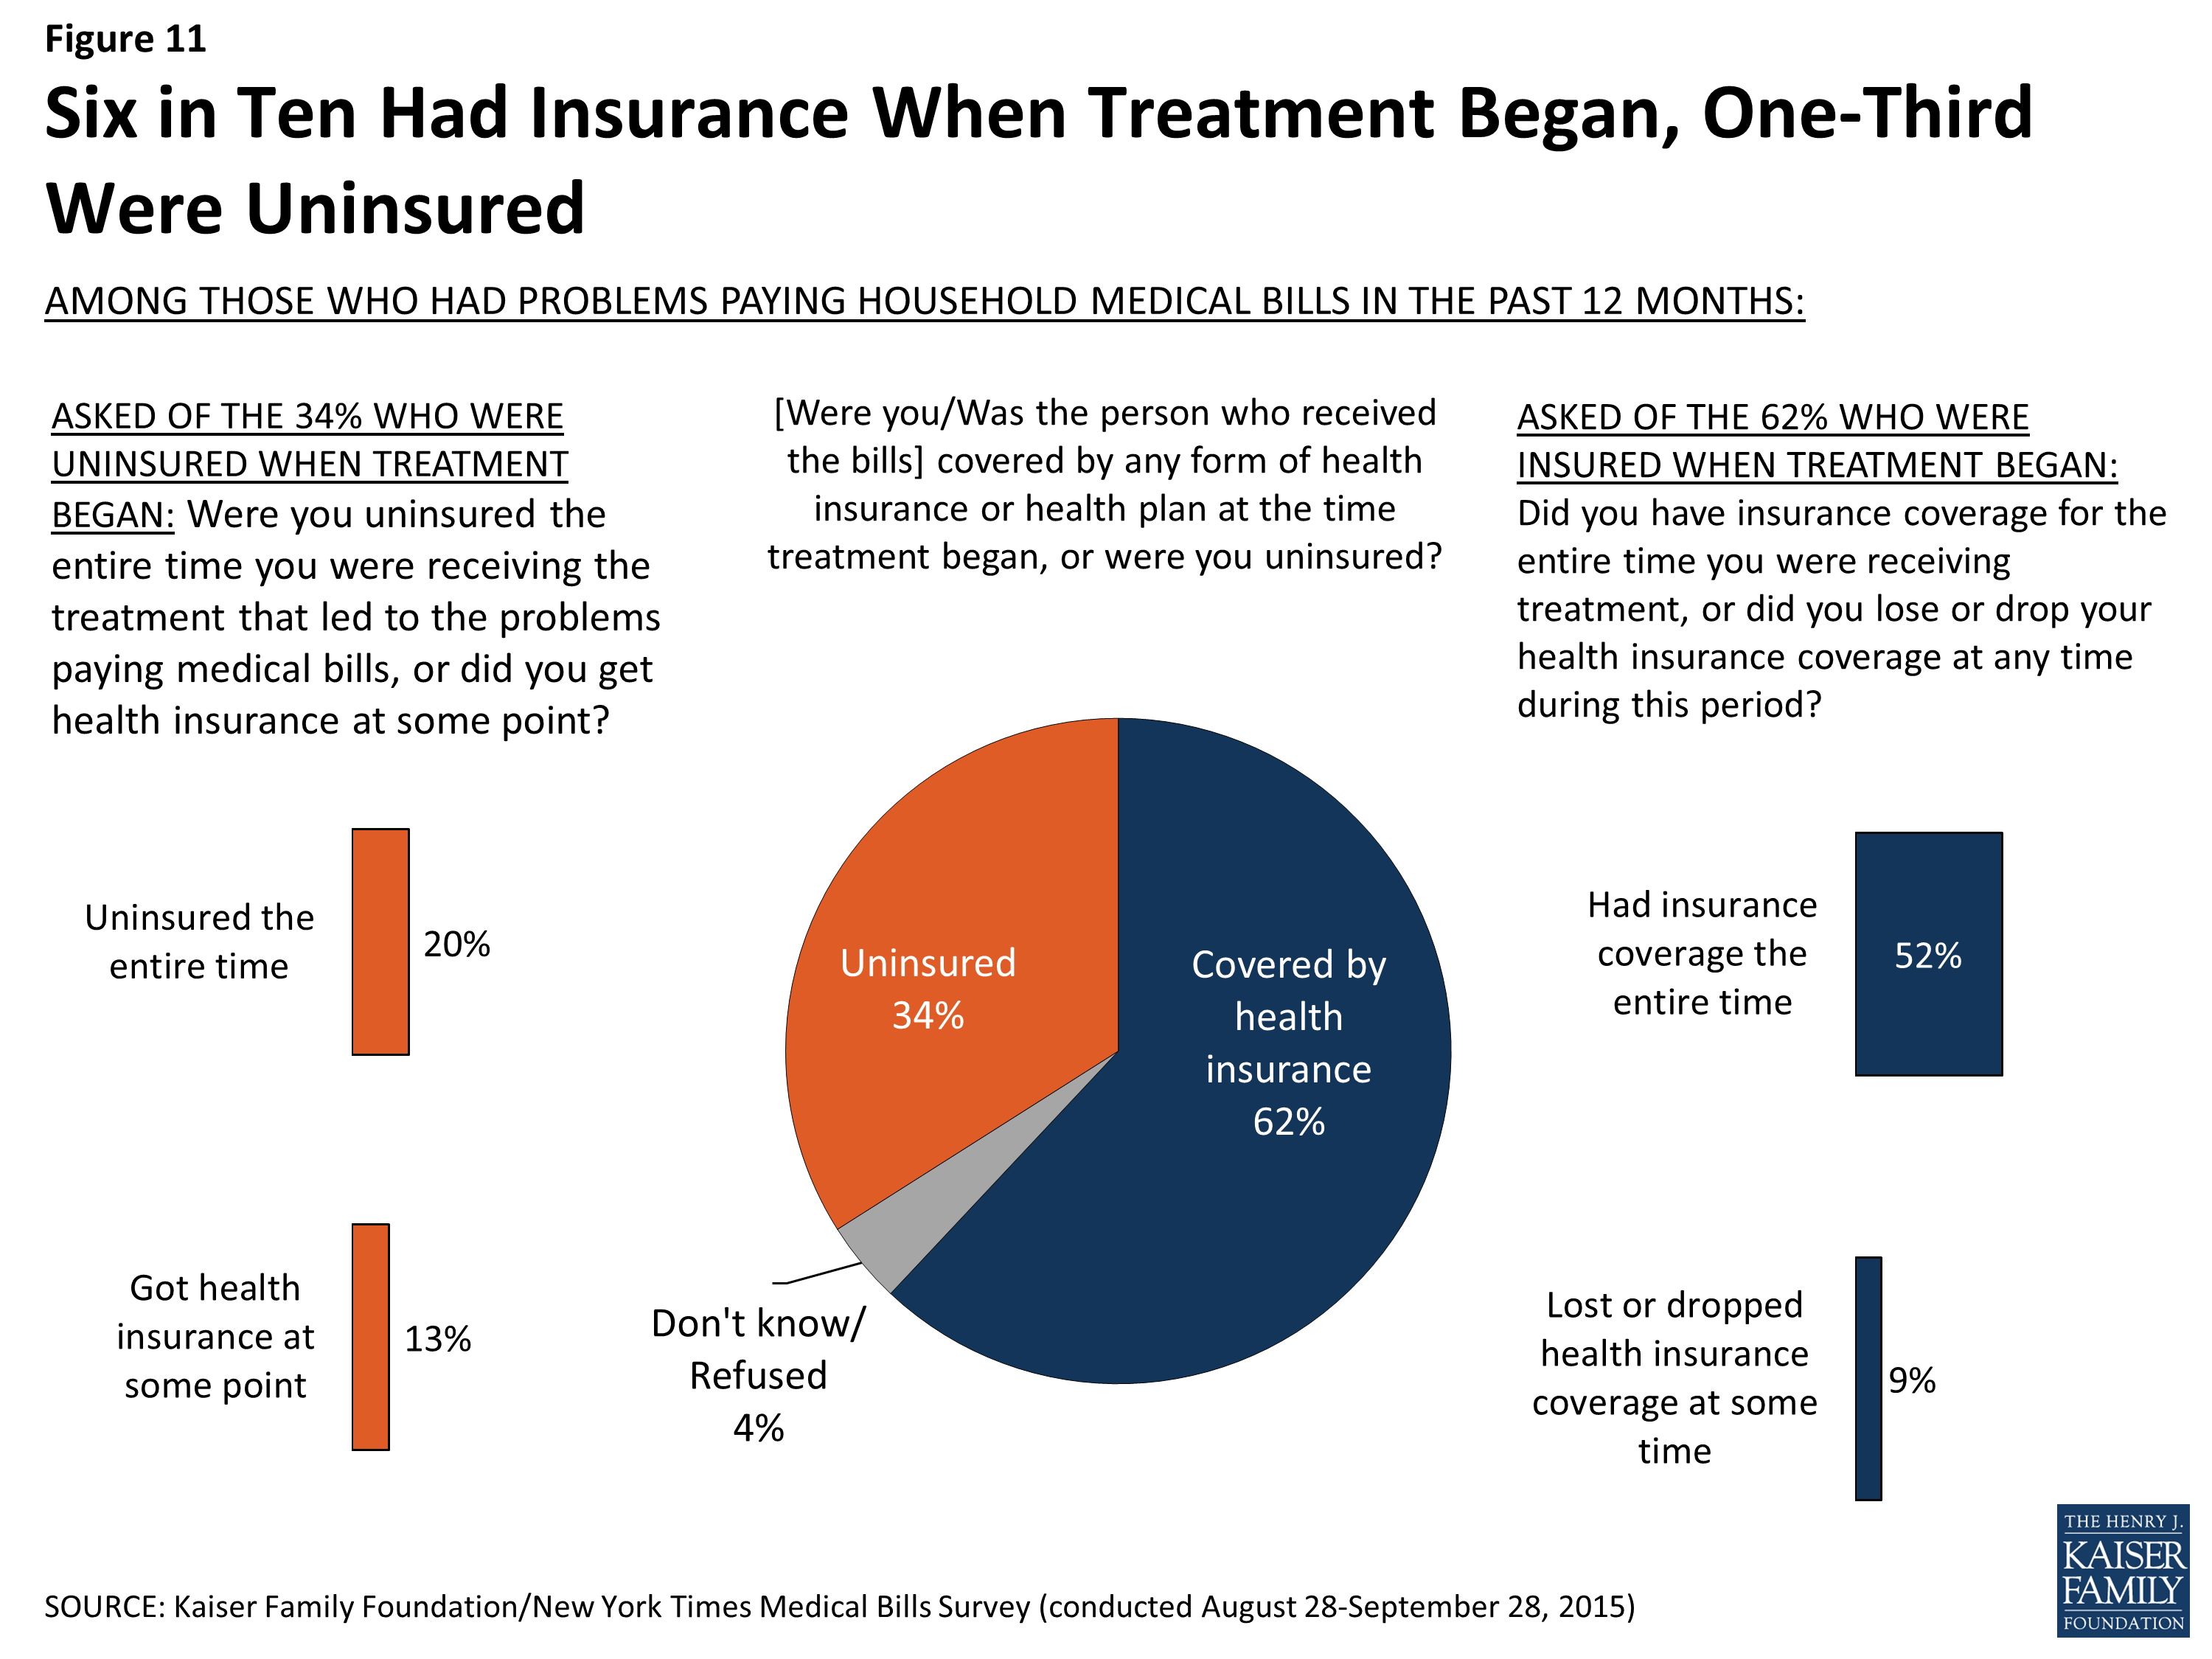
Figure 11: Six in Ten Had Insurance When Treatment Began, One-Third Were Uninsured
Among those who remained uninsured throughout the time they were receiving the treatment that led to their medical bills, many say they tried to get coverage from Medicaid (52 percent), the health insurance marketplace (28 percent) or directly from an insurance company or broker (16 percent). Most of those who tried but were not able to get coverage from Medicaid say they were told they were not eligible for the program, while the most commonly reported reason for not getting private coverage was because it was too expensive.
Section 3: Consequences of Medical Bill Problems
The impact of medical bills on families
Among the roughly one-quarter of Americans ages 18-64 who report having problems paying medical bills, roughly equal shares say the impact of those bills on their families has been major (44 percent) and minor (47 percent). Relatively few (7 percent) say there has been no real impact. The survey shows that while insurance may protect people from having medical bills problems in the first place, once those problems occur the consequences are similar regardless of insurance status. Among those with medical bill problems, almost identical shares of the insured (44 percent) and uninsured (45 percent) say the bills have had a major impact on their families. Similarly, among those who had problems paying medical bills, those with higher incomes are just as likely to report that the bills had a major impact as those with lower incomes (though as noted above, people with lower incomes are more likely than those with higher incomes to report problems paying medical bills in the first place).
A few groups among those with medical bill problems are more likely to say the medical bills have had a major impact on their families, including people with bills amounting to $5,000 or more (66 percent), those who say the family member who generated the bills has a disability (57 percent), and those who describe their financial situation as not having enough to meet basic expenses (56 percent).
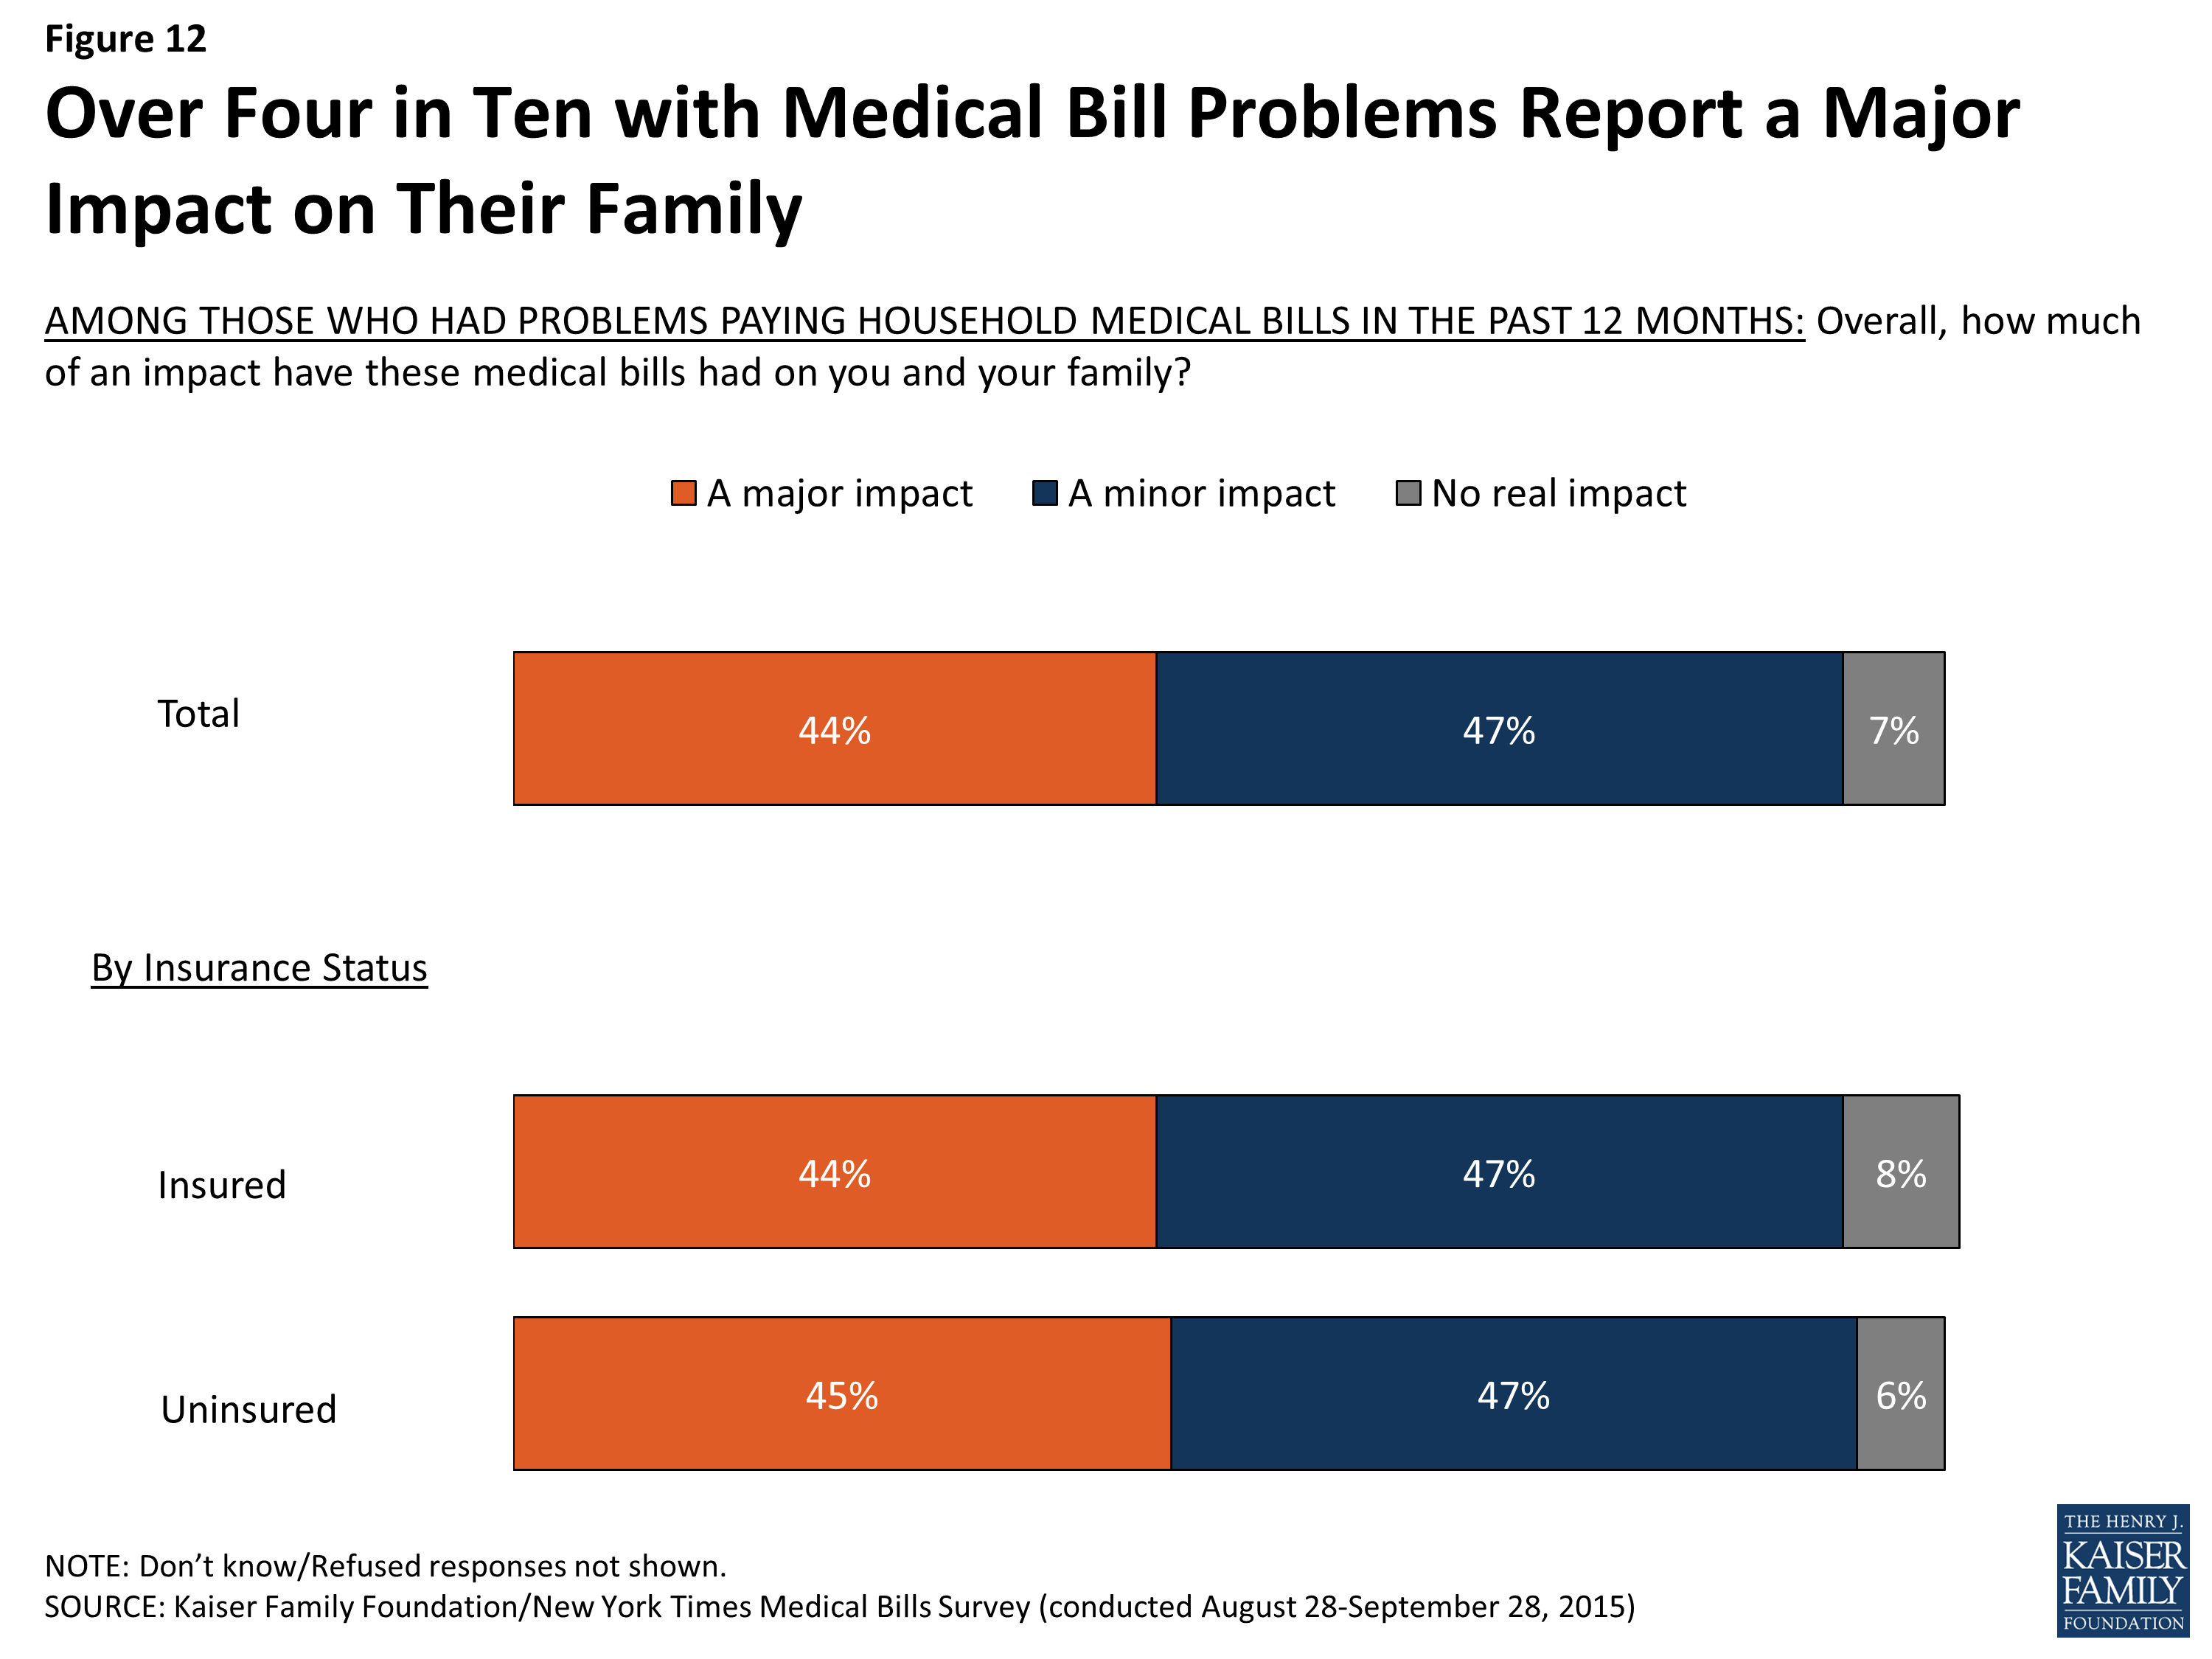
Figure 12: Over Four in Ten with Medical Bill Problems Report a Major Impact on Their Family
Among people with private health insurance, those in high-deductible plans are more likely than those in lower-deductible plans to say the bills had a major impact on their family (49 percent versus 35 percent), which may be related to the fact that high deductible plan enrollees report having higher bills on average. About two-thirds (64 percent) of those in high-deductible plans say their bills amounted to $2,500 or more, compared to four in ten with lower-deductible plans (40 percent).
Sacrifices made to pay medical bills
Even among those with health insurance, people who’ve faced medical bill problems report making various sacrifices in order to pay these bills, including significant changes to their employment, financial situation, or lifestyle. Overall, about seven in ten report cutting back or delaying vacations or major household purchases (72 percent) as well as reducing spending on food, clothing and basic household items (70 percent). About six in ten (59 percent) say they used up all or most of their savings in order to pay medical bills. Substantial shares say that someone in their household took on an extra job or worked more hours (41 percent), borrowed money from family and friends (37 percent), or increased their credit card debt (34 percent). Roughly a quarter (26 percent) say they took money out of a retirement, college, or other long-term savings account. Smaller – but not inconsequential – shares say they changed their living situation (17 percent), took out another type of loan (15 percent), borrowed from a payday lender (13 percent), or sought the aid of a charity or non-profit (12 percent) in order to pay medical bills. Very few (2 percent) report taking out a second mortgage on their home.
These sacrifices are reported by people in all walks of life, and not just the uninsured or those with precarious financial situations. In fact, people who have problems paying medical bills despite having health insurance are more likely than the uninsured with medical bill problems to say they’ve put off vacations or major household purchases (77 percent versus 64 percent), cut back spending on food, clothing, or basic household items (75 percent versus 62 percent), used up all or most of their savings (63 percent versus 51 percent), increased their credit card debt (38 percent versus 24 percent), or taken money out of long-term savings (31 percent versus 17 percent) in order to pay medical bills. The opposite is true in one case; the uninsured with medical bill problems are more likely than those with insurance to say they had to change their living situation in order to pay these bills (23 percent versus 14 percent).
| Table 3: Many Insured and Uninsured Report Taking Actions to Pay Medical Bills | |||
| Among those who had problems paying medical bills in past 12 months | |||
| Percent who say they or someone else in their household has done each of the following in the past 12 months in order to pay medical bills: | Total | Insured | Uninsured |
| Put off vacations or other major household purchases | 72% | 77% | 64% |
| Cut back spending on food, clothing, or basic household items | 70 | 75 | 62 |
| Used up all or most of savings | 59 | 63 | 51 |
| Taken an extra job or worked more hours | 41 | 42 | 40 |
| Borrowed money from friends or family | 37 | 37 | 38 |
| Increased credit card debt | 34 | 38 | 24 |
| Taken money out of retirement, college, or other long-term savings accounts | 26 | 31 | 17 |
| Changed your living situation | 17 | 14 | 23 |
| Taken out another type of loan | 15 | 17 | 11 |
| Borrowed money from a payday lender | 13 | 15 | 12 |
| Sought the aid of a charity or non-profit organization | 12 | 11 | 15 |
| Taken out another mortgage on home | 2 | 1 | 2 |
| Made other significant changes to way of life | 15 | 15 | 16 |
In addition to the sacrifices listed above, fifteen percent of people who had problems paying medical bills report making other significant changes to their way of life in order to pay these bills.
In their own words: What other significant changes did you make in your way of life in order to pay these medical bills?
- “Apartment instead of house. Not getting groceries some weeks to get by.”
- “Charges for my insulin exceeded $1200 a month (3 times the amount of my house payment). I had to reduce the amount of insulin I took based on what I could afford; my health was negatively impacted as a result.”
- “Cold showers, can’t fix plumbing. Other needed repairs have been patched as best as possible but not fixed.”
- “Medical Insurance / bills was the deciding factor in a job change. I gave up other benefits to choose a job that had the best medical coverage.”
- “Sold everything we could spare.”
- “Can’t take the kids anywhere. Wish I could do more for my kids!”
- “I need physical therapy after shoulder repair but I couldn’t afford to finish it. I wish I could have.”
- “I am losing my house.”
- “I’ve cut back on just about everything for my family and the way we live.”
Effects of medical bills on ability to get needed health care
For many, problems paying household medical bills can impact their ability to get (or continue getting) the health care services they need. Overall, about three in ten (31 percent) of those who faced problems paying medical bills say they had problems getting other health care they needed directly as a result of these problems. While the problem is worse for those without insurance – among whom 41 percent say they had trouble getting needed care because of medical bills – it is also reported by about a quarter (26 percent) of those who had insurance when their medical bill problems occurred.
More broadly, many of those with medical bill problems report delaying or skipping health care over the past 12 months because of the cost – at rates 2 to 3 times those of their counterparts who did not have problems paying medical bills, regardless of their insurance status. For example, among those with health insurance, 43 percent of those with medical bill problems say there was a time in the past year when they or a family member did not get a recommended medical test or treatment because of the cost, compared with just 13 percent of those without such medical bill problems. Similarly, 41 percent of the insured who faced medical bill problems say they did not fill a prescription in the past 12 months because of the cost, compared with 14 percent of those with health insurance who did not have bill problems. Access to dental care can be affected, too; among those with health insurance, 62 percent of those with medical bill problems report postponing dental care in the previous year due to cost, compared with 29 percent of those without such problems.
| Table 4: Those with Medical Bill Problems More Likely to Report Skipping or Delaying Care | ||||||
| Total | Insured | Uninsured | ||||
| Percent who say they or another family member living in their household have done each of the following in the past 12 months because of the COST: | Medical bill problems | No medical bill problems | Medical bill problems | No medical bill problems | Medical bill problems | No medical bill problems |
| Put off/postponed getting dental care/check-ups | 65% | 31% | 62% | 29% | 72% | 42% |
| Relied on home remedies/over the counter drugs instead of going to see a doctor | 62 | 32 | 58 | 30 | 71 | 44 |
| Put off/postponed getting health care you needed | 60 | 22 | 58 | 21 | 65 | 37 |
| Not filled a prescription for medicine | 43 | 14 | 41 | 14 | 45 | 13 |
| Not gotten a medical test/treatment that was recommended by a doctor | 43 | 13 | 43 | 13 | 43 | 13 |
| Chosen a less expensive treatment than the one your doctor recommended | 40 | 15 | 38 | 14 | 47 | 26 |
| Cut pills in half/skipped doses of medicine | 34 | 9 | 32 | 9 | 39 | 13 |
| Skipped/postponed rehabilitation care that your doctor recommended | 22 | 5 | 20 | 5 | 28 | 6 |
Effects of medical bills on household finances and ability to afford basic needs
Medical bills can also lead to problems meeting other financial obligations and paying for basic necessities. Among those with medical bill problems, about six in ten of both the insured (62 percent) and the uninsured (62 percent) say they’ve had difficulty paying other bills as a result of medical debt. Over a third in each group (34 percent of the insured and 39 percent of the uninsured) say they were unable to pay for basic necessities like food, heat, or housing as a result of medical bills.
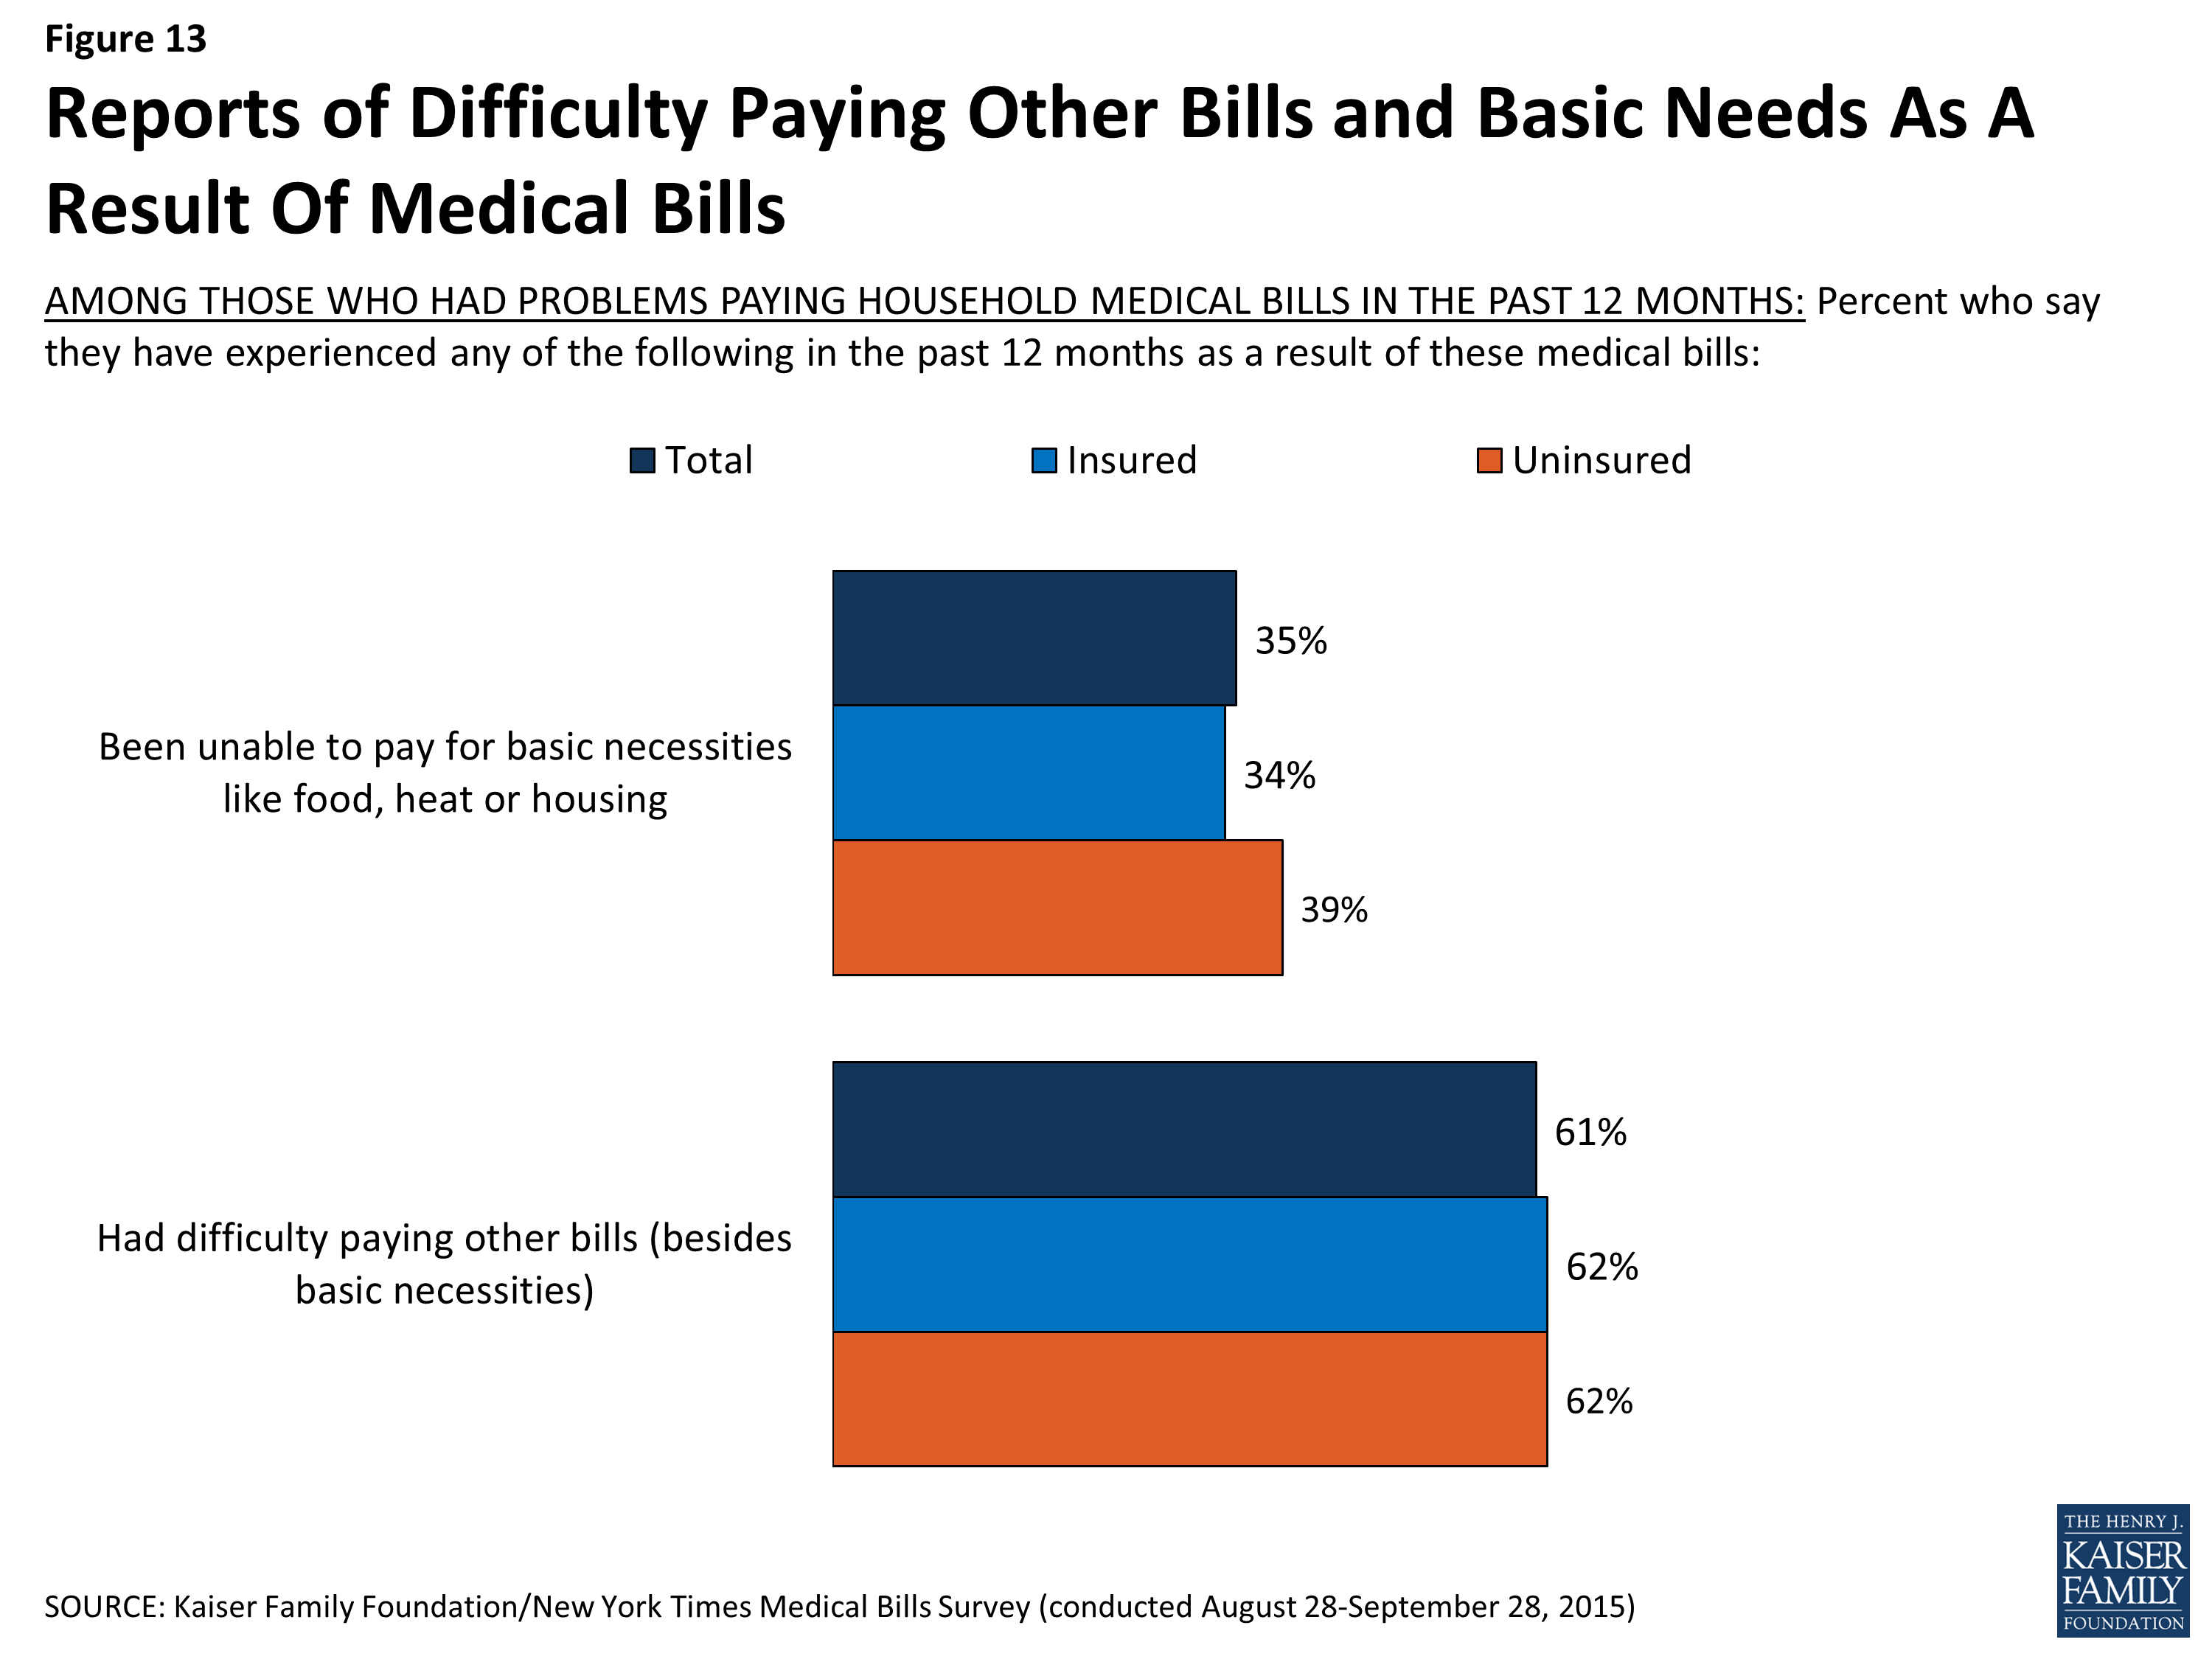
Figure 13: Reports of Difficulty Paying Other Bills and Basic Needs As A Result Of Medical Bills
Although this survey focuses on the problems Americans face in paying medical bills, for many, medical bills represent just one source of bills or debt. Most of those with medical bill problems report having other kinds of debt, including credit card debt (56 percent), car loans (46 percent), student loans (33 percent), mortgages (32 percent), payday loans (17 percent), and other outstanding loans (31 percent). Among those with medical bill problems, those with health insurance are more likely than those without insurance to report having credit card debt (63 percent versus 43 percent), a car loan (52 percent versus 33 percent), or a mortgage (41 percent vs. 16 percent), which may reflect better access to these types of credit among the insured group. However, similar shares of the insured and uninsured report having a student loan (34 percent of the insured and 32 percent of the uninsured) and a loan owed to a payday lender (17 percent each).
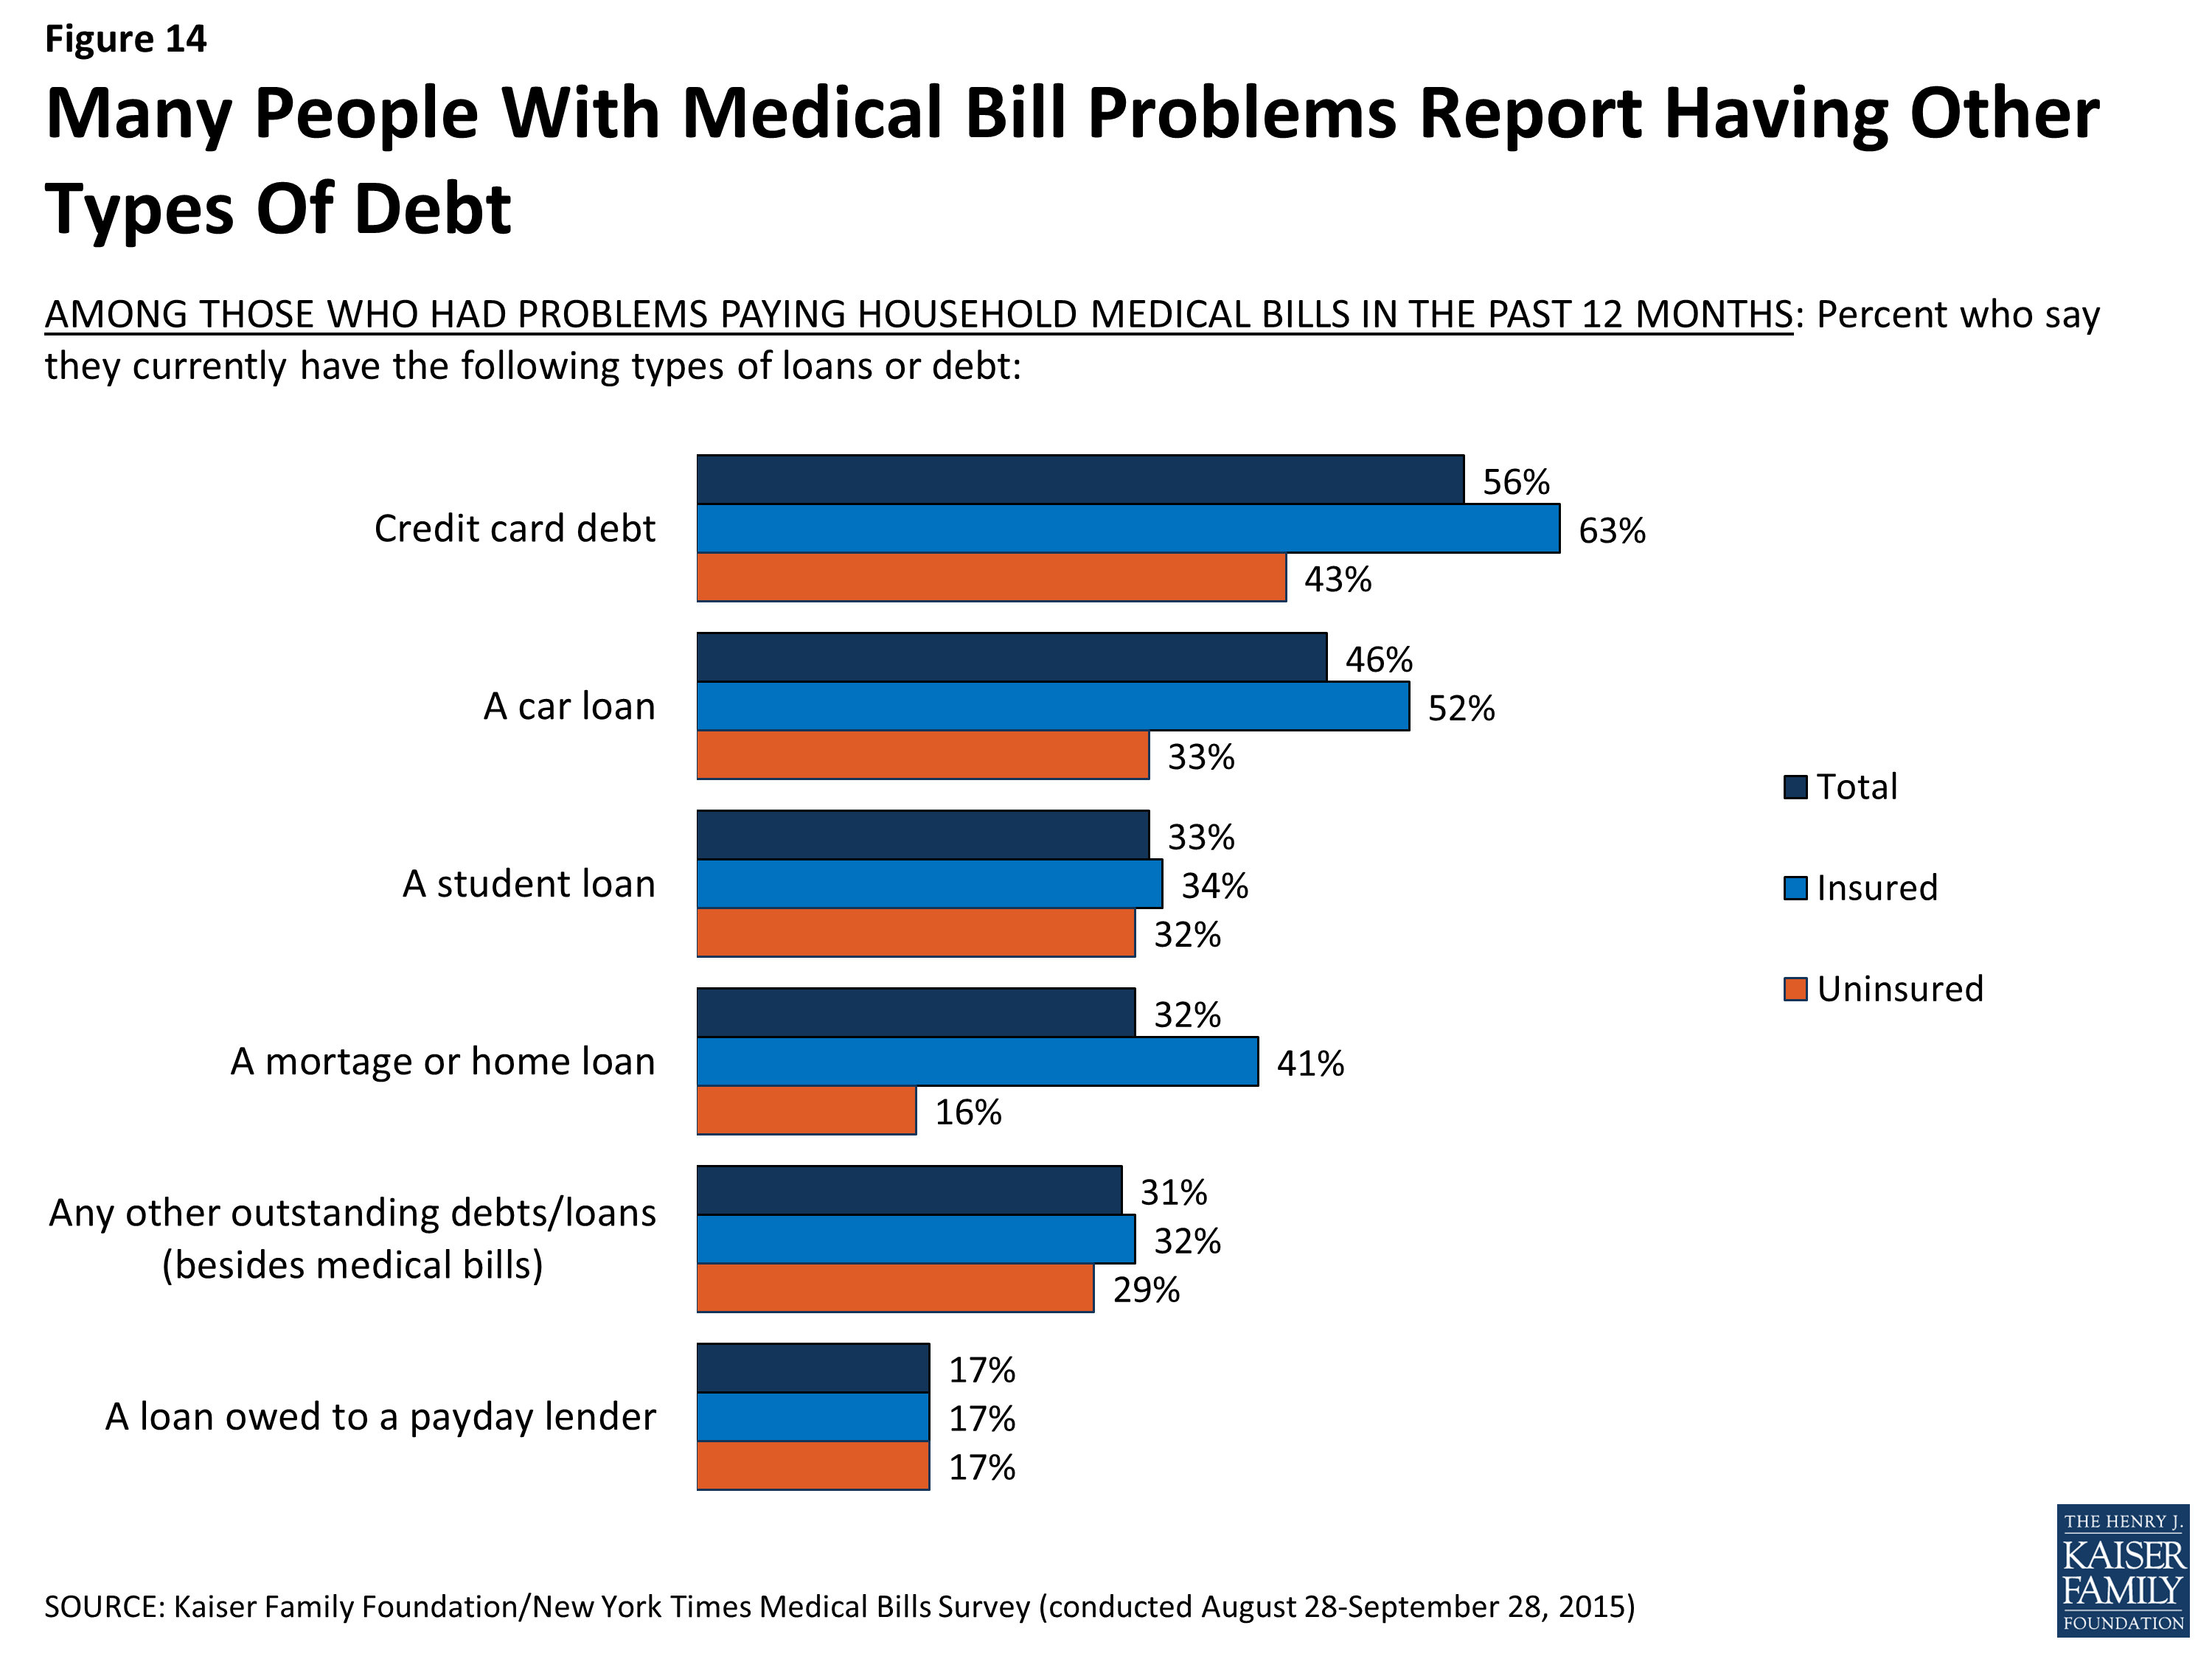
Figure 14: Many People With Medical Bill Problems Report Having Other Types Of Debt
For some of those with problems paying medical bills, medical debt makes up a large share of their total debt. About one in five (22 percent, including 17 percent of the insured and 34 percent of the uninsured) say their medical bills represent all or almost all of their total non-mortgage debt. By contrast, just over half (56 percent) of the insured and about a third (36 percent) of the uninsured say they have either paid off all their medical bills, or that medical debt makes up less than half of their total debt.
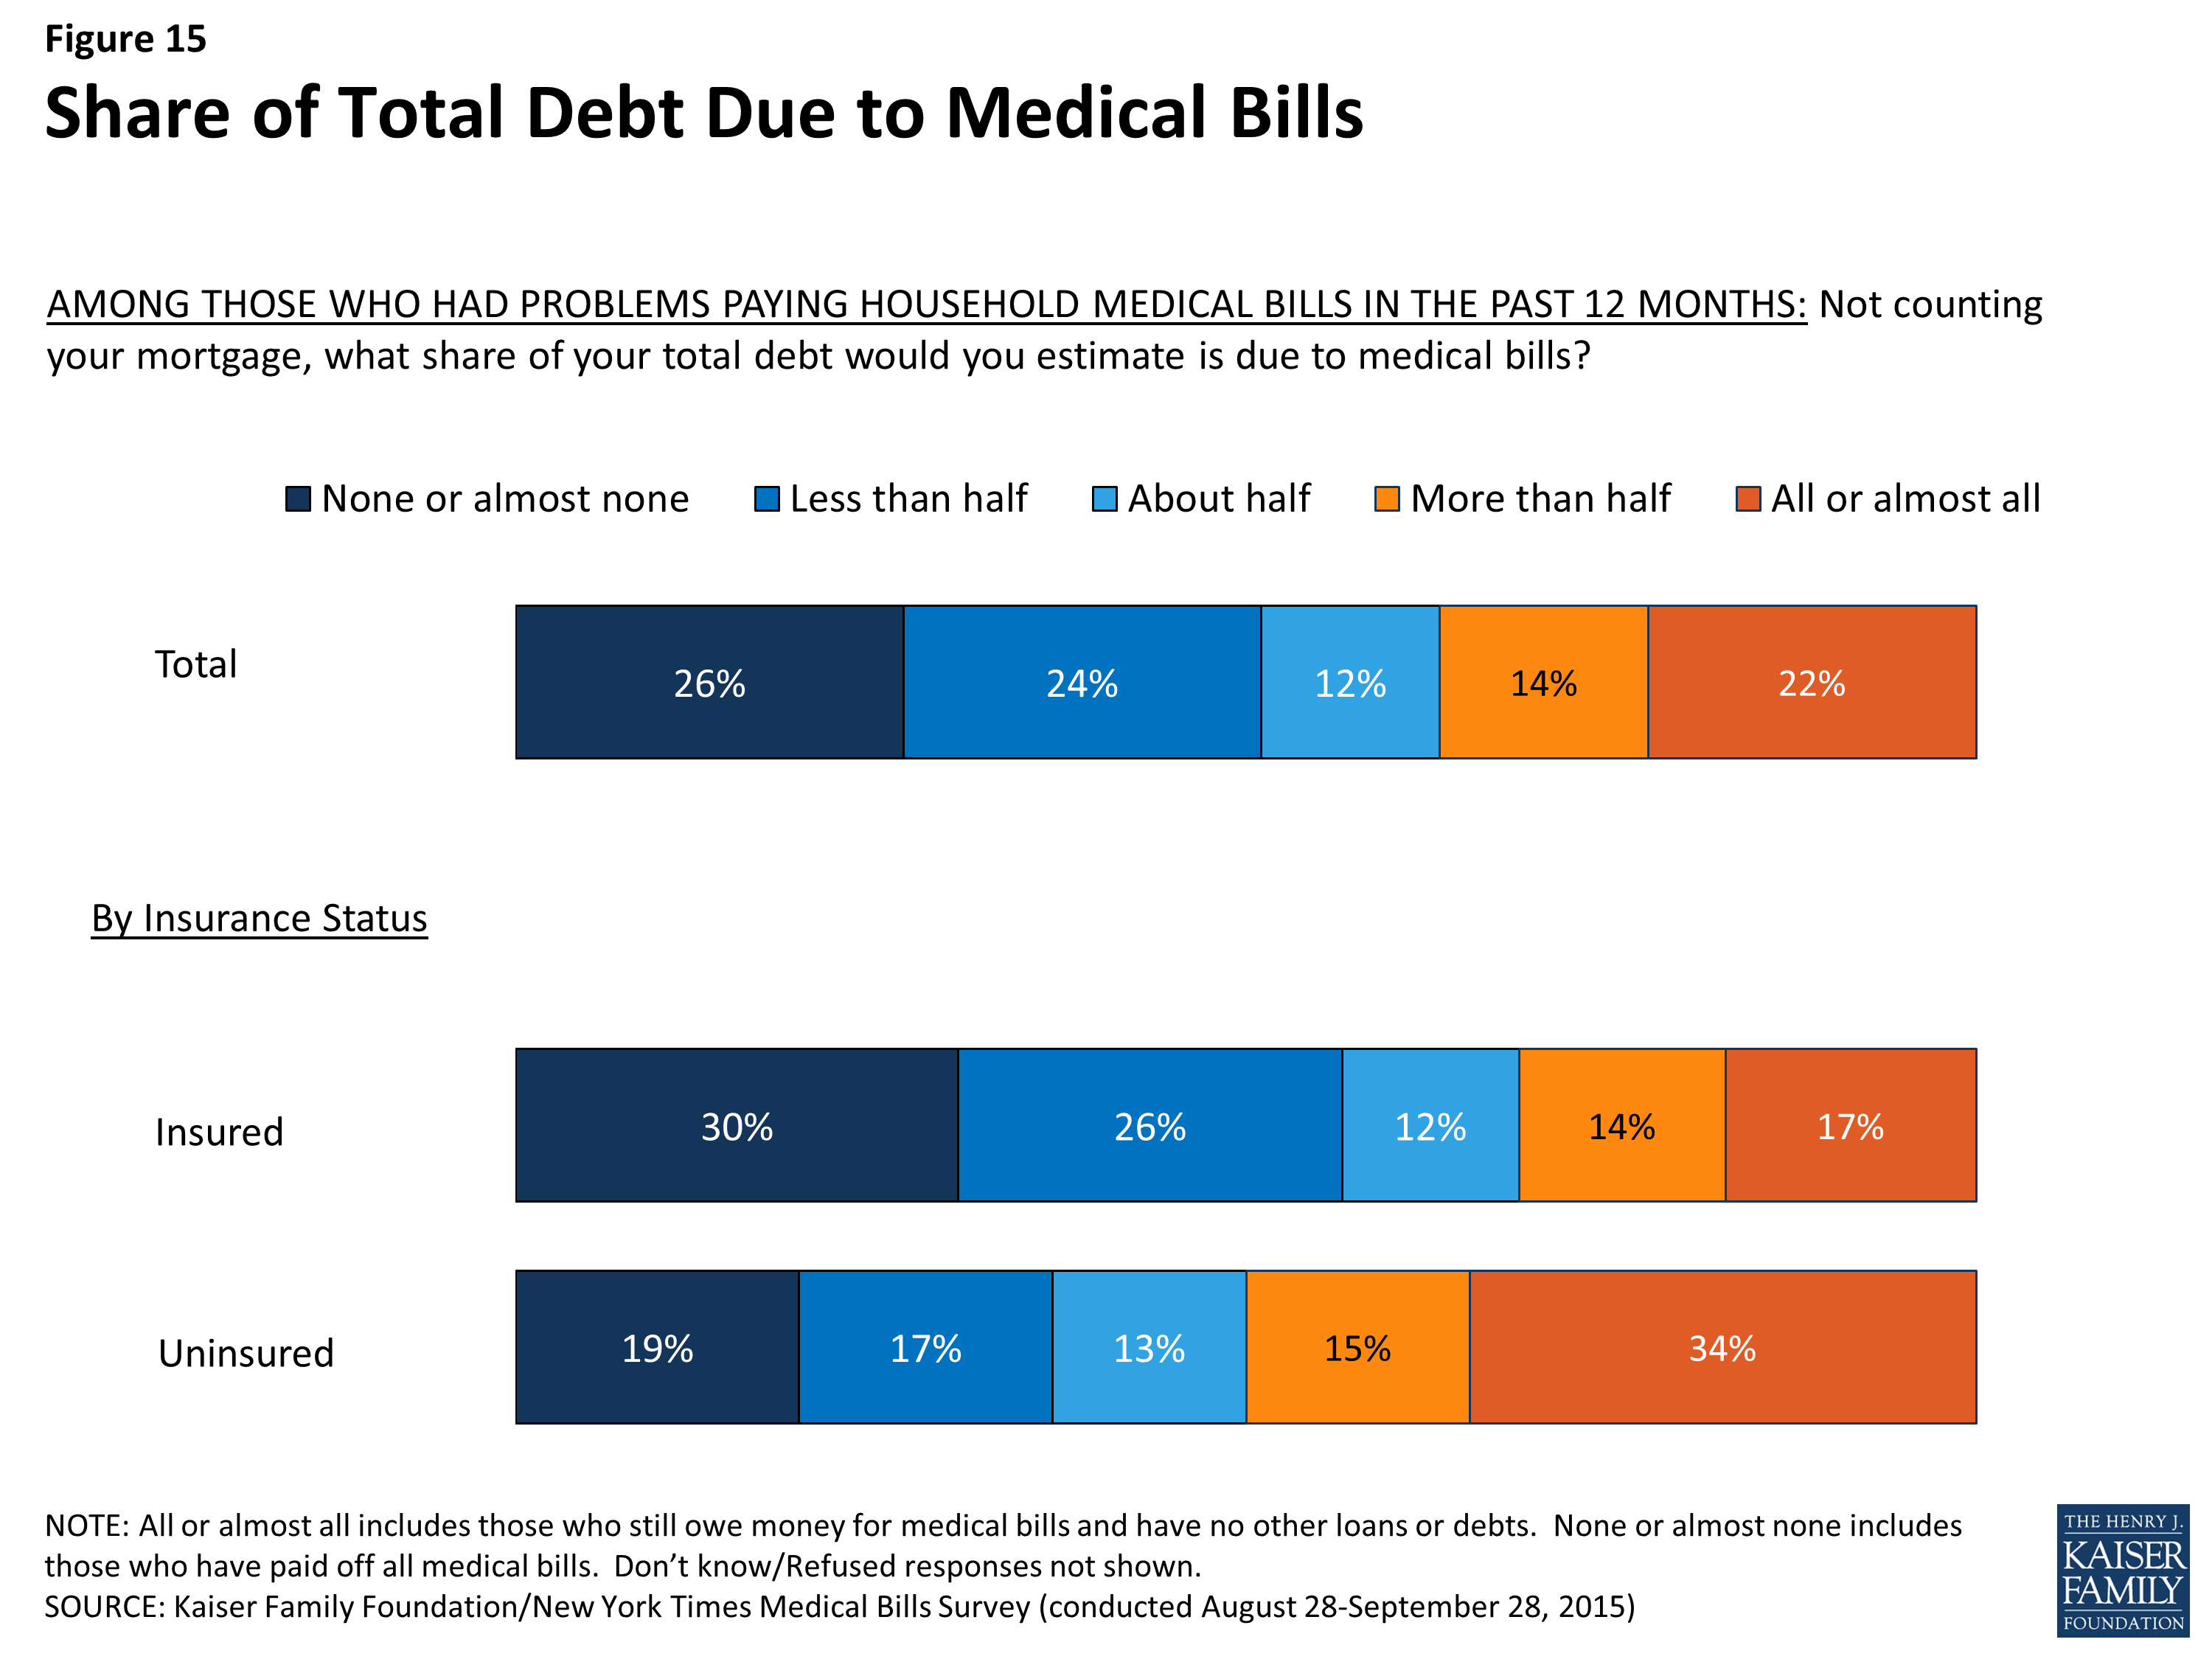
Figure 15: Share of Total Debt Due to Medical Bills
The survey also finds that once medical bill problems start, it can be difficult to make them stop, and that for some, medical bills can start a cascade of other bill problems. Six in ten (60 percent) say this is not the first time they’ve faced medical bill problems, a share that is even higher among those who say their bills are the result of an ongoing health problem (67 percent) and those who say the family member who generated the bills has a disability (69 percent).
Further, while almost half (47 percent) say they’ve also had problems paying other unrelated bills in the past year, medical bills appear to be either the sole problem or the main trigger of bill problems for the other half, including 31 percent who say they’ve only had problems with medical bills, not other types of bills, and 19 percent who say their problems paying other bills started as a result of their medical bills.
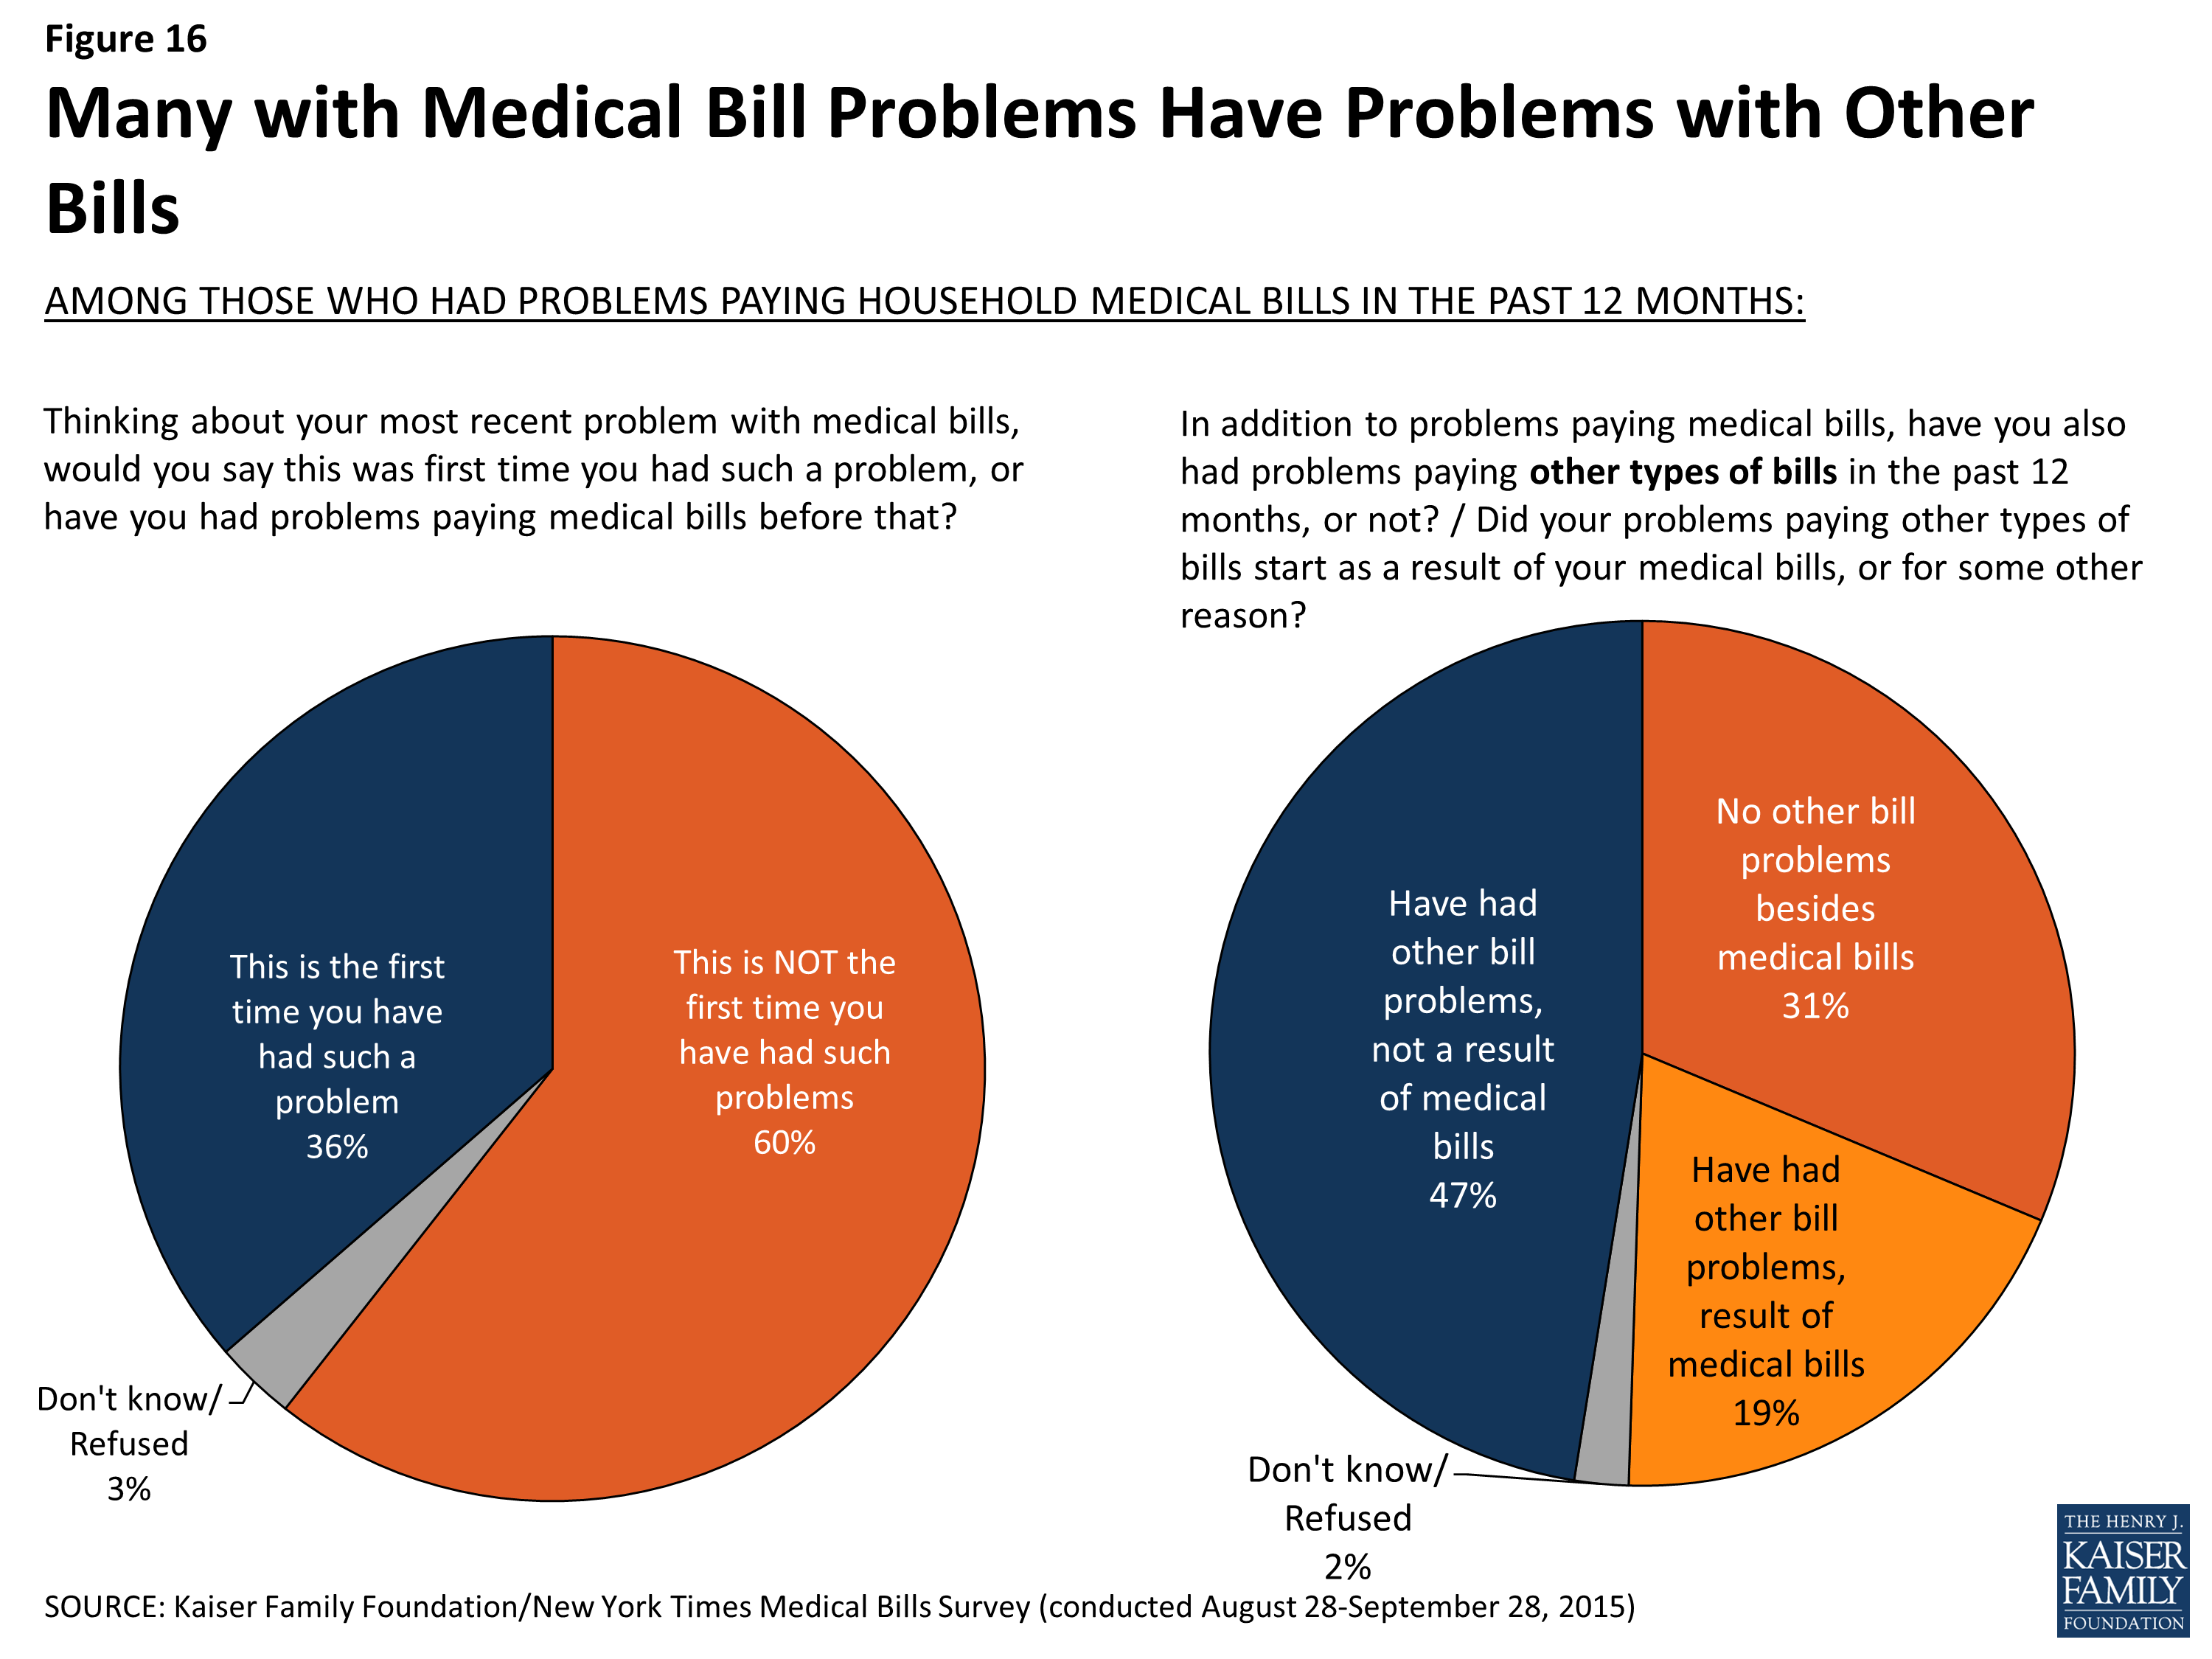
Figure 16: Many with Medical Bill Problems Have Problems with Other Bills
Financial consequences of struggling to make payments
Many of those who’ve faced household medical bill problems report struggling to make payments, both for their medical bills and for other bills. Six in ten (61 percent) say they have been late on a payment for a medical bill, and almost as many (56 percent) say they’ve missed a payment. Similar shares report being late or missing payments for other (non-medical) bills (56 percent and 46 percent, respectively). Once a person has problems paying medical bills, their insurance status appears to make little difference in their ability to pay bills on time. Among those with medical bill problems, similar shares of the insured and uninsured say they’ve been late on a payment (62 percent and 63 percent, respectively) or missed a payment (55 percent and 61 percent) for a medical bill in the past year.
Far fewer, though still roughly two in ten, say they’ve defaulted on a loan for a medical bill (17 percent), including a somewhat higher share of the uninsured (23 percent) compared to those with insurance (15 percent).
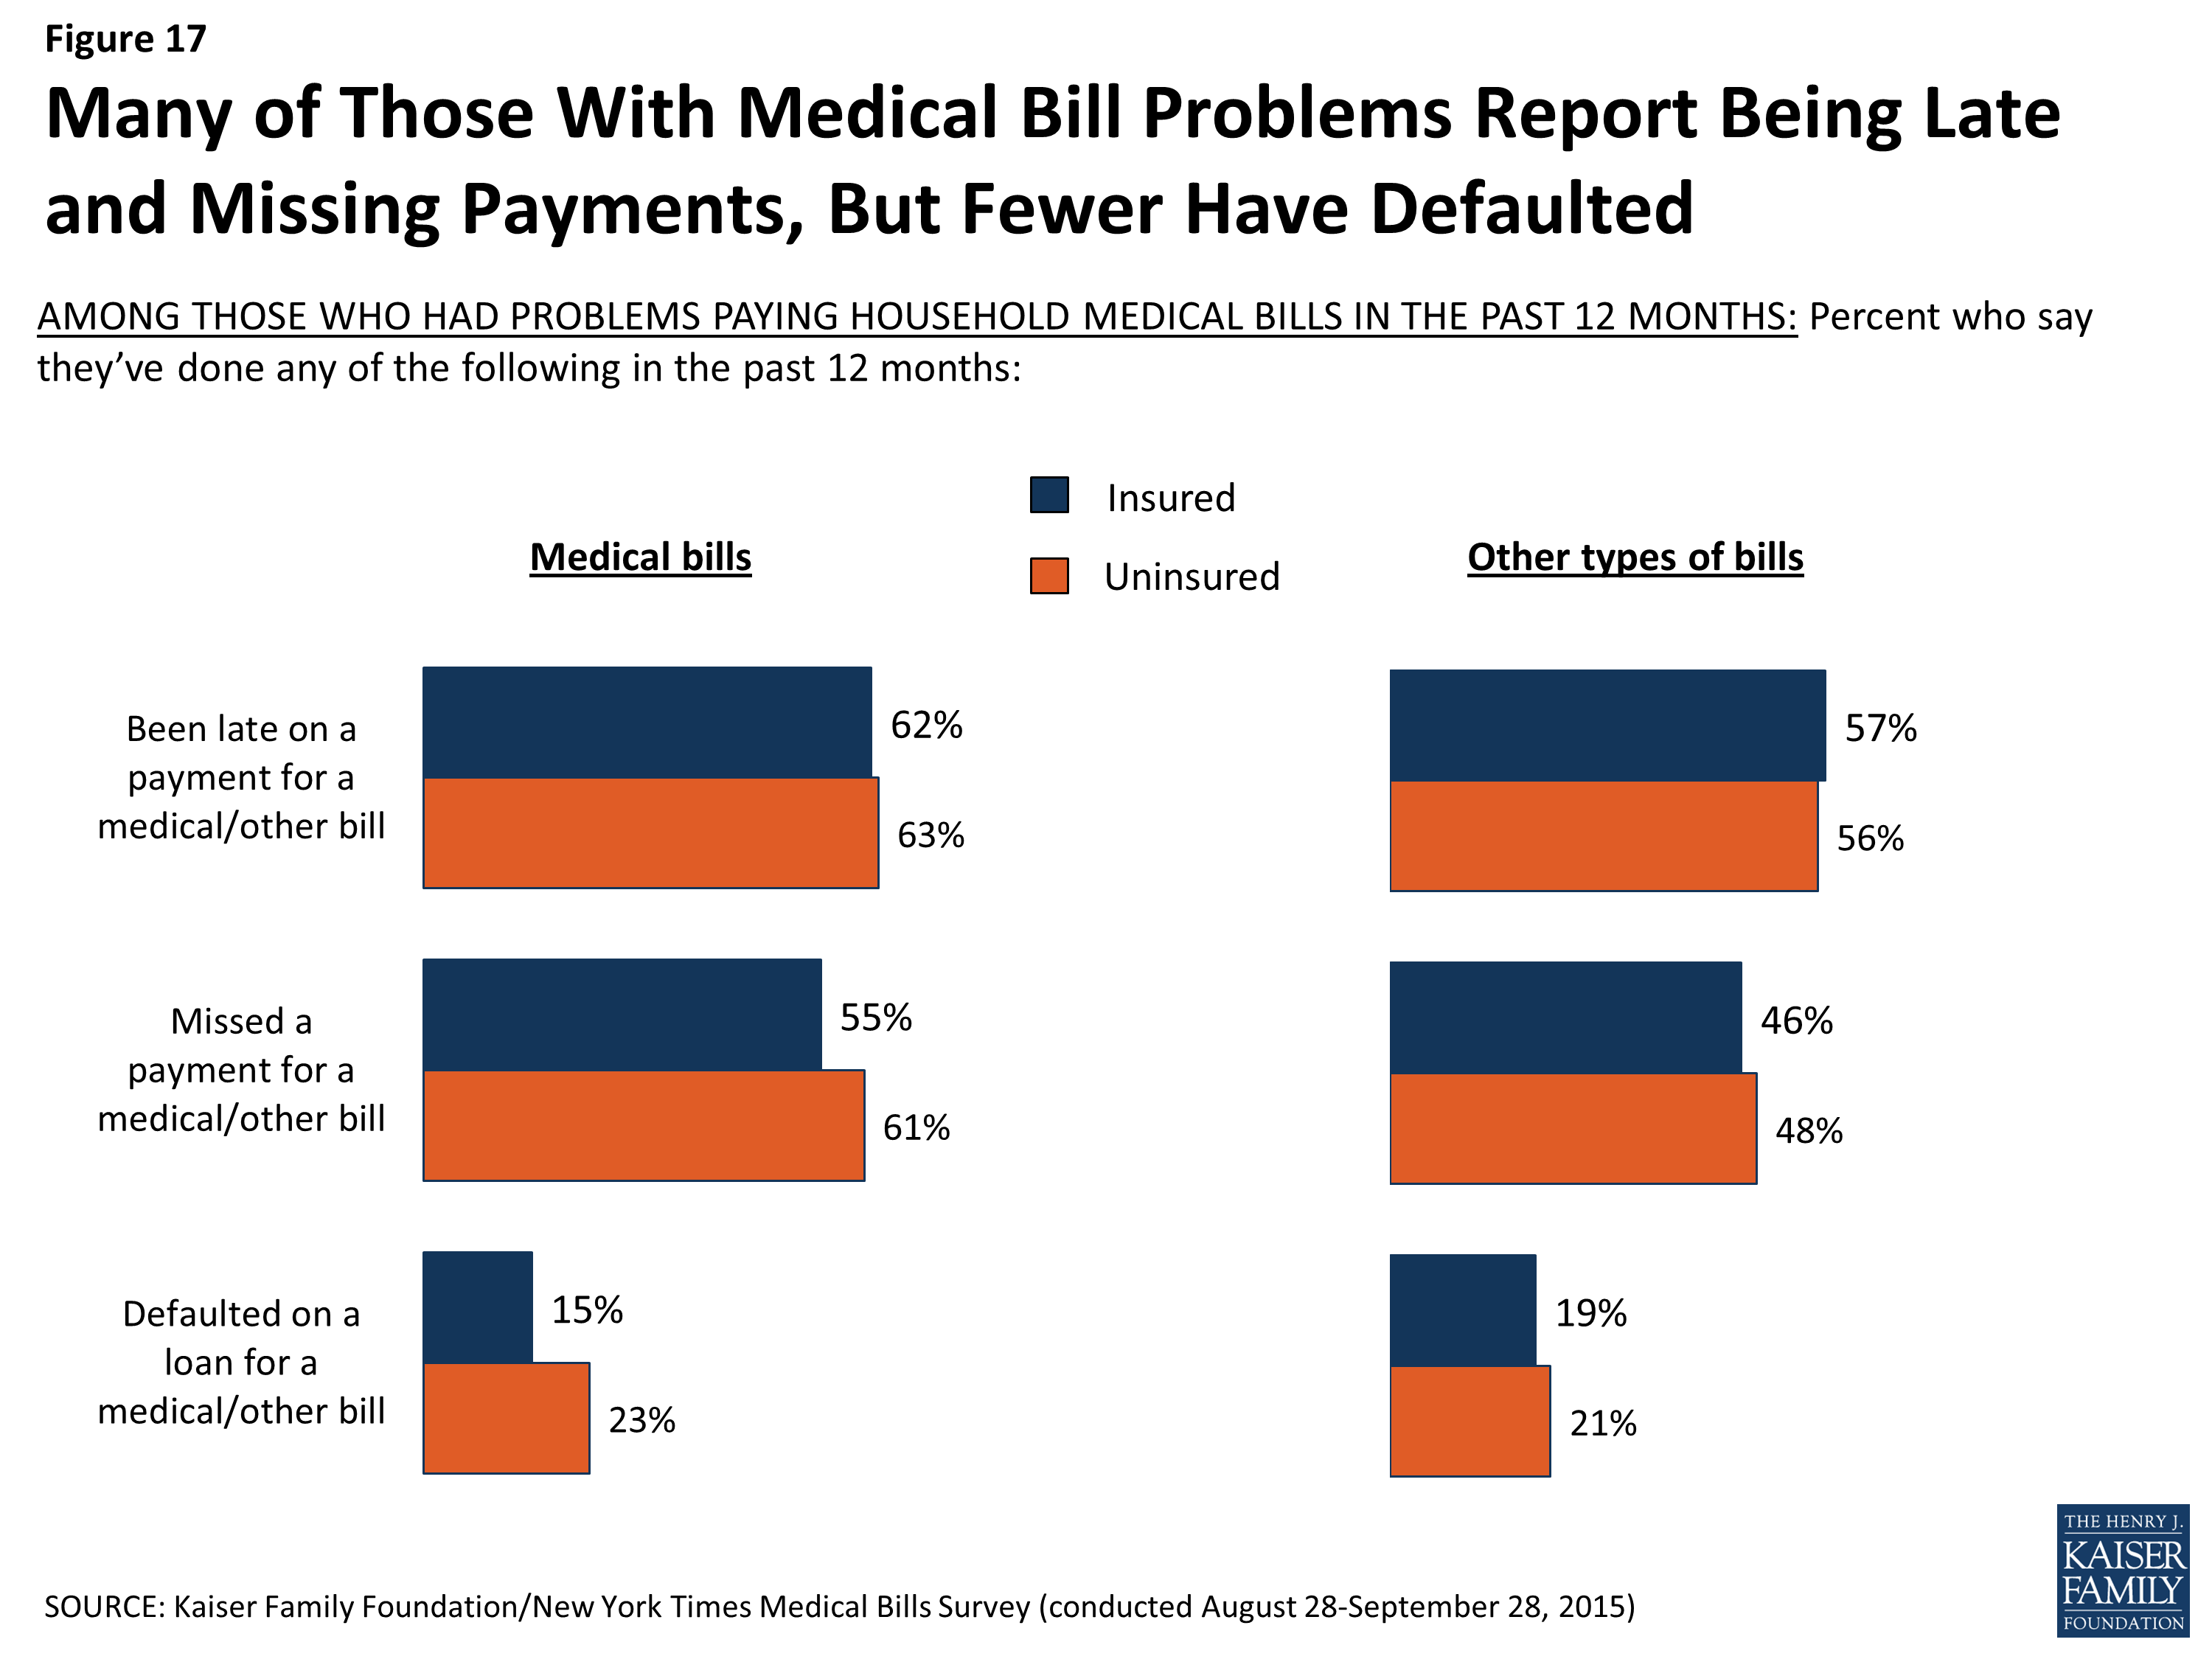
Figure 17: Many of Those With Medical Bill Problems Report Being Late and Missing Payments, But Fewer Have Defaulted
Likely as a result of missed or late payments, almost six in ten (58 percent) of those with medical bill problems say they’ve been contacted by a collection agency in the past year, mostly because of medical bills alone (25 percent) or a combination of medical bills and some other type of debt (20 percent). Again, once medical bill problems start, insurance offers little protection against such follow-up, with similar shares of the insured (56 percent) and uninsured (63 percent) saying they’ve been contacted by a collections agency in the past 12 months.
| Table 5: Many With Medical Bill Problems Report Being Contacted by Collection Agency | |||
| Among those who had problems paying medical bills in past 12 months | |||
| Have you or someone else in your household been contacted by a collection agency in the past 12 months for any reason, or not? Was that because of medical bills, some other type of bills, or both? | Total | Insured | Uninsured |
| Yes, contacted by collection agency | 58% | 56% | 63% |
| Because of medical bills | 25 | 26 | 22 |
| Because of some other type of bills | 12 | 10 | 15 |
| Because of both | 20 | 19 | 24 |
| No, not contacted by collection agency | 41 | 44 | 34 |
| NOTE: Don’t know/Refused responses not shown. | |||
An indication of more serious financial problems, a small share (2 percent) of those with household medical bill problems say they’ve declared personal bankruptcy in the past year, and another 16 percent report declaring bankruptcy longer than 12 months ago. Overall, 11 percent say they’ve declared bankruptcy at some point and that medical bills were at least a partial contributor to their bankruptcy. Among those with medical bill problems, reports of having declared bankruptcy are similar among the insured (21 percent) and those without health insurance (14 percent).
| Table 6; Almost One-Fifth With Medical Bills Problems Have Declared Bankruptcy | |||
| Among those who had problems paying medical bills in past 12 months | |||
| Have you ever declared personal bankruptcy, or not? Did you declare bankruptcy mainly because of medical bills, mainly because of some other type of debt, or both? | Total | Insured | Uninsured |
| Declared bankruptcy in the past 12 months | 2% | 3% | 1% |
| Declared bankruptcy more than 12 months ago | 16 | 18 | 12 |
| Total declared bankruptcy (NET) | 18 | 21 | 14 |
| Because of medical bills | 3 | 3 | 3 |
| Because of some other type of bills | 7 | 9 | 4 |
| Because of both | 8 | 10 | 7 |
| Never declared bankruptcy | 82 | 79 | 86 |
| NOTE: Don’t know/Refused responses not shown. | |||
Section 4: Patients as Consumers
In today’s health care environment where information about the cost of health care services can be difficult to find, patients and families often need to be savvy consumers in terms of estimating the cost of care (or their share of the cost if insured), finding the best price, and working out a payment plan after services have been received. The survey finds that some of those who faced medical bill problems found health care providers willing to cooperate with them in setting up payment plans or reducing the amount they owed, while others attempted to engage in cost-conscious health care shopping behaviors and met with little success.
Broadly, the survey finds that a majority of people both with medical bill problems (61 percent) and without (63 percent) say doctors rarely, if ever, discuss the costs of recommended treatments and whether they would be covered by insurance.
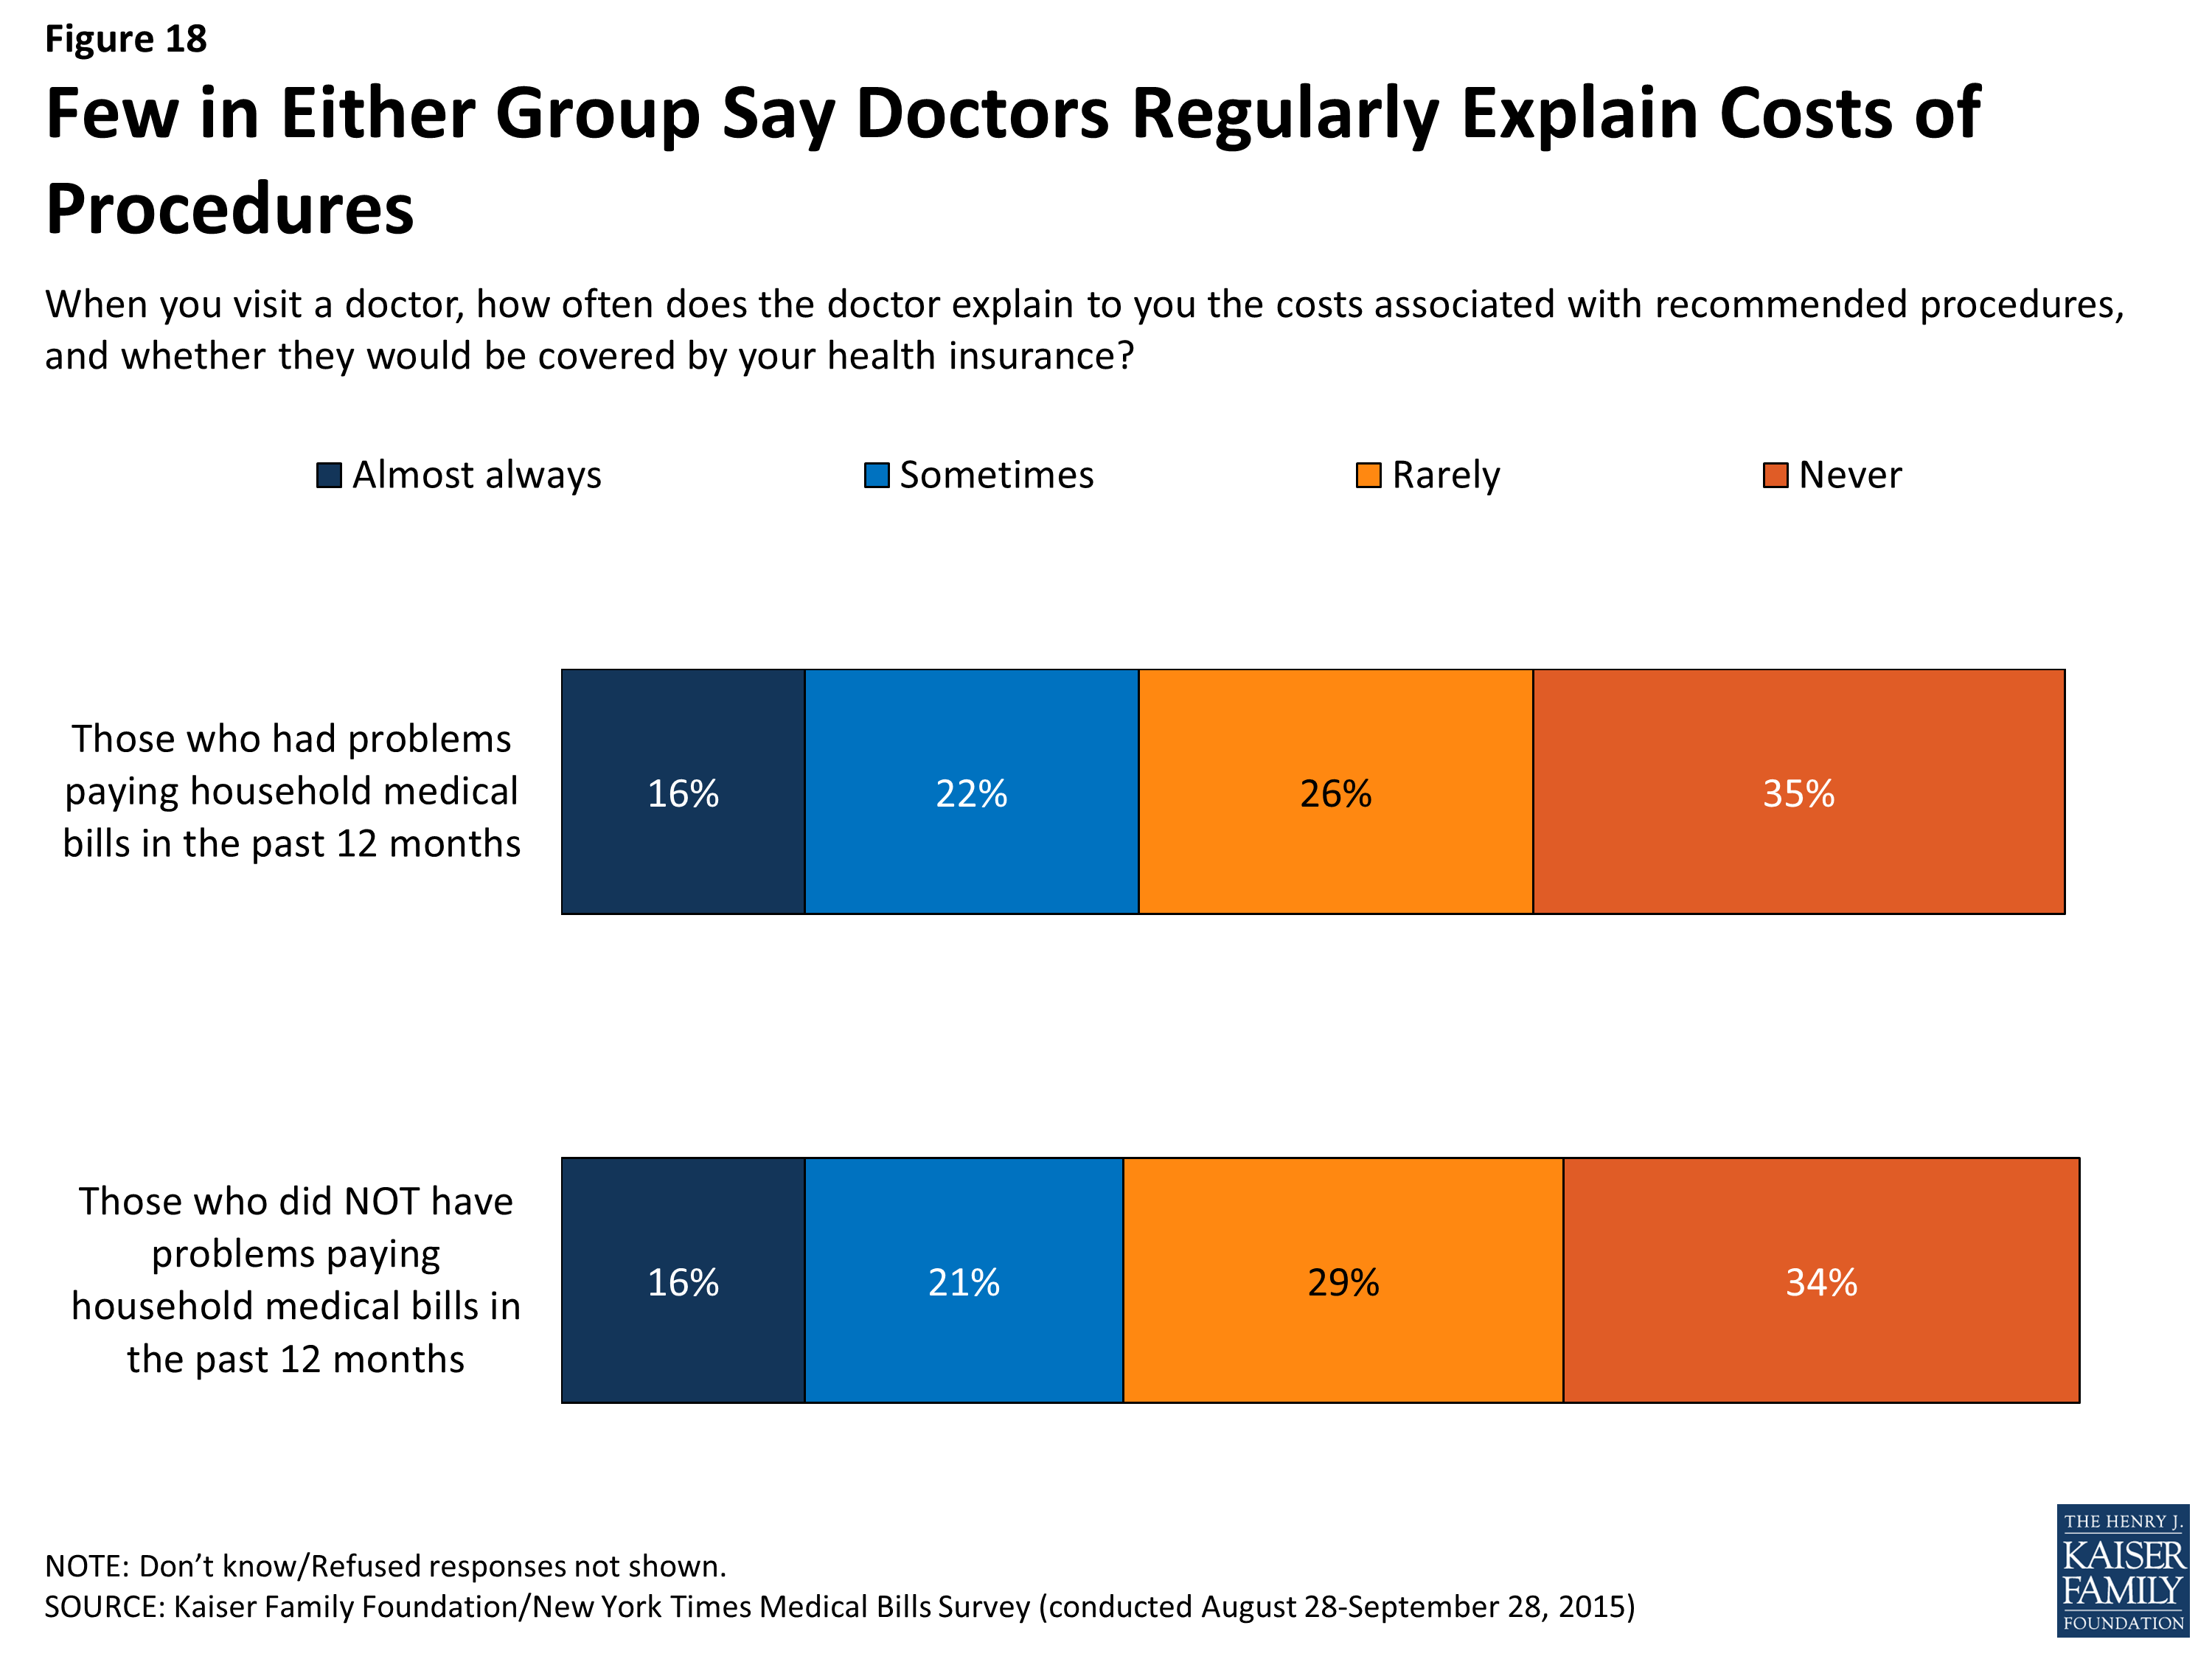
Figure 18: Few in Either Group Say Doctors Regularly Explain Costs of Procedures
The survey does find, however, that those who’ve had difficulty paying medical bills are more likely than their peers to report taking extra measures to negotiate prices or shop around for health care.
Compared to those who have not experienced medical bill problems, those who have faced such problems are more likely to say that in the past 12 months, they have checked with a doctor’s office about the cost a visit beforehand (49 percent versus 34 percent), shopped around to find the best price for a medical service (34 percent versus 17 percent), or negotiated with a provider to get a lower price before receiving services (22 percent versus 6 percent). However, those with medical bill problems are also more likely than those without such problems to say they have been told by a provider they must pay in full up front before services are provided (36 percent versus 14 percent).

Figure 19: Those with Medical Bill Problems More Likely to Report Engaging in Cost-Conscious Behaviors
Despite these extra efforts, many of those who say they tried to engage in cost-conscious behaviors found it difficult or unproductive. Seven in ten (69 percent) of those who shopped around for a lower price on medical services say it was difficult to find information about how much they would have to pay, and 67 percent of those who attempted to negotiate with a provider for a lower price say they were unsuccessful in doing so.
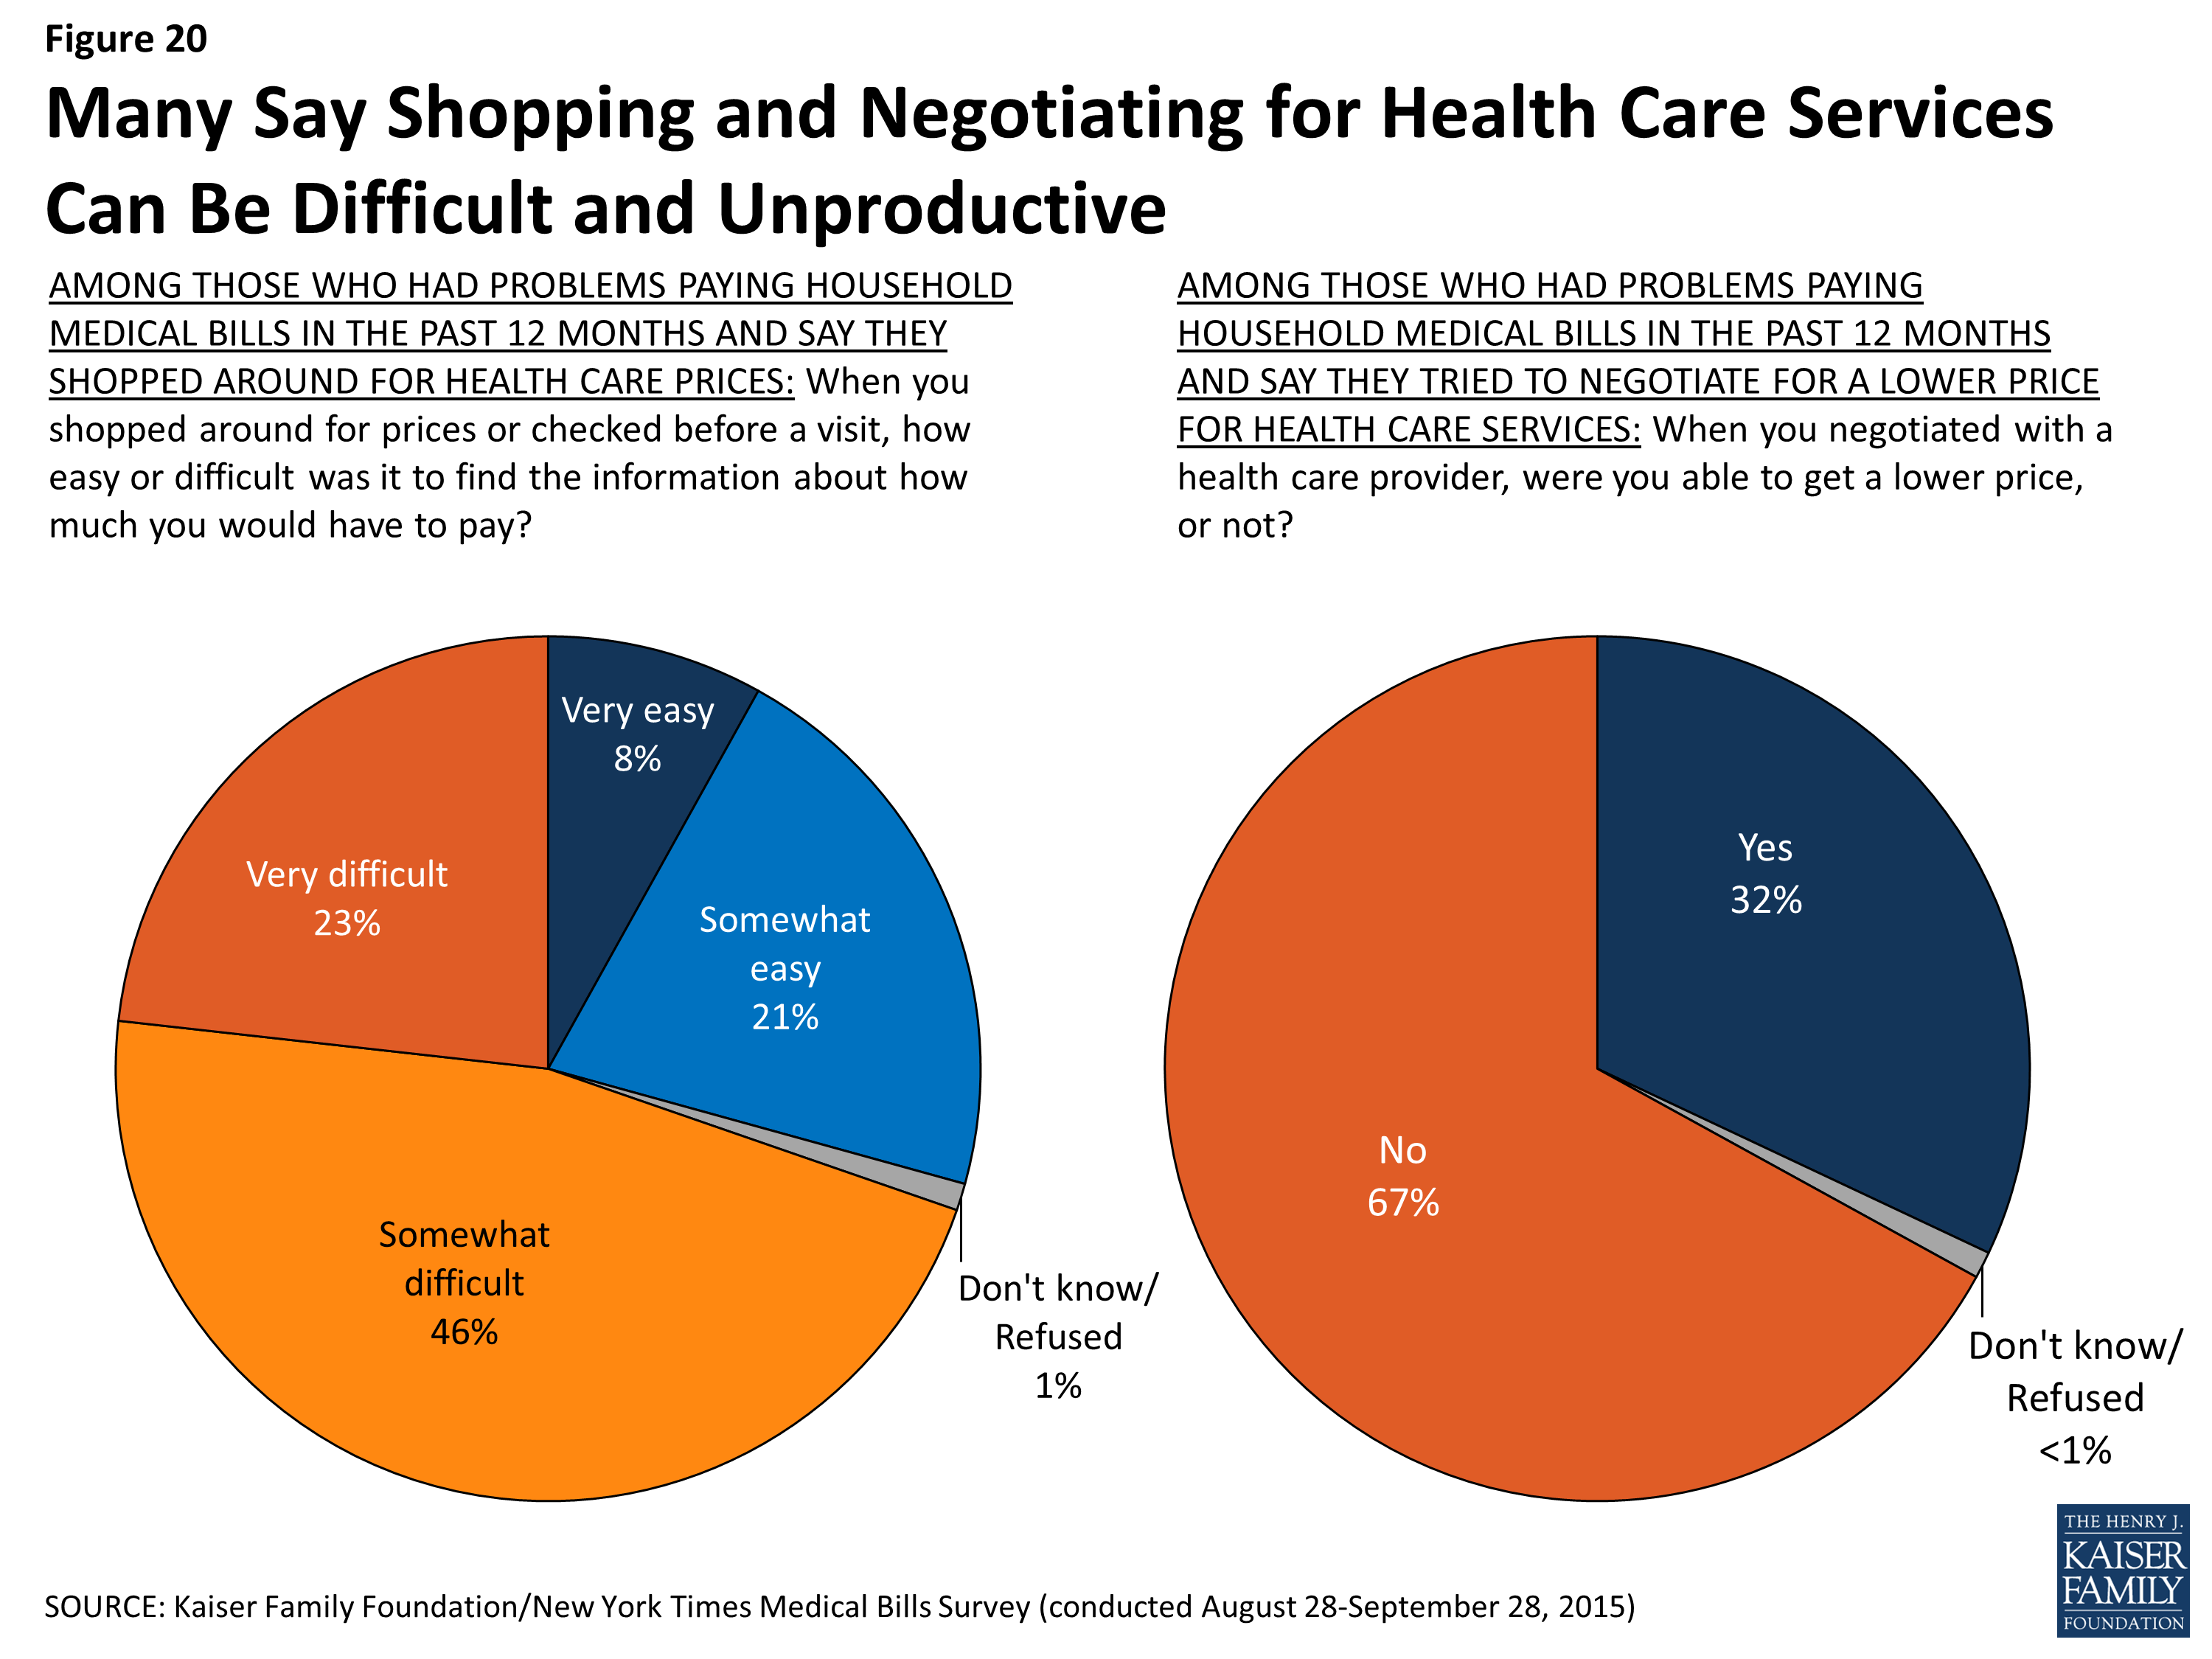
Figure 20: Many Say Shopping and Negotiating for Health Care Services Can Be Difficult and Unproductive
Just over half (53 percent) of those who had problems paying medical bills say they worked out a payment plan with a provider for at least some of what they owed. Most of these (28 percent of the total) say they did not pay a finance charge to the provider, while 12 percent say they did pay a finance charge and another 12 percent are not sure.
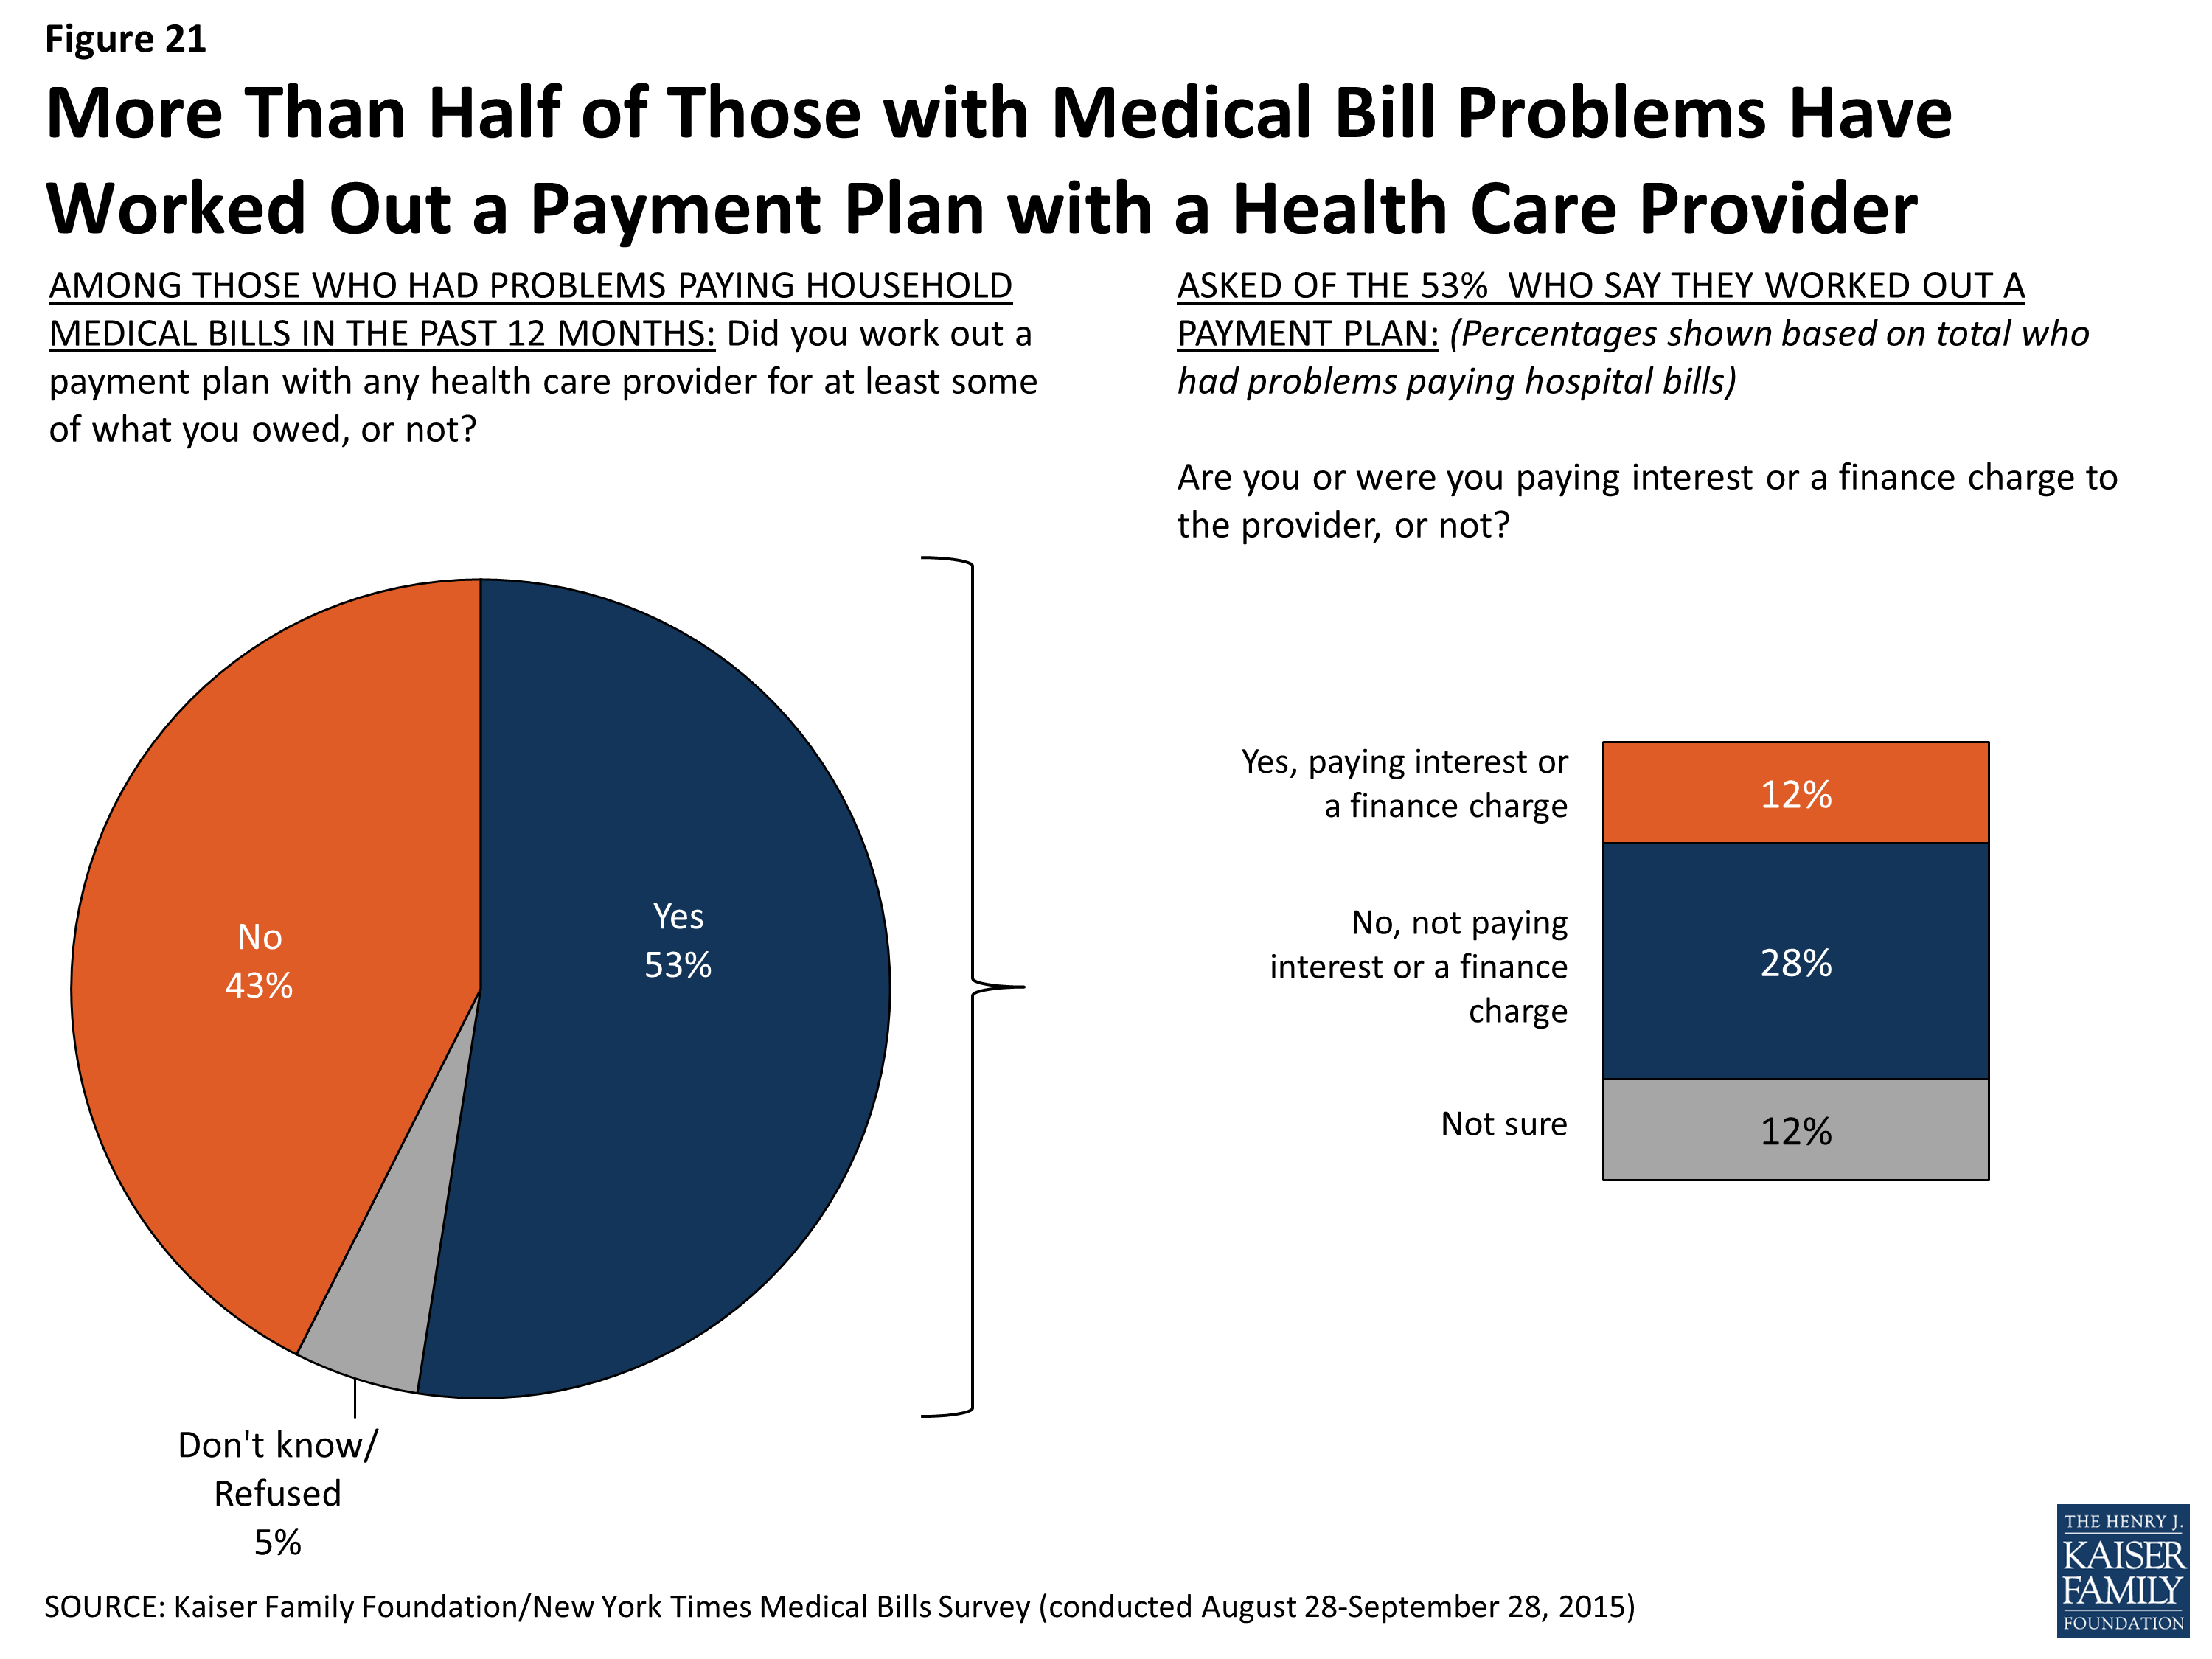
Figure 21: More Than Half of Those with Medical Bill Problems Have Worked Out a Payment Plan with a Health Care Provider
In their own words: One respondent’s story of confusing billing issues
[My wife] had an issue in her lower abdomen with chronic pain and went to see her OB/GYN for a professional opinion. She had the initial visit and needed to have some diagnostic lab testing done as well as a further ultrasound. She got no notification of the fees that were expected to be paid and the doctor told her that there was nothing to pay except the co-pay. Fast forward a few months and she gets a notice from the office saying that her unpaid bill is being forwarded to collections and will need to be paid immediately. She was never given notice before this collections notice and the fees seemed to be hidden or unknown to the doctor’s office. The disconnect between the medical services provided, and payment processing for those services provided, seems to be one of the largest issues, where one party is unaware of what the other needs to charge and does not give the patient the appropriate financial information in regards to the services being rendered.
Many hospitals have programs available to reduce or waive bills for people who have trouble paying, and non-profit hospitals are required to have such programs.1 Among those who report problems paying hospital bills, about half (47 percent) do not know if the hospital where they received care has such a program or not. Over a quarter (27 percent) say the hospital does have such a program, and 15 percent signed up for it. Additionally, fourteen percent of those who had problems paying medical bills other than hospital bills say a health care provider agreed to reduce the amount they owed.
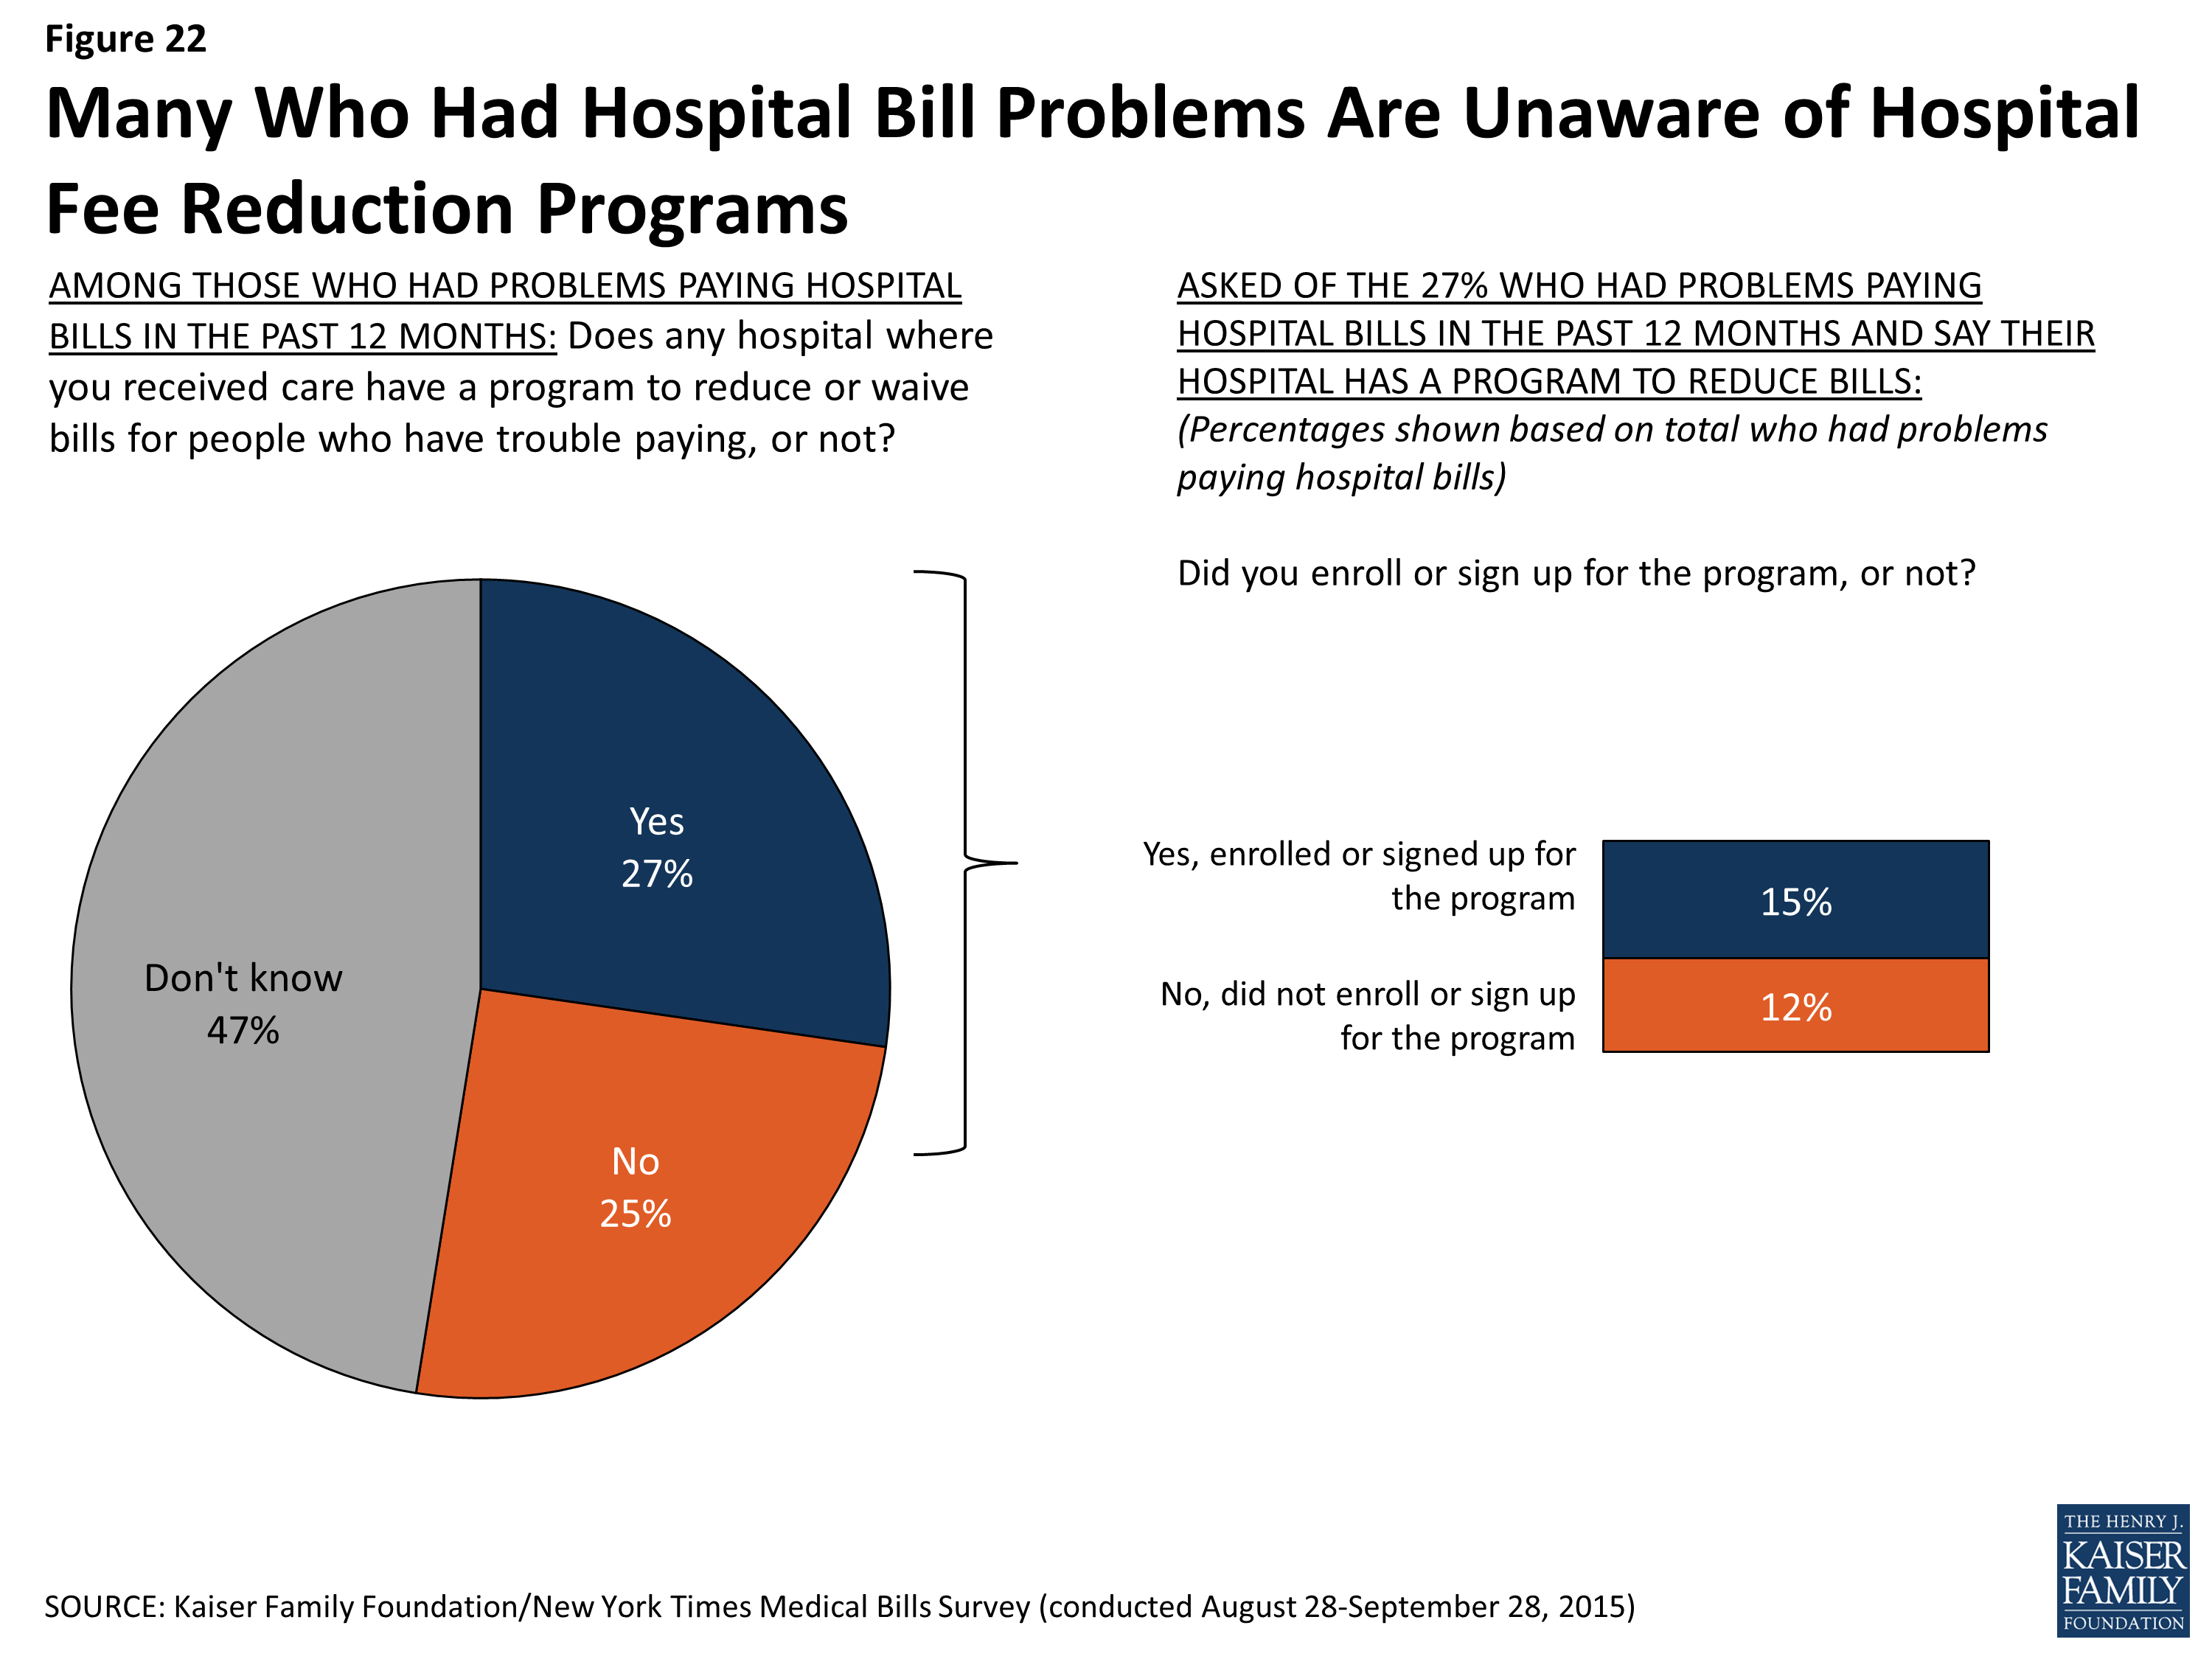
Figure 22: Many Who Had Hospital Bill Problems Are Unaware of Hospital Fee Reduction Programs
Conclusion
These survey findings confirm that problems related to unaffordable medical bills and medical debt are prevalent, affecting roughly 1 in 4 non-elderly adults in the United States. Certain groups are more vulnerable, including individuals and families with lower incomes and limited financial assets, people with chronic medical conditions and disabilities, the uninsured, and people insured by plans with high deductibles. Even so, people are not immune who have higher incomes, who are insured, or who are otherwise in good health and then experience unexpected health problems.
Insurance features like cost-sharing, provider networks, and confusing billing practices can all lead to medical bill problems among the insured. While higher deductibles and other forms of cost-sharing have helped to keep health insurance premium growth at historically low levels in recent years, the survey highlights the consequences these changes can have for people. Price transparency is another issue; while many say they tried to research treatment option costs in advance, most say such information was difficult to find.
The survey also shows that medical bill problems can have real and often lasting impacts on individuals and families in terms of their standard of living, their financial stability, and their ability to access needed health care. While insurance provides some protection against incurring medical bill problems in the first place, once these problems occur, the effects on individuals and families are often as serious for the insured as they are for the uninsured. As the nation moves beyond the debate over the Affordable Care Act, issues of health care costs and affordability like those highlighted by this survey are likely to play a prominent role in health policy discussions. Information about the causes of medical debt and its impacts on people can play an important part in these discussions and help policymakers and others as they work on solutions to alleviate the burden of medical debt on American families.
Appendix
Appendix 1: Reported Problems Paying Medical Bills By Demographic Group
Appendix 1: Reported Problems Paying Medical Bills By Demographic Group
| Group | Percent who say they or someone in their household had problems paying medical bills in the past 12 months | |
| Total | 26% | |
| Insurance status | Uninsured | 53 |
| Employer coverage | 19 | |
| Non-group coverage | 22 | |
| Medicaid | 18 | |
| Deductible level (among those with employer or non-group coverage | Private insurance, high deductible1 | 26 |
| Private insurance, lower deductible | 15 | |
| Annual household income | Less than $50,000 | 37 |
| $50,000-$99,999 | 26 | |
| $100,000 or more | 14 | |
| Disability prevents from participating fully in work, school, housework, other activities | Yes | 47 |
| No | 22 | |
| Self-reported health status | Fair/poor | 45 |
| Excellent/very good/good | 22 | |
| Receiving regular medical treatment for any chronic health problem | Yes | 34 |
| No | 23 | |
| Gender | Male | 23 |
| Female | 29 | |
| Age | 18-29 | 31 |
| 30-49 | 24 | |
| 50-64 | 25 | |
| Children in household | Yes | 29 |
| No | 24 | |
| Education | High school or less | 32 |
| Some college | 30 | |
| College graduate | 16 | |
| Race/ethnicity | White, non-Hispanic | 24 |
| Black, non-Hispanic | 31 | |
| Hispanic | 32 | |
| Other/mixed race | 25 | |
| Census Region | Northeast | 18 |
| Midwest | 23 | |
| South | 32 | |
| West | 26 | |
Survey Methodology
Appendix 2: Survey Methodology
The Kaiser Family Foundation/New York Times Medical Bills Survey is based on interviews with a probability-based sample of 2,575 respondents between the ages of 18 and 64 conducted August 28 through September 28, 2015. Interviews were administered online and by telephone in English and Spanish, including a longer interview with 1,204 adults who reported problems paying household medical bills in the past 12 months and a shorter comparison survey with 1,371 who did not report such problems. Teams from the Foundation and The Times worked together to develop the questionnaire and analyze the data, and both organizations contributed financing for the survey. Each organization is solely responsible for its content.
NORC at the University of Chicago conducted sampling, interviewing, and tabulation for the survey using the AmeriSpeak Panel, a representative panel of adults age 18 and over living in the United States. AmeriSpeak Panel members are recruited through probability sampling methods using the NORC National Sample Frame, an address-based sampling frame. Panel members who do not have internet access complete surveys via telephone, and internet users complete surveys via the web (for the current survey, 619 respondents completed via phone and 1,956 via web).
The combined results have been weighted to adjust for the fact that not all survey respondents were selected with the same probability, to address the implications of sample design, and to account for systematic nonresponse along known population parameters. The first weighting stage addressed differences in probability of selection for the AmeriSpeak Panel and to account for differential nonresponse to the AmeriSpeak screening interview. At this stage, an adjustment was also made to account for the undersampling of panelists who did not report problems paying household medical bills and to account for differential nonresponse to the survey screening interview.
In the second weighting stage, the sample was adjusted to match known demographic distributions of the U.S. population ages 18-64 by age, gender, education, race/ethnicity, Census region, and household income. Demographic weighting parameters were based on the U.S. Census Bureau’s 2015 March Supplement to the Current Population Survey.
The margin of sampling error including the design effect for the full sample is plus or minus 3 percentage points. All statistical tests of significance account for the effect of weighting. Numbers of respondents and margin of sampling error for key subgroups are shown in the table below. For results based on other subgroups, the margin of sampling error may be higher. Sample sizes and margins of sampling error for other subgroups are available by request. Note that sampling error is only one of many potential sources of error in this or any other public opinion poll.
| Group | N (unweighted) | M.O.S.E. |
| Total adults ages 18-64 | 2,575 | ±3 percentage points |
| Problems paying household medical bills past 12 months | 1,204 | ±4 percentage points |
| No problems paying household medical bills past 12 months | 1,371 | ±4 percentage points |
| Insured with problems paying household medical bills past 12 months | 802 | ±5 percentage points |
| Uninsured with problems paying household medical bills past 12 months | 369 | ±8 percentage points |
Kaiser Family Foundation public opinion and survey research and NORC at the University of Chicago are both charter members of the Transparency Initiative of the American Association for Public Opinion Research.
Endnotes
Key Findings
Introduction
Medical Debt Among People With Health Insurance, Kaiser Family Foundation, January 2014. https://www.kff.org/private-insurance/report/medical-debt-among-people-with-health-insurance/
People ages 65 and older also experience problems paying medical bills. However, since nearly all of them have access to health insurance coverage through Medicare, and since their family budget considerations are often quite different from those of younger adults, we limited this survey to those ages 18-64.
Section 1: Who Has Medical Bill Problems and What Are the Contributing Factors?
Throughout this report, higher deductibles are defined as $1,500 and above for an individual or $3,000 and above for a family.
Results are similar if respondents are grouped by an estimate of their income as a percentage of the federal poverty level (FPL) using information on income and family size, rather than based on household income alone.
Section 4: Patients as Consumers
New Requirements for 501(c)(3) Hospitals Under the Affordable Care Act, Internal Revenue Service, https://www.irs.gov/Charities-&-Non-Profits/Charitable-Organizations/New-Requirements-for-501(c)(3)-Hospitals-Under-the-Affordable-Care-Act
Appendix
Appendix 1: Reported Problems Paying Medical Bills By Demographic Group
Throughout this report, higher deductibles are defined as $1,500 and above for an individual or $3,000 and above for a family.