 Visualizing Income and Assets Among Medicare Beneficiaries: Now and in the Future
Interactive
Visualizing Income and Assets Among Medicare Beneficiaries: Now and in the Future
Interactive
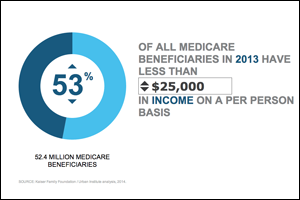
This interactive tool describes the income, savings and home equity of people on Medicare in 2013, and in 2030. It allows users to break out the data by age, gender, race/ethnicity, marital status and education level, providing insight into the disparities within and across categories of beneficiaries.