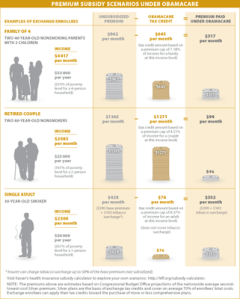
Visualizing Health Policy: Premium Subsidy Scenarios Under Obamacare
This month’s Visualizing Health Policy infographic shows 3 scenarios that illustrate the cost of health insurance under the Affordable Care Act for families in different circumstances, both before and after premium subsidies (in the form of a tax credit).
Visualizing Health Policy is a monthly infographic series produced in partnership with the Journal of the American Medical Association (JAMA). The full-size infographic is freely available on JAMA’s website and is published in the print edition of the journal.

