Where are California's Uninsured Now? Wave 2 of the Kaiser Family Foundation California Longitudinal Panel Survey
Executive Summary
Last summer, just before the first open enrollment period under the Affordable Care Act (ACA), the Kaiser Family Foundation (KFF) conducted a baseline survey of California’s uninsured nonelderly adult population. After the open enrollment period came to a close, we conducted a second survey with the same group of individuals who participated in the baseline (a longitudinal-panel survey) to find out whether they obtained coverage or remained uninsured and to explore the coverage choices people made, their experiences with open enrollment and their new insurance. Additional waves of the panel survey over the next two years will continue to track this same group of individuals to capture their changing attitudes and experiences. The surveys are designed and analyzed by researchers at KFF and the fieldwork costs associated with Wave 2 of the survey were paid for by The California Endowment.
California was an early adopter of the ACA and has been a leader in enrolling eligible residents in coverage through the two main avenues for expanding coverage under the law – Medi-Cal, the state Medicaid program, and Covered California, the new state marketplace where people can shop for insurance and access government subsidies to help pay for coverage.
This longitudinal panel study allows us to follow a large group of randomly selected uninsured Californians and assess how their insurance status changes over time to learn more about why or why not those changes occurred, and what gaining health insurance means for their daily lives without having to rely on respondents ability to report and recall details from months or years ago. By tracking a scientifically representative panel, we can quantify how widespread or limited certain problems or changes that may have been reported anecdotally actually were. Statistically representative narratives and stories from individual’s actual experiences can then be drawn from the sample to illuminate more accurately how the uninsured fare as the law is implemented in California.
Key Findings
Of those Californians who were uninsured prior to open enrollment, 58 percent now report having health insurance, which translates to about 3.4 million previously uninsured adult Californians who have gained coverage, and 42 percent say they remain uninsured.1 The most common source of coverage was Medi-Cal with 25 percent of previously uninsured Californians reporting they are now covered by Medi-Cal. An additional 9 percent of California’s previously uninsured say they enrolled in a plan through Covered California, resulting in about a third reporting new coverage from the two sources most directly tied to the ACA. Twelve percent say they obtained coverage through an employer and 5 percent report enrolling in non-group plans outside of the Covered California Marketplace; some enrollment in these types of coverage may have been motivated by the ACA’s requirement to purchase insurance and some may be the result of normal movement within the marketplace.
Fifty-two percent of Hispanics who were previously uninsured report enrolling in coverage, a share that rises to 61 percent of Hispanics after excluding those who are likely to be ineligible for financial assistance through Covered California or Medi-Cal due to their immigration status.2 And, over half of young adults age 19 to 34 (58 percent), those earning 138% of the federal poverty level (FPL) or less (54 percent), those earning greater than 138% and up to 400% FPL (61 percent),3 and those reporting fair or poor health (53 percent) report getting coverage since last summer. Outreach played a role in getting people covered — 69 percent of California’s previously uninsured who said they were contacted about signing up for health insurance since October 1st say they obtained coverage, compared to 52 percent of those that say they weren’t contacted.
Overall, after controlling for a number of demographic factors, the remaining uninsured are more likely to be male, undocumented immigrants, or people who have never had insurance, while those who are newly insured are more likely to be married, have been uninsured for less than two years, have a debilitating chronic condition or report being contacted about signing up for coverage.
California’s Newly Insured
- A majority of the newly insured say their plan is a good value for the amount they pay (73 percent) and report feeling well protected by their plan (64 percent). More newly insured report that gaining coverage has made them feel more financially secure than less (37 percent vs. 16 percent), but nearly half (46 percent) of those newly insured in plans other than through Medi-Cal say that paying for coverage is difficult.
- Getting coverage went smoothly for many newly insured, the majority of whom said it was easy to find the information they needed about enrolling (80 percent) and to sign up for coverage (76 percent). Six in 10 (60 percent) of those with coverage through Medi-Cal or Covered California say they had someone help them enroll.
- Among the newly insured, just over 4 in 10 (43 percent) say they visited the website during the open enrollment period, and the majority of them found their visit at least somewhat helpful. And, for those who ultimately enrolled in a Covered California plan, 72 percent say they visited the website, including just over half who say they found it helpful (55 percent).
- But some enrolling in Medi-Cal or Covered California report experiencing problems in confirming enrollment (29 percent and 42 percent, respectively) or determining if their income qualified them for Medi-Cal (19 percent) or financial assistance through Covered California (26 percent). Once enrolled, most newly insured report positive experiences with their plan so far (75 percent) and 43 percent say they have already visited a doctor or health provider.
- The newly insured are split on whether they attribute their new coverage to the ACA or not – 45 percent say they got insurance because of the law and 52 percent aren’t directly attributing their new coverage to the ACA and say it’s something they would have done anyway. But, looking at the two types of coverage that are most directly related to coverage expansions under the ACA, 60 percent of the newly insured (or 34 percent of previously uninsured Californians overall) say they enrolled in Medi-Cal or through Covered California.
- Most newly insured Hispanics say shopping was relatively easy. For those newly insured Hispanics who prefer to communicate in Spanish, nearly 9 in 10 (87 percent) say it was easy to find information in Spanish, including about two thirds (65 percent) who said it was very easy.
California’s Remaining Uninsured
- Many characteristics of the remaining uninsured indicate that they are a difficult to reach group with limited ties to health insurance. Nearly 4 in 10 (37 percent) say they have never had health insurance (compared to 20 percent who became insured) and an additional 45 percent say they have been uninsured for two or more years. Six in 10 (62 percent) are Hispanic, including 29 percent who are unable to take advantage of coverage expansions under the ACA due to their immigration status, and 70 percent of whom prefer to communicate in Spanish. In addition to those who are not eligible due to their immigration status, about 4 in 10 (39 percent) have incomes that put them in the group likely eligible for Medi-Cal and another quarter (24 percent) are likely eligible for financial assistance through Covered California.
- Roughly 7 in 10 (71 percent) of those who remain uninsured after the first open enrollment period say health insurance is something they need, but a third (34 percent) say cost remains a barrier to getting coverage.
- Just over a third (36 percent) of those who remain uninsured say they tried to get coverage but most say they did not enroll either due to the cost of coverage or difficulty completing the process.
- Nearly 6 in 10 (57 percent) of those still uninsured think they will get coverage later this year, though most (57 percent) of them are unsure where they might get it.
- Almost half of Hispanics who remain uninsured may not be eligible for coverage through Covered California or Medi-Cal under the ACA due to their immigration status, and just over half of remaining uninsured Hispanics (54 percent) are worried that enrolling in coverage would bring attention to their family’s immigration status. At the same time, Hispanics who remain uninsured largely feel that insurance is something they need (78 percent).
Newly Insured vs. Remaining Uninsured
Finally, in many areas examined in the survey differences exist between those who got insurance and those who remain uninsured. The majority of remaining uninsured don’t feel like they have enough information to understand how the ACA will impact them and their families (61 percent) whereas the majority of newly insured say they do (58 percent). The newly insured, including those who report ultimately getting coverage from a different source, were slightly more likely than the remaining uninsured to visit the Covered California website (43 percent vs. 30 percent) but while most of the newly insured report finding it helpful, most of those that remained uninsured said it was not helpful. More generally, the newly insured largely report positive experiences shopping for coverage and comparing plans, while the 36 percent of the remaining uninsured who tried said they had a hard time examining their options.
Key Findings
Introduction
The California Longitudinal Panel Survey is a series of surveys that tracks the experiences and perceptions of a representative, random sample of 2,001 nonelderly Californian adults who were uninsured prior to the initial open enrollment period created by the Affordable Care Act (ACA). The first survey in the series was conducted prior to the open enrollment period1 and the second, presented here, took place at its conclusion. This longitudinal panel is a unique opportunity to follow the same group of Californians to find out whether they gained coverage or remained uninsured, how they feel about and interact with the new coverage options and what barriers to getting insurance remain. Additional surveys in this series will continue to track these individuals to keep the pulse on how their experience with and views towards coverage are evolving, how coverage impacts their feelings of financial security, and will illuminate how key groups of previously uninsured Californians are faring, such as Hispanics, new Medi-Cal or Covered California enrollees, or people reporting poor health.
California was an early adopter of the ACA and has been a leader in enrolling eligible residents in coverage through the two main avenues for expanding coverage under the law. Medi-Cal, the state Medicaid program is estimated to have enrolled about 1.6 million people and Covered California, the new state marketplace where people can shop for insurance and access government subsidies to help pay for coverage, is estimated to have enrolled about 1.4 million people.2 Because of California’s size and early embrace of the ACA, the experiences of those who were uninsured prior to the coverage expansions within the state can help inform future enrollment efforts both locally and across the country.
This longitudinal panel study allows us to follow a large group of randomly selected uninsured Californians and assess how their insurance status changes over time to learn more about why or why not those changes occurred, and what gaining health insurance means for their daily lives without having to rely on respondents ability to report and recall details from months or years ago. By tracking a scientifically representative panel, we can quantify how widespread or limited certain problems or changes that may have been reported anecdotally actually were. Statistically representative narratives and stories from individual’s actual experiences can then be drawn from the sample to illuminate more accurately how the uninsured fare as the law is implemented in California.
And, while the ACA makes it easier for some people to get and keep coverage, there will inevitably continue to be people who move in and out of coverage as their job status changes, as shifts in their income change their eligibility for public assistance, or as they miss deadlines for enrollment. And, just as people have moved from being uninsured to having insurance since last summer (reported on in this study), others likely moved in the opposite direction and were covered then, but are uninsured now.3 This survey does not capture those experiences, and hence, does not estimate the overall change in the number of uninsured Californians since the start of open enrollment, but instead estimates the share of previously uninsured who got coverage.
Looking back to the results from the baseline survey to see where California’s uninsured started from prior to the open enrollment period, most (80 percent) had expressed a need for health insurance but many said they were without it because they didn’t think they could afford coverage (42 percent). In fact, California’s uninsured were a group struggling to stay financially afloat with nearly 90 percent reporting family incomes under 400% of the federal poverty level (FPL) (about 94,000 a year for a family of four in 2013), including more than half who reported their family income as 138% or less of the FPL (roughly $32,000 a year for a family of four). Sizeable shares reported that it is at least somewhat difficult for them to afford basic needs such as health care (83 percent), rent (65 percent), gas or other transportation costs (63 percent), or monthly utilities (61 percent). Health insurance is something that many of California’s uninsured had gone without for quite a while – about 7 in 10 (69 percent) reported they had not had coverage for two or more years. While many reported being employed (58 percent), most said they did not have access to a plan through an employer. In terms of the potential role the ACA may play in their lives, most had heard little about the upcoming coverage expansion opportunities and were unsure about how the law would impact them personally. Now, at the conclusion of the enrollment period we find that many more say they have enough information to understand the law’s impacts and are aware of some of the law’s key provisions, such as the requirement to have insurance and the coverage expansions through Medi-Cal and Covered California.
Section 1: Who Got Covered?
How Many Previously Uninsured Californians Got Covered?
Nearly 6 in 10 (58 percent), or approximately 3.4 million, previously uninsured adult Californians report obtaining health insurance since the start of open enrollment including 10 percent who say they have signed up but are waiting for coverage to start, while the remainder continued to go without health insurance (Figure 1). Fully a quarter of those uninsured prior to open enrollment report signing up for Medi-Cal while smaller shares report getting coverage through an employer (12 percent), a plan through Covered California (9 percent) and other non-group coverage (5 percent).
Under the Affordable Care Act, access to coverage in California was expanded primarily in two ways. Medi-Cal eligibility was broadened to include parents and adults without dependent children earning 138% FPL or less, two groups that had limited access to Medi-Cal coverage prior to the ACA. In addition, the Covered California Marketplace was developed as a place where people could shop and compare health insurance plans and access federal subsidies for health insurance. Outreach efforts and media coverage about the ACA may have encouraged some people who were previously eligible for coverage through Medi-Cal to obtain coverage, sometimes referred to as the “woodwork” effect. It is difficult to distinguish those who may already have been eligible for Medi-Cal from those who are newly eligible due to expanded eligibility under the ACA in this survey, but the combined enrollment of the newly insured in Medi-Cal and in plans through Covered California indicate that about a third (34 percent) of California’s previously uninsured got coverage through these ACA-related coverage options. In contrast, it is more typical for access to job-based insurance to shift frequently as people change jobs or become eligible after a waiting period, so some people may now have coverage through an employer because of normal movement in the insurance market, but others may have been motivated to enroll in an offer of coverage through an employer due to the ACA’s requirement to have insurance.
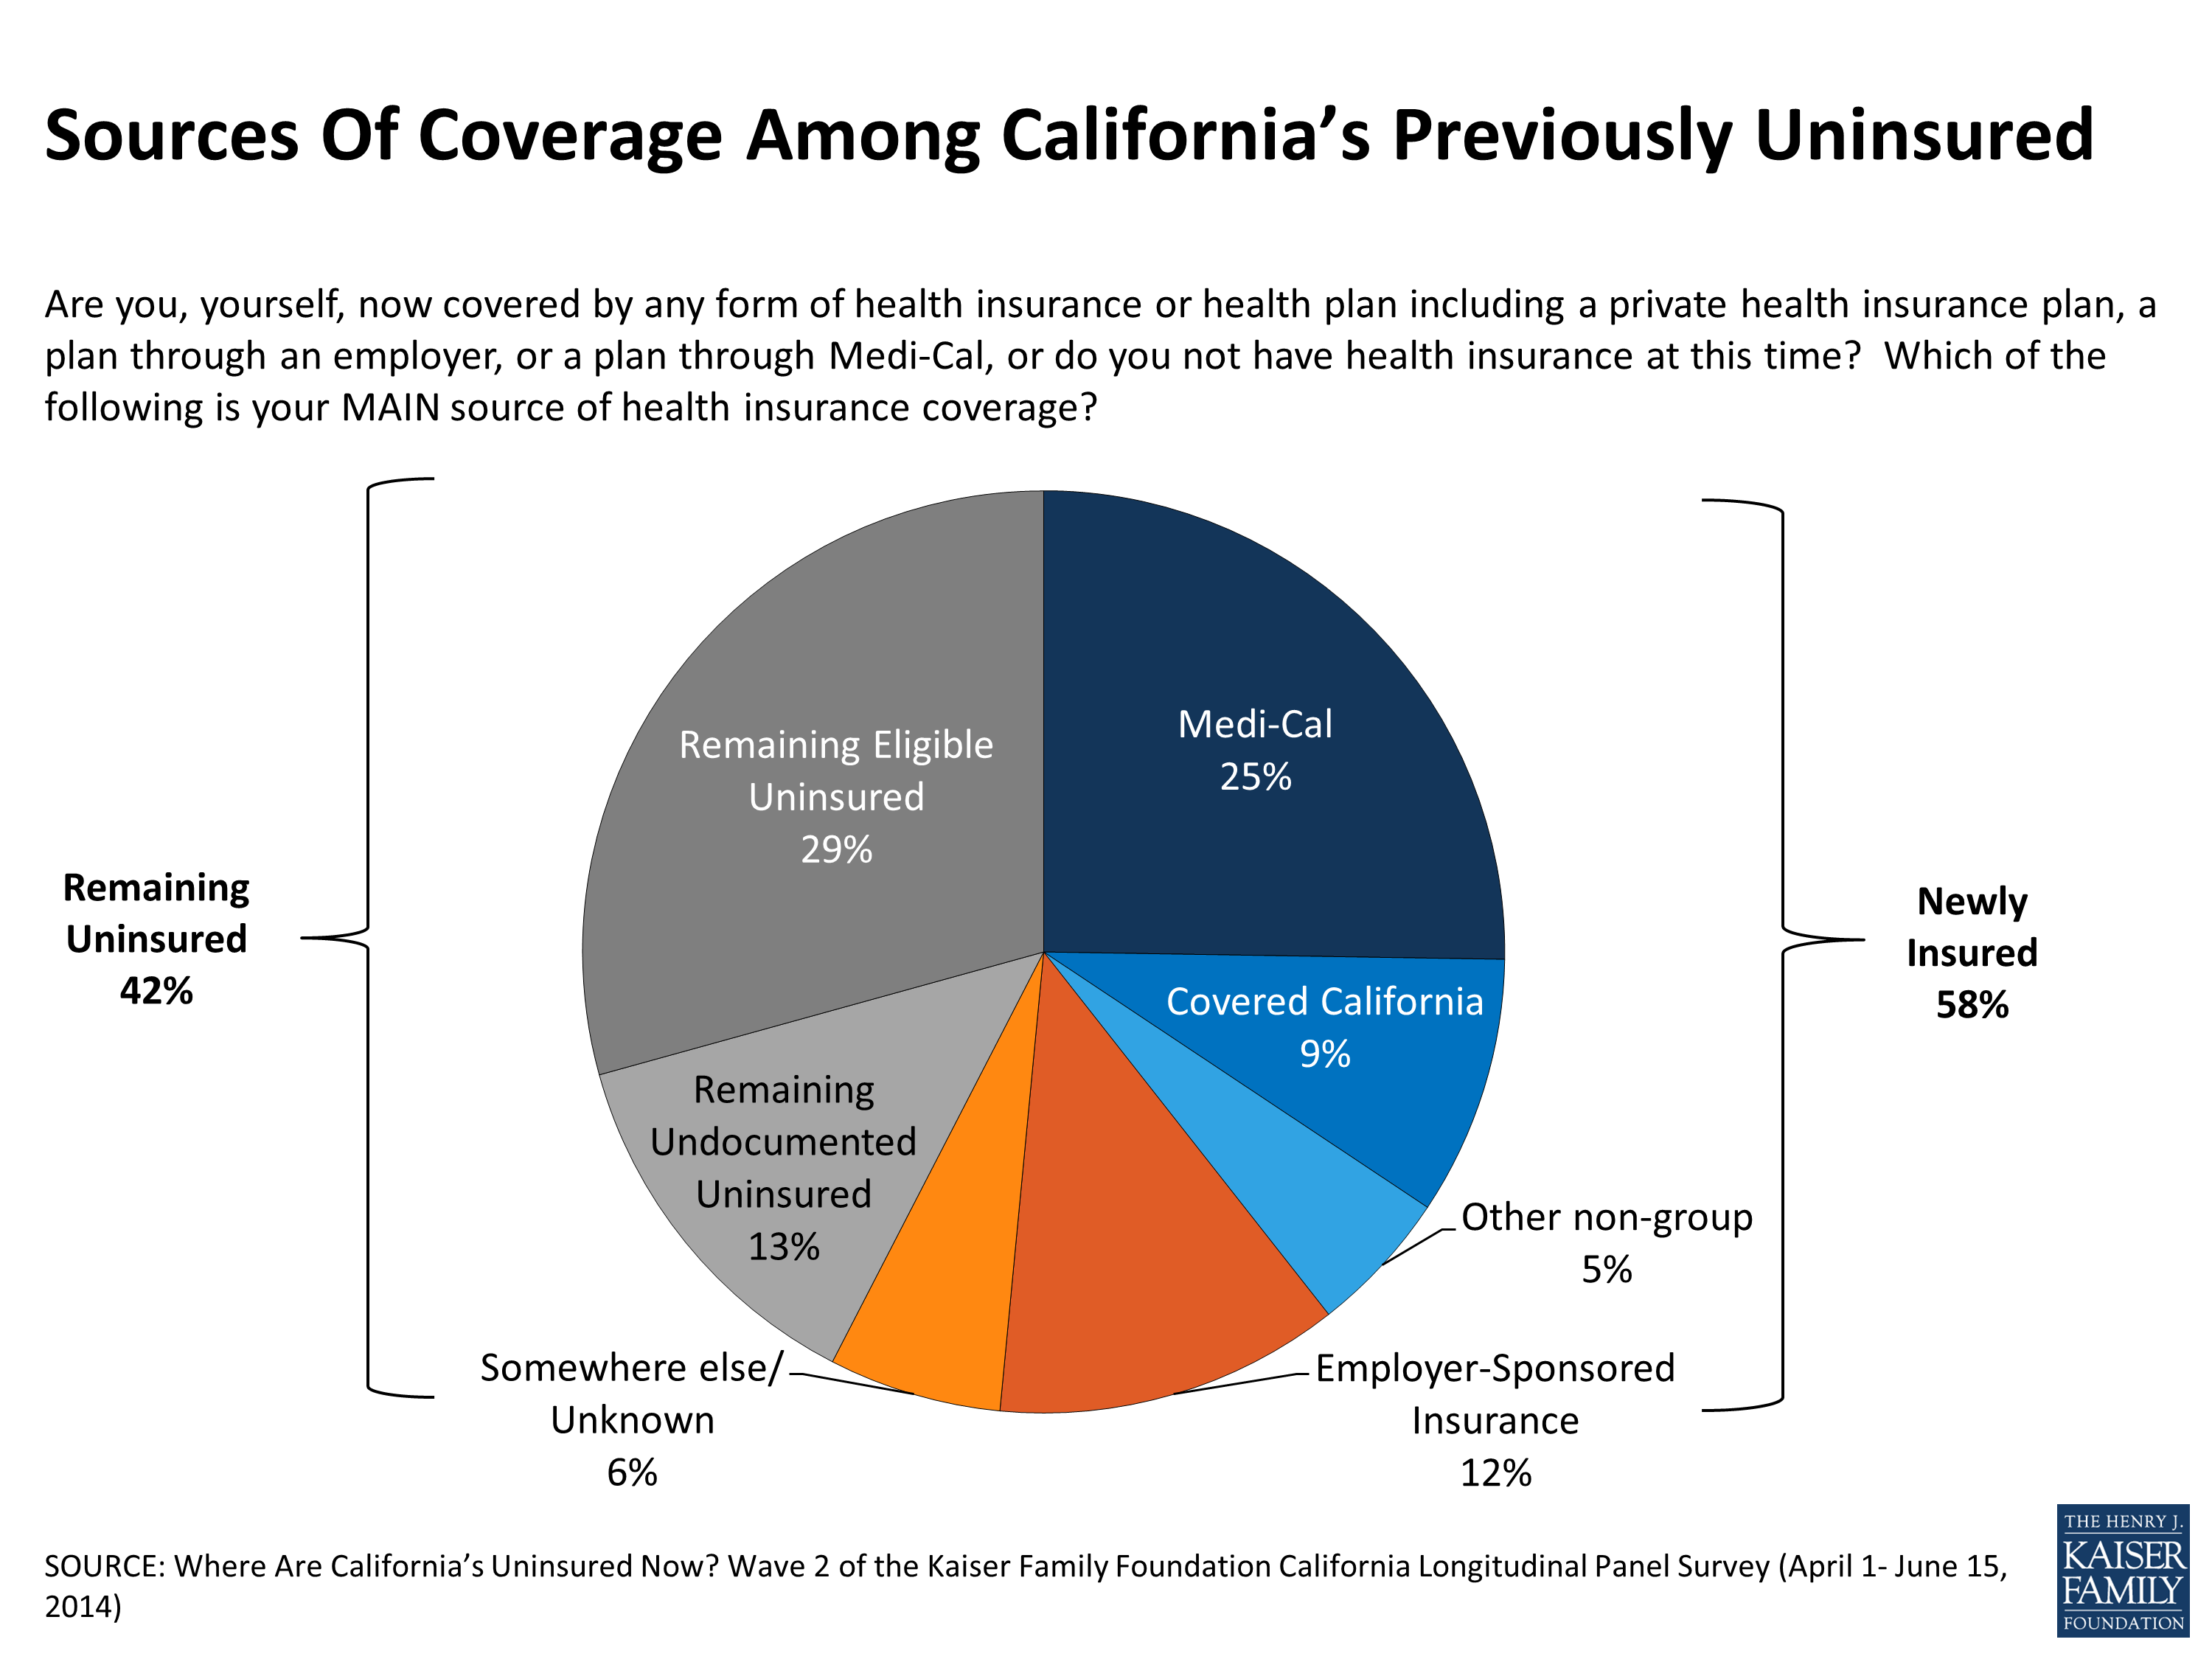
Figure 1
| Figure 2: Percentage Of Each Group Of Previously Uninsured Californians Reporting That They Are Now Insured Or Remain Uninsured | ||||||
| NEWLY INSURED | REMAINING UNINSURED | |||||
| Total Newly Insured | Medi-Cal | Covered California | Other non-group | Employer-sponsored insurance | ||
| TOTAL | 58% | 25% | 9% | 5% | 12% | 42% |
| AGE | ||||||
| 19-34 | 58 | 24 | 7 | 4 | 18 | 42 |
| 35-49 | 55 | 28 | 11 | 3 | 7 | 45 |
| 50-64 | 58 | 24 | 12 | 7 | 8 | 41 |
| RACE/ETHNICITY | ||||||
| White, non-Hispanic | 61 | 22 | 16 | 3 | 16 | 39 |
| Black, non-Hispanic | 62 | 35 | 5 | 4 | 15 | 38 |
| Hispanic (NET) | 52 | 24 | 6 | 4 | 12 | 48 |
| Hispanic, Eligible | 61 | 27 | 7 | 5 | 14 | 39 |
| GENDER | ||||||
| Men | 52 | 20 | 8 | 3 | 15 | 48 |
| Women | 63 | 31 | 11 | 6 | 9 | 37 |
| LENGTH OF TIME UNINSURED | ||||||
| 2 months to less than a year | 78 | 21 | 19 | 2 | 31 | 21 |
| 1 year to less than 2 years | 66 | 33 | 5 | 7 | 12 | 34 |
| 2 years or more | 58 | 27 | 10 | 5 | 9 | 42 |
| Never had insurance | 43 | 20 | 6 | 5 | 9 | 57 |
| EMPLOYMENT | ||||||
| Employed | 54 | 18 | 10 | 5 | 17 | 46 |
| Unemployed | 59 | 35 | 10 | 4 | 5 | 41 |
| A student, retired, on disability, or stay at home parent | 66 | 37 | 7 | 6 | 6 | 33 |
| EDUCATION | ||||||
| High school or less | 52 | 26 | 6 | 2 | 10 | 48 |
| Some college | 59 | 25 | 10 | 7 | 11 | 41 |
| College or more | 79 | 19 | 21 | 12 | 24 | 21 |
| HEALTH STATUS | ||||||
| Excellent/ Very good/ Good | 60 | 22 | 11 | 6 | 15 | 40 |
| Fair/ Poor | 53 | 32 | 6 | 3 | 7 | 47 |
| MARITAL STATUS | ||||||
| Married | 60 | 23 | 11 | 6 | 13 | 40 |
| Not Married | 56 | 27 | 8 | 5 | 12 | 44 |
| FAMILY INCOME^ | ||||||
| Less than 138% FPL | 54 | 34 | 4 | 4 | 6 | 46 |
| Between 138% and 400% | 61 | 15 | 15 | 6 | 21 | 39 |
| DEBILITATING CHRONIC CONDITION | ||||||
| Yes | 77 | 38 | 9 | 4 | 12 | 23 |
| No | 54 | 23 | 9 | 5 | 12 | 46 |
| ^ Among eligible Californians earning 138% FPL or less, 61 percent report gaining coverage and 39 percent say they remain uninsured. For those eligible between 139% and 400% FPL, 66 percent report now being covered and 34 percent say they remain uninsured.Note: Those reporting coverage through another source are not shown. | ||||||
Which Previously Uninsured Californians Got Covered?
Rates of coverage among previously uninsured adult Californians are similar across age groups, income groups, and self-reported health status (Figure 2). For example, 58 percent of previously uninsured younger adults age 19 to 34 report getting insurance, similar to the share of middle-aged adults age 35 to 49 (55 percent) and the same as the share of near-elderly age 50 to 64 (58 percent). Reports of new coverage are also similar for those at different income levels. And, those reporting their health as fair or poor were just as likely to say they got insurance as Californians reporting being in at least good health (53 percent and 60 percent).
Prior to the coverage expansions under the ACA, Hispanics made up over half of the uninsured adult population in California and now over half of Hispanics (52 percent) who were previously uninsured report getting coverage (Figure 3), a share that is statistically similar to whites (61 percent). Still, concern over lagging enrollment among Hispanics in plans through Covered California warrants a closer look at new coverage rates among previously uninsured Hispanics. As many as a third of previously uninsured Hispanics may be ineligible for coverage through Medi-Cal or Covered California due to their immigration status.1 Therefore, focusing only on previously uninsured Hispanics whose immigration status permits them to enroll in Medi-Cal or participate in Covered California, 61 percent are newly insured, the same share as newly insured whites.
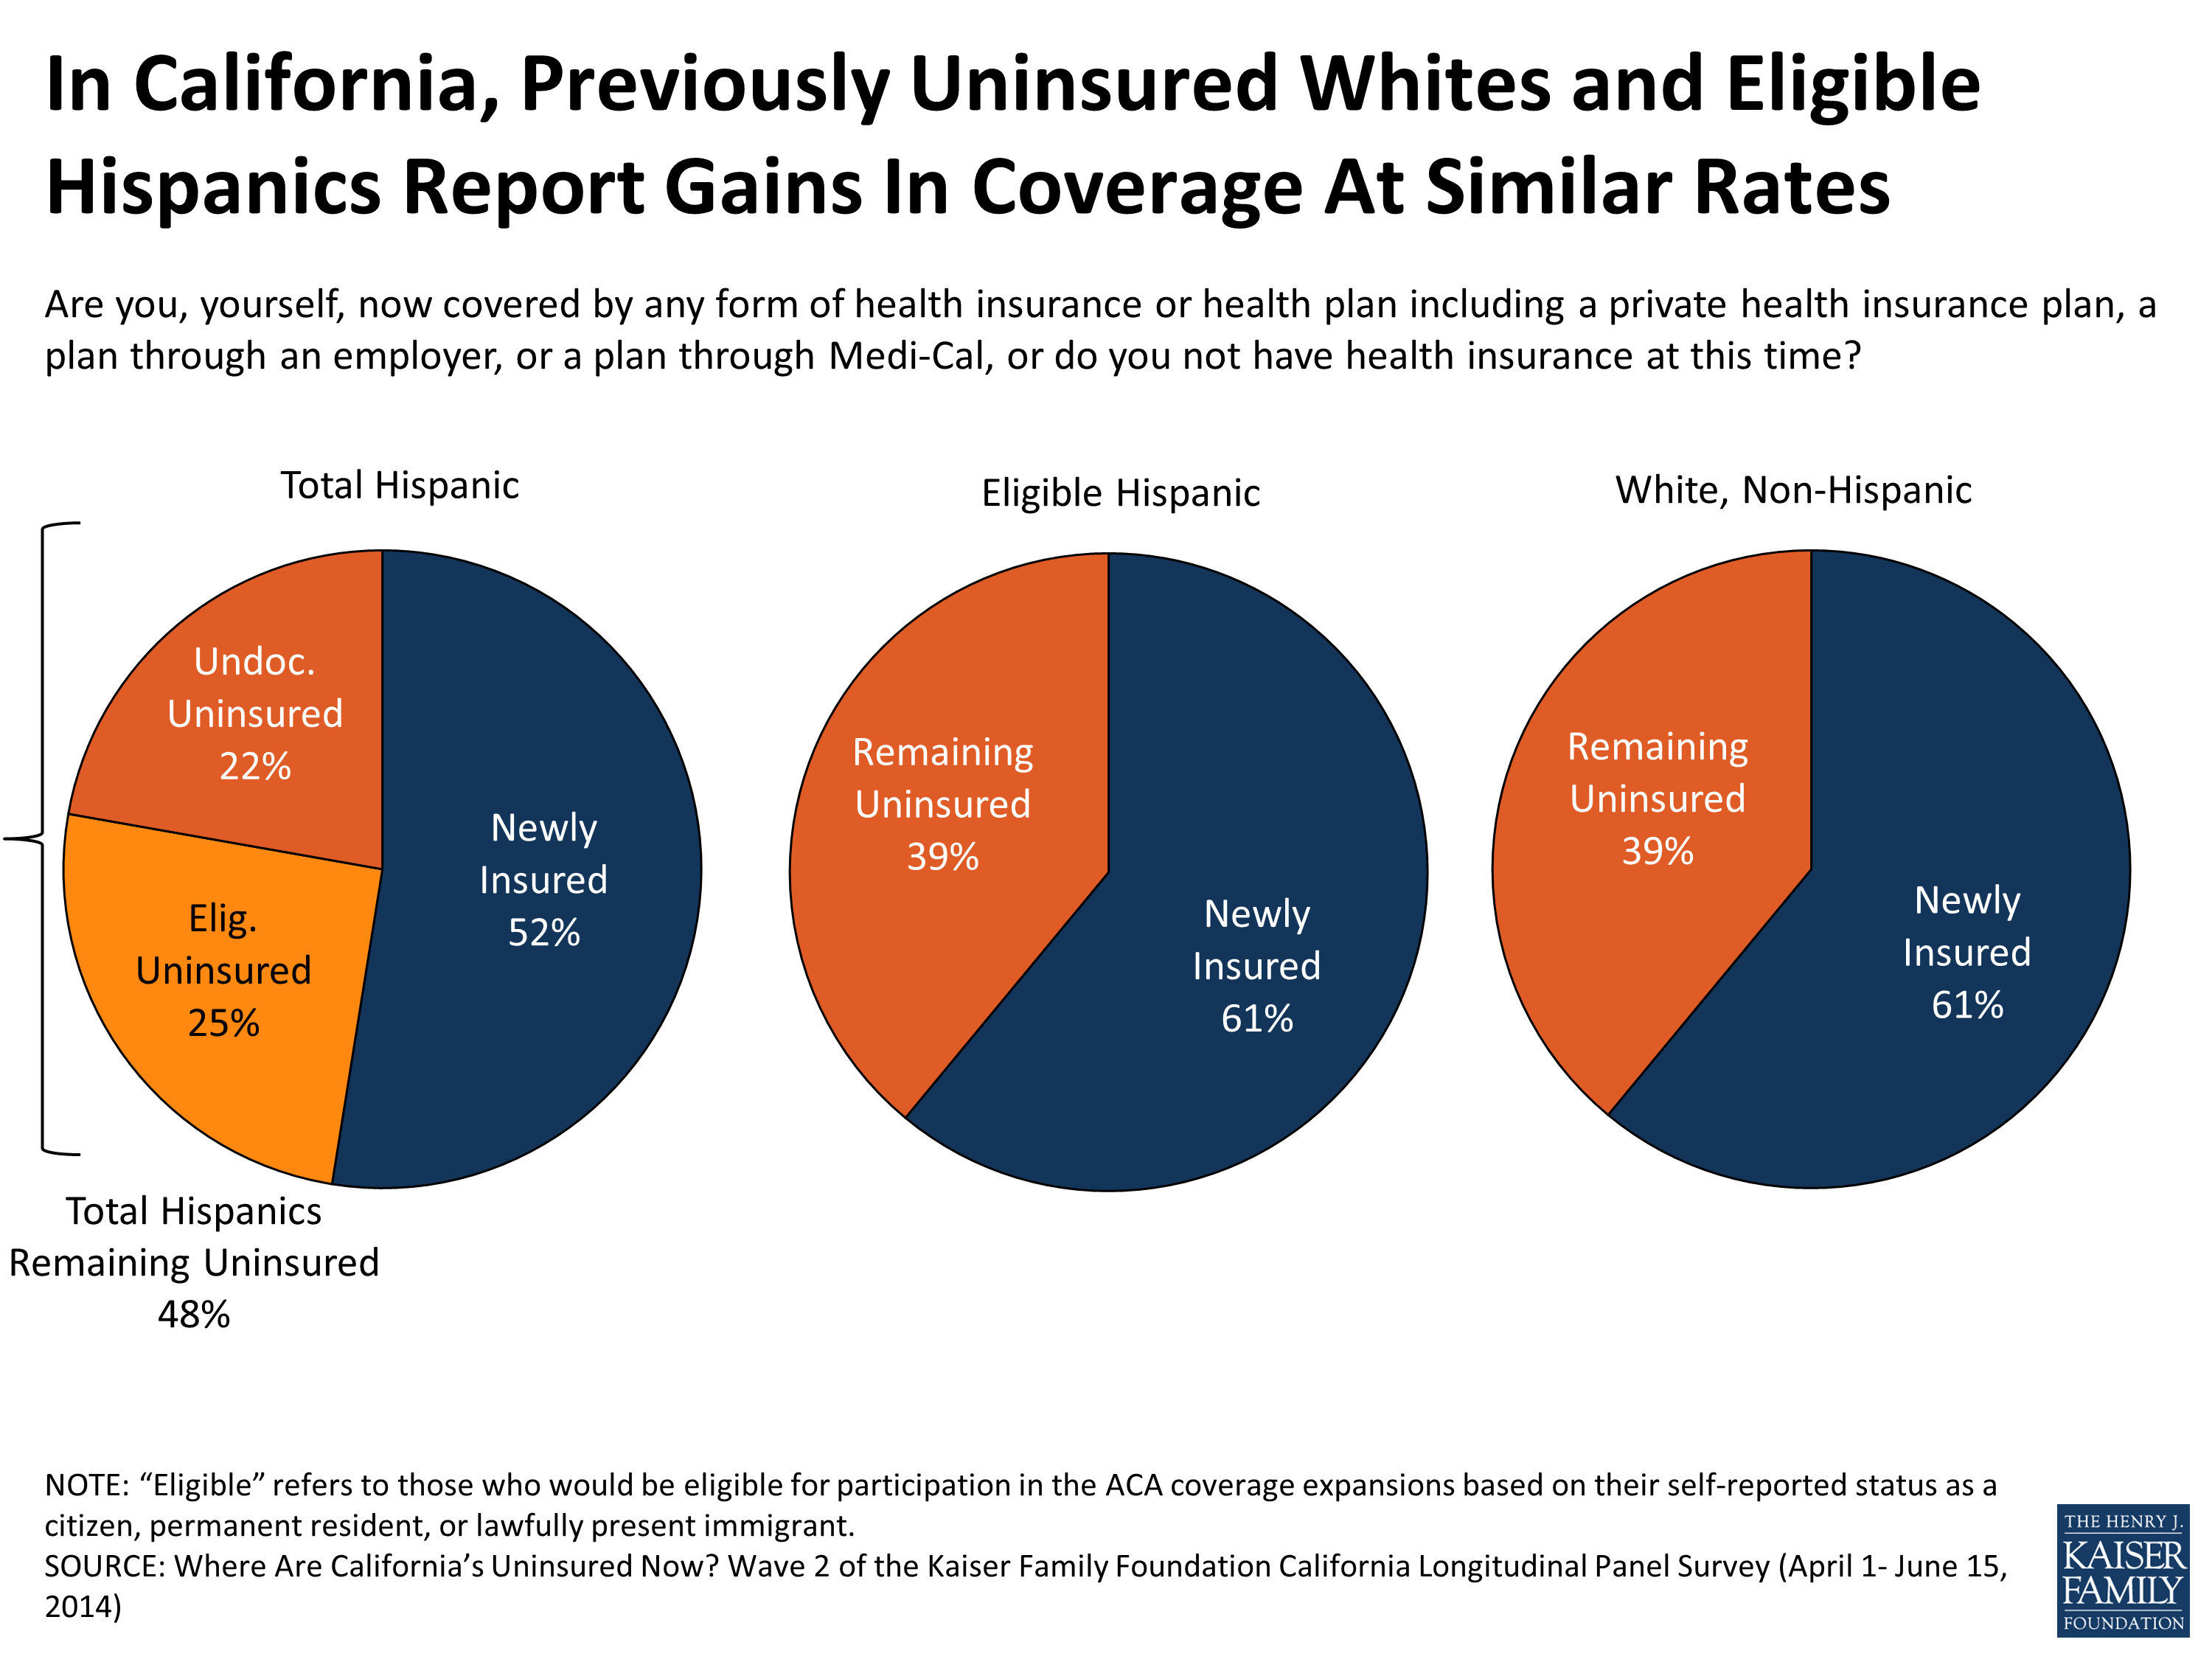
Figure 3
But for other characteristics, rates of coverage vary widely. For example, college graduates are more likely to have gained coverage than those with less education. In addition, those who report having a debilitating chronic disease, disability, or handicap are more likely than those without to say they now have coverage, with almost 8 in 10 reporting they obtained health insurance since last summer (Figure 4).2 Meanwhile, less than half of those who have spent their lifetime without insurance say they obtained coverage, a share that is 20 percentage points lower than those who say they have been insured at some point. Many in this group – 40 percent of those who say they have never had insurance – are undocumented immigrants who are ineligible for coverage through Medi-Cal or Covered California under the ACA. Still, it is notable that about 4 in 10 (43 percent) of previously uninsured Californians who report never having coverage before now report being insured. In addition, men were slightly less likely to report getting insurance than women (52 percent vs. 63 percent).
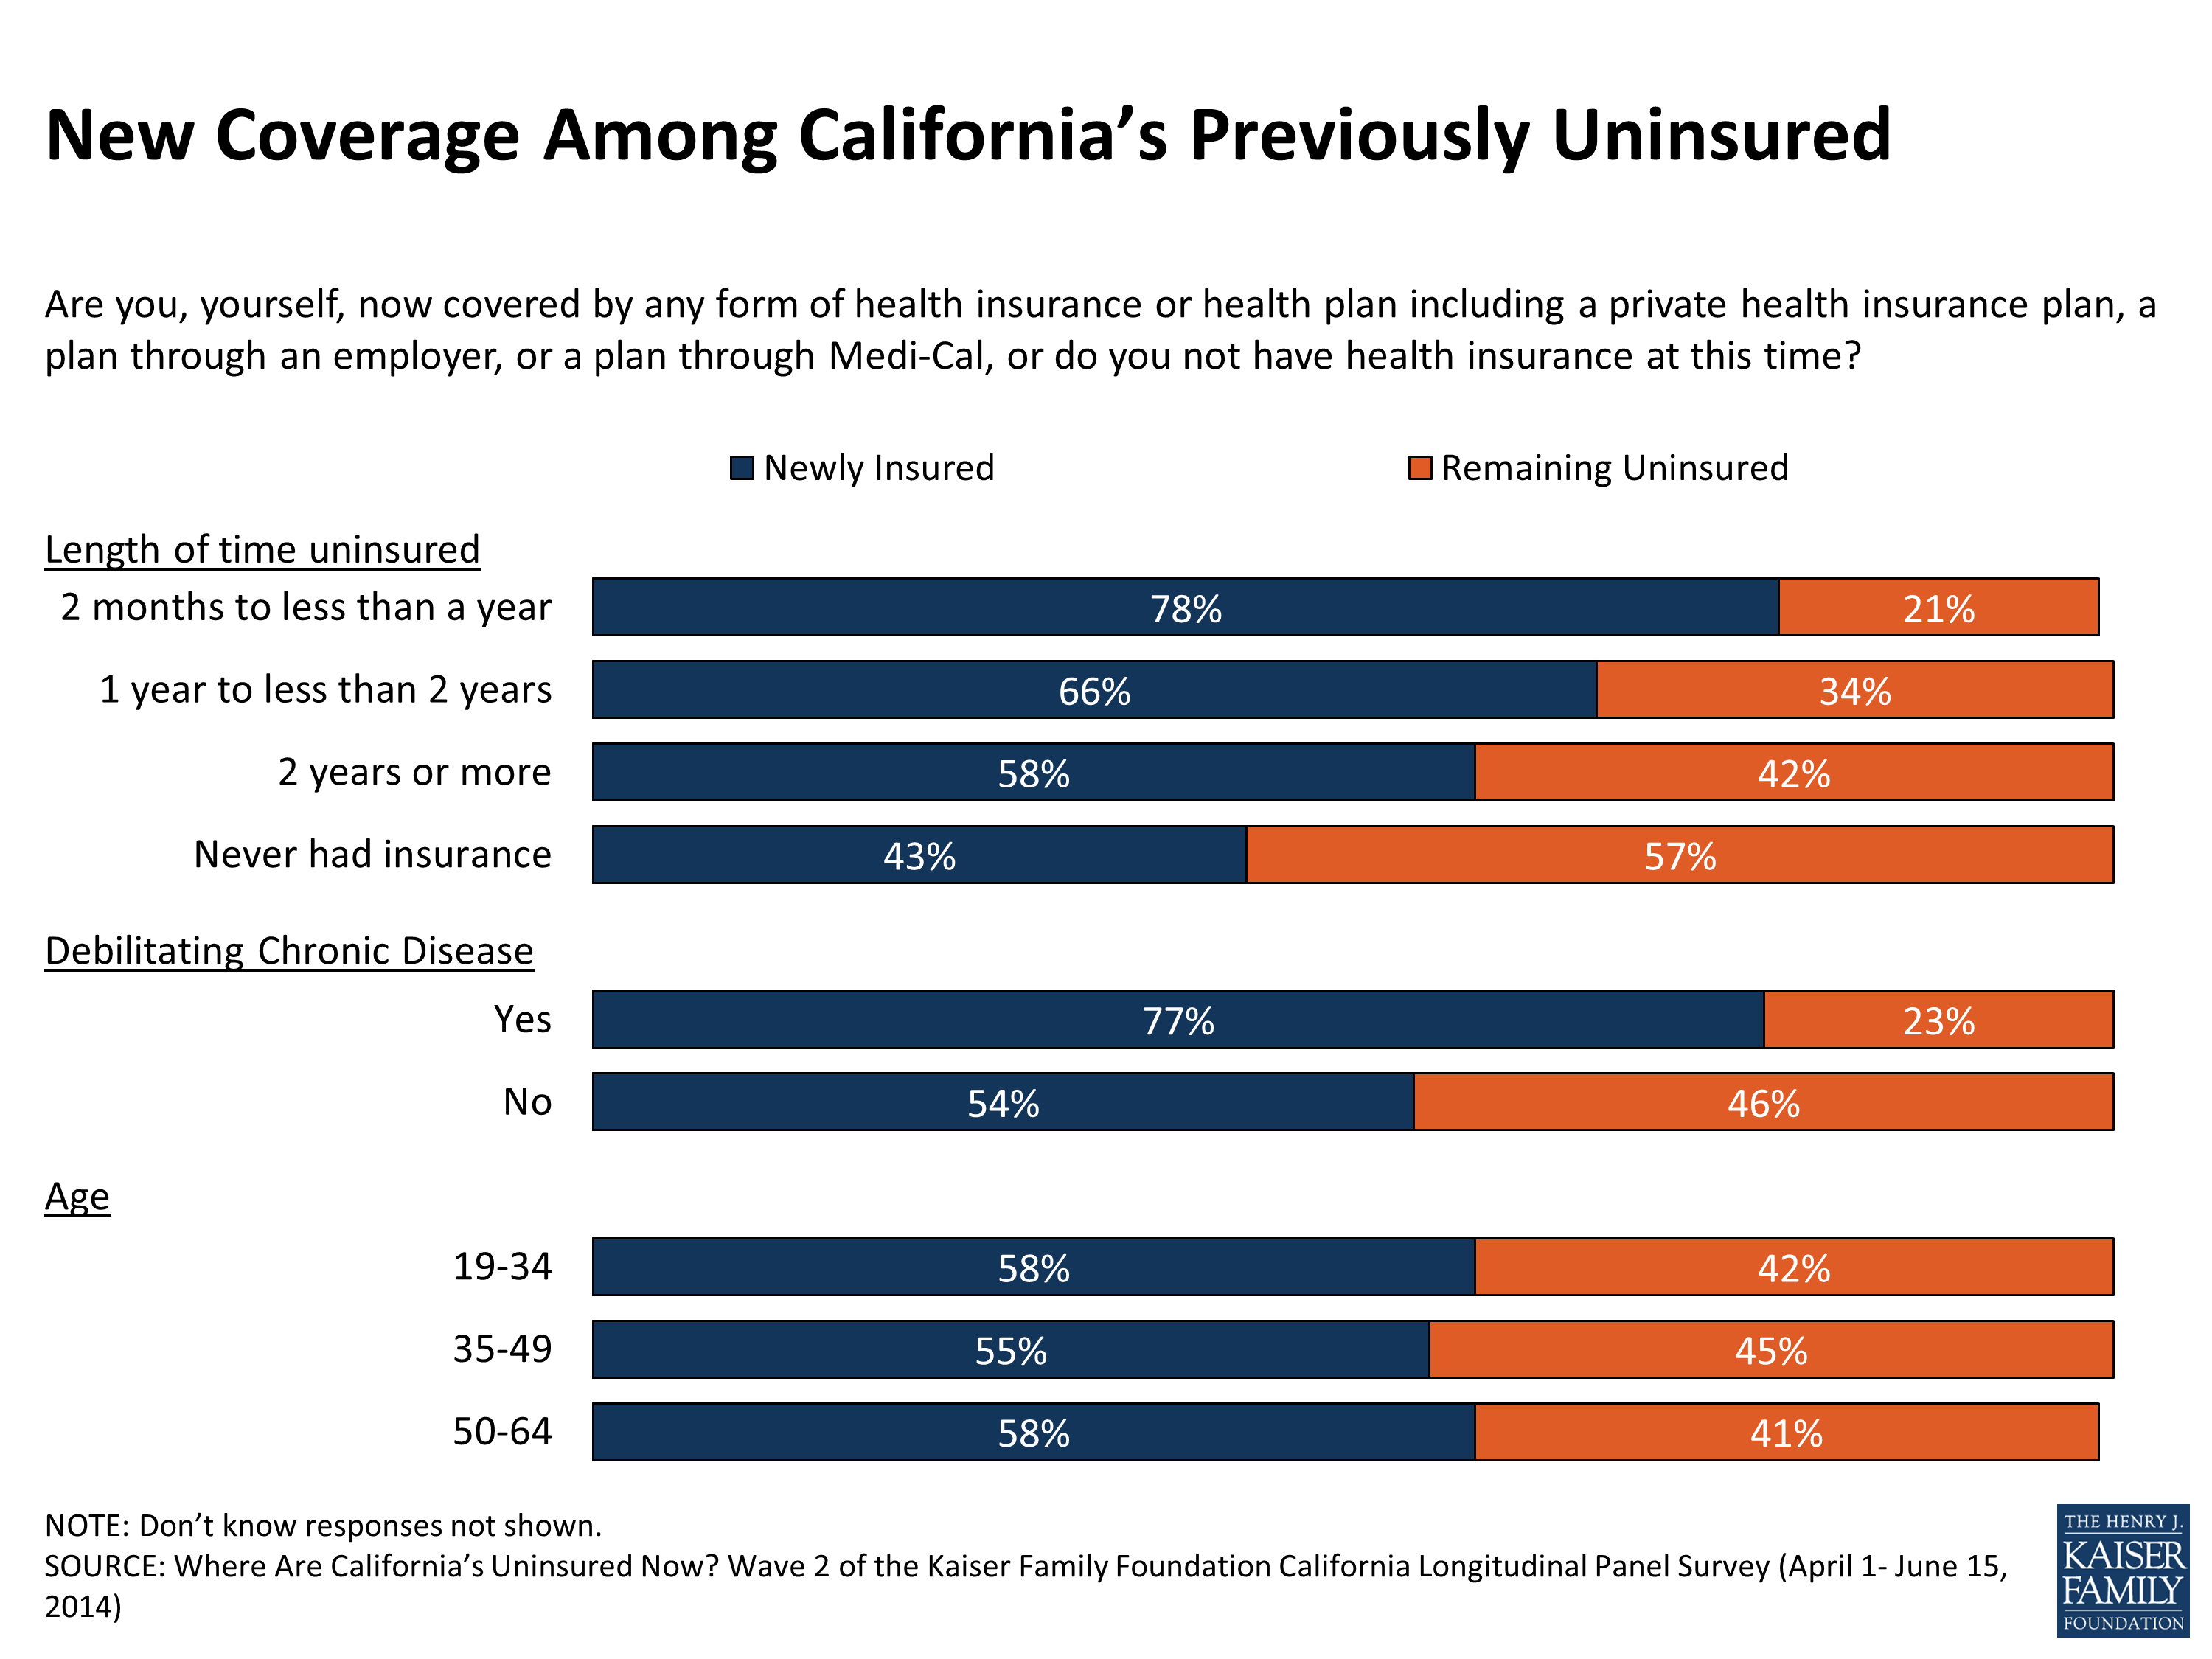
Figure 4
How much California’s uninsured knew about the law and what their view of it was before open enrollment are also factors that may contribute to some obtaining coverage. Those who were aware before open enrollment started of the requirement to obtain insurance, the Medi-Cal expansion, or the subsidies available to help people purchase insurance are somewhat more likely to say they now have insurance than those who were unaware of these key provisions (Figure 5). But, a similar share of those with favorable views of the law last summer report getting coverage as those who had unfavorable views (59 percent vs. 57 percent).
| Figure 5: Percentage Of Each Group Of Previously Uninsured Californians Reporting That They Are Now Insured Or Remain Uninsured | ||
| AWARENESS AND VIEWS OF LAW PRIOR TO OPEN ENROLLMENT | % Remaining Uninsured | % Newly Insured |
| AWARE OF REQUIREMENT TO PURCHASE INSURANCE | ||
| Yes | 38% | 62% |
| No/Don’t know | 48 | 52 |
| AWARE OF MEDI-CAL EXPANSION | ||
| Yes | 39 | 61 |
| No/Don’t know | 47 | 53 |
| AWARE OF FINANCIAL ASSISTANCE AVAILABLE | ||
| Yes | 38 | 62 |
| No/Don’t know | 46 | 54 |
| FAVORABILITY | ||
| Favorable: Very/Somewhat | 41 | 59 |
| Unfavorable: Very/Somewhat | 43 | 57 |
Outreach played a role in getting some people covered – 69 percent of California’s previously uninsured who said they were contacted about signing up for health insurance since October 1st say they obtained coverage, compared to 52 percent of those that say they weren’t contacted. On the other hand, those that say they were encouraged by a family or friend to sign up for coverage are no more likely to report being newly insured than those who didn’t report the same encouragement (58 percent and 55 percent) (Figure 6).
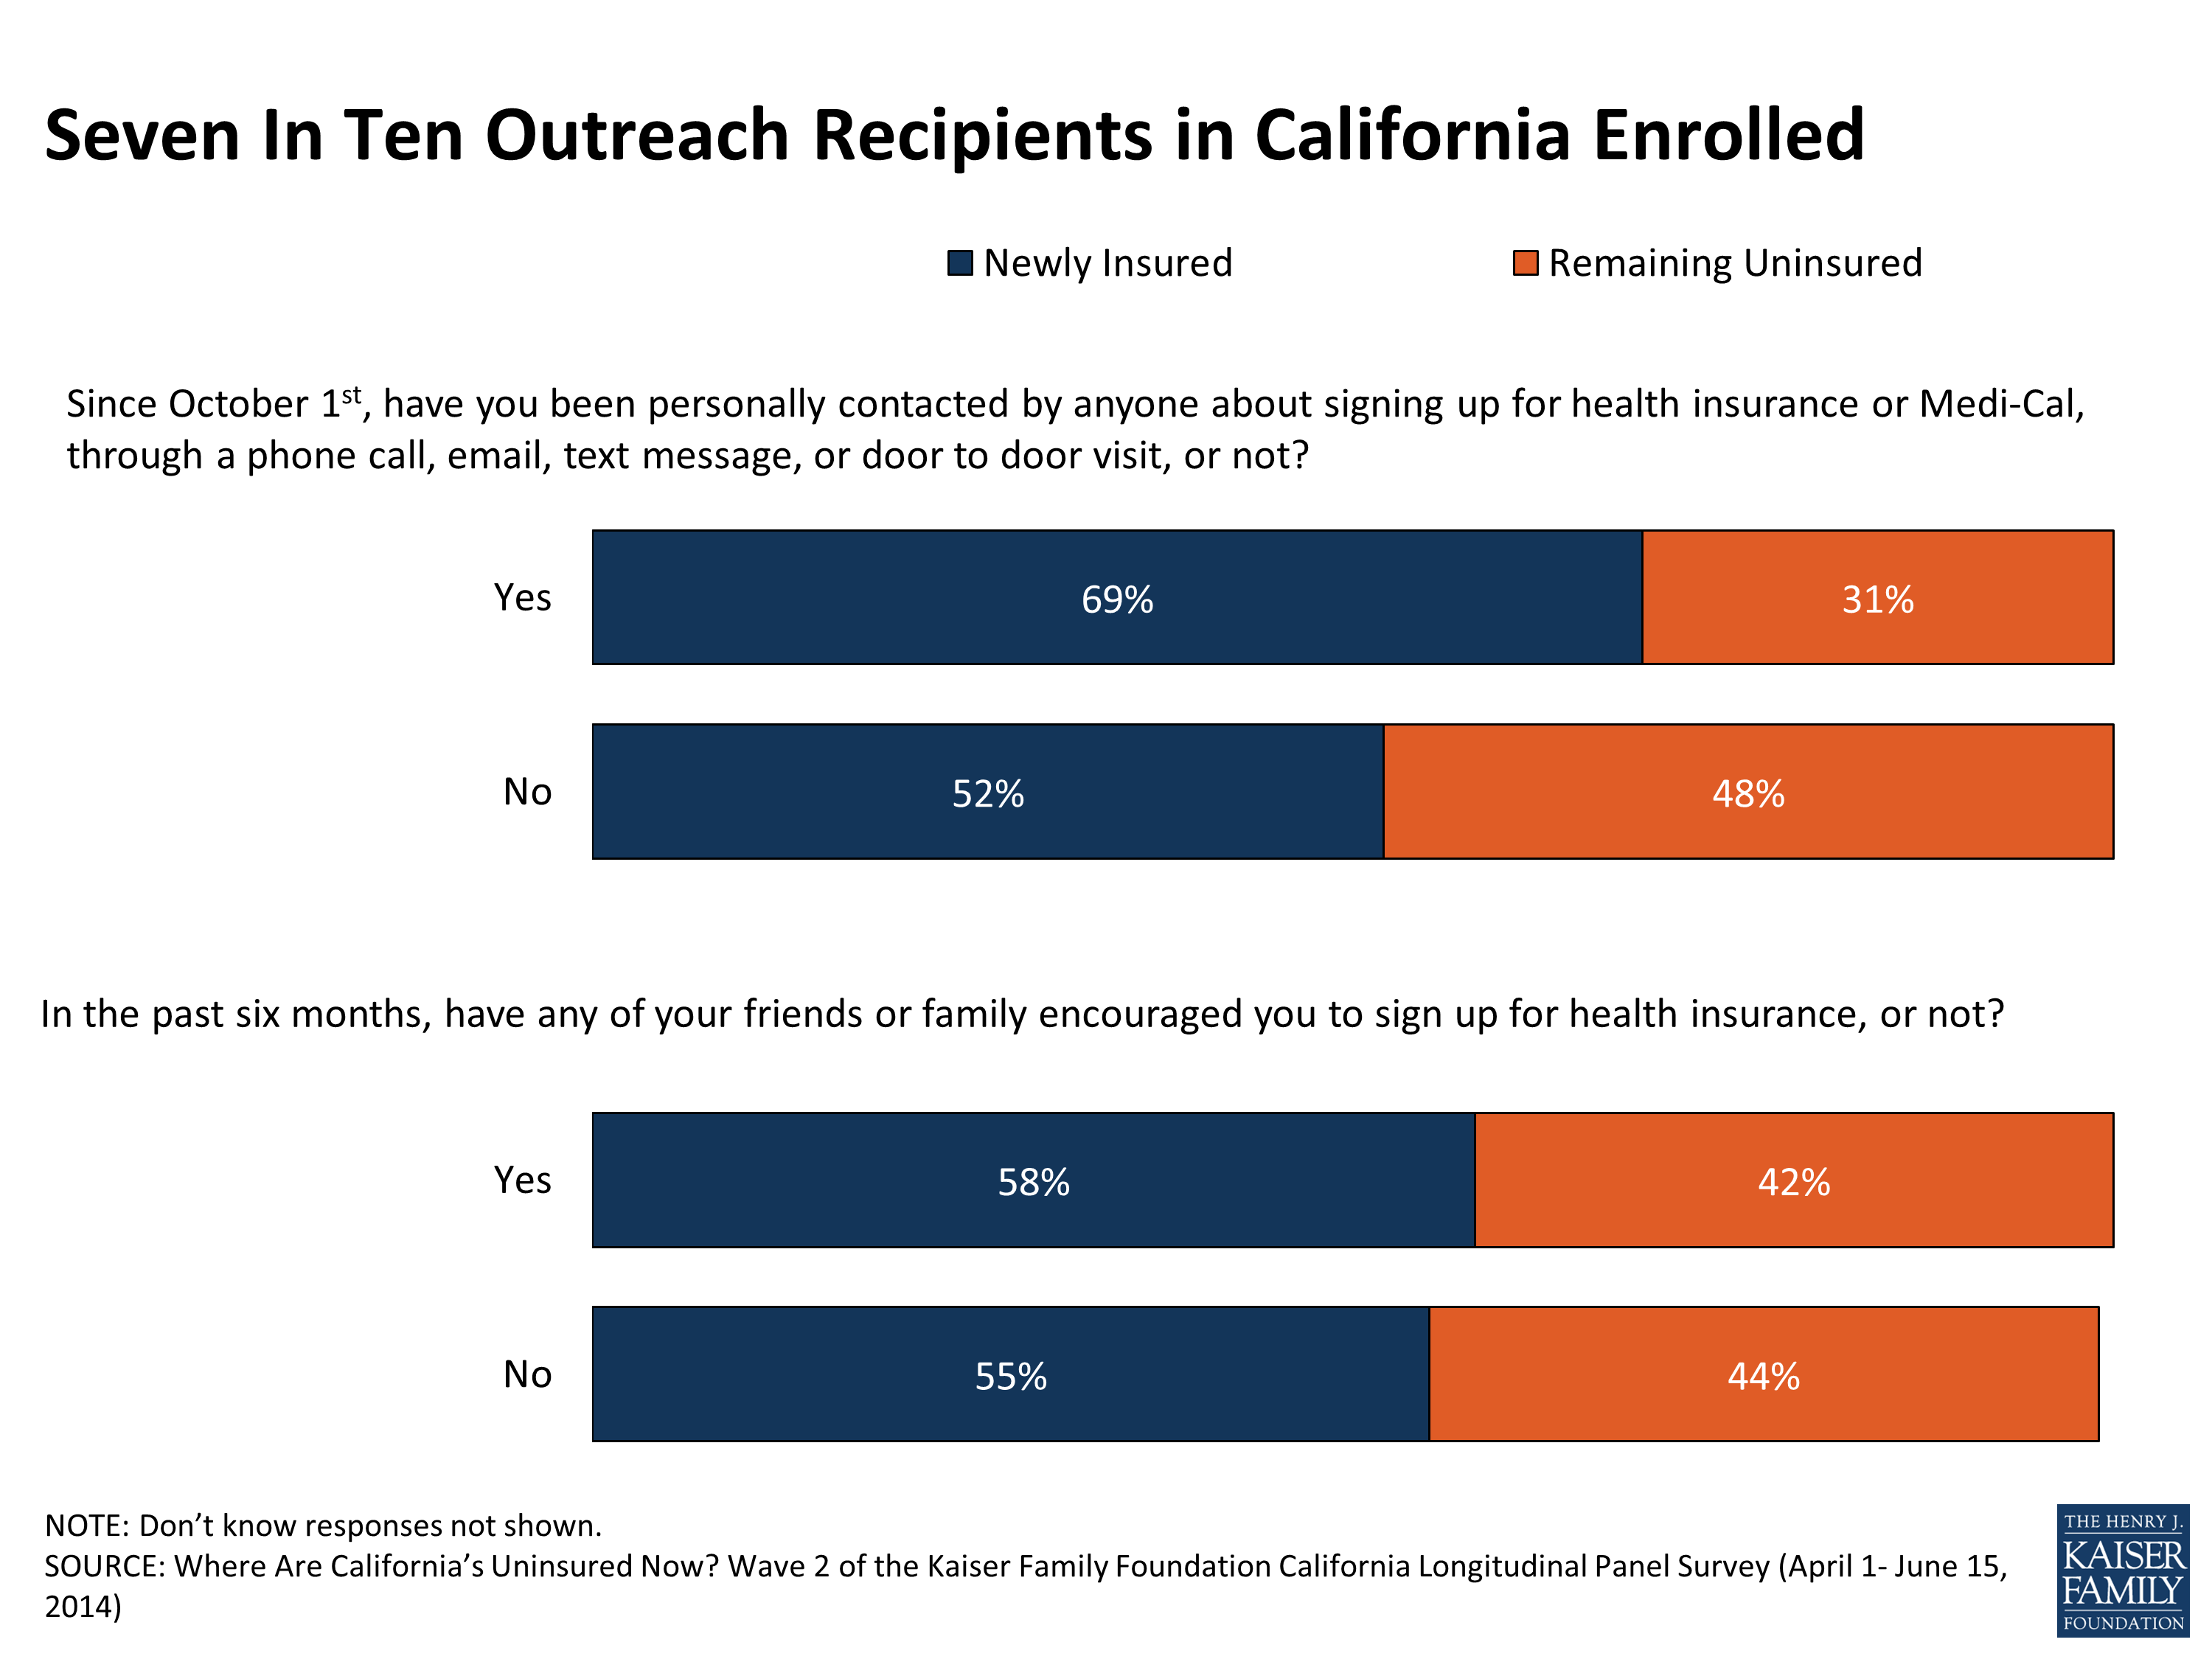
Figure 6
Many of these factors tend to overlap so to attempt to isolate the personal elements that best predict who was more likely to get insurance during this first open enrollment period, we conducted a regression analysis with demographic factors, relevant perceptions of the law, and outreach indicators. This analysis showed Californians who say they obtained insurance are more likely to report being married, having a debilitating chronic condition, having been uninsured for less than two years, and being contacted about getting coverage after controlling for a variety of demographic factors such as age, education, and income. On the other hand, the regression analysis also showed that Californians who reported remaining uninsured are more likely to be male, have never had insurance, or be undocumented immigrants. And, there are no differences by race/ethnicity after controlling for these demographics, particularly after controlling for immigration status and never having had coverage. Knowledge of key provisions or attitudes of the law going into open enrollment did not significantly predict enrollment after controlling for other characteristics.3
Section 2: The Newly Insured
What Type Of Coverage Did They Get?
With over half of California’s uninsured as of last summer reporting incomes that put them at or below 138 percent of the federal poverty level, it may not be surprising that Medi-Cal is the source of coverage for the largest share of the newly insured (44 percent, or 25 percent of all previously uninsured Californians) (Figure 7). After Medi-Cal, one in five newly insured (21 percent, or 12 percent overall) say they are now covered by a plan through an employer. Sixteen percent of the newly insured (9 percent overall) say they got insurance through Covered California and another 9 percent (5 percent overall) say they enrolled in non-group insurance outside of the Covered California Marketplace. Combining the enrollment in the two types of coverage most directly related to coverage expansions under the ACA, Medi-Cal and Covered California, 60 percent of the newly insured (or 34 percent of previously uninsured Californians overall) say they enrolled in coverage through these two ACA-related coverage options. Just over half of the newly insured (54 percent) say the coverage they got is just for themselves and doesn’t include any family members.
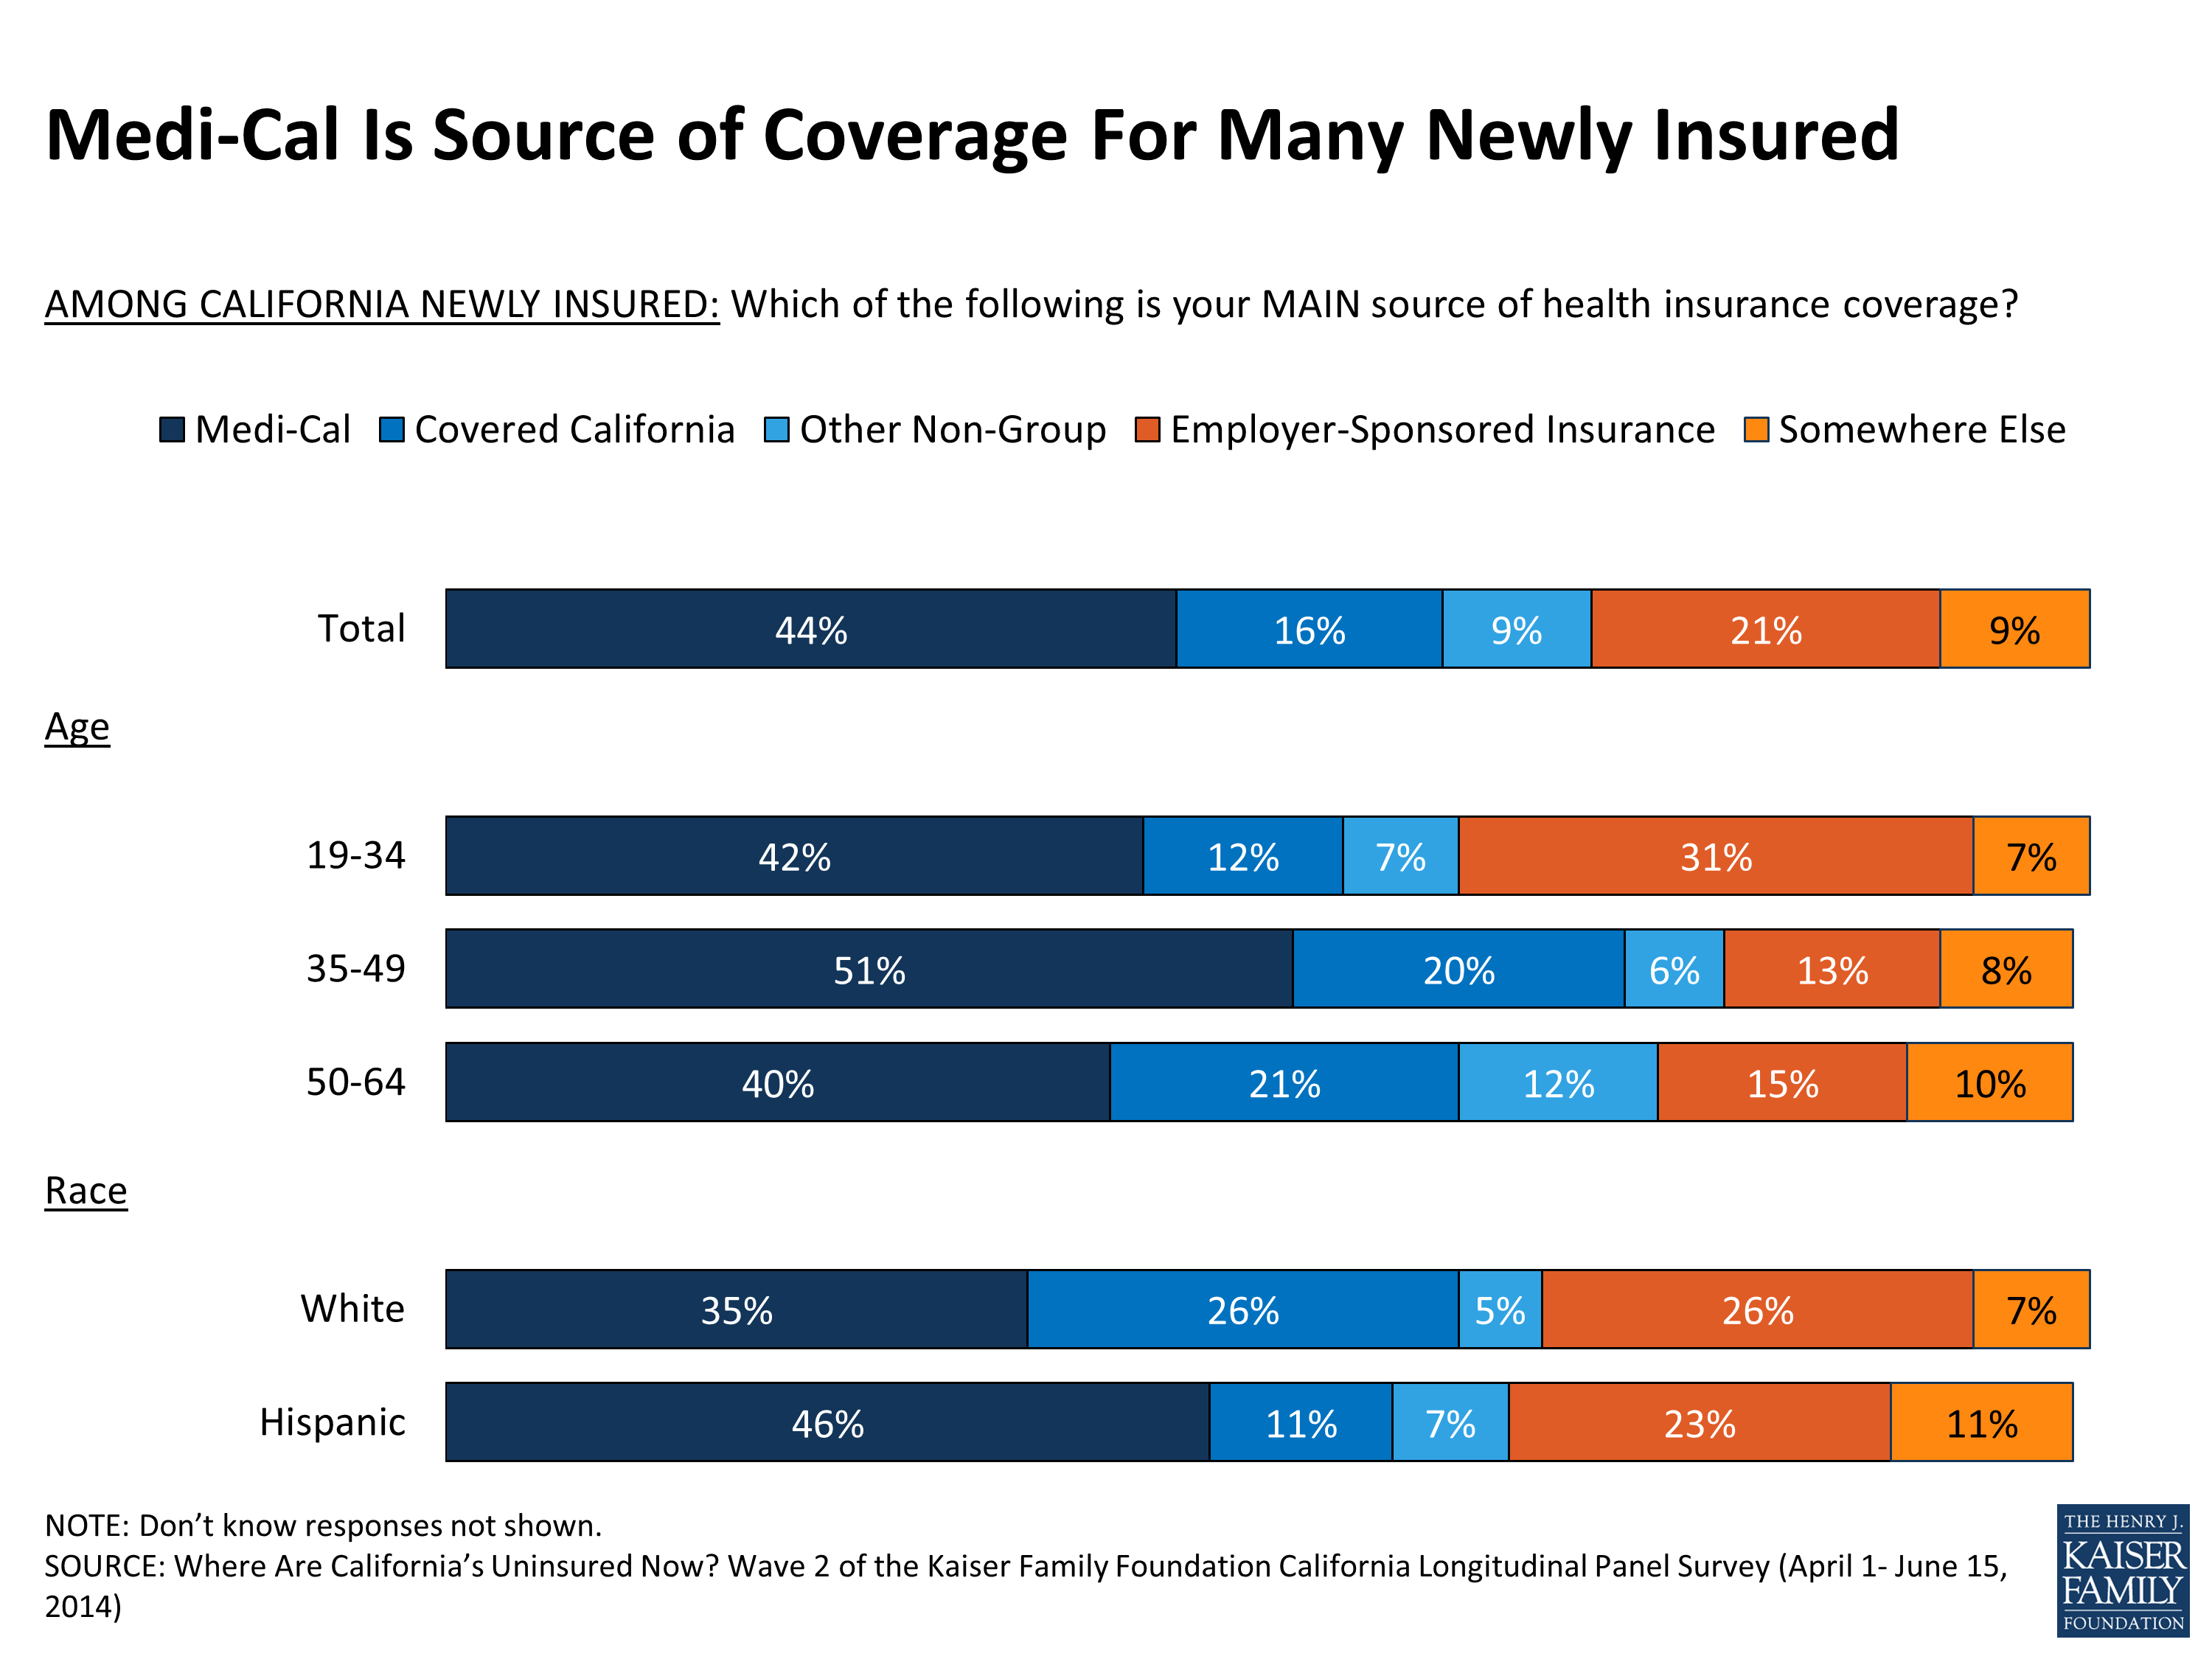
Figure 7
Types of New Coverage for Key Demographic Groups
Most newly insured Hispanics say they enrolled in Medi-Cal (46 percent) and they were less likely than whites to say they enrolled through Covered California (11 percent vs. 26 percent) (Figure 7). Young adults primarily report getting coverage through Medi-Cal or an employer (including a parent’s employer).
Fully 6 in 10 of the newly insured reporting they are in fair or poor health say they signed up for Medi-Cal, compared to 37 percent of those reporting they are in at least good health (37 percent) (Figure 8). This difference may be related in part to the availability of retroactive enrollment and the role community clinics, hospitals and other providers play in signing eligible people up for Medi-Cal when they come in for care. Those newly insured who have been uninsured for a shorter amount of time are more likely than those reporting longer periods without coverage to report enrolling in coverage through an employer. In contrast, about half of those who have been without health insurance for a year or more now say they have coverage through Medi-Cal. Not surprisingly, the employed are more likely to say they enrolled in coverage through an employer than those who are unemployed (32 percent vs. 8 percent). Newly insured women were more likely to report enrolling in Medi-Cal than newly insured men (50 percent vs. 38 percent), while about twice as many newly insured men enrolled in coverage through an employer than newly insured women (29 percent vs. 14 percent).
| Figure 8: Percentage Of Each Group Newly Insured By Coverage Type | |||||
| Medi-Cal | Covered California | Other non-group | Employer-Sponsored Insurance | Other Source of Coverage | |
| TOTAL | 44% | 16% | 9% | 21% | 9% |
| HEALTH STATUS | |||||
| Excellent/ Very good/ Good | 37 | 19 | 9 | 25 | 9 |
| Fair/ Poor | 60 | 10 | 6 | 13 | 9 |
| LENGTH OF TIME UNINSURED | |||||
| 2 months to less than a year | 26 | 24 | 2 | 39 | 6 |
| 1 year to less than 2 years | 50 | 8 | 10 | 18 | 12 |
| 2 years or more | 47 | 18 | 8 | 16 | 9 |
| Never had insurance | 46 | 13 | 13 | 21 | 7 |
| EMPLOYMENT | |||||
| Employed | 33 | 19 | 9 | 32 | 7 |
| Unemployed | 59 | 16 | 7 | 8 | 7 |
| A student, Retired, On disability and can’t work, or Stay at home parent | 56 | 11 | 8 | 9 | 14 |
| GENDER | |||||
| Male | 38 | 15 | 7 | 29 | 9 |
| Female | 50 | 18 | 10 | 14 | 8 |
| EDUCATION | |||||
| High school or less | 51 | 11 | 5 | 20 | 10 |
| Some college | 43 | 18 | 11 | 18 | 9 |
| College or more | 24 | 27 | 15 | 30 | 4 |
| DEBILITATING CHRONIC CONDITION | |||||
| Yes | 49 | 11 | 6 | 15 | 17 |
| No | 42 | 17 | 9 | 23 | 7 |
| Note: ‘Don’t know coverage type’ are not shown. | |||||
Accessing coverage through an employer
There are often changes in people’s health insurance status as they switch jobs or increase or decrease working hours. In the baseline panel survey last summer, over half (54 percent) of the previously uninsured who now say they have job-based insurance reported that their or their spouse’s employer offered insurance, but most said they did not participate in the plan because they were still in the waiting period for coverage (30 percent) or the amount they would have to pay is too much (19 percent). In addition, over a quarter (27 percent) of those who now have coverage through an employer report currently working full time after saying they were working part time or were unemployed in summer 2013. Many who now have job-based coverage anticipated enrolling. In the baseline survey, 7 in 10 said they expected to get insurance in 2014, including 3 in 10 who said they thought it would be through an employer. As a result, some newly insured through an employer may have come out of the waiting period since last summer or now work for an employer that offers insurance, while others may have been motivated by the ACA to take-up an employer’s offer of coverage.
Enrolling in Medi-Cal
Many newly covered by Medi-Cal are not new to the program. Forty-five percent of those newly insured by Medi-Cal said last summer that they have received coverage through the program before and an additional 16 percent say they had tried to enroll at some point. Nearly a quarter (23 percent) of previously uninsured Californians without dependent children say they enrolled in Medi-Cal. This is similar to the share of previously uninsured adults with dependent kids who say they enrolled in Medi-Cal (28 percent) and an indication that some who may not have been eligible for the program before are now covered.
Purchasing a plan through Covered California
And, for those who say they got a plan through Covered California, nearly half (46 percent) said last summer that they had tried to purchase non-group insurance before but most said they didn’t end up buying it because it was too expensive.
Why Did The Previously Uninsured Get Coverage?
When asked to name the reason why they got covered in their own words, the newly insured give a variety of answers (Figure 9). A fifth (21 percent) volunteer that they were motivated by the ACA and wanted to avoid the penalty for not having health insurance. A similar share (17 percent) say they got it because of issues with their health, 14 percent say they got it as a safeguard against emergencies and high medical bills, and 13 percent say they decided to get health insurance for more general health needs and preventive care. Seven percent say they were able to get it through an employer and a few others say they got it because insurance became available (4 percent) or they got it because they are eligible for Medi-Cal (3 percent).
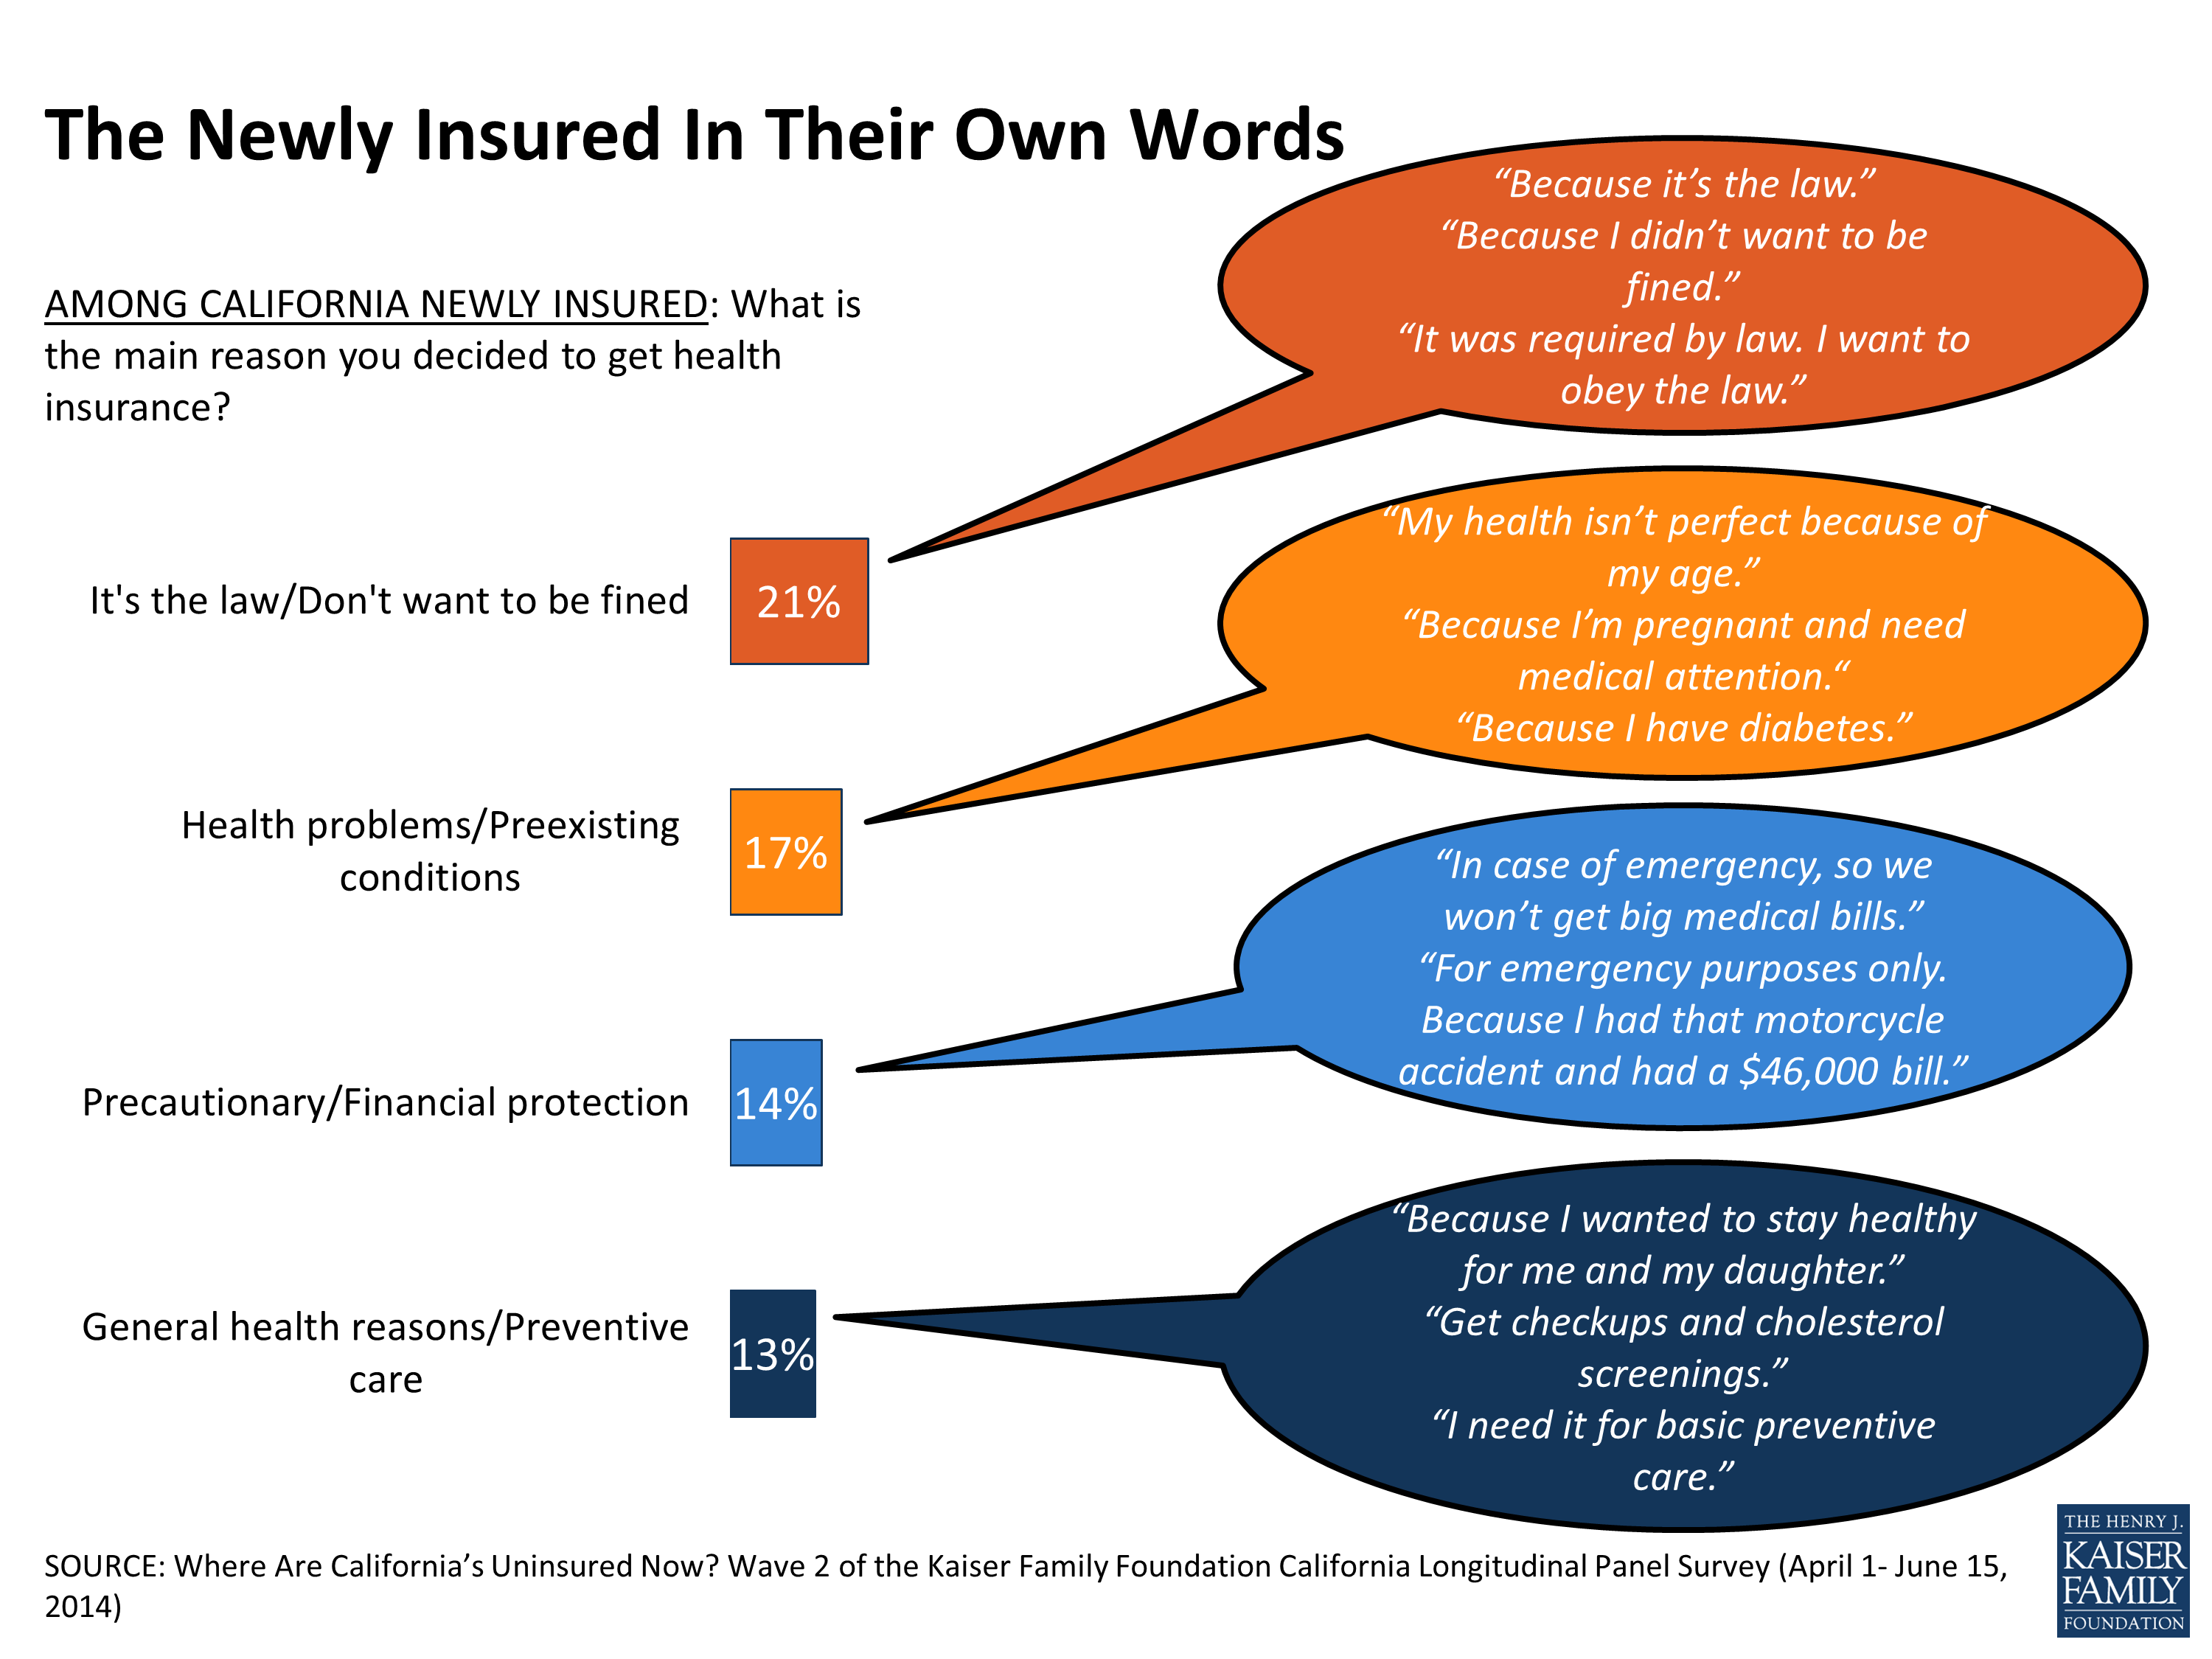
Figure 9
When asked more directly whether they got coverage because of the ACA or if they would have obtained it regardless of the law, 45 percent say they got insurance because of the law. Still, just over half of the newly insured (52 percent) don’t directly attribute their new coverage to the ACA and say it’s something they would have done anyway. The development of the Covered California Health Insurance Marketplace and the changes to the non-group market under the ACA were designed to make coverage more accessible and affordable. The majority (64 percent) of those with coverage through Covered California say the law is the reason they got insurance, while 7 in 10 (72 percent) newly insured with employer-sponsored coverage say they would have gotten it anyway. People with Medi-Cal are split with 48 percent saying they got it because of the law and 50 percent saying they would have enrolled regardless (Figure 10). It is important to note that these are people’s perceptions – some of the newly insured would likely have been ineligible for Medi-Cal or unable to purchase coverage without the ACA expansions. As noted earlier, gauging by the types of coverage the newly insured report enrolling in, 60 percent of the newly insured (34 percent of California’s previously uninsured overall) are now more likely covered as a result of the ACA coverage expansions through Medi-Cal and Covered California.
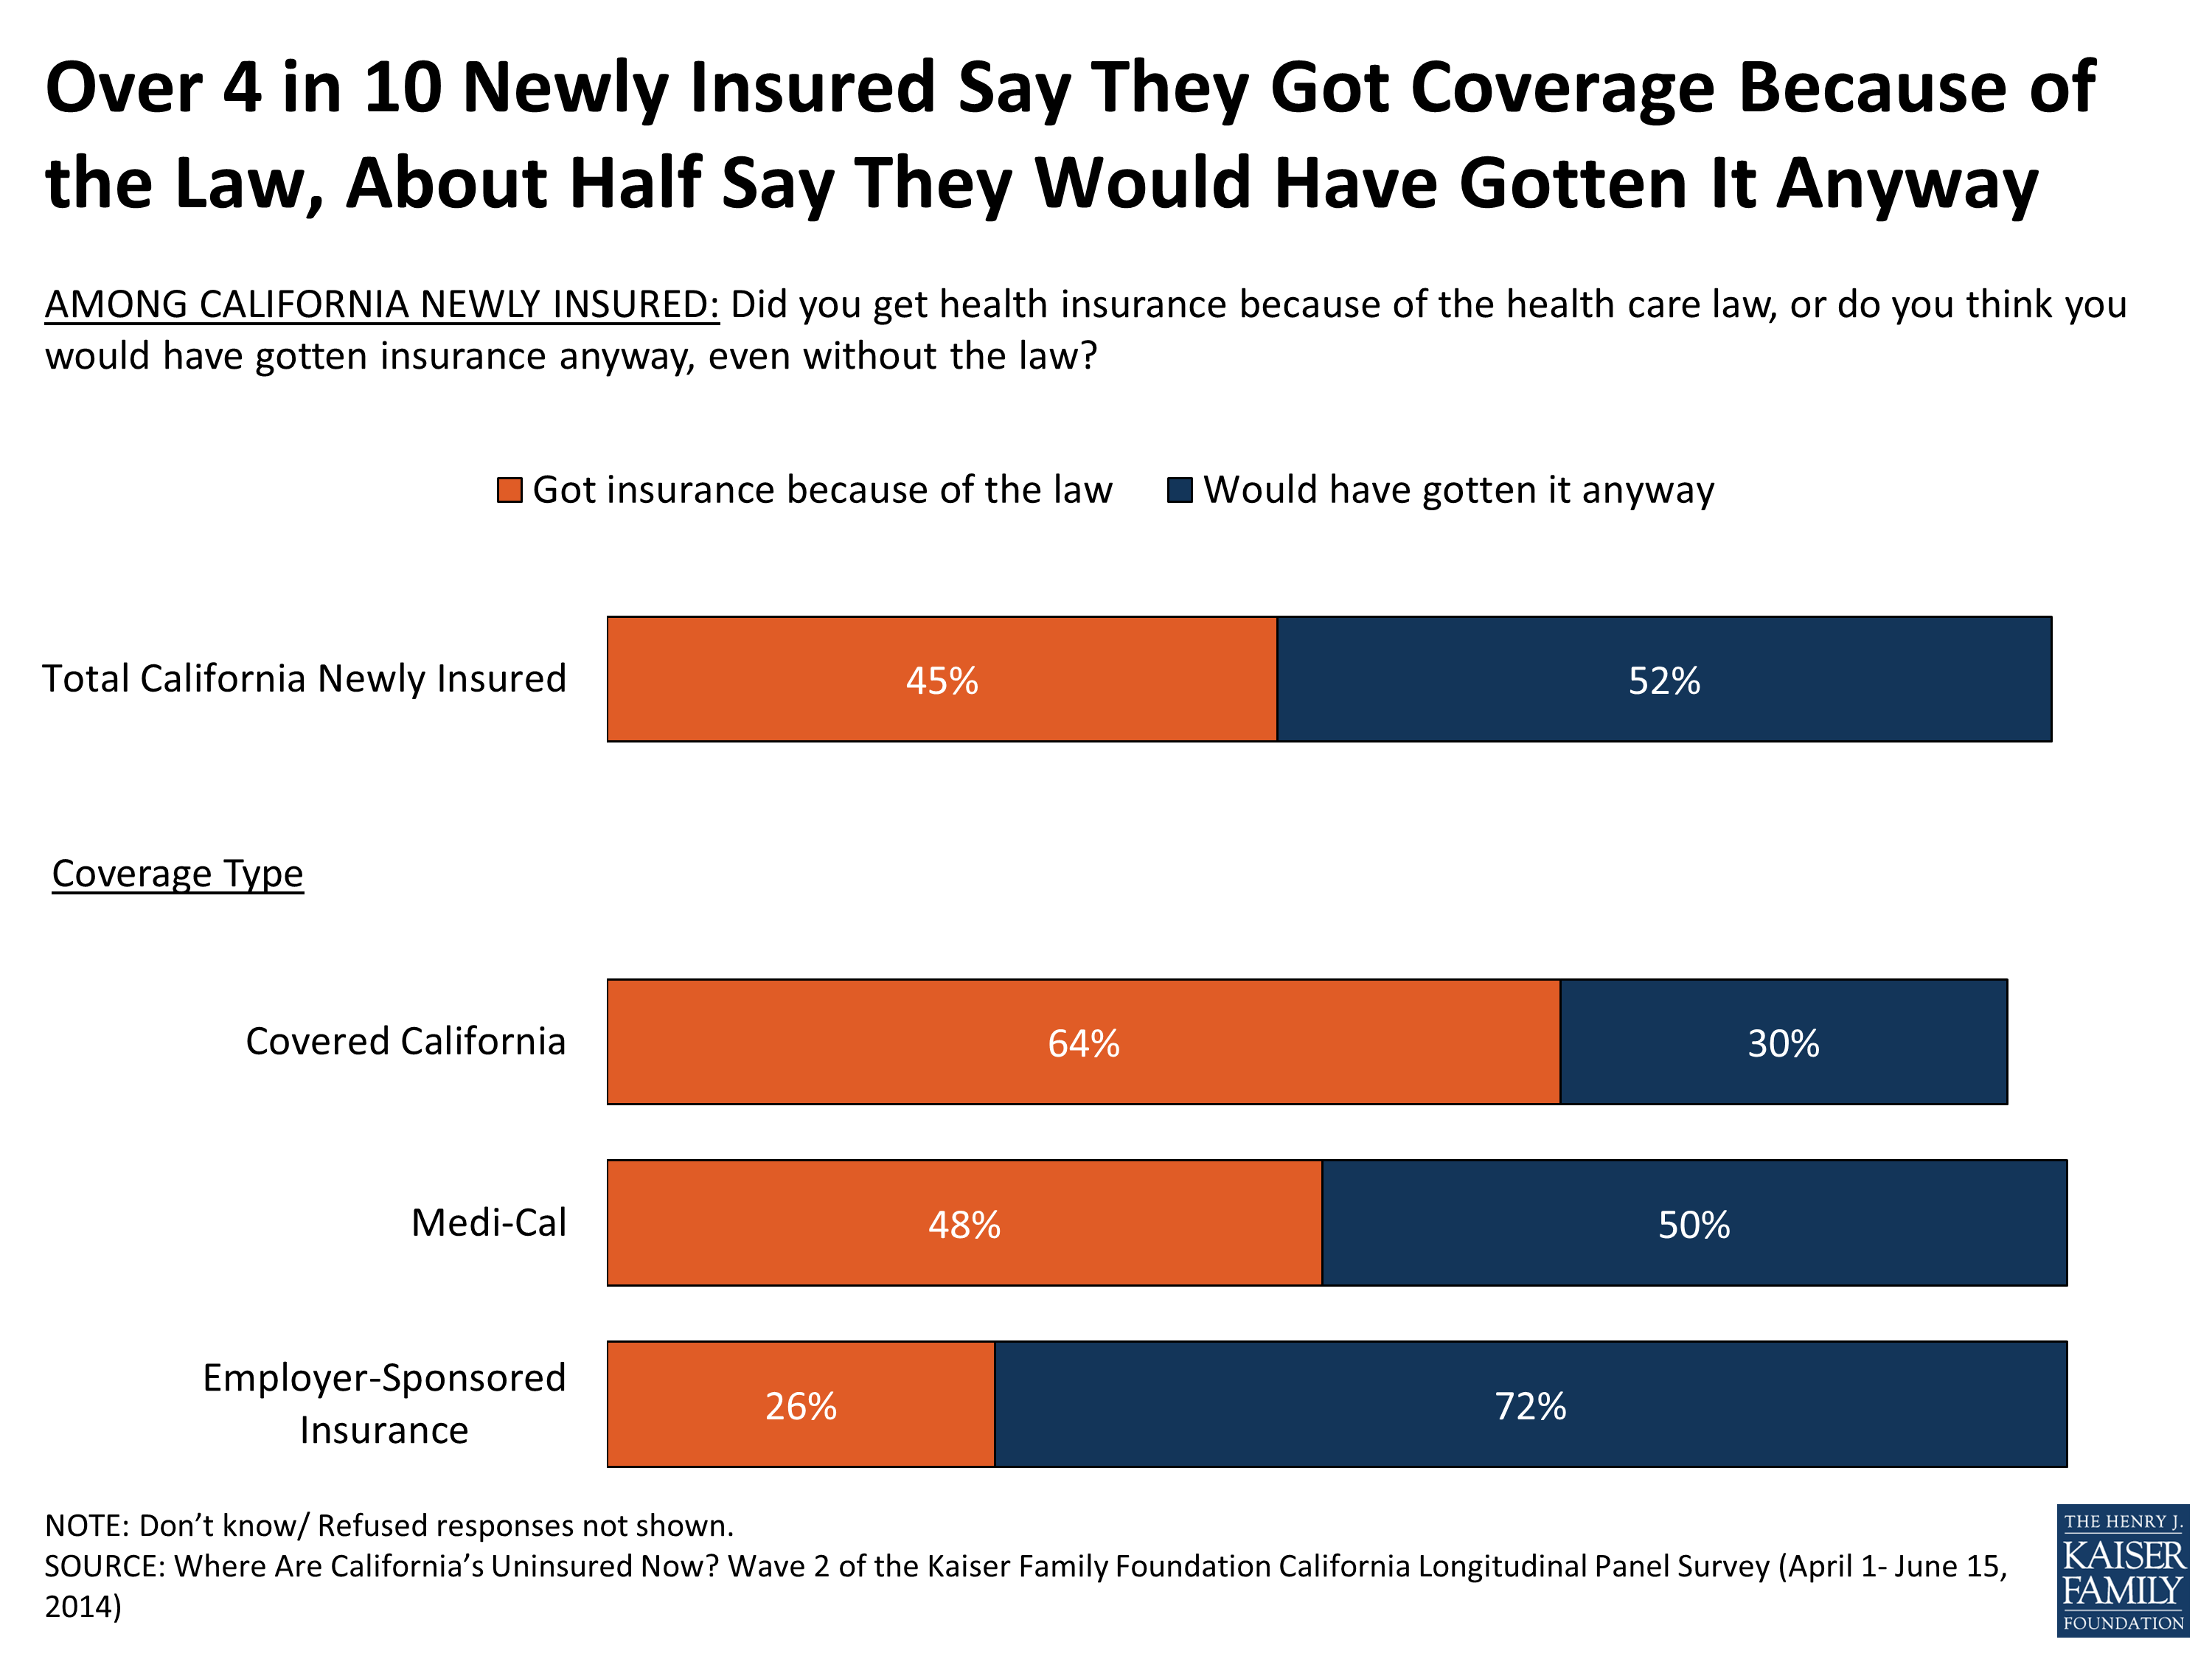
Figure 10
Do They Think Coverage Is Affordable, Making Them Financially Secure?
The uninsured are a group that typically report being under considerable financial strain, and in the baseline survey last summer over half said they felt financially insecure, and the vast majority expressed concern about being able to pay their rent or mortgage or keep up with rising costs. Confronted with tight budgets and little disposable income, affording health insurance still seems to be a stretch for many. Nearly half (46 percent) of those newly insured by coverage other than Medi-Cal say paying for coverage every month is at least somewhat difficult (Figure 11). Those with insurance through Covered California are split in their reports of how difficult it is to pay their monthly premium with 51 percent saying it is at least somewhat difficult and 48 percent saying it is not difficult. Most of those with job-related coverage (whose employers are likely paying for at least some of the cost) say it is not too or not at all difficult for them to pay the monthly cost of coverage. While affording these costs may be challenging, nearly three quarters say their plan is a good value for the amount they pay (Figure 12).
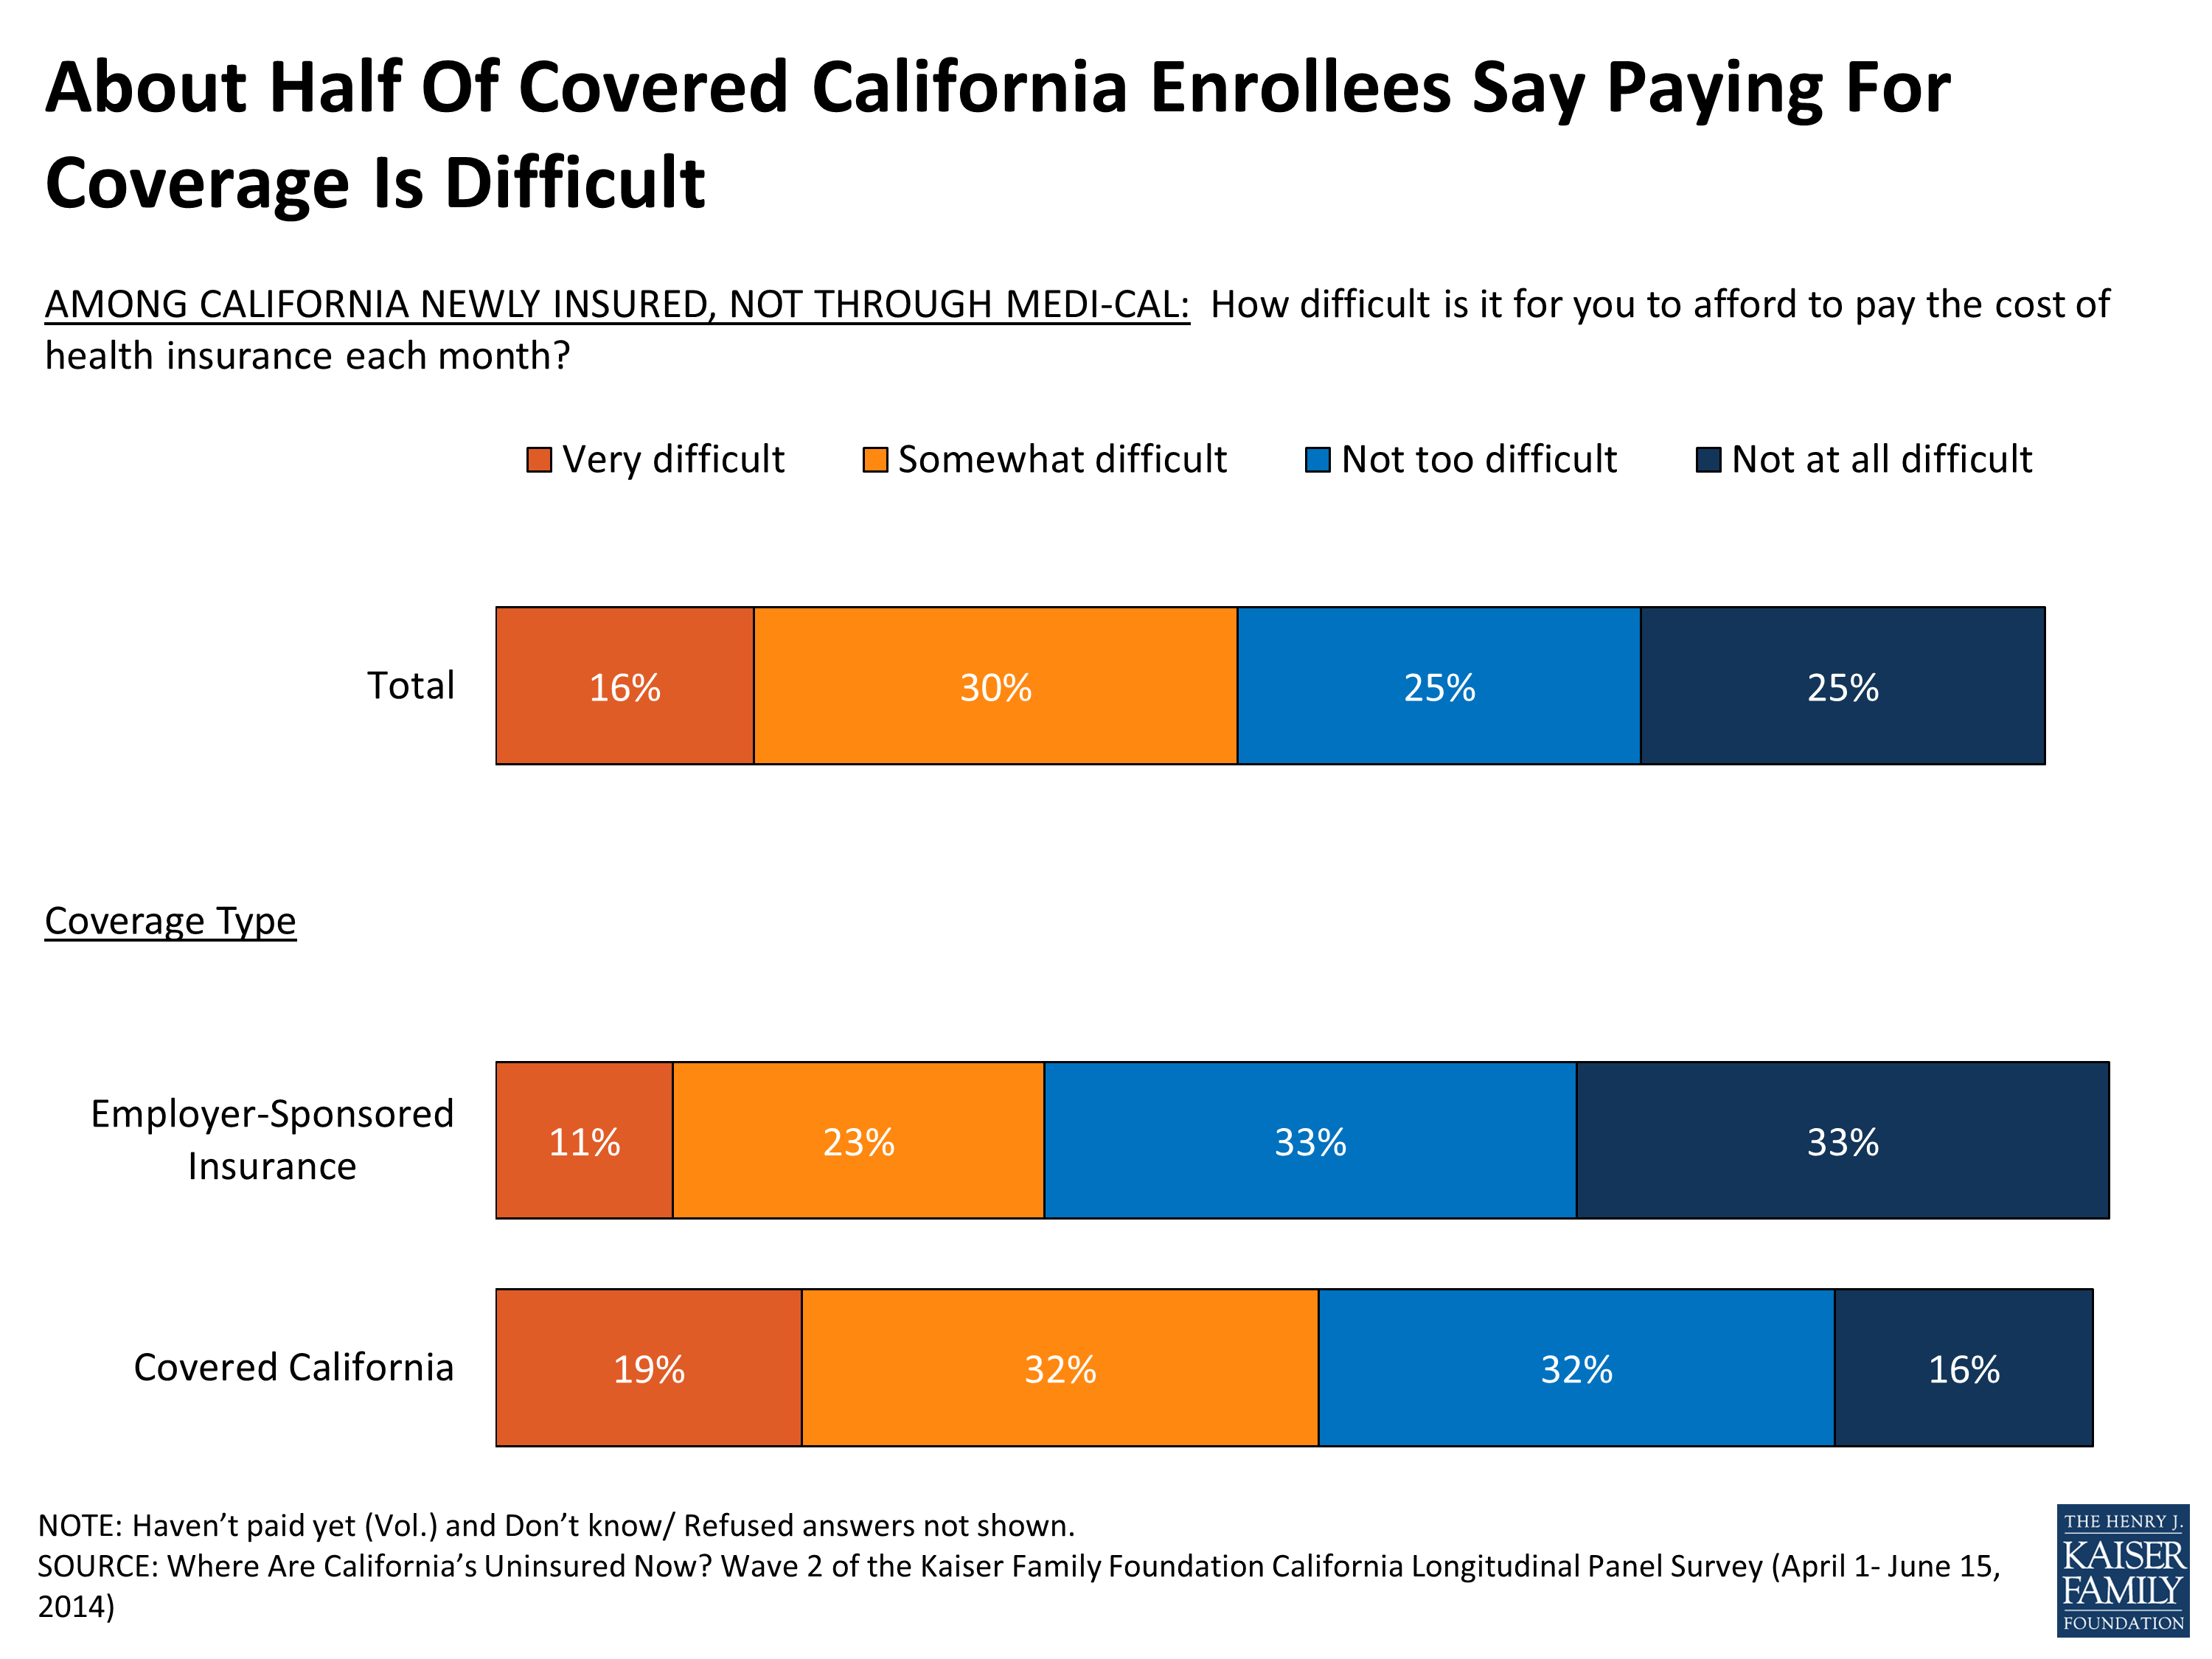
Figure 11
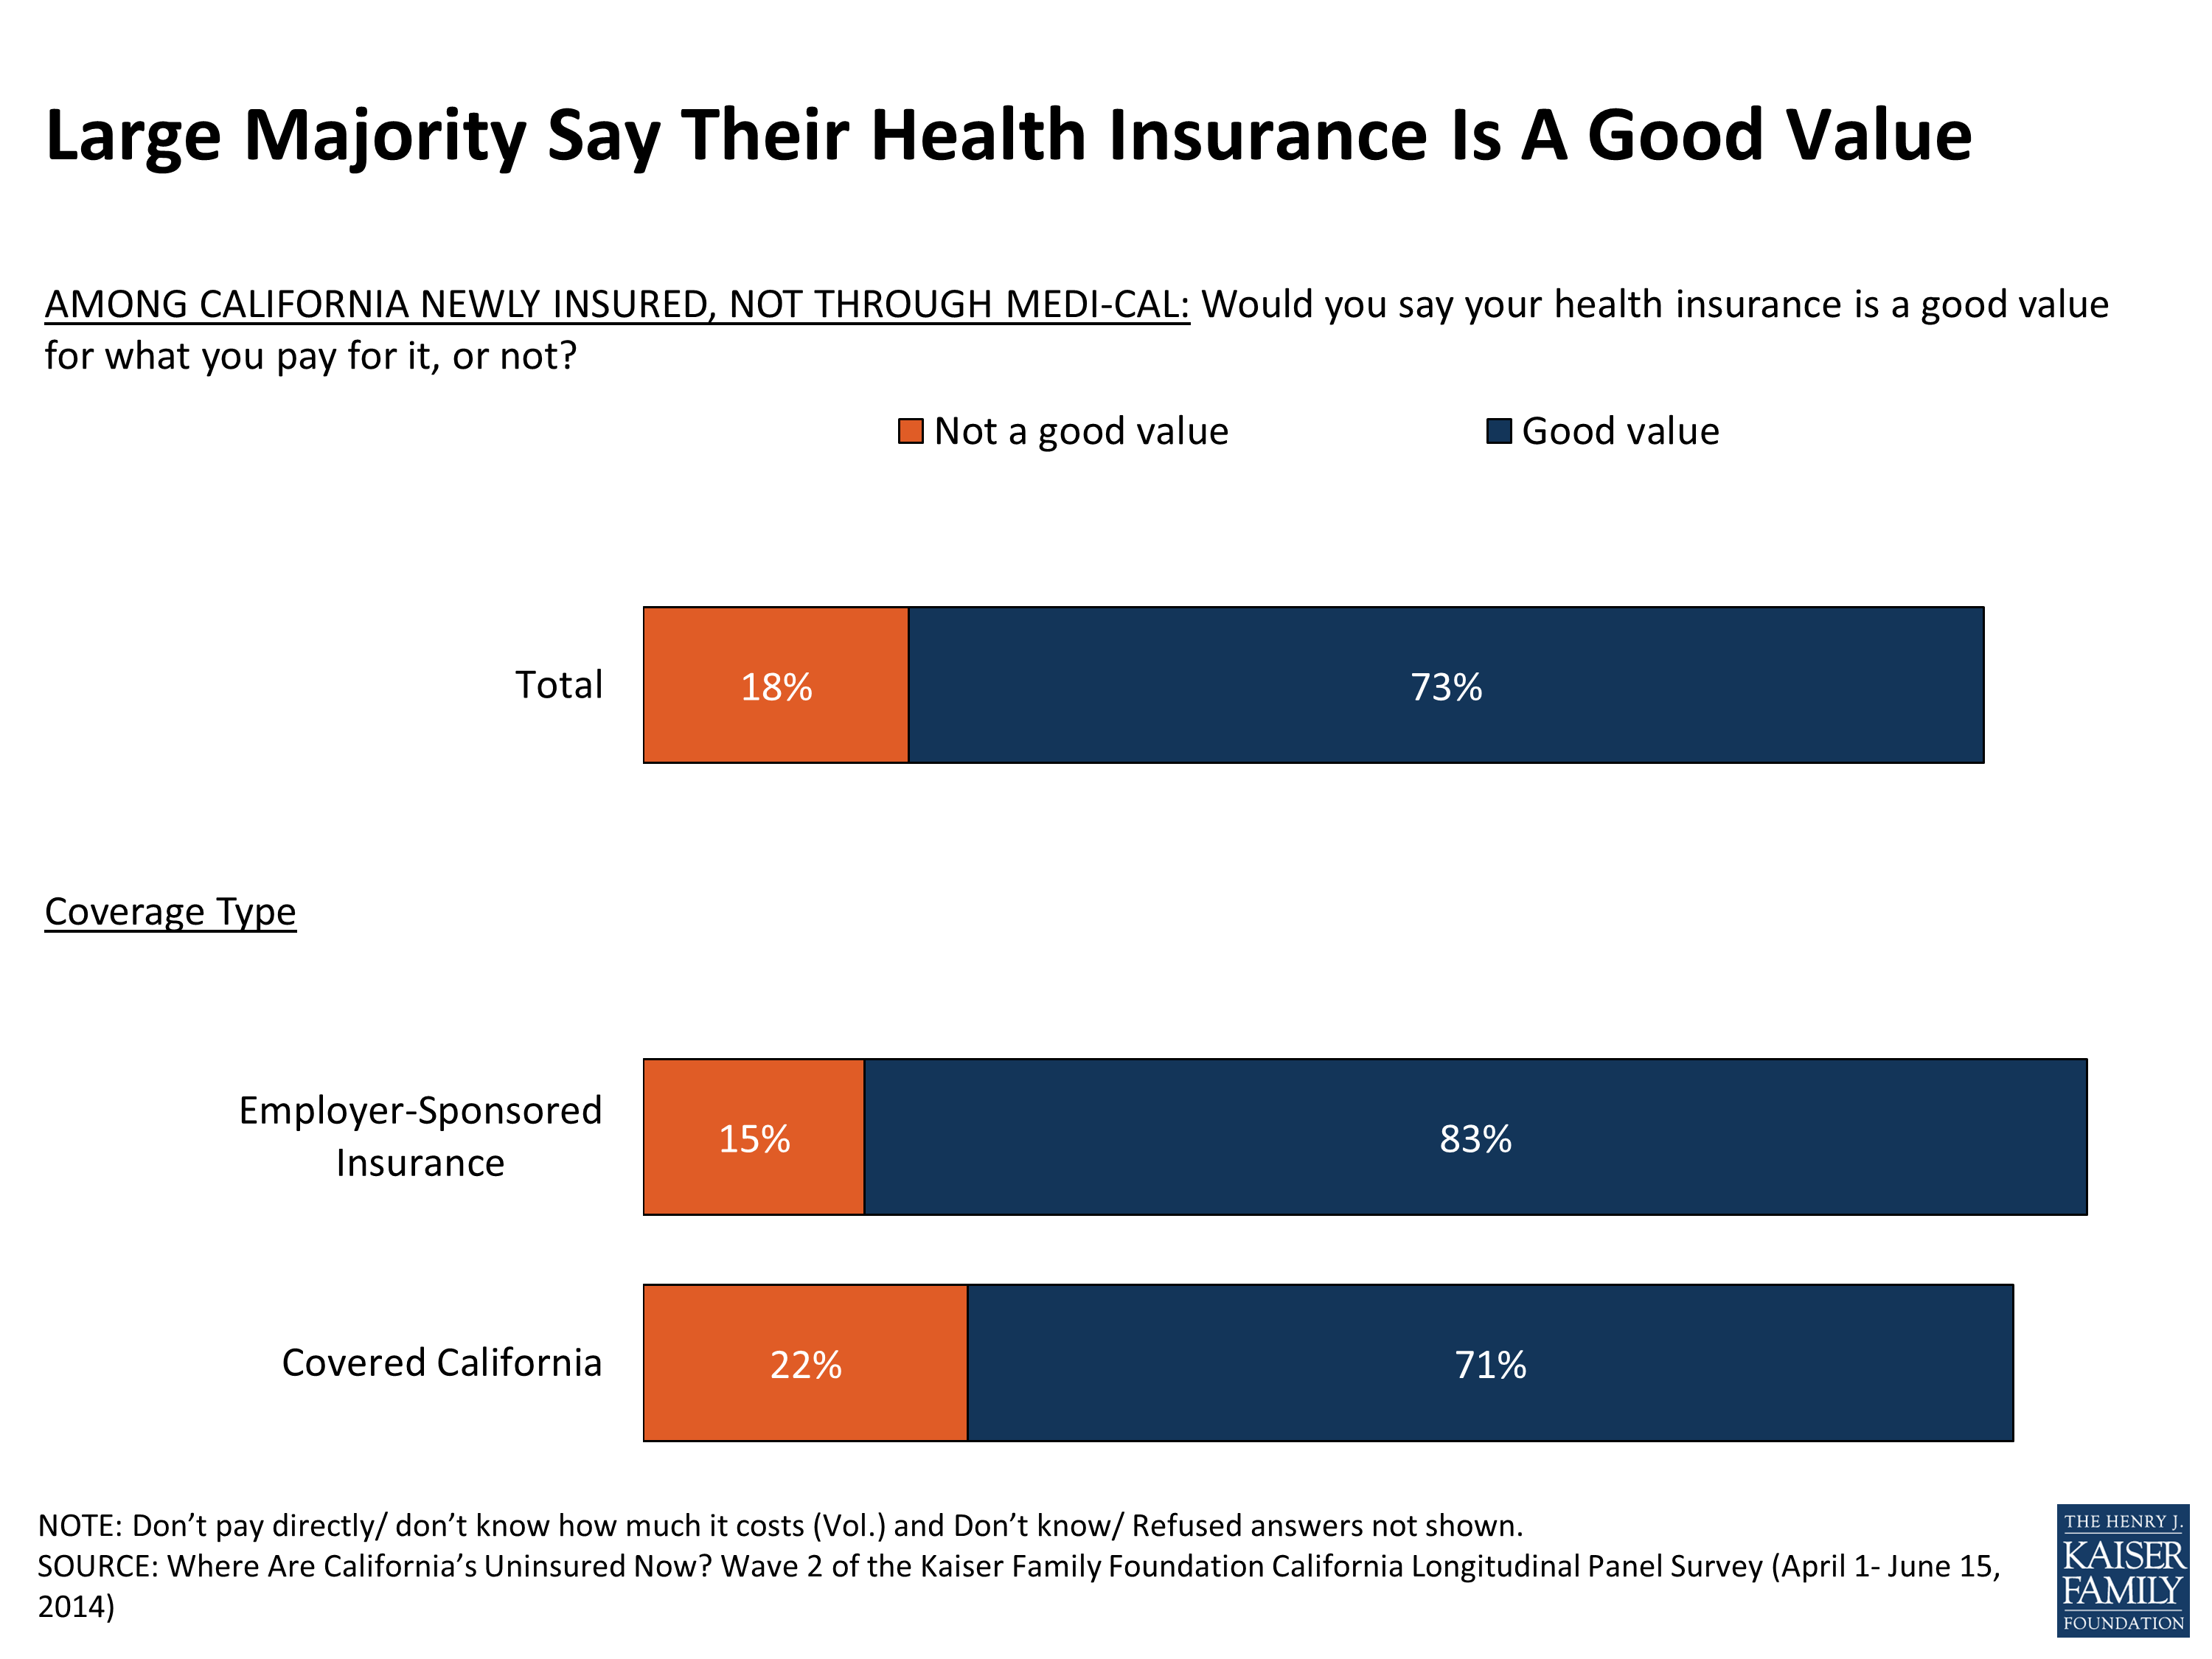
Figure 12
Many newly insured recognize the role health insurance can play in protecting them from costly or unexpected medical expenses. For example, more say that gaining insurance has made them feel more financially secure than less (37 percent vs. 16 percent), though a substantial share (45 percent) say it has made no difference. But 3 in 10 of the newly insured say they still feel vulnerable to high medical bills rather than well-protected (Figure 13).
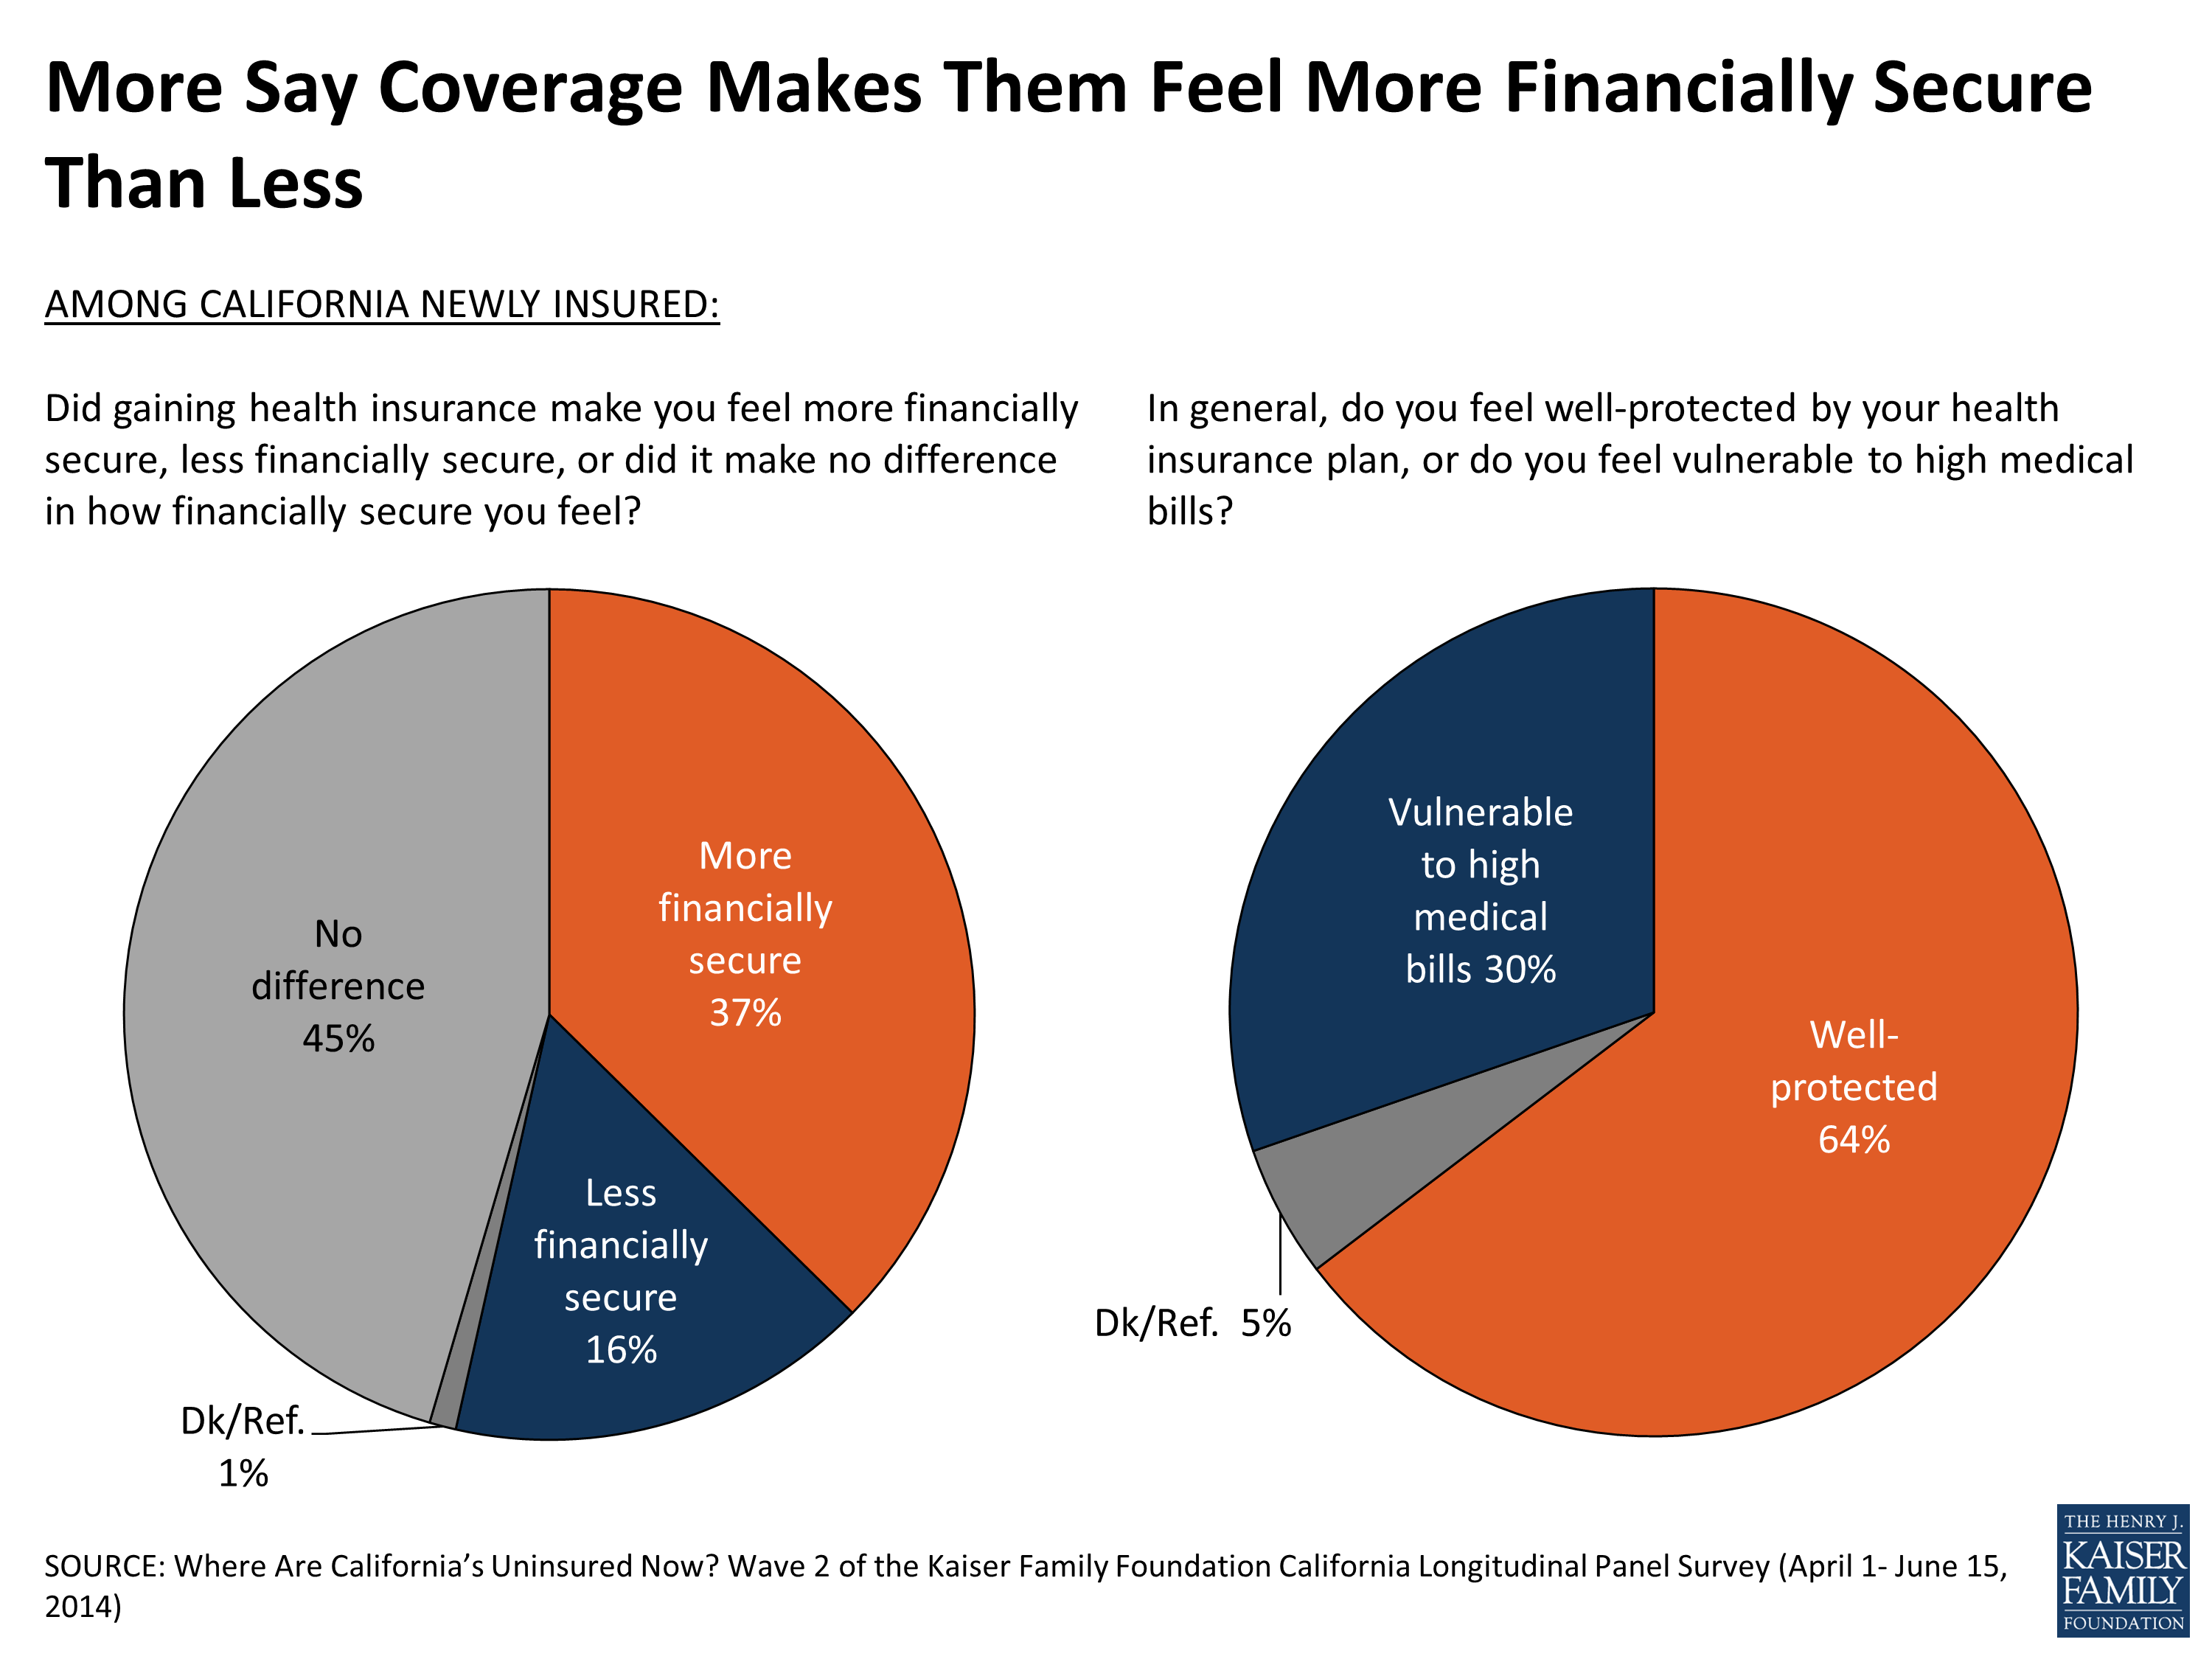
Figure 13
About a quarter of the newly insured say their coverage cost less than they thought it would, while 17 percent say it cost more and the remainder say the cost was about what they expected (43 percent) or aren’t sure (14 percent). Nearly 4 in 10 (37 percent) of those with a plan through Covered California, a group that may be getting subsidies for coverage, say that their coverage was less expensive than they expected, while a quarter say it cost more and a third say the cost is about what they expected (Figure 14).
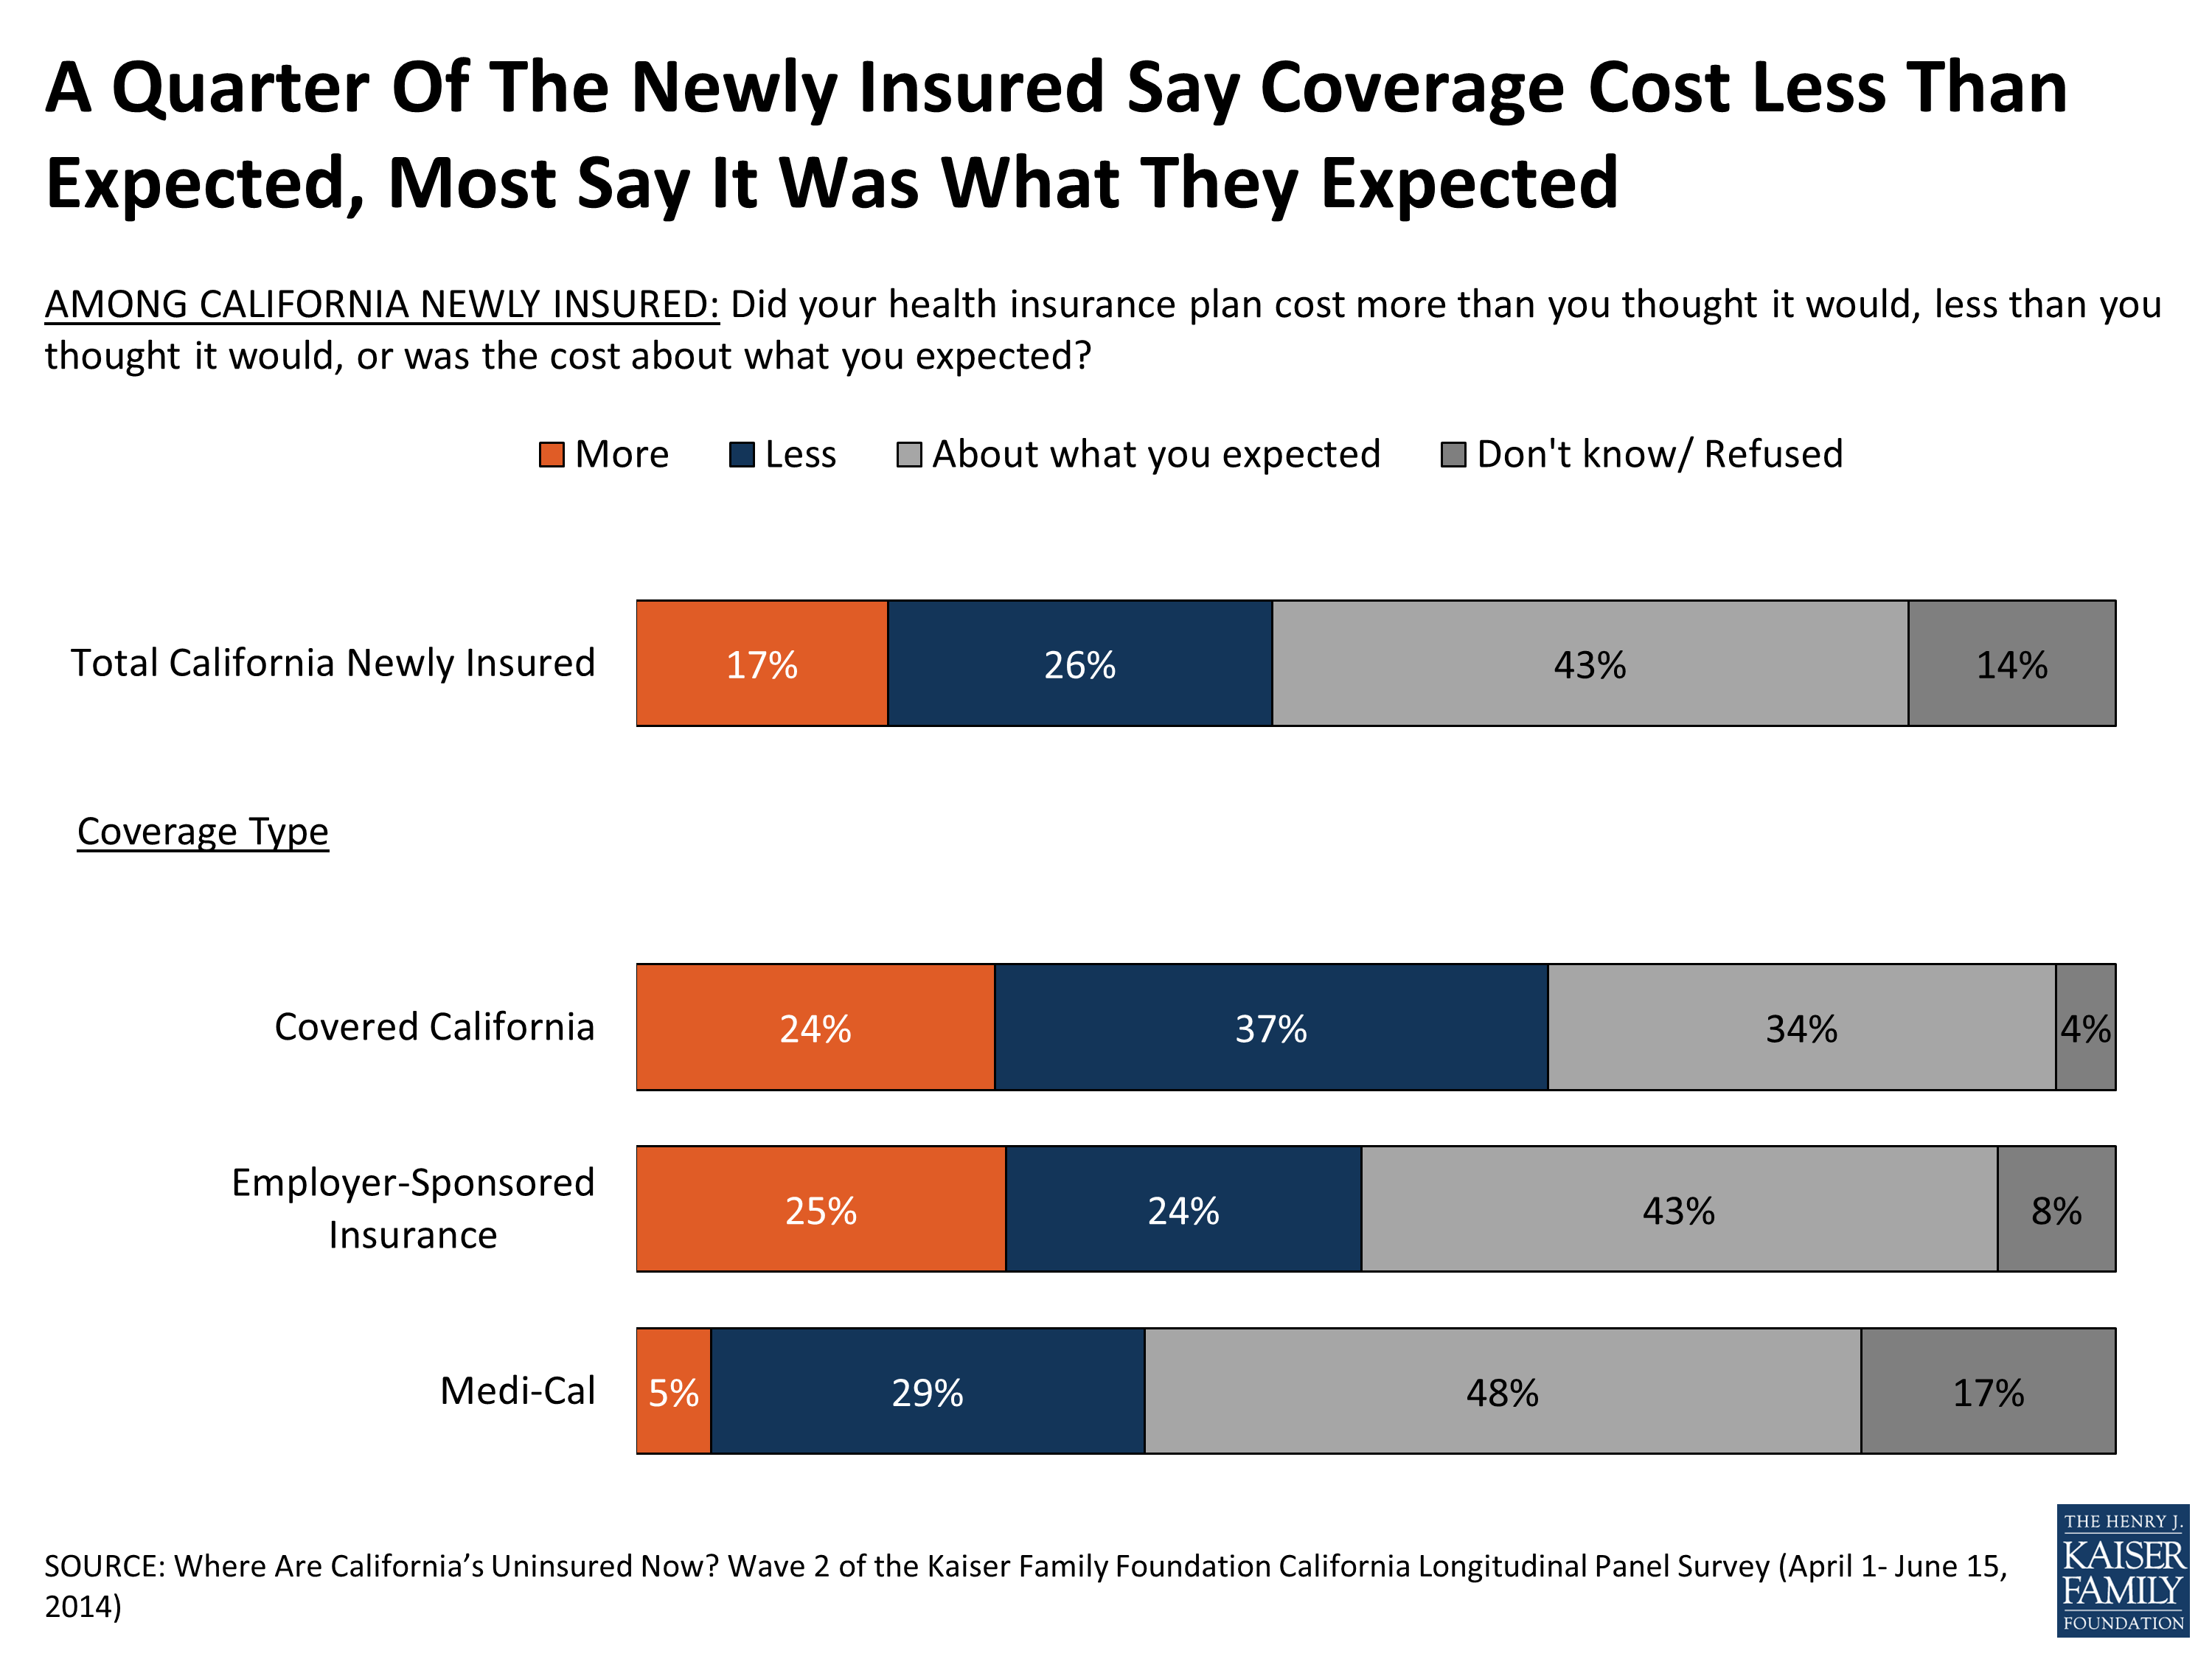
Figure 14
The majority (55 percent) of the newly insured with a plan through Covered California report getting financial assistance and the vast majority of these say they wouldn’t have been able to afford coverage without it.1
What Was Their Experience Shopping For Coverage?
For the most part, the newly insured report having had at least a somewhat easy time finding the information they needed about getting health insurance (80 percent), comparing the monthly premium cost (73 percent) and out of pocket cost sharing under different plans (71 percent), and finding a plan that meets their needs (65 percent). About 4 in 10 report difficulty comparing the services that would be covered under each plan, but still 57 percent say that was easy as well (Figure 15).
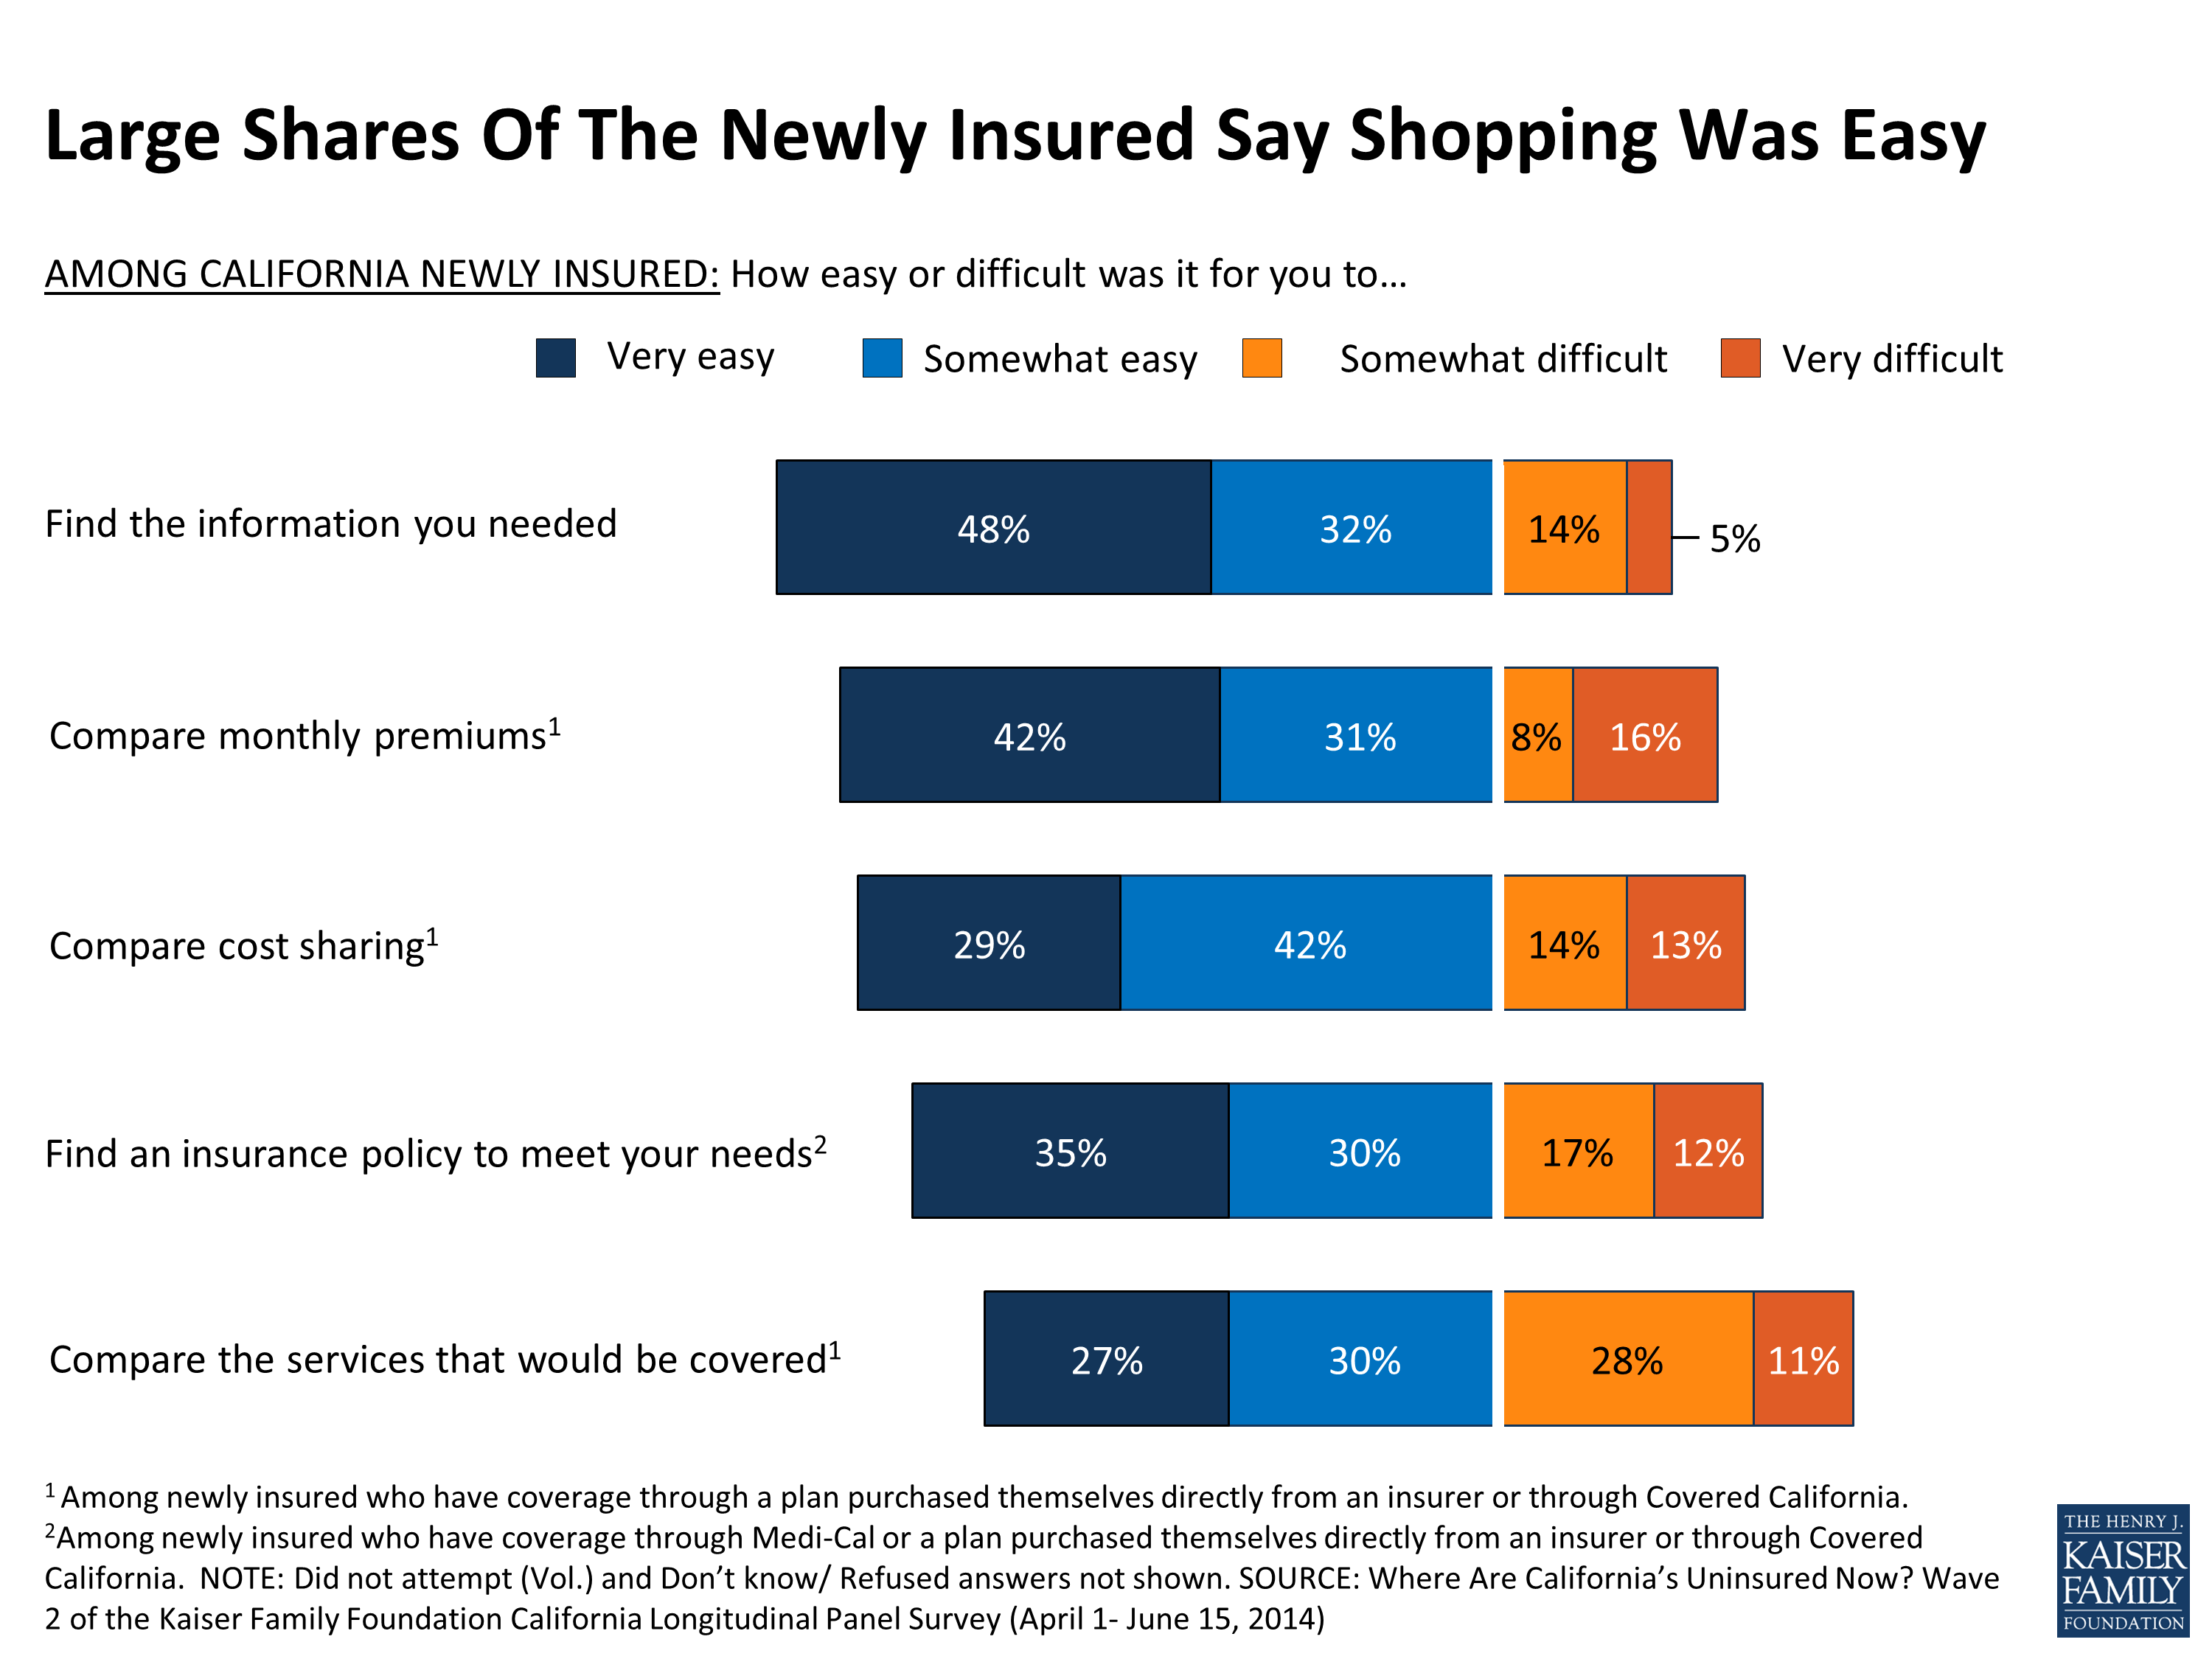
Figure 15
Three quarters (75 percent) of the newly insured with a plan through Covered California report having a choice of plans, suggesting that at least some are unaware of opportunities to shop and compare costs and coverage for a variety of plans. They report that the main factors in their choice were monthly premium costs (34 percent) and out of pocket costs (22 percent), followed by the choice of doctors and hospitals (9 percent) and the range of benefits covered (7 percent). Forty-three percent of new Medi-Cal enrollees report having a choice in plans, and the main factors they report in their decision were the choice of doctors and hospitals (16 percent), the range of benefits covered (10 percent) and the low cost of the plan (7 percent).
While the Covered California website had one of the smoother launches compared to the national healthcare.gov or other state-based exchanges, it and the 1-800 number were still plagued by technical glitches and long wait times.2 Among the previously uninsured who say they successfully enrolled in some type of coverage, just over 4 in 10 (43 percent) say they visited the website during the open enrollment period, and the majority of them found their visit at least somewhat helpful. And, for those who ultimately enrolled in a Covered California plan, 72 percent say they visited the website, including just over half found it helpful (55 percent) (Figure 16). Fewer report calling the Covered California 1-800 number (26 percent); a share that rises to 54 percent of those who now report having a plan through Covered California. Like the website, most of the newly insured found it helpful. Modest shares of the remaining uninsured report visiting the website (30 percent) or calling the 1-800 number (15 percent) but in contrast to the newly insured, most found their attempts unhelpful (see Section 3 for more on the experiences of the remaining uninsured).
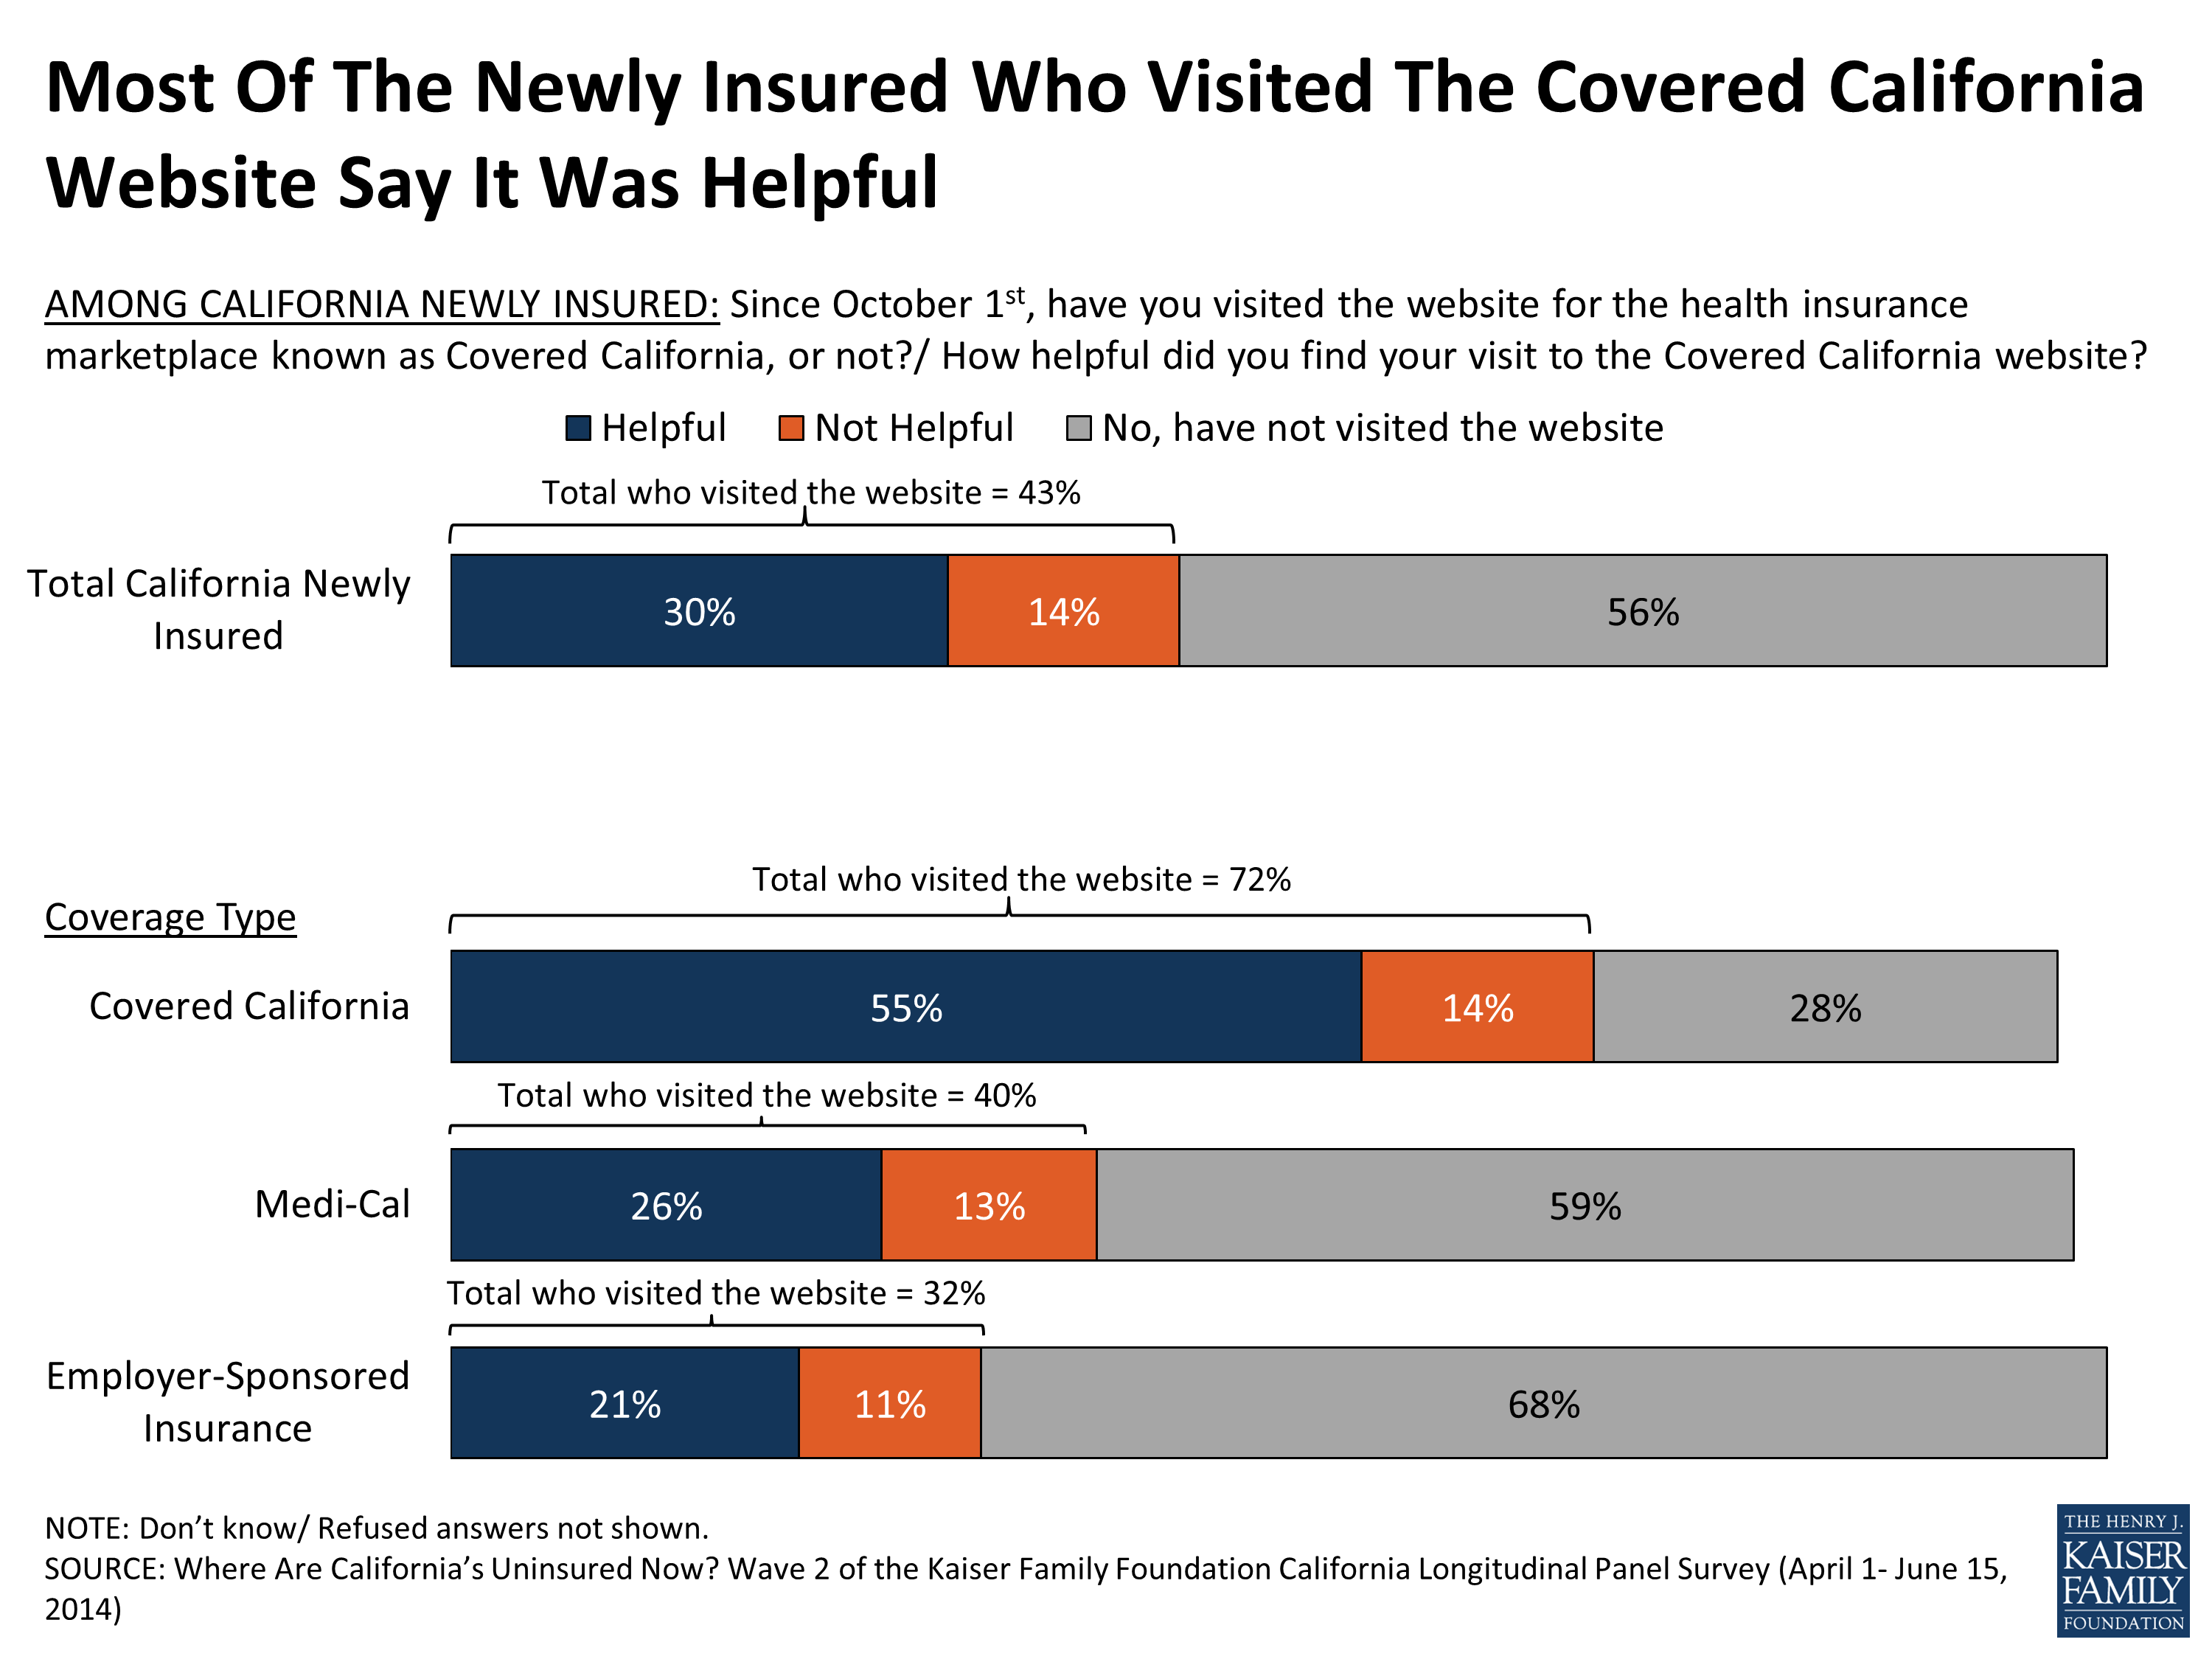
Figure 16
How Did People Enroll? Did They Have Help?
The newly insured report a variety of different avenues for enrollment. Most newly insured Medi-Cal enrollees report signing up for coverage in person while most newly insured through Covered California say they enrolled online (Figure 17). But even though about half of Covered California enrollees say they signed up online, most weren’t doing so on their own. Six in ten (61 percent) say they got assistance with their enrollment, most often from a family member or friend (25 percent) or from a Covered California representative (26 percent). A similar share of newly insured Medi-Cal beneficiaries say they got help (60 percent) and most say it was from an enrollment or community health worker (31 percent) (Figure 18). Most newly enrolled say assistance was easy to come by, particularly those who ended up enrolling in Medi-Cal (72 percent), but the newly insured with a Covered California plan are more divided with 51 percent saying it was easy to find help and 38 percent saying it was difficult, including 21 percent who said it was very difficult.
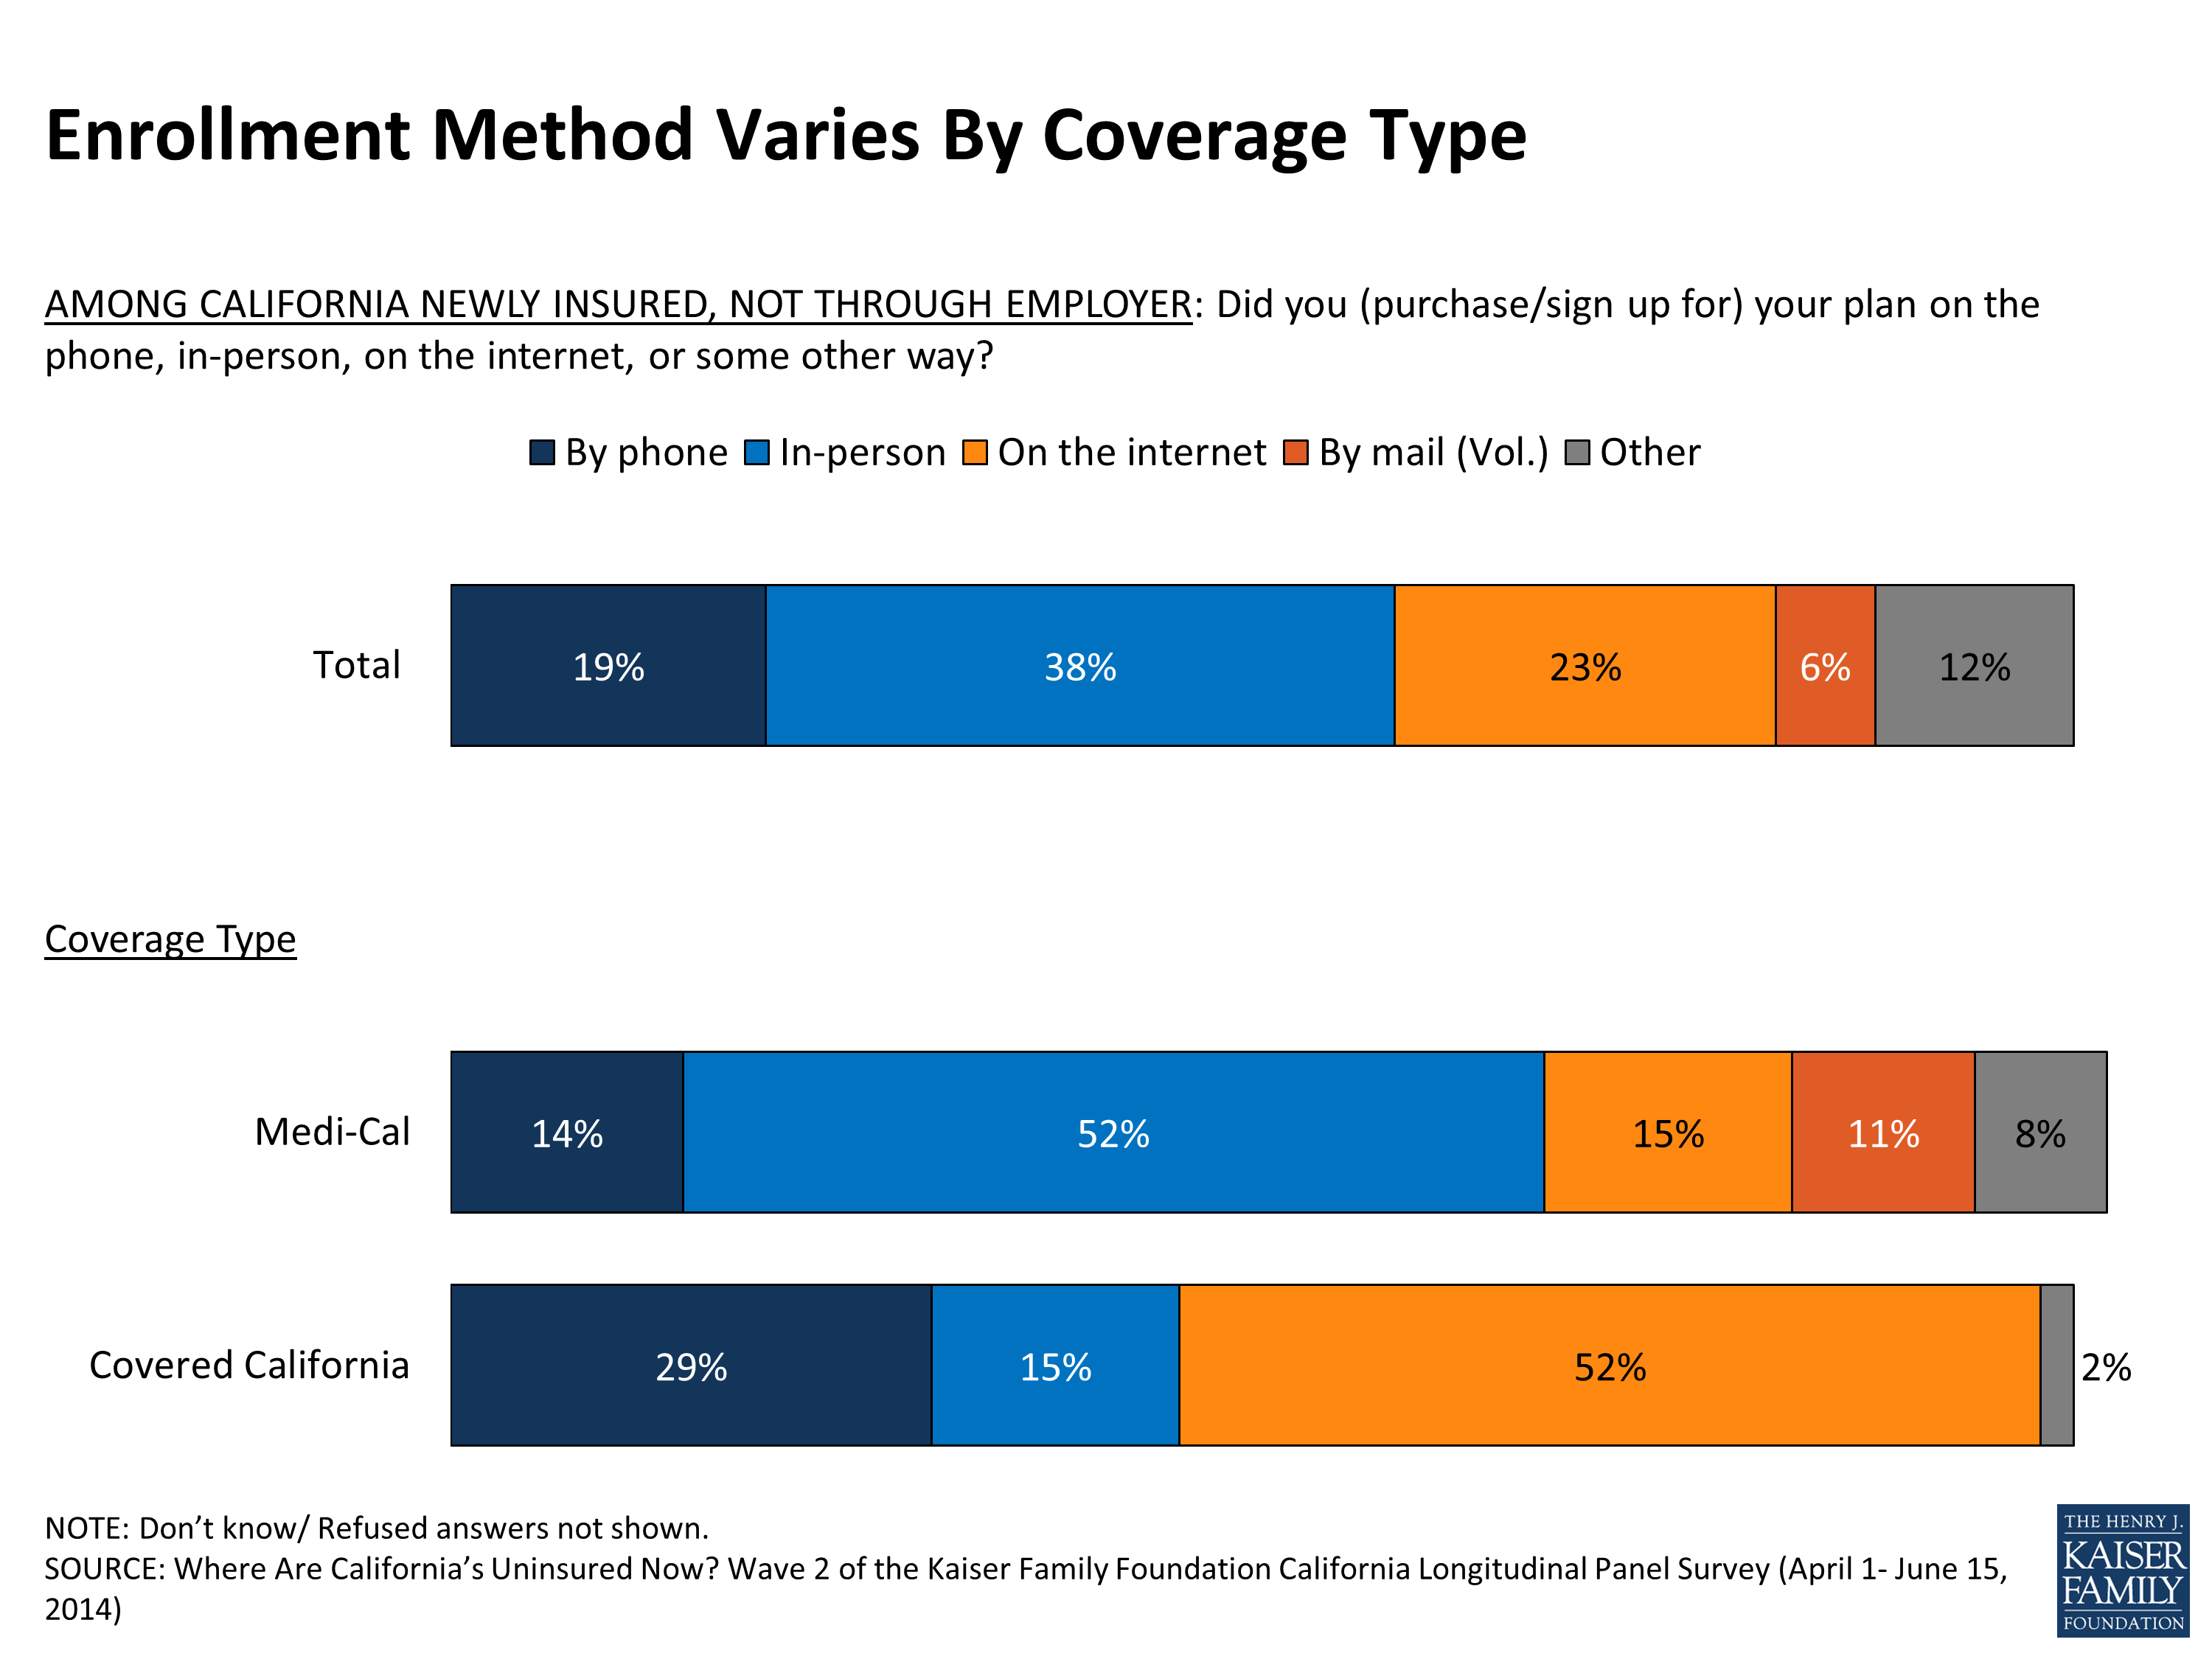
Figure 17
| Figure 18: Many Newly Insured Had Assistance Enrolling, But From Varied Sources | ||
| Did someone help you enroll in health insurance or did you complete the enrollment process on your own? | Covered California | Medi-Cal |
| Someone helped me | 61% | 60% |
| Family member or friend | 25 | 9 |
| Covered California representative | 26 | 8 |
| Health insurance broker or agent | 8 | 4 |
| Community or county health worker | 2 | 31 |
| Someone else | * | 6 |
| Completed it alone | 39 | 40 |
| How easy or difficult was it for you to find someone to help you enroll or answer your questions? | ||
| Very easy | 28% | 42% |
| Somewhat easy | 23 | 29 |
| Somewhat difficult | 16 | 12 |
| Very difficult | 21 | 13 |
| Did not attempt (Vol.) | 11 | 2 |
| Note: Don’t know/Refused aren’t shown. | ||
For the most part, enrollment went fairly smoothly according to those signing up for Medi-Cal or private insurance through Covered California or an employer (Figure 19). However, the newly insured in plans through Medi-Cal or an employer are more likely to say the process was very easy than those insured through Covered California. In fact, about 4 in 10 (39 percent) of those newly insured through Covered California say their process was at least somewhat difficult, including 14 percent who say it was “very” difficult.
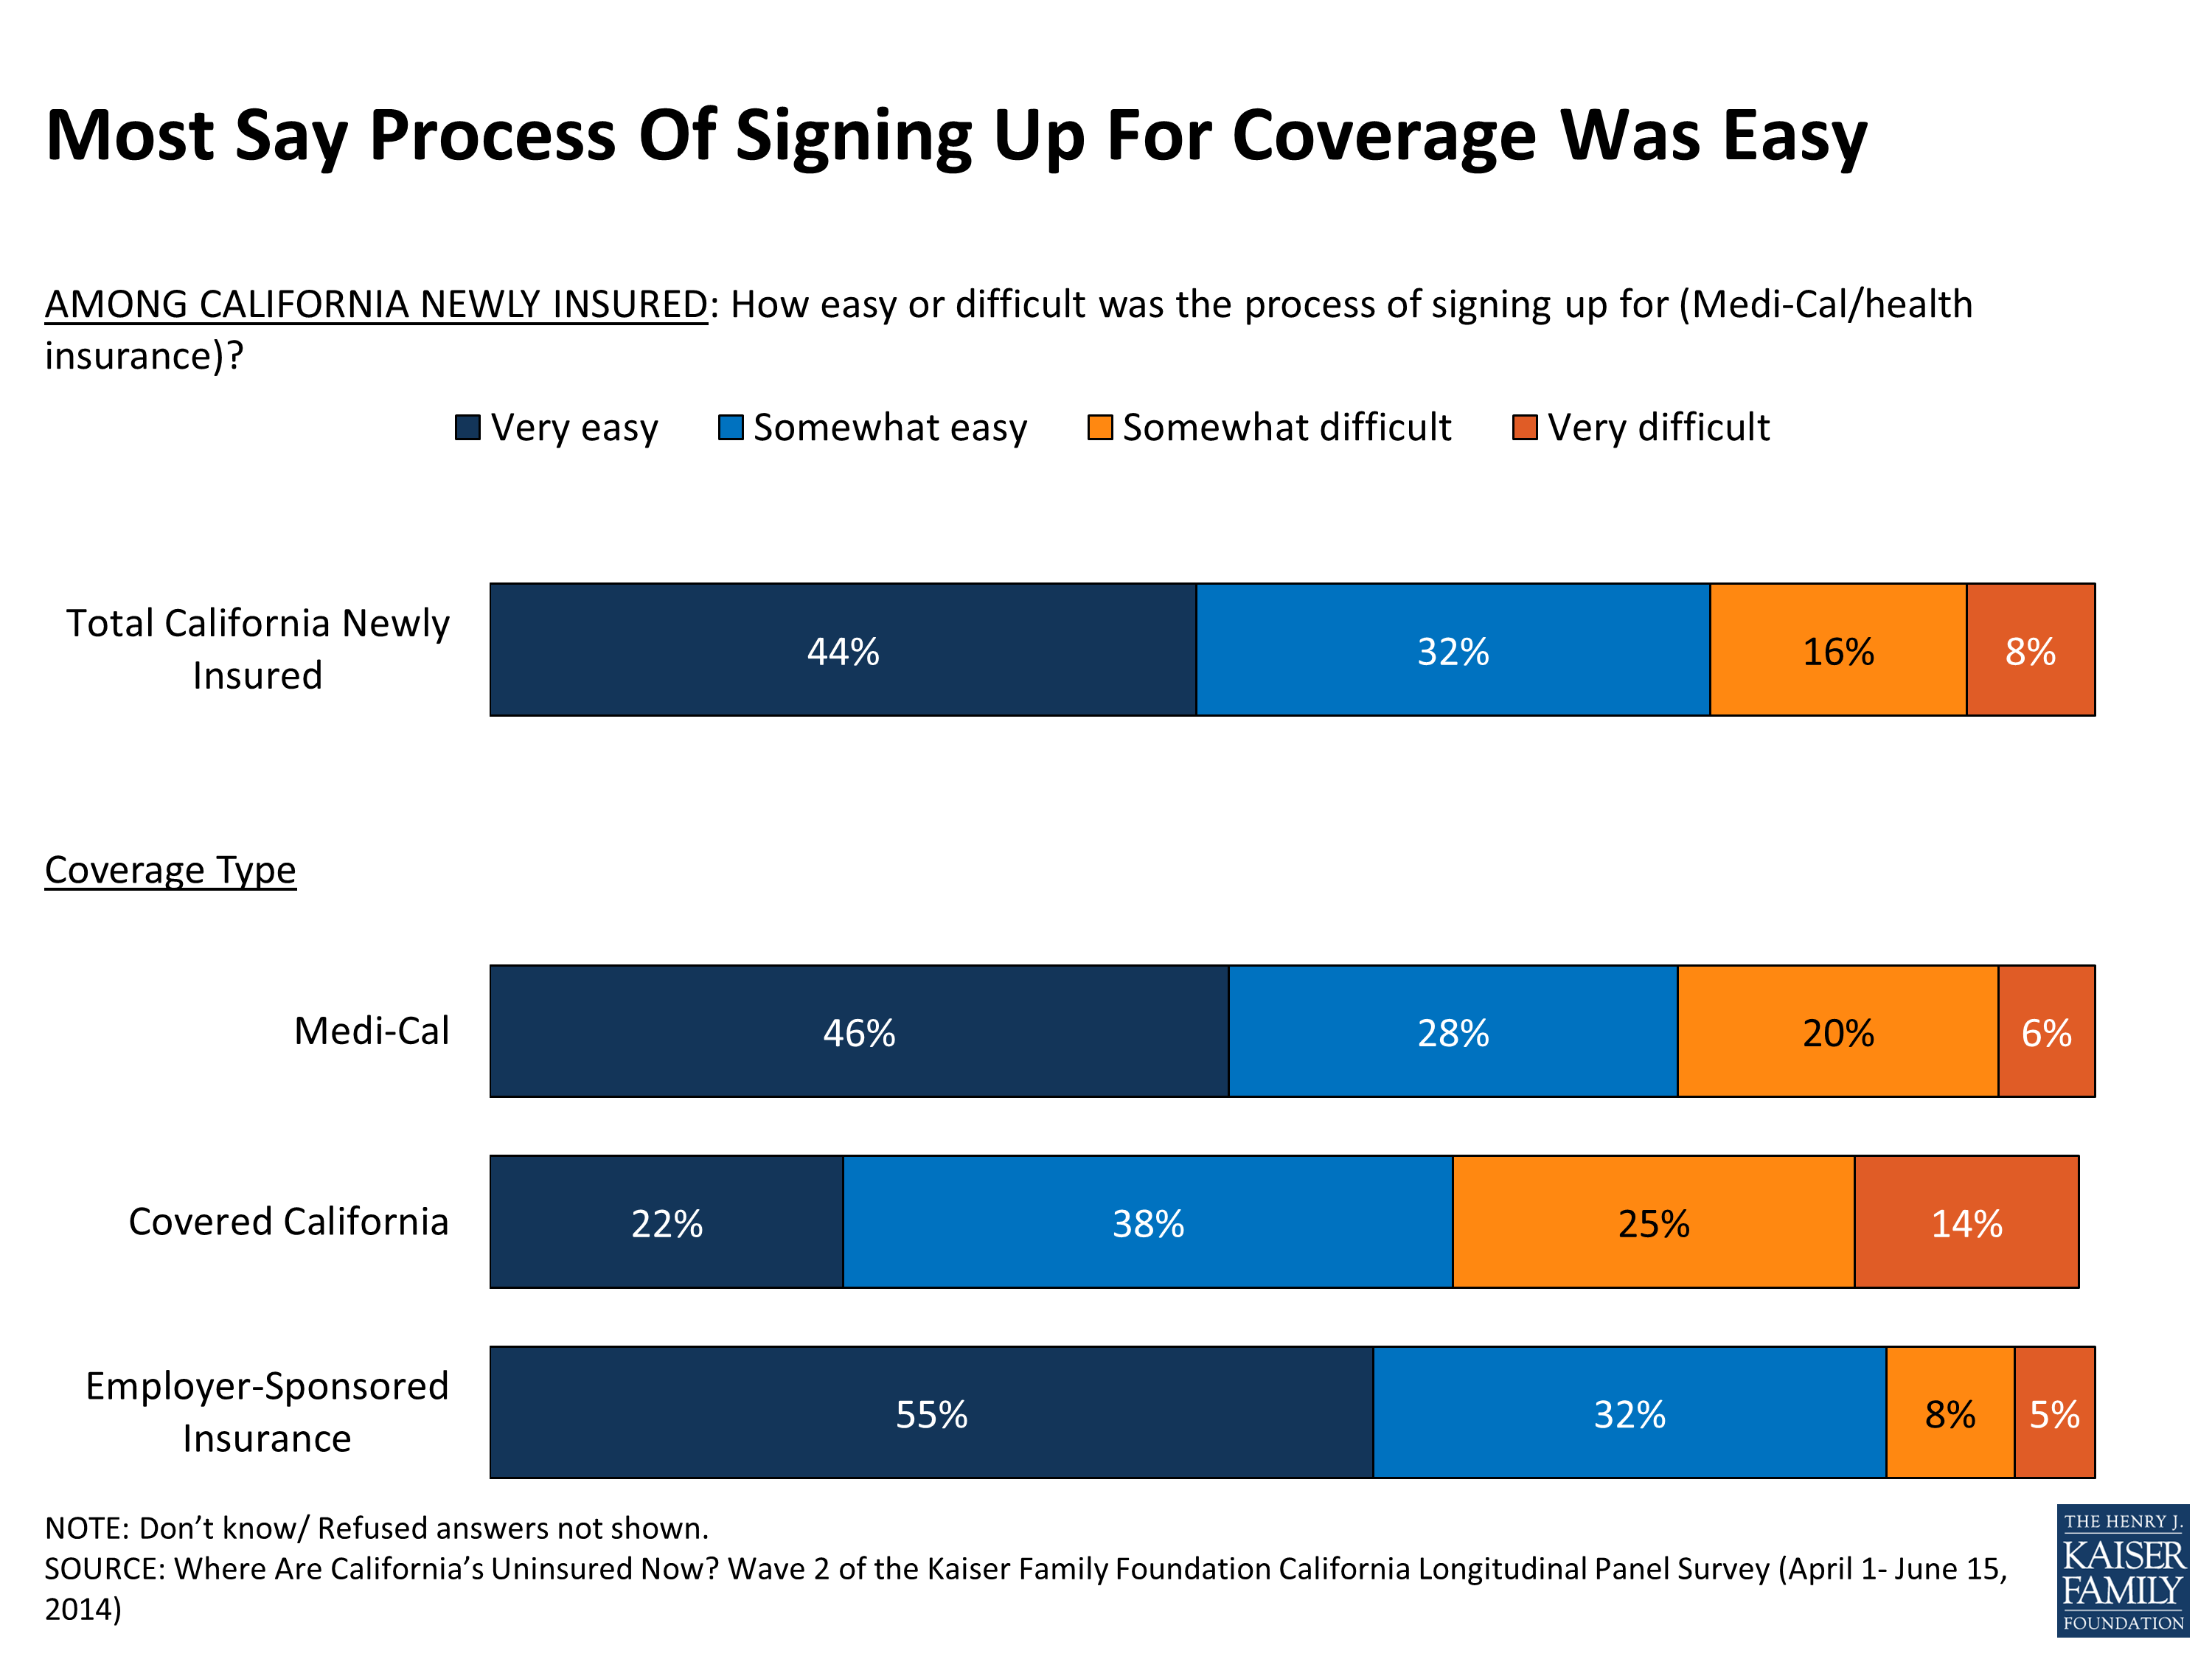
Figure 19
Additionally, some newly insured hit snags while enrolling. About one in five (19 percent) of those with Medi-Cal coverage and about a quarter (26 percent) of those with a Covered California plan say it was difficult to determine if their income qualified them for Medi-Cal or financial assistance. Still the majority in both groups said it was easy to determine eligibility, including 54 percent of those with Medi-Cal coverage who say it was very easy (Figure 20).
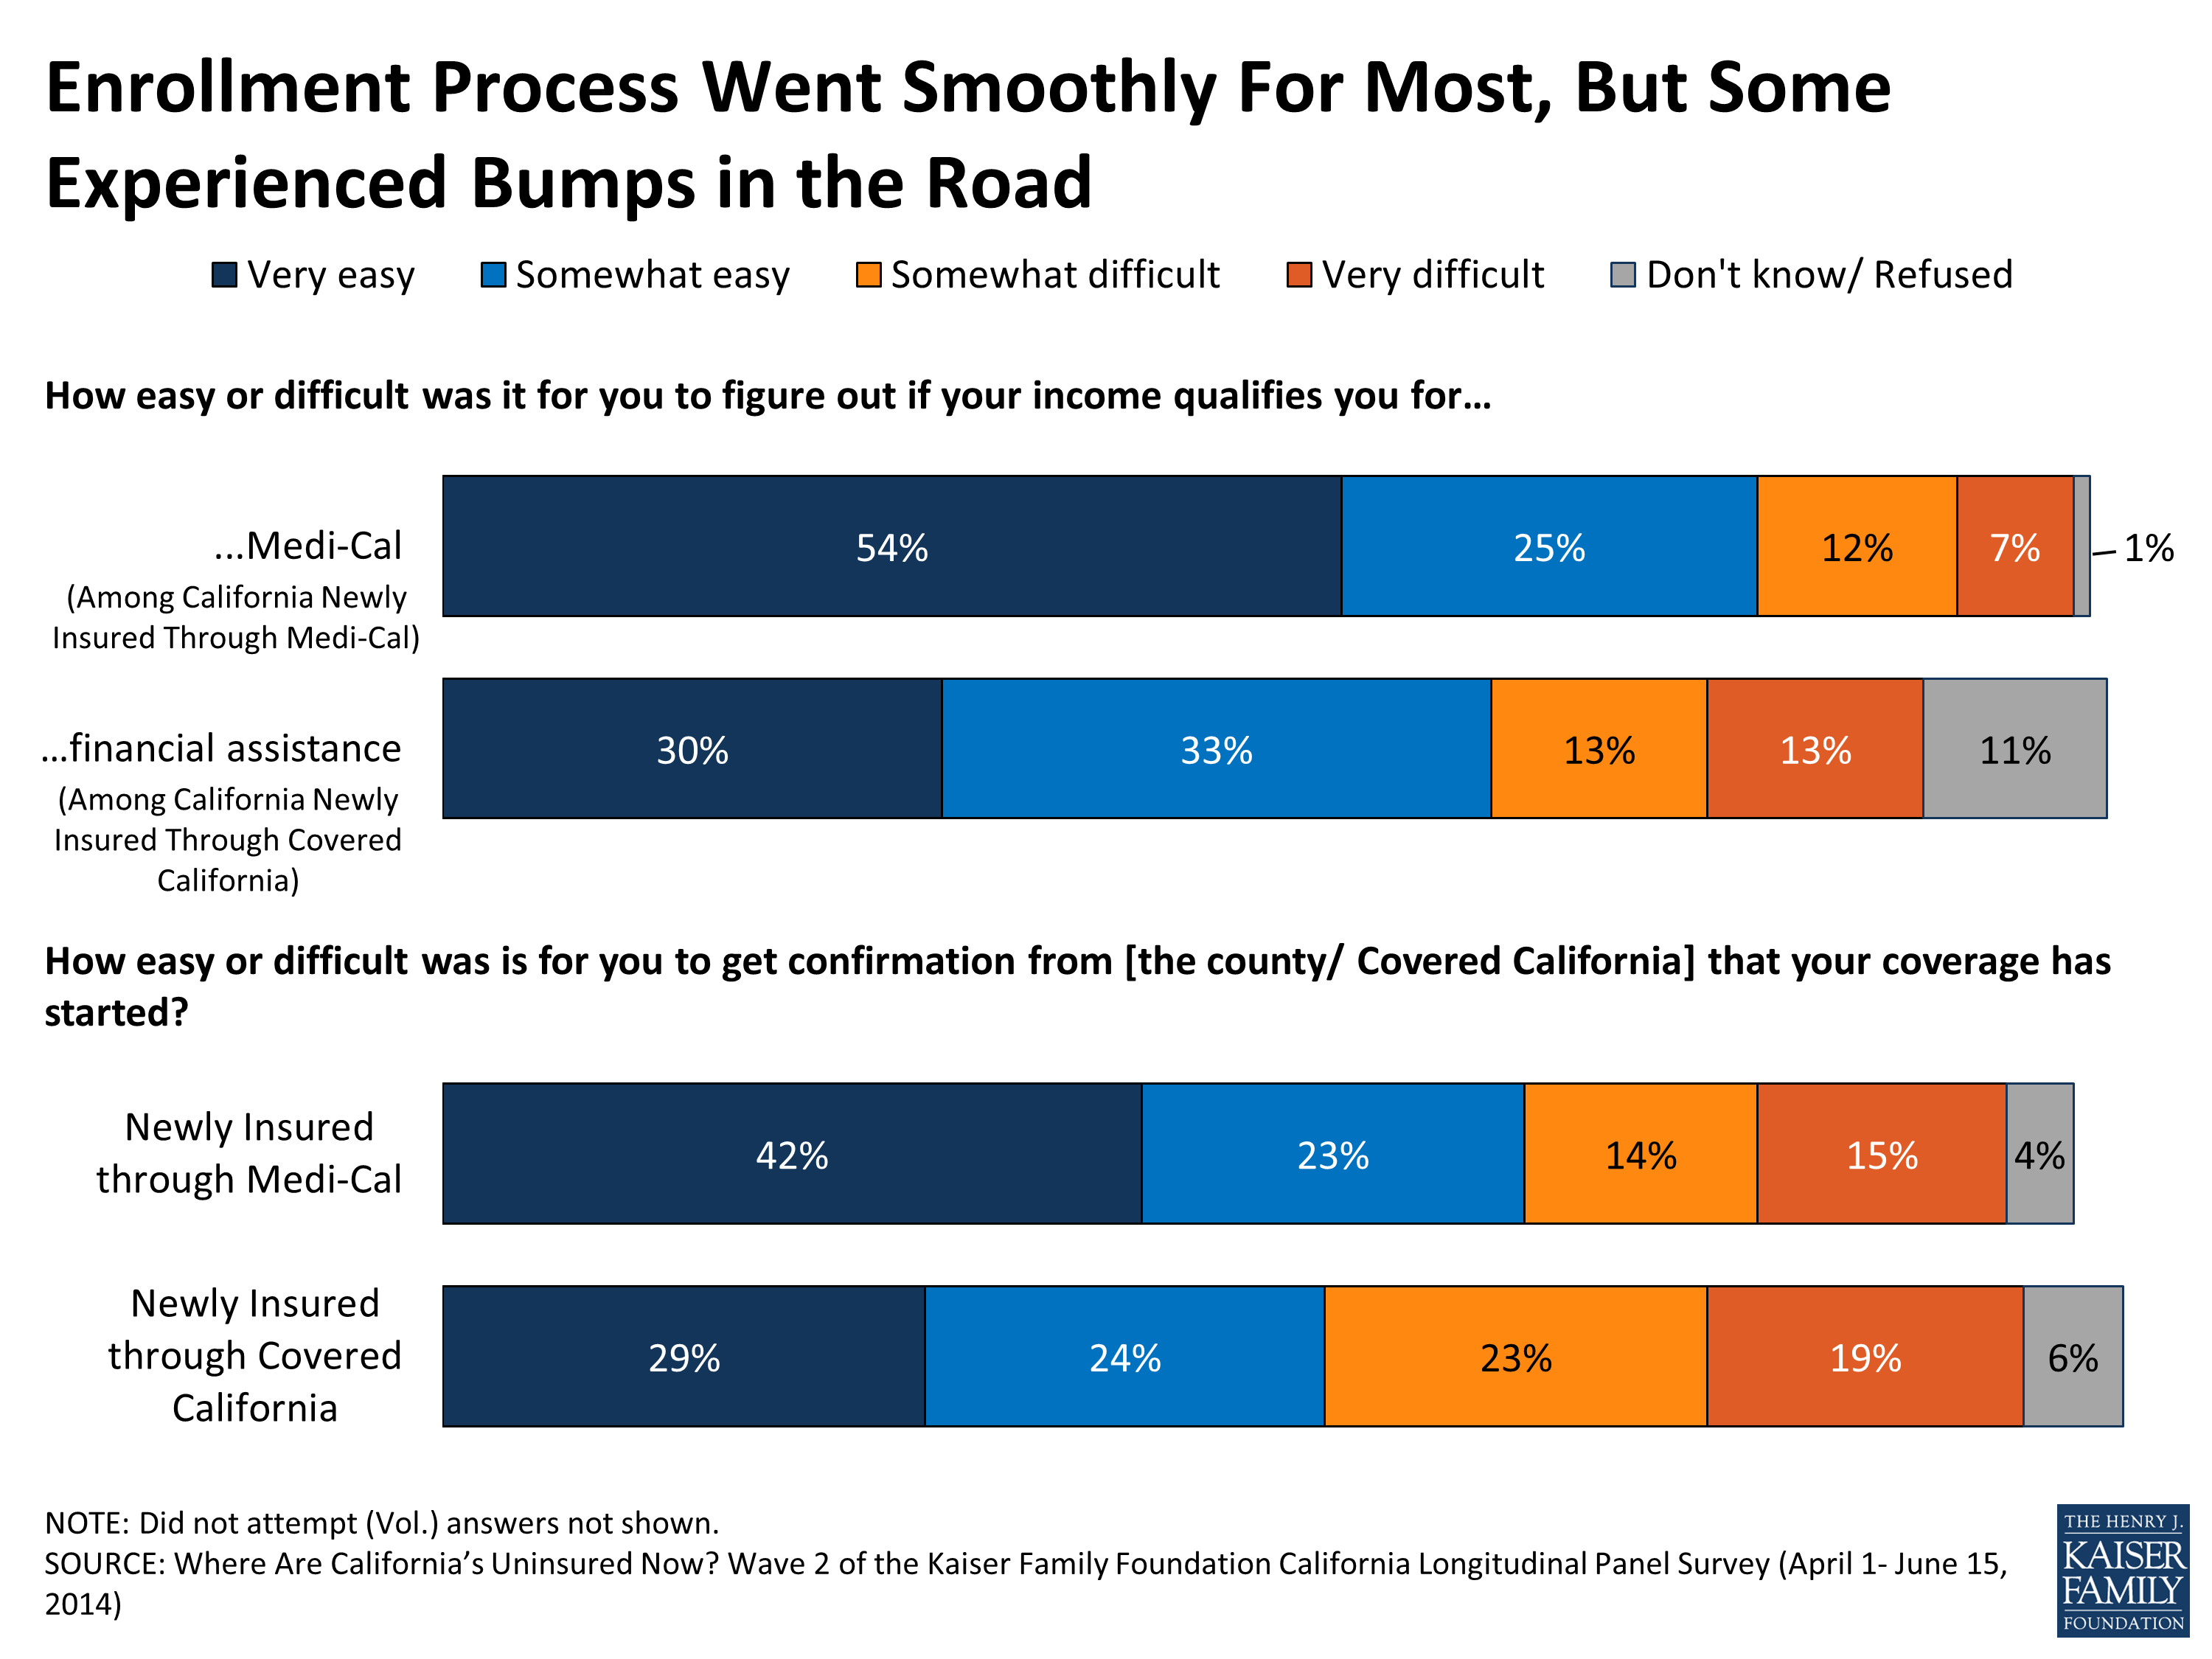
Figure 20
At the tail end of the enrollment process, many had a hard time confirming that they had successfully enrolled. Roughly 4 in 10 report having difficulty confirming enrollment with Covered California and about 3 in 10 report problems confirming enrollment in Medi-Cal (Figure 20).
What Do The Newly Insured Understand About Their New Coverage?
Of the newly insured, over 60 percent report having been uninsured for over two years and 1 in 5 say they had never had insurance before now, indicating that many in this group may not be well versed in the often complicated nature of health insurance. But when it comes to their new plan, a large majority of the newly insured say they feel like they understand the coverage and the out-of-pocket costs of their plan at least somewhat well (Figure 21). These shares are similar across different plan types.
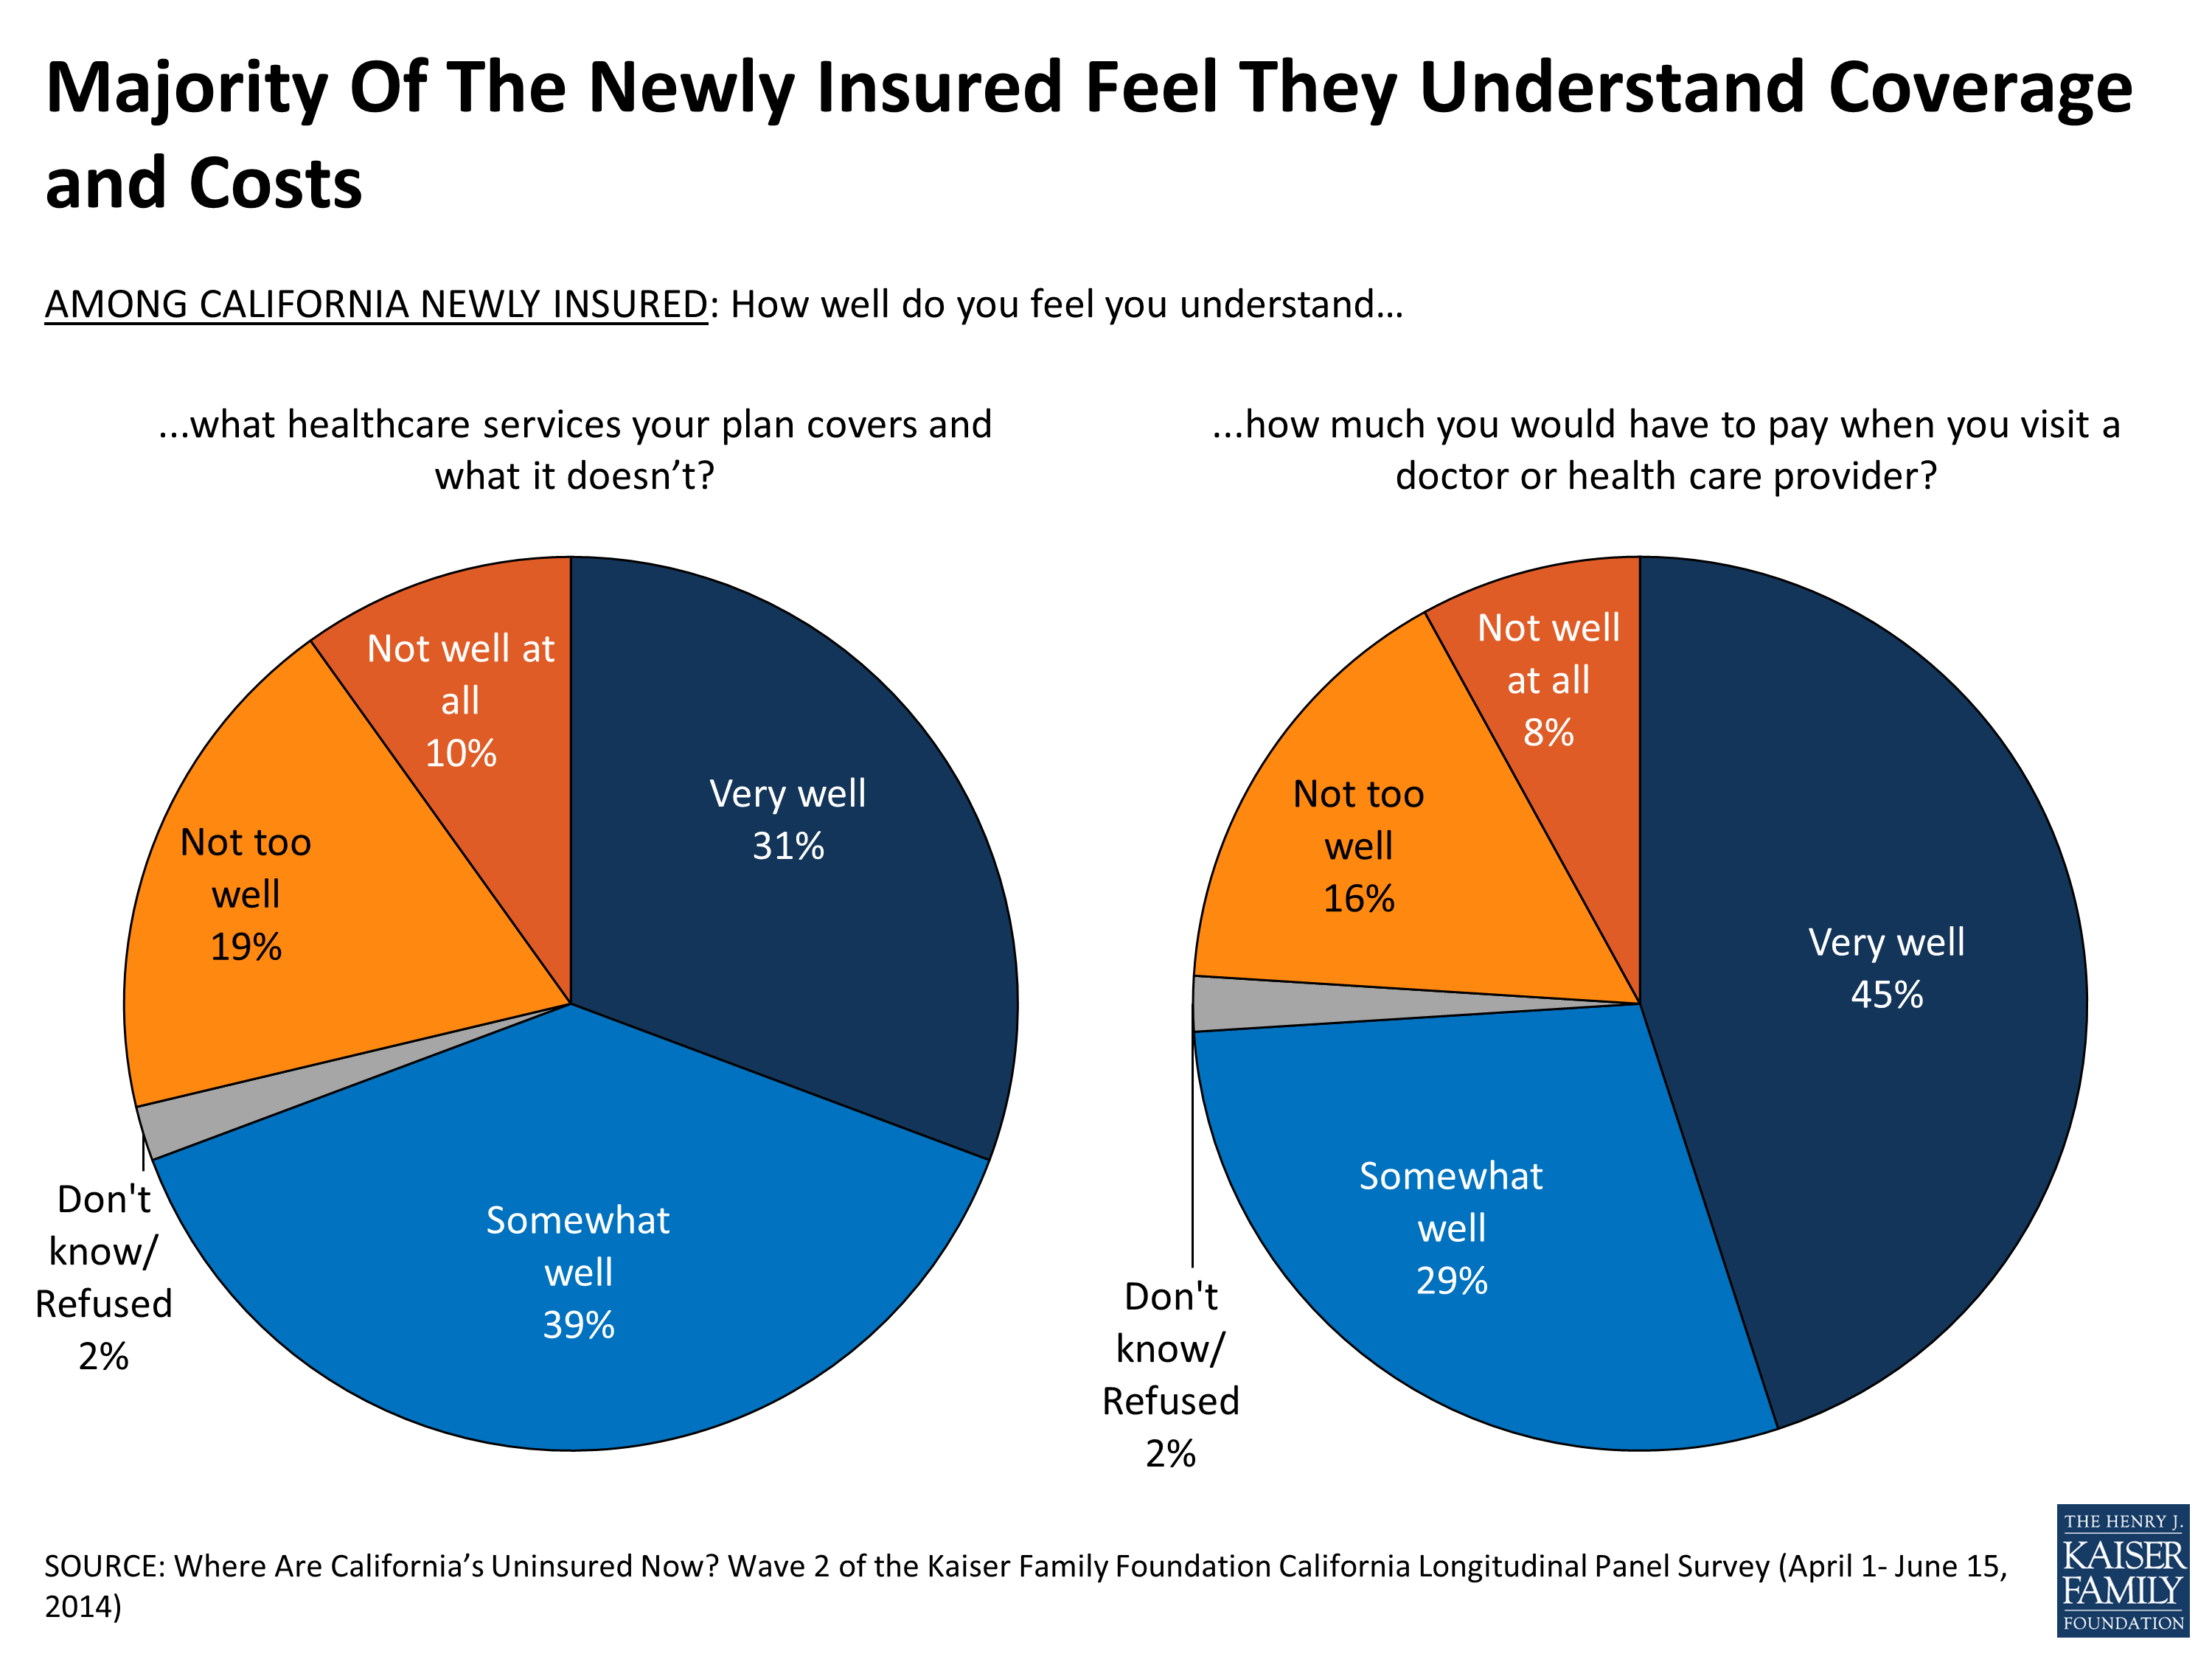
Figure 21
In an effort to make it easier for people to shop and compare health plans, non-group insurance is now categorized into metal levels (platinum, gold, silver and bronze). Half (50 percent) of the newly insured with plans through Covered California say they signed up for the silver option, followed by bronze (18 percent), platinum (4 percent) and gold (2 percent).3 One in 4 (24 percent) didn’t know the answer to this question about their plan.
Do They Like It? Have They Used It?
The newly insured haven’t had their insurance plans for long, but a large majority reports positive experiences with their coverage so far, including 78 percent of Medi-Cal enrollees and about 6 in 10 of Covered CA enrollees (Figure 22). Four in ten (43 percent) say they have visited a doctor since enrolling, and a few of those who visited a doctor (15 percent, or 6 percent of the newly insured overall) say they experienced a problem using their insurance, including limited provider networks and other access issues. Future waves of the panel survey will further explore the newly insured’s interactions with health care providers as they have more experience using their new insurance.
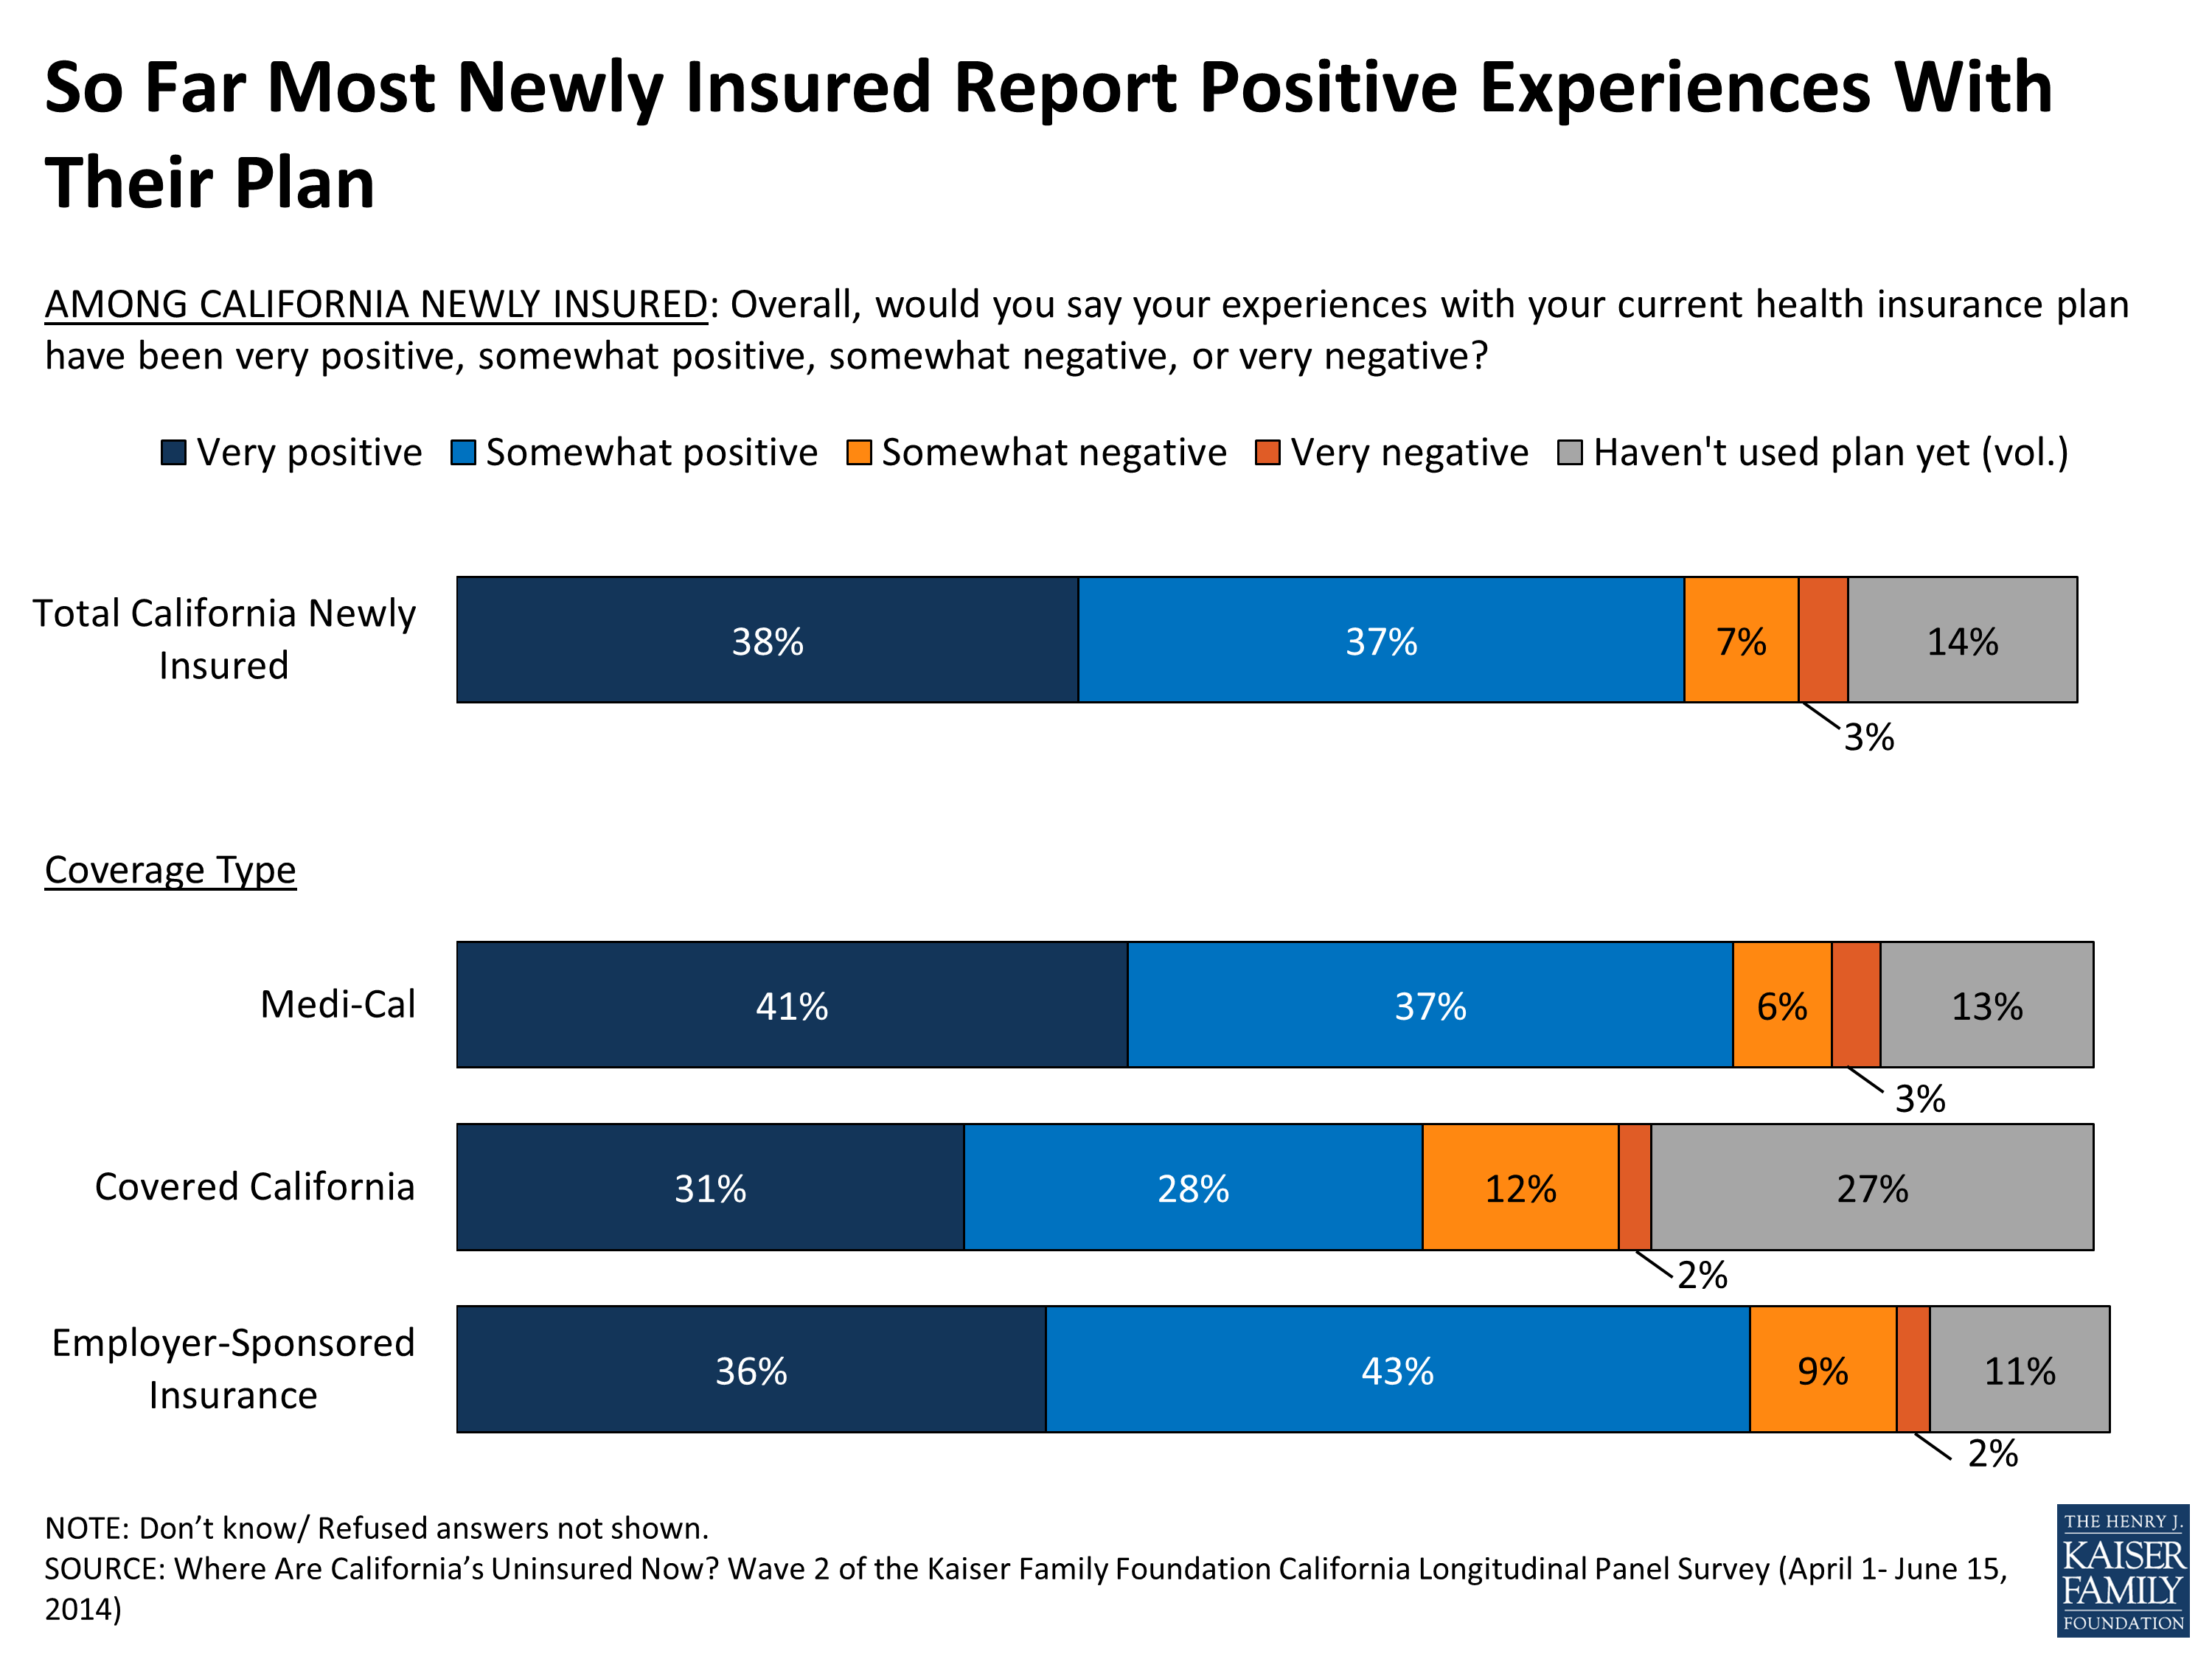
Figure 22
Enrollment And Shopping Experiences Among Hispanics
Making up over half of California’s uninsured population before open enrollment began, Hispanics were an important target of outreach and enrollment efforts during the first open enrollment period. Fifty two percent of Hispanics who were previously uninsured now report having insurance, most of whom say they signed up for Medi-Cal.
Newly insured Hispanics report a smooth enrollment process and more than 8 in 10 say they have had positive experiences with their coverage so far (Figure 23). Reflecting the finding that most Hispanics got coverage through Medi-Cal, 47 percent of newly insured Hispanics say they signed up in person and an even larger share say they had someone help them complete the process (69 percent).
Most newly insured Hispanics say finding help was easy, including half that say it was very easy (Figure 23). More generally, newly insured Hispanics report that information on signing up for insurance was easy to come by (79 percent). And, nearly 9 in 10 (87 percent) newly insured Hispanics taking the survey in Spanish said it was easy to find information in Spanish, including about two thirds (65 percent) who said it was very easy.
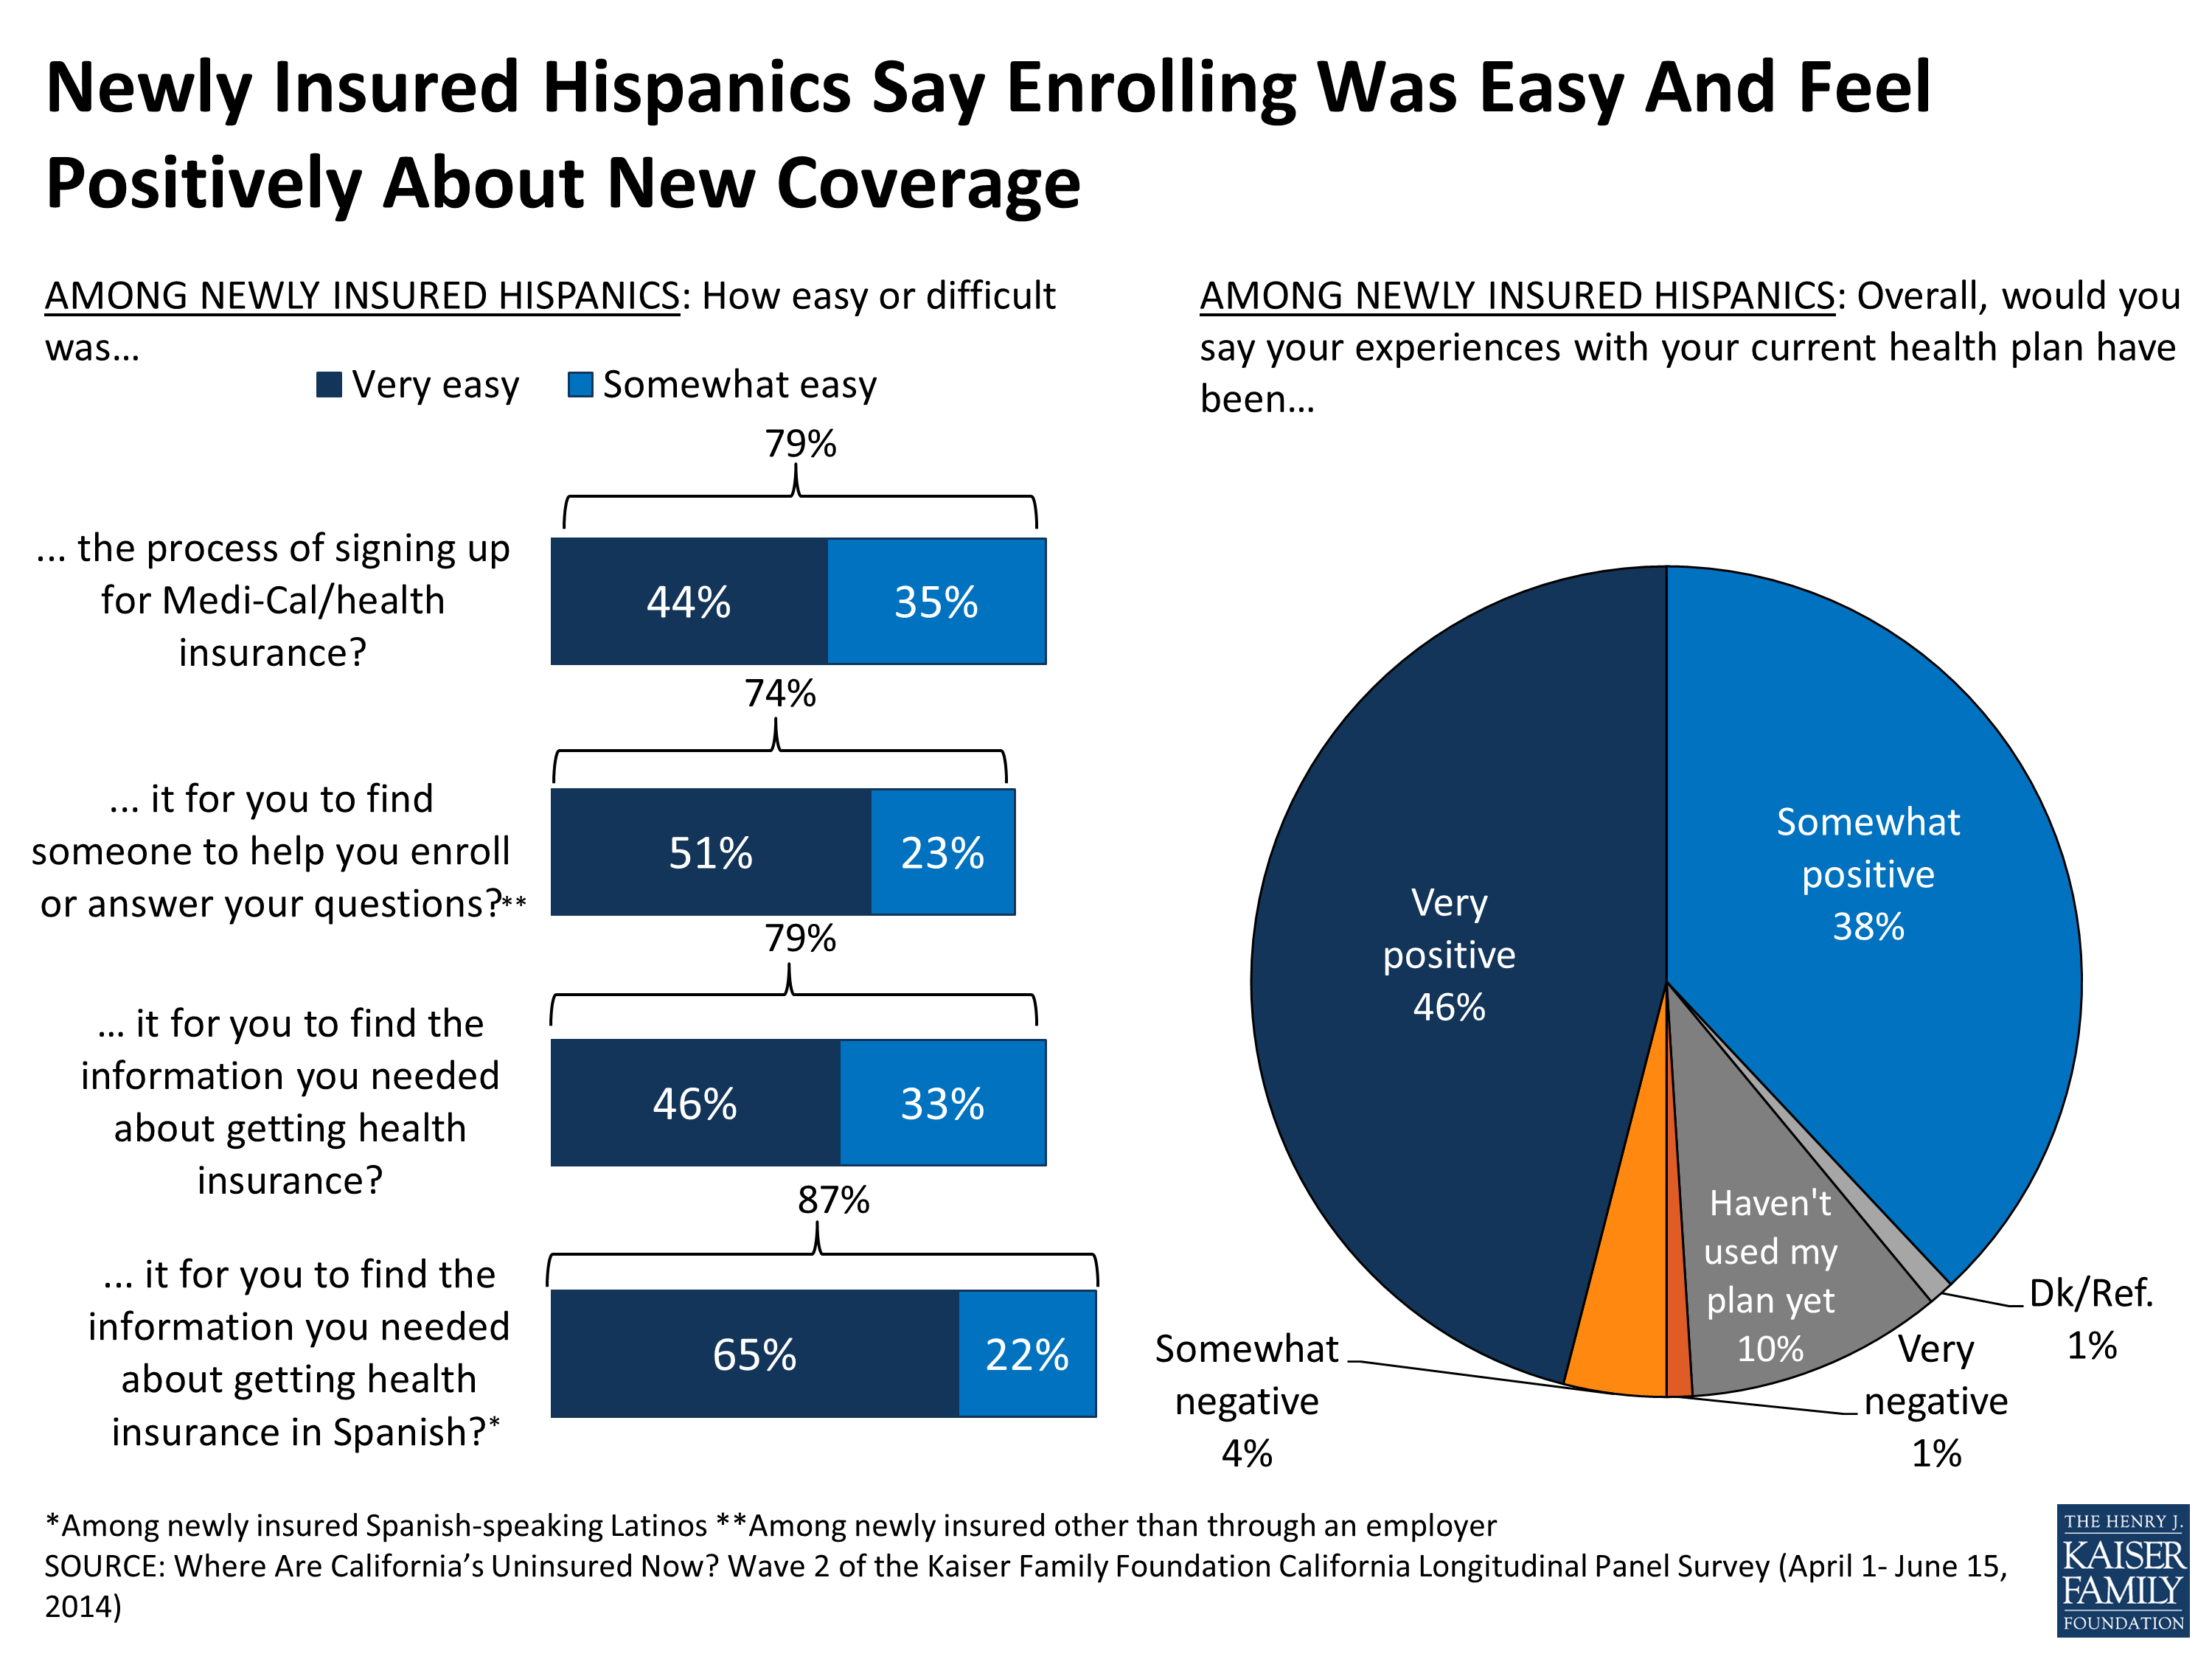
Figure 23
But information gaps persist –the majority (53 percent) of newly insured Hispanics say they don’t have enough information on what the law will mean for them, while the majority of newly insured whites feel they do (71 percent) (Figure 24).
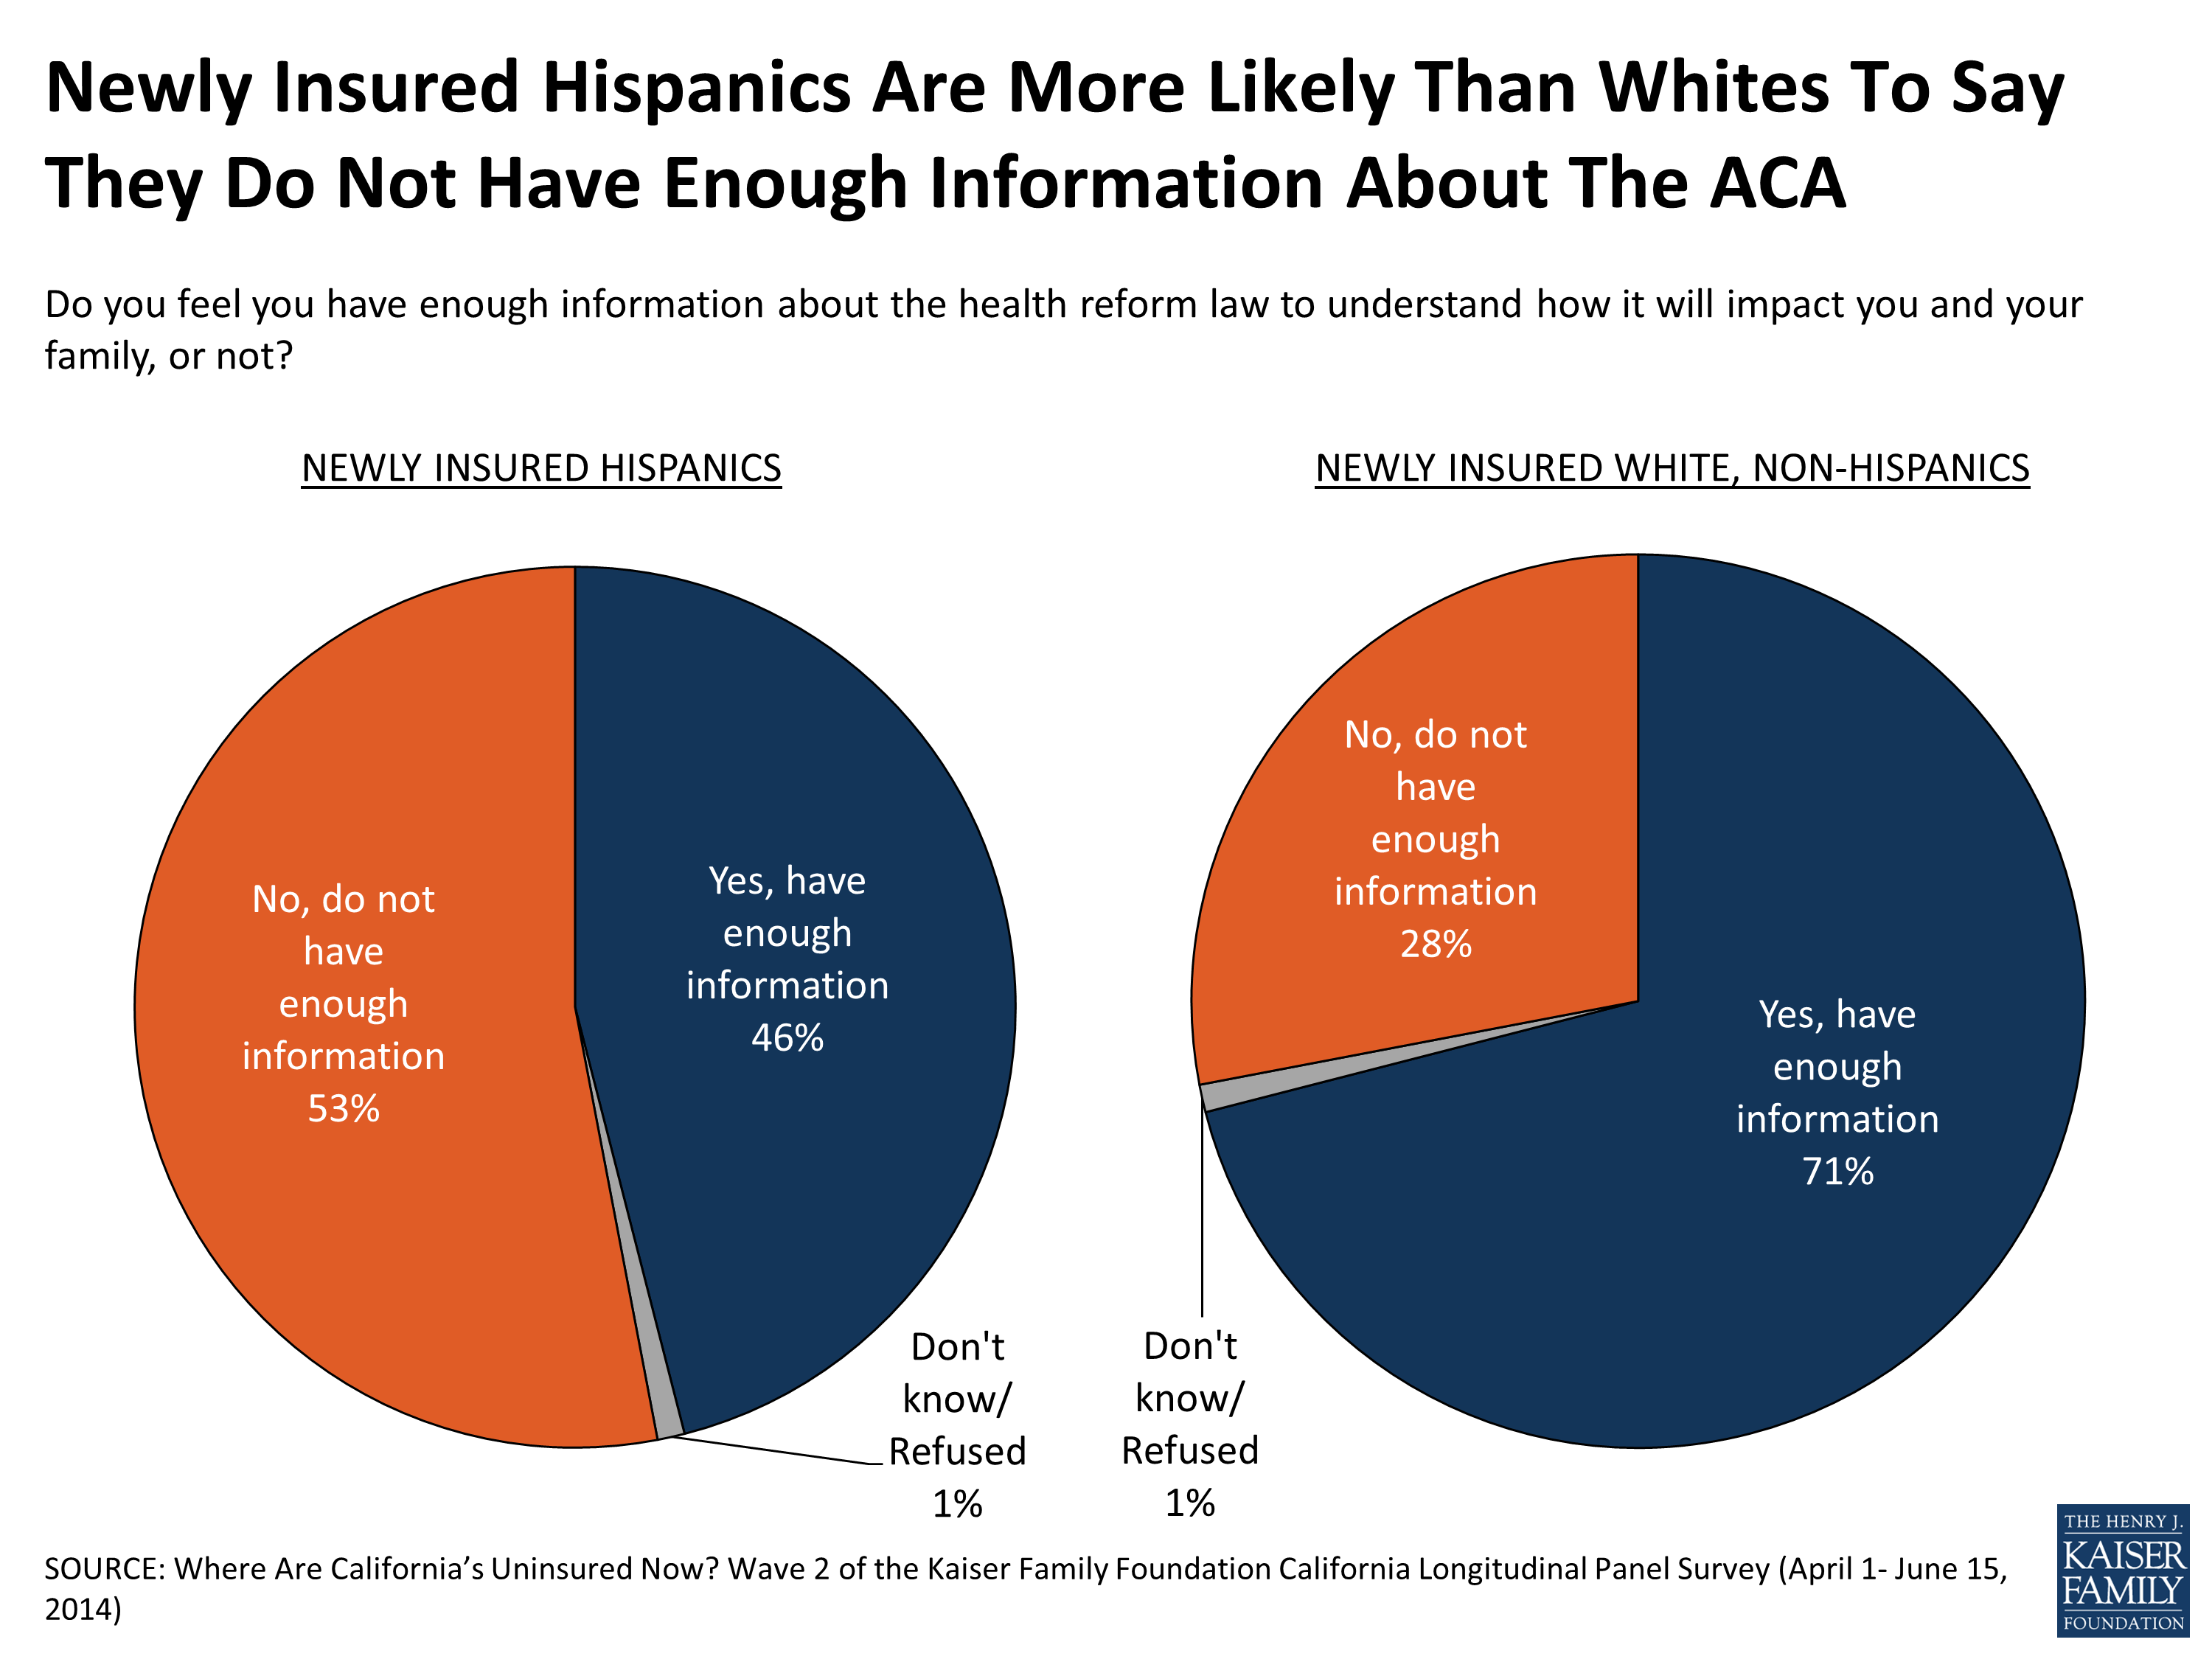
Figure 24
Section 3: The Remaining Uninsured
Who Remained Uninsured?
As many previously uninsured Californians gained coverage, 42 percent remained uninsured. Many of the remaining uninsured have tenuous links to health insurance posing challenges for future enrollment efforts. Forty-five percent of the remaining uninsured reported in the baseline survey that they had been without health insurance for two or more years (Figure 25) and an additional 37 percent said they have never had insurance. Hispanics make up 62 percent of the remaining uninsured and nearly half of them (29 percent) are undocumented Hispanics who are not eligible for Medi-Cal or assistance through Covered California. About 4 in 10 (39 percent) report family income that put them in the group likely eligible for Medi-Cal and another quarter (24 percent) are likely eligible for financial assistance through Covered California.1 These shares reflect the demographics of people who were uninsured prior to the first ACA open enrollment period and did not get coverage during the open enrollment period. Others may have been covered prior to open enrollment but now uninsured – a group not captured by this survey.
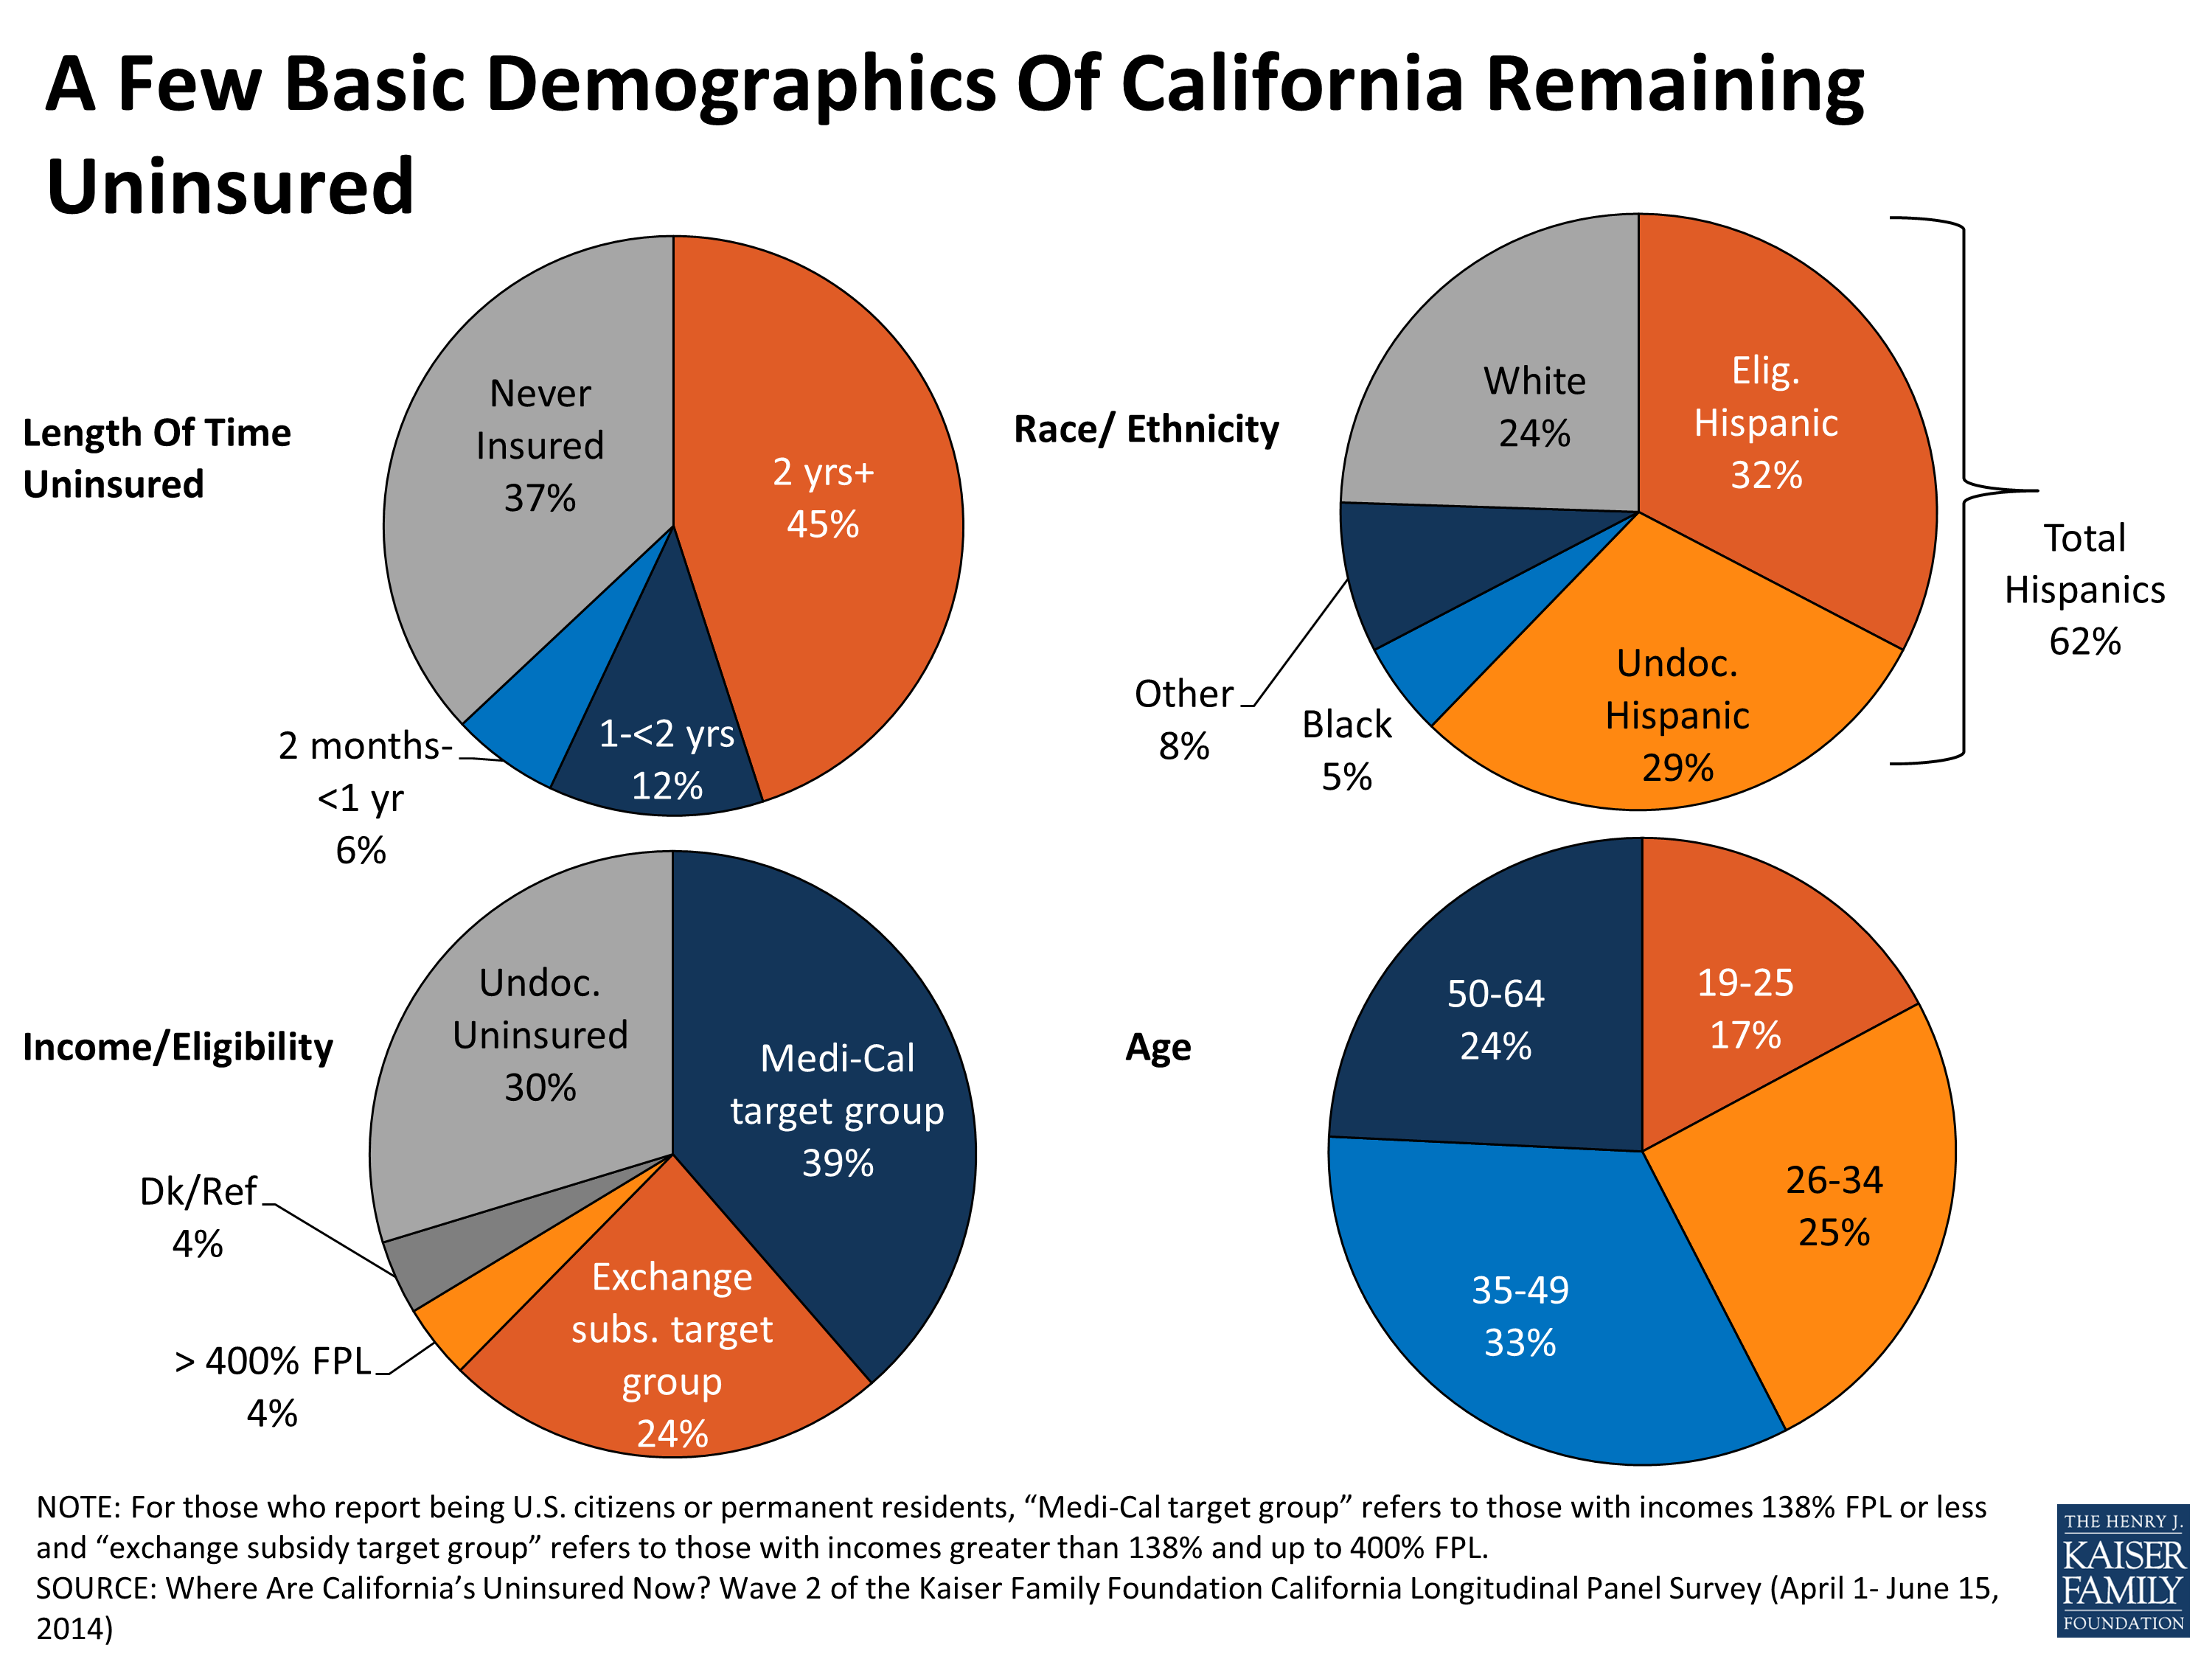
Figure 25
Why Did They Remain Uninsured?
Why did 42 percent of California’s uninsured prior to open enrollment remain without coverage? Most of the remaining uninsured seem to value insurance, with majorities saying it is something they need (71 percent) and that it is worth the costs (59 percent) (Figure 26). Still roughly 3 in 10 of the remaining uninsured say they can get by without insurance (28 percent) or don’t feel coverage is worth the price (33 percent), including 4 in 10 (40 percent) of those who are likely eligible for coverage through Covered California or Medi-Cal due to their self-reported income level and immigration status.
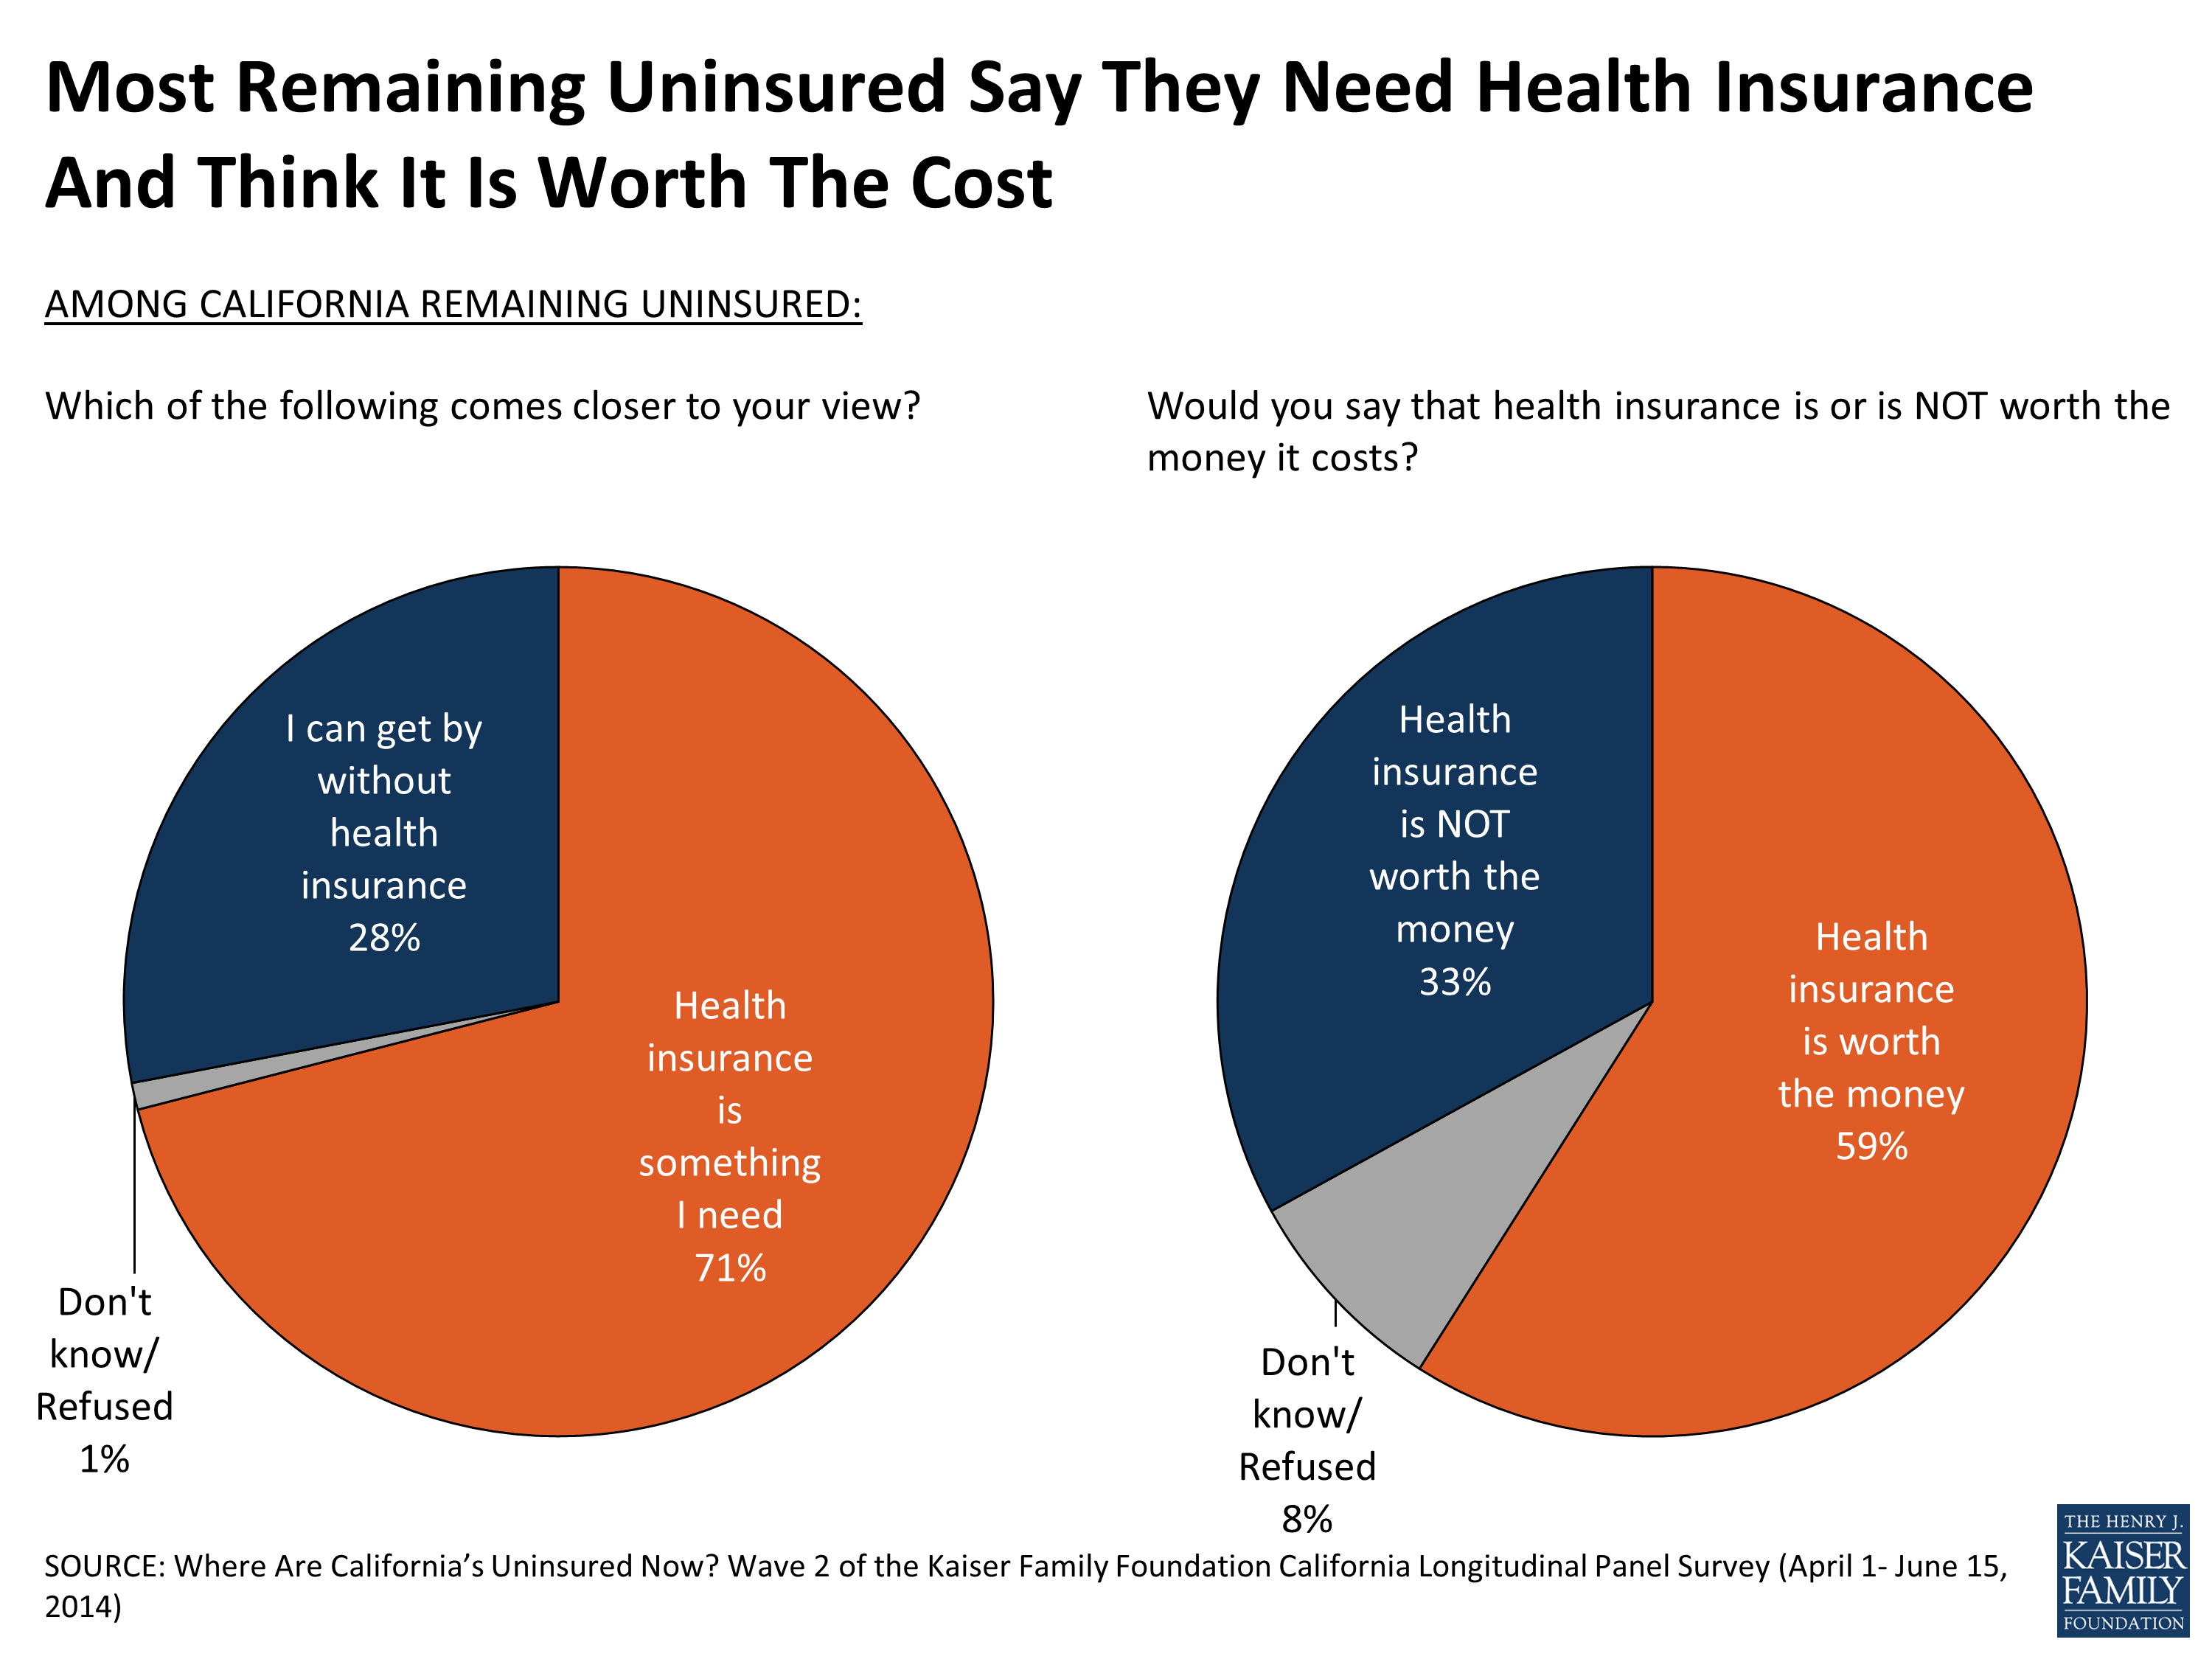
Figure 26
The cost of insurance (whether perceived or actual) remains a barrier. When asked in their own words why they didn’t get coverage, one-third (34 percent) point to costs as the reason. Fifteen percent say they don’t qualify or don’t think they do, including 9 percent who say they can’t enroll or are worried about signing up because of their immigration status. Other reasons the remaining uninsured give for not signing up for coverage include not having yet tried or being too busy (9 percent), not having enough information about enrolling (9 percent), having tried but not being successful (8 percent), and not wanting or needing coverage (7 percent) (Figure 27). A few (6 percent) say they didn’t get insurance because of issues associated with the application process, including three percent who say they are still awaiting contact or approval – a finding that is perhaps related to the large backlog of about 900,000 Medi-Cal applicants waiting for counties across the state to process their applications.2
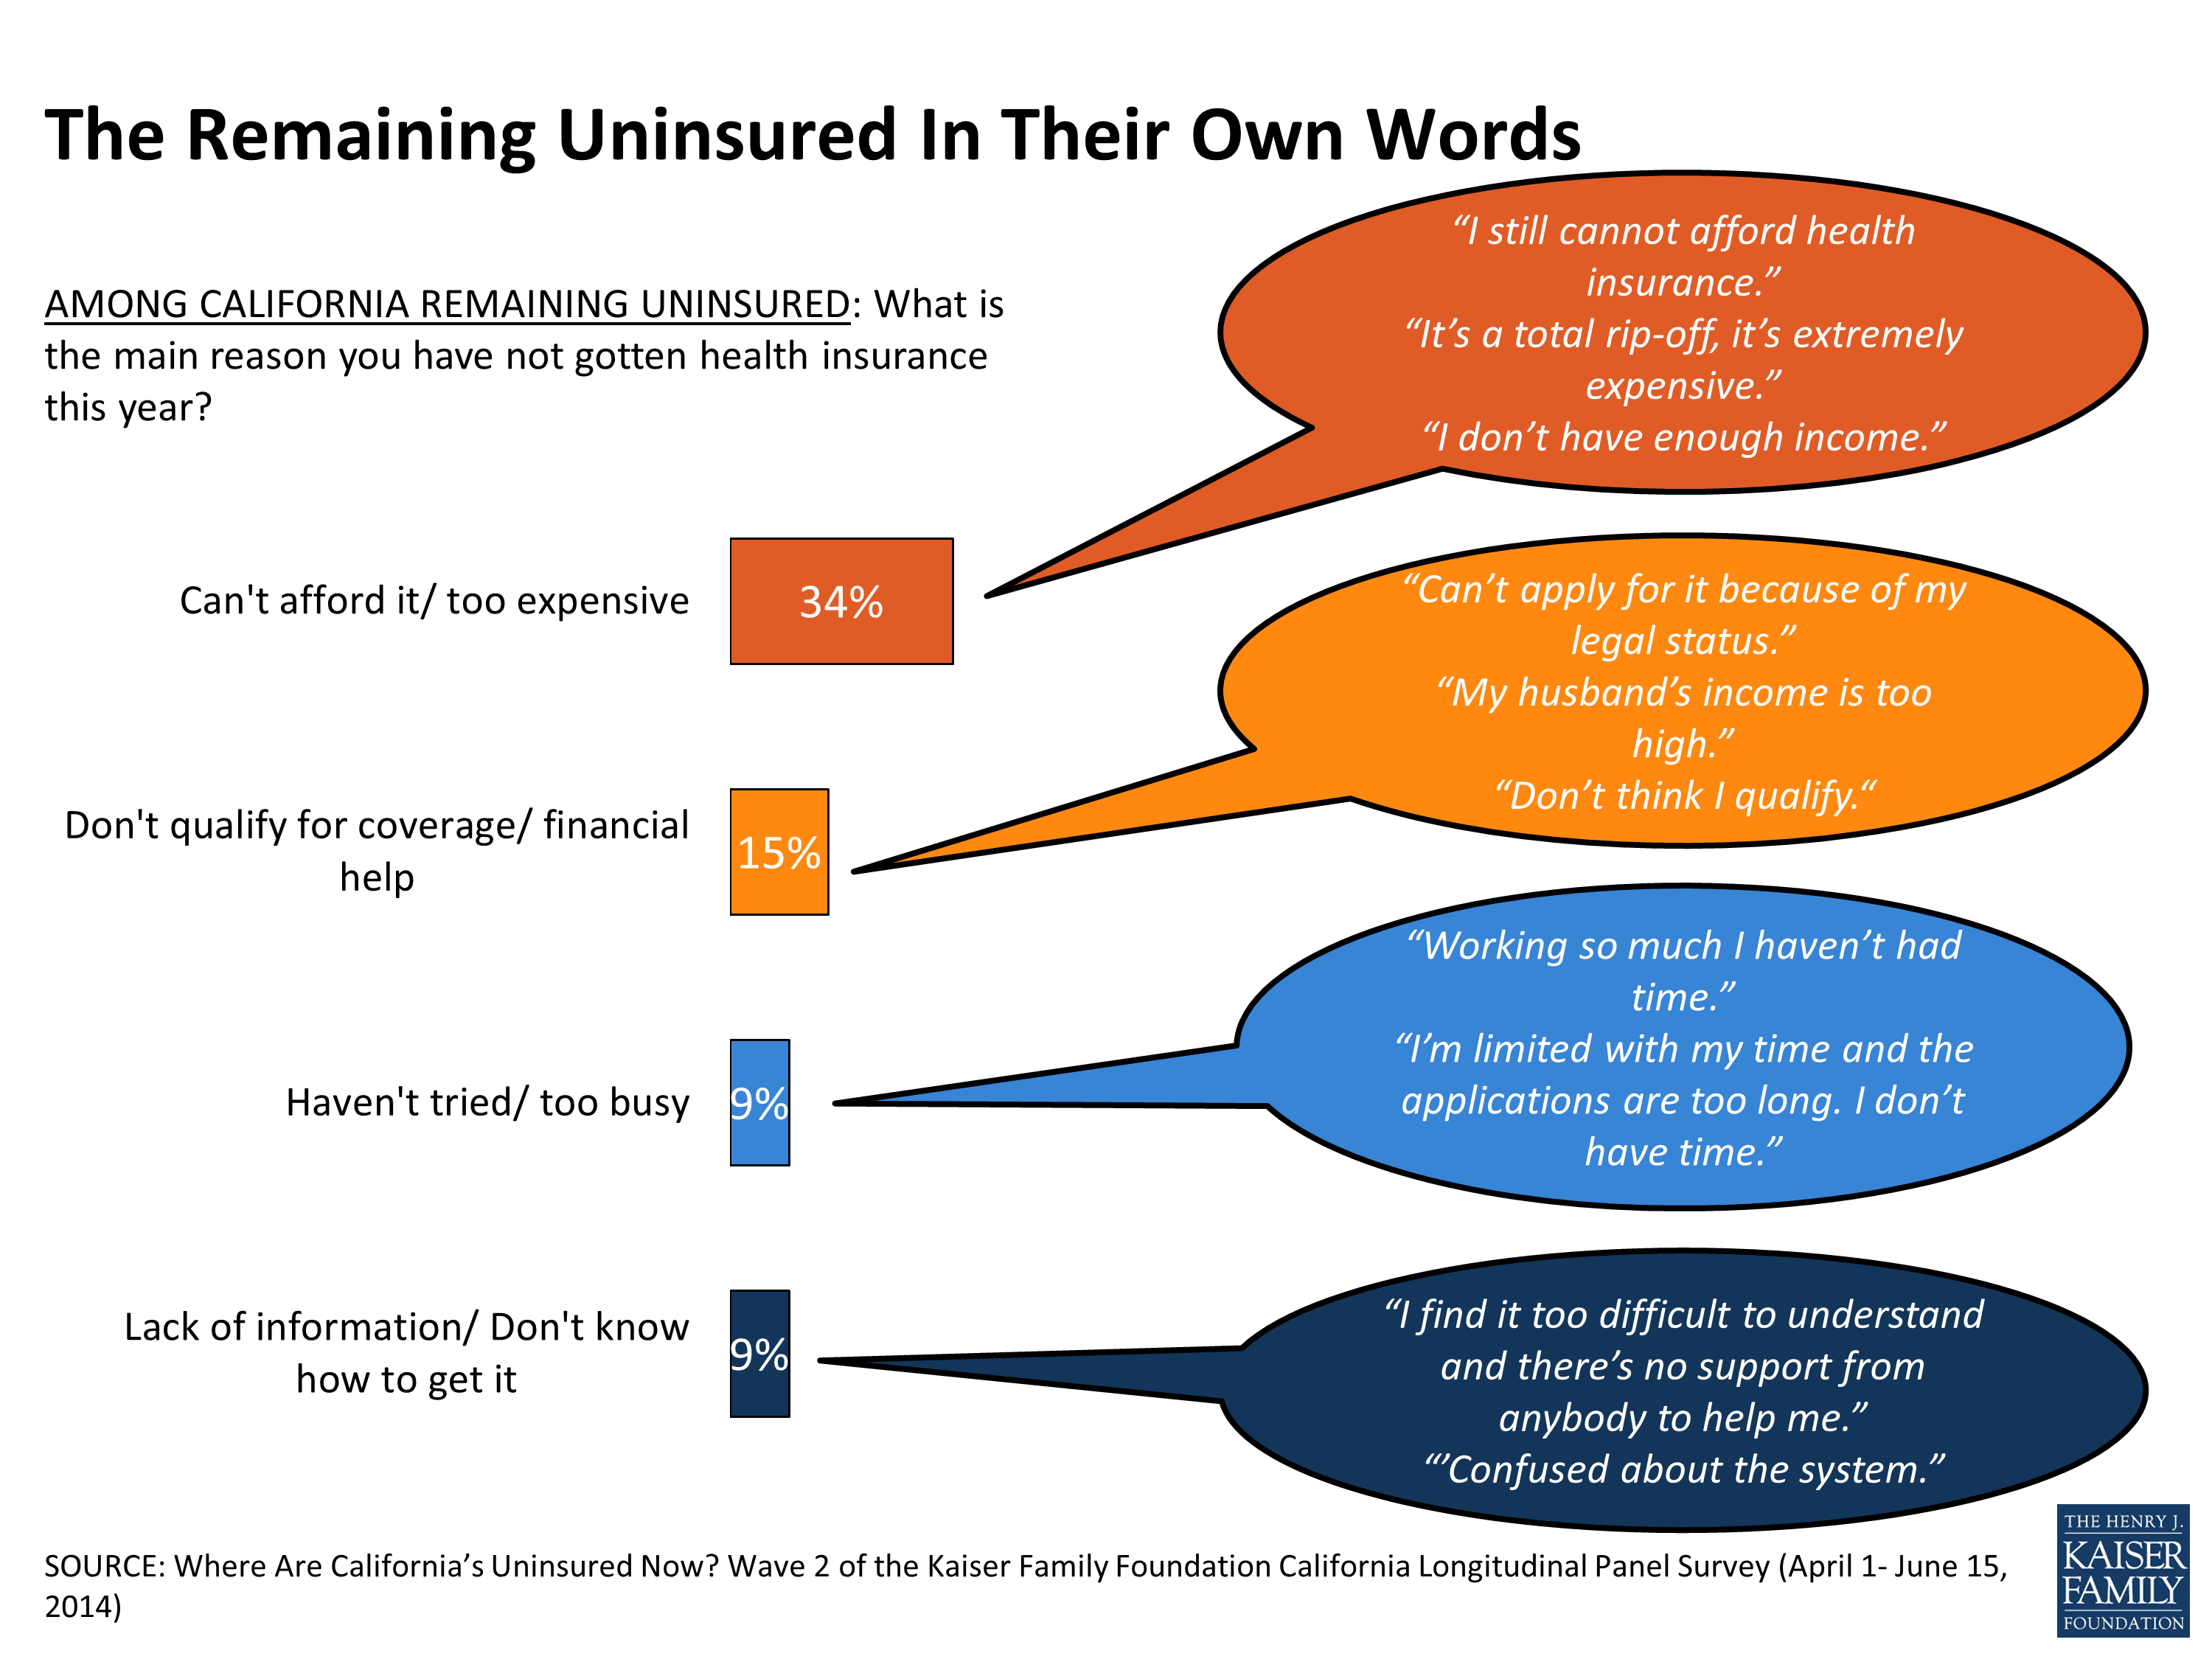
Figure 27
Do They Think They Will Get It Later?
Although they missed the ACA’s first open enrollment period, almost 6 in 10 (57 percent) of the remaining uninsured think they will enroll in a plan later this year, while 3 in 10 (31 percent) think they will continue to go without health insurance (Figure 28). More than 7 in 10 (73 percent) of the remaining uninsured who are likely eligible for Medi-Cal say they plan to enroll later this year, compared to about half of those in the exchange target group (51 percent). Of those who see coverage in their future, 57 percent are uncertain where they will get insurance, and small shares say they expect to get it from Medi-Cal (15 percent), an employer (13 percent), or through Covered California (11 percent).
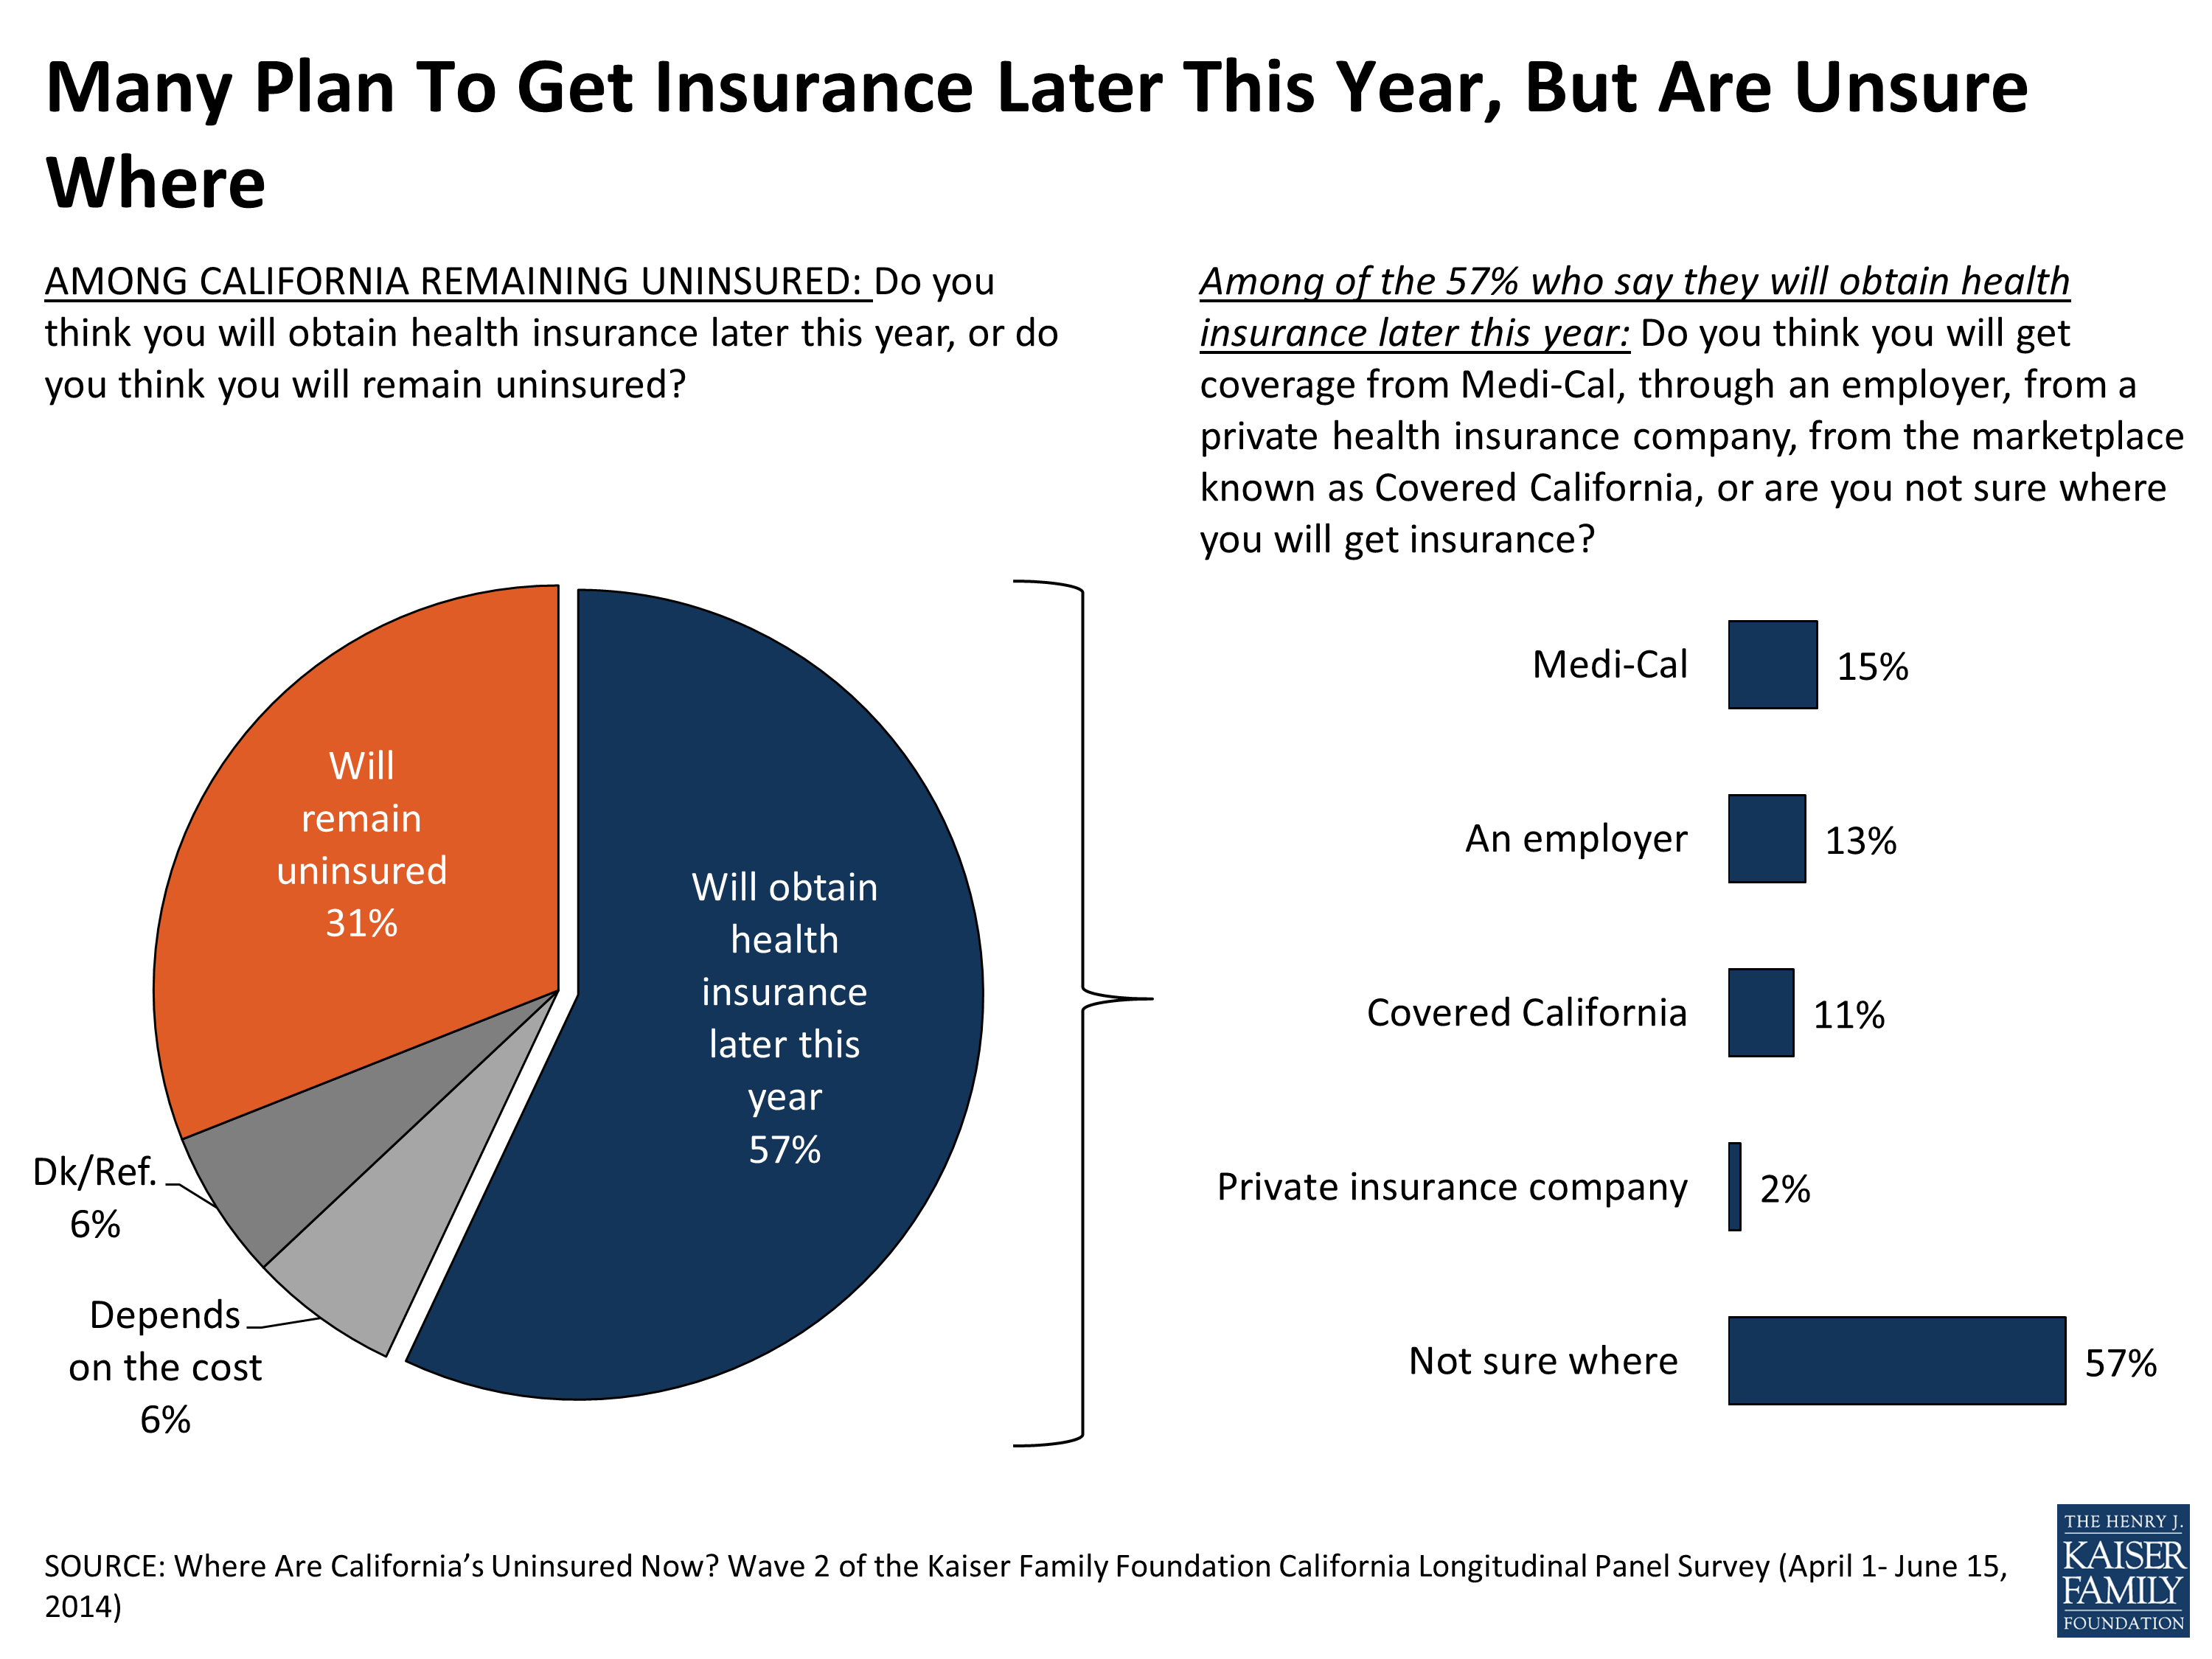
Figure 28
Some may in fact be able to enroll in coverage before the next Covered California open enrollment period. People eligible for Medi-Cal may sign up any time of the year, and others with qualifying events such as marriage may be able to enroll though Covered California outside of the specified enrollment periods. About half of the remaining uninsured say they are aware that people can still sign up for Medi-Cal (51 percent) or Covered California (54 percent); however it is unclear if they know that enrollment through Covered California is only a possibility if they have had a qualifying life event.
Did They Try To Get Coverage? Why Didn’t They Get It?
Over a third (36 percent) of the remaining uninsured say they have tried to get insurance since the open enrollment period began (Figure 29). Most of those that report trying pursued more than one avenue in their attempt to get coverage. Nearly a quarter (23 percent) of the remaining uninsured say they tried to get coverage through Covered California and 19 percent say they tried to get coverage from Medi-Cal. Smaller shares of the remaining uninsured say they looked directly to private health insurance companies (10 percent), to health insurance agents or brokers (7 percent), and to their employer (5 percent). But they ran into barriers – some remaining uninsured report trying to sign up for non-group insurance and found it too expensive (15 percent) and others were not able to complete the application process (6 percent). Eight percent of the remaining uninsured say they tried to sign up for Medi-Cal and were not eligible for coverage and another 7 percent said they tried to get Medi-Cal but were not able to complete the application process.
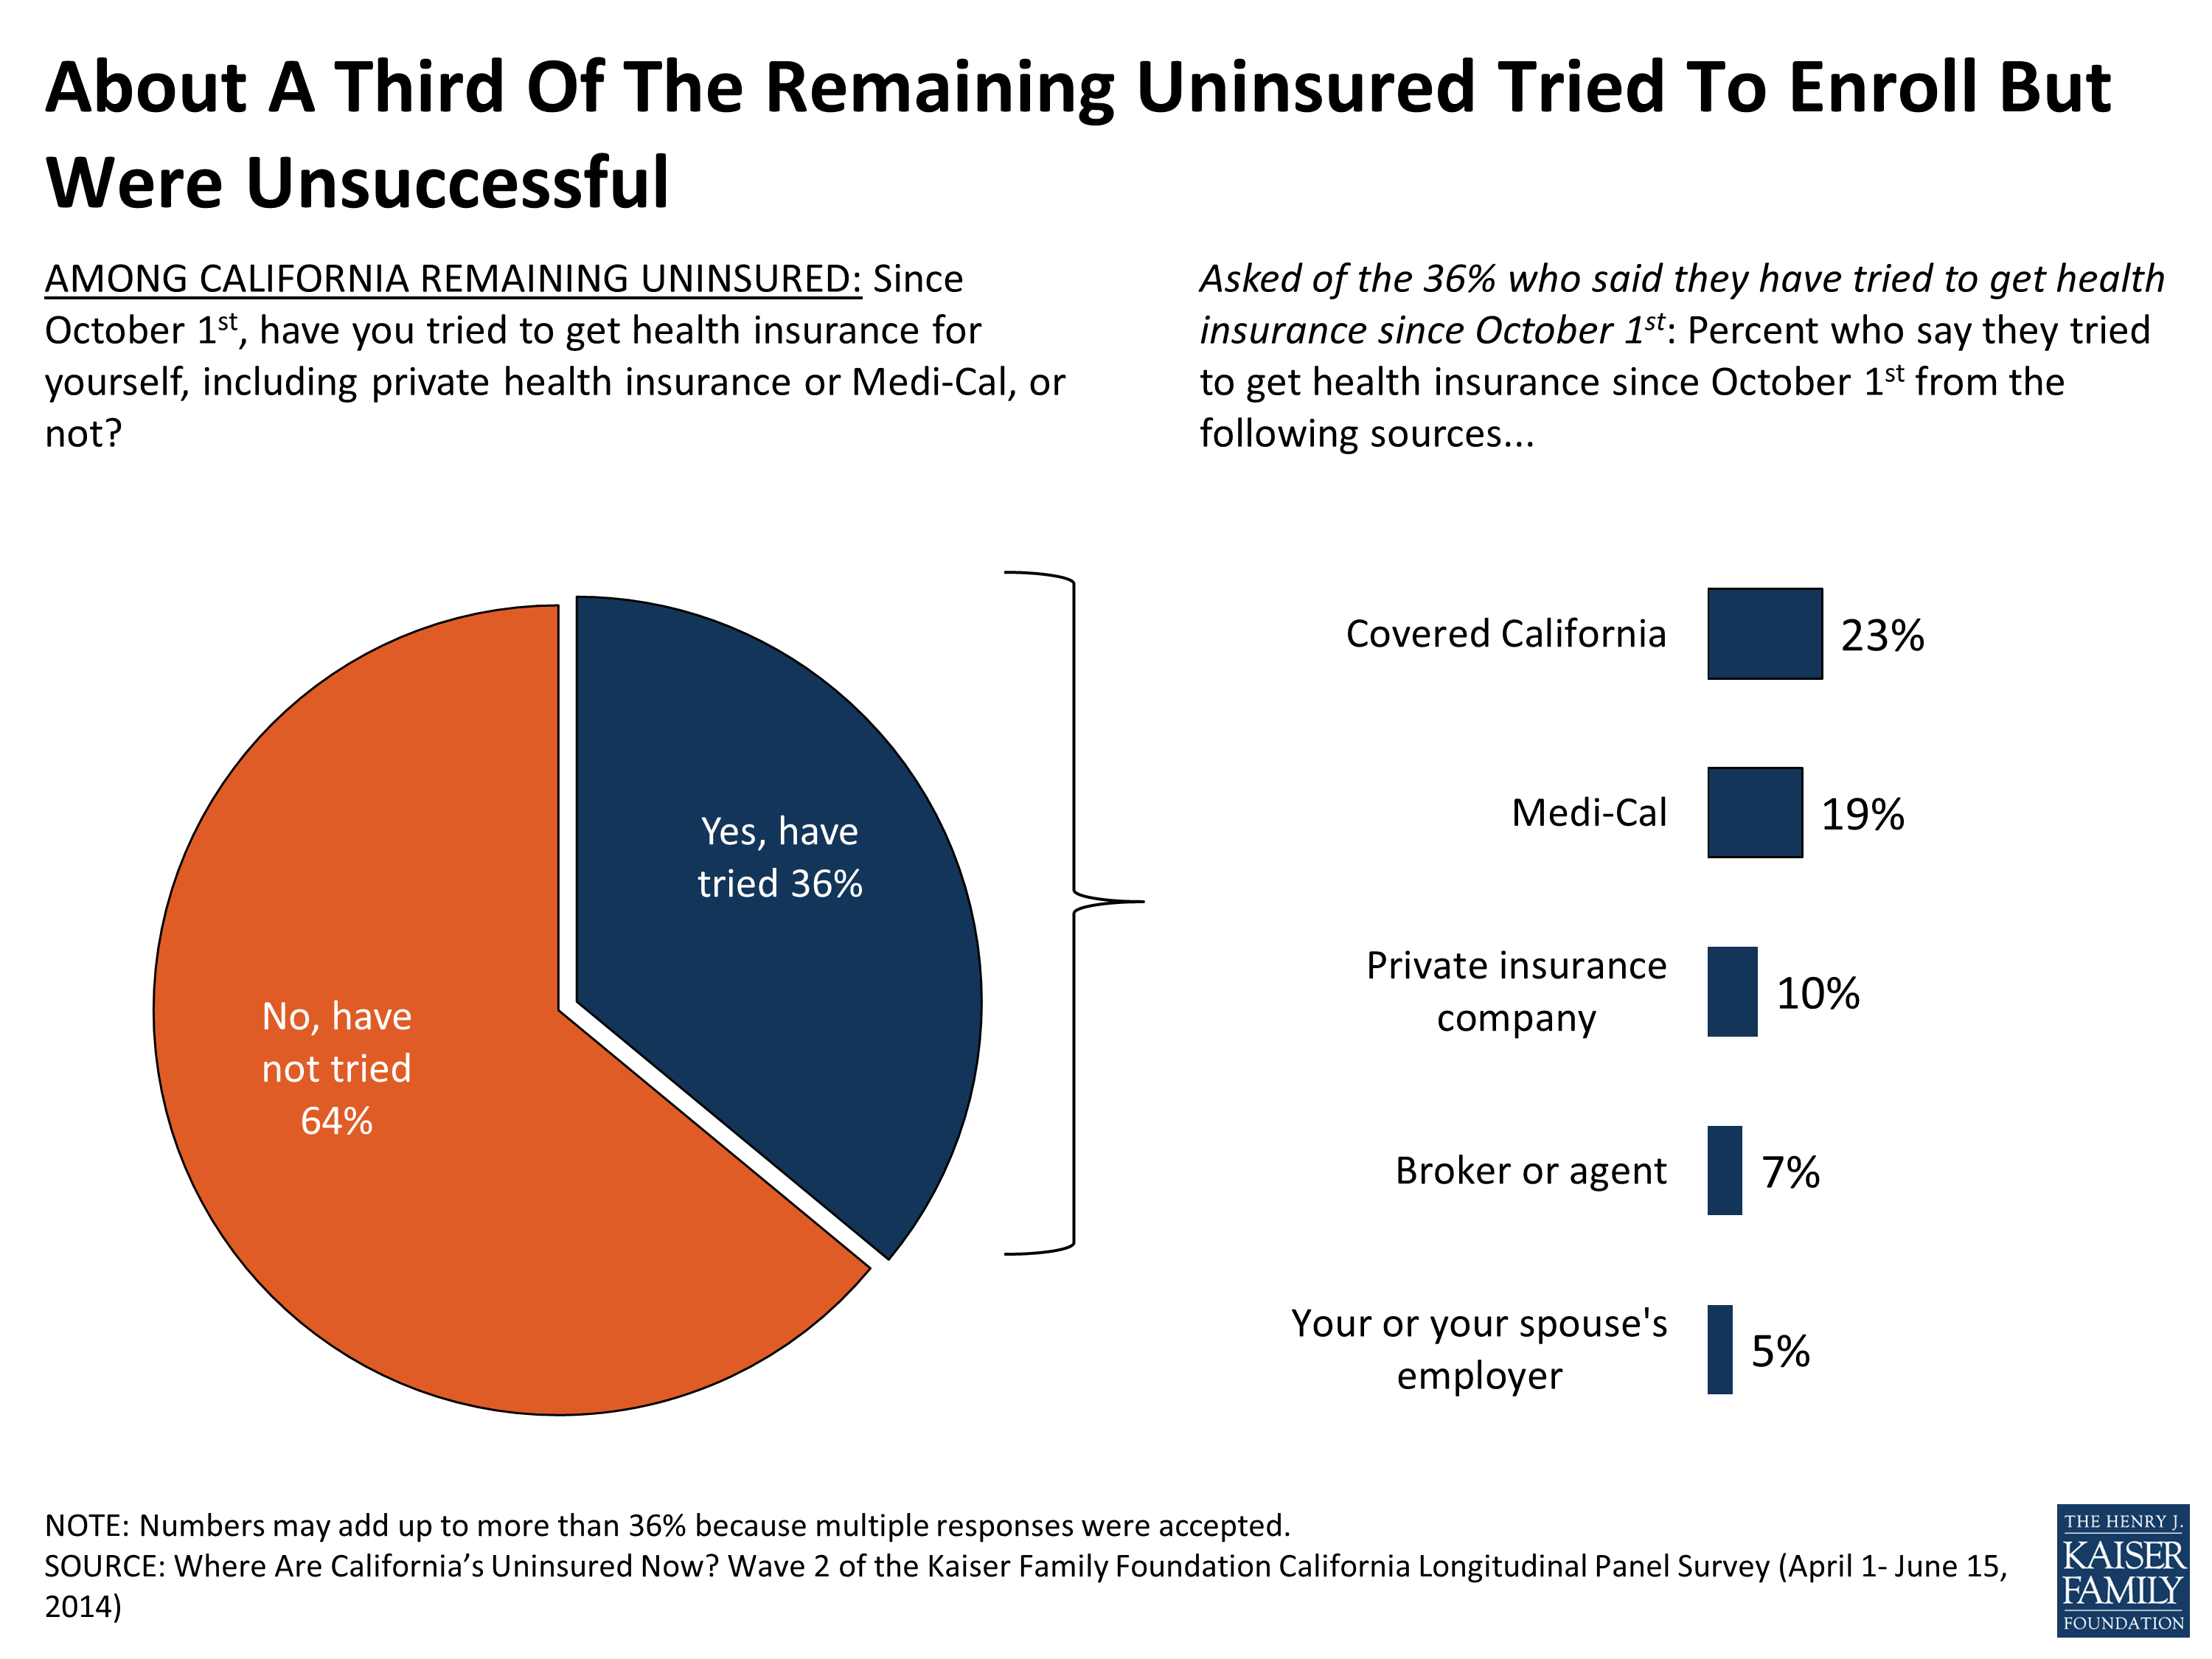
Figure 29
In contrast to those who got insurance, the majority of people who tried to get coverage but remain uninsured say that shopping for coverage was difficult. Those that report trying to get Medi-Cal or non-group coverage say it was hard to find a plan that met their needs (76 percent, or 25 percent of the remaining uninsured overall). Weighing the trade-offs between coverage and costs also proved difficult for most who report attempting to get non-group coverage; roughly 7 in 10 say it was difficult to compare the services the plans covered (71 percent, or 18 percent of remaining uninsured overall), the out-of-pocket costs required to use services (69 percent, or 18 percent of remaining uninsured overall), and the monthly premium payment (67 percent, or 17 percent of remaining uninsured overall). Nearly 6 in 10 (58 percent, or 20 percent of remaining uninsured overall) of those who say they tried to get insurance say it was difficult to find the information they needed about signing up for coverage (Figure 30).
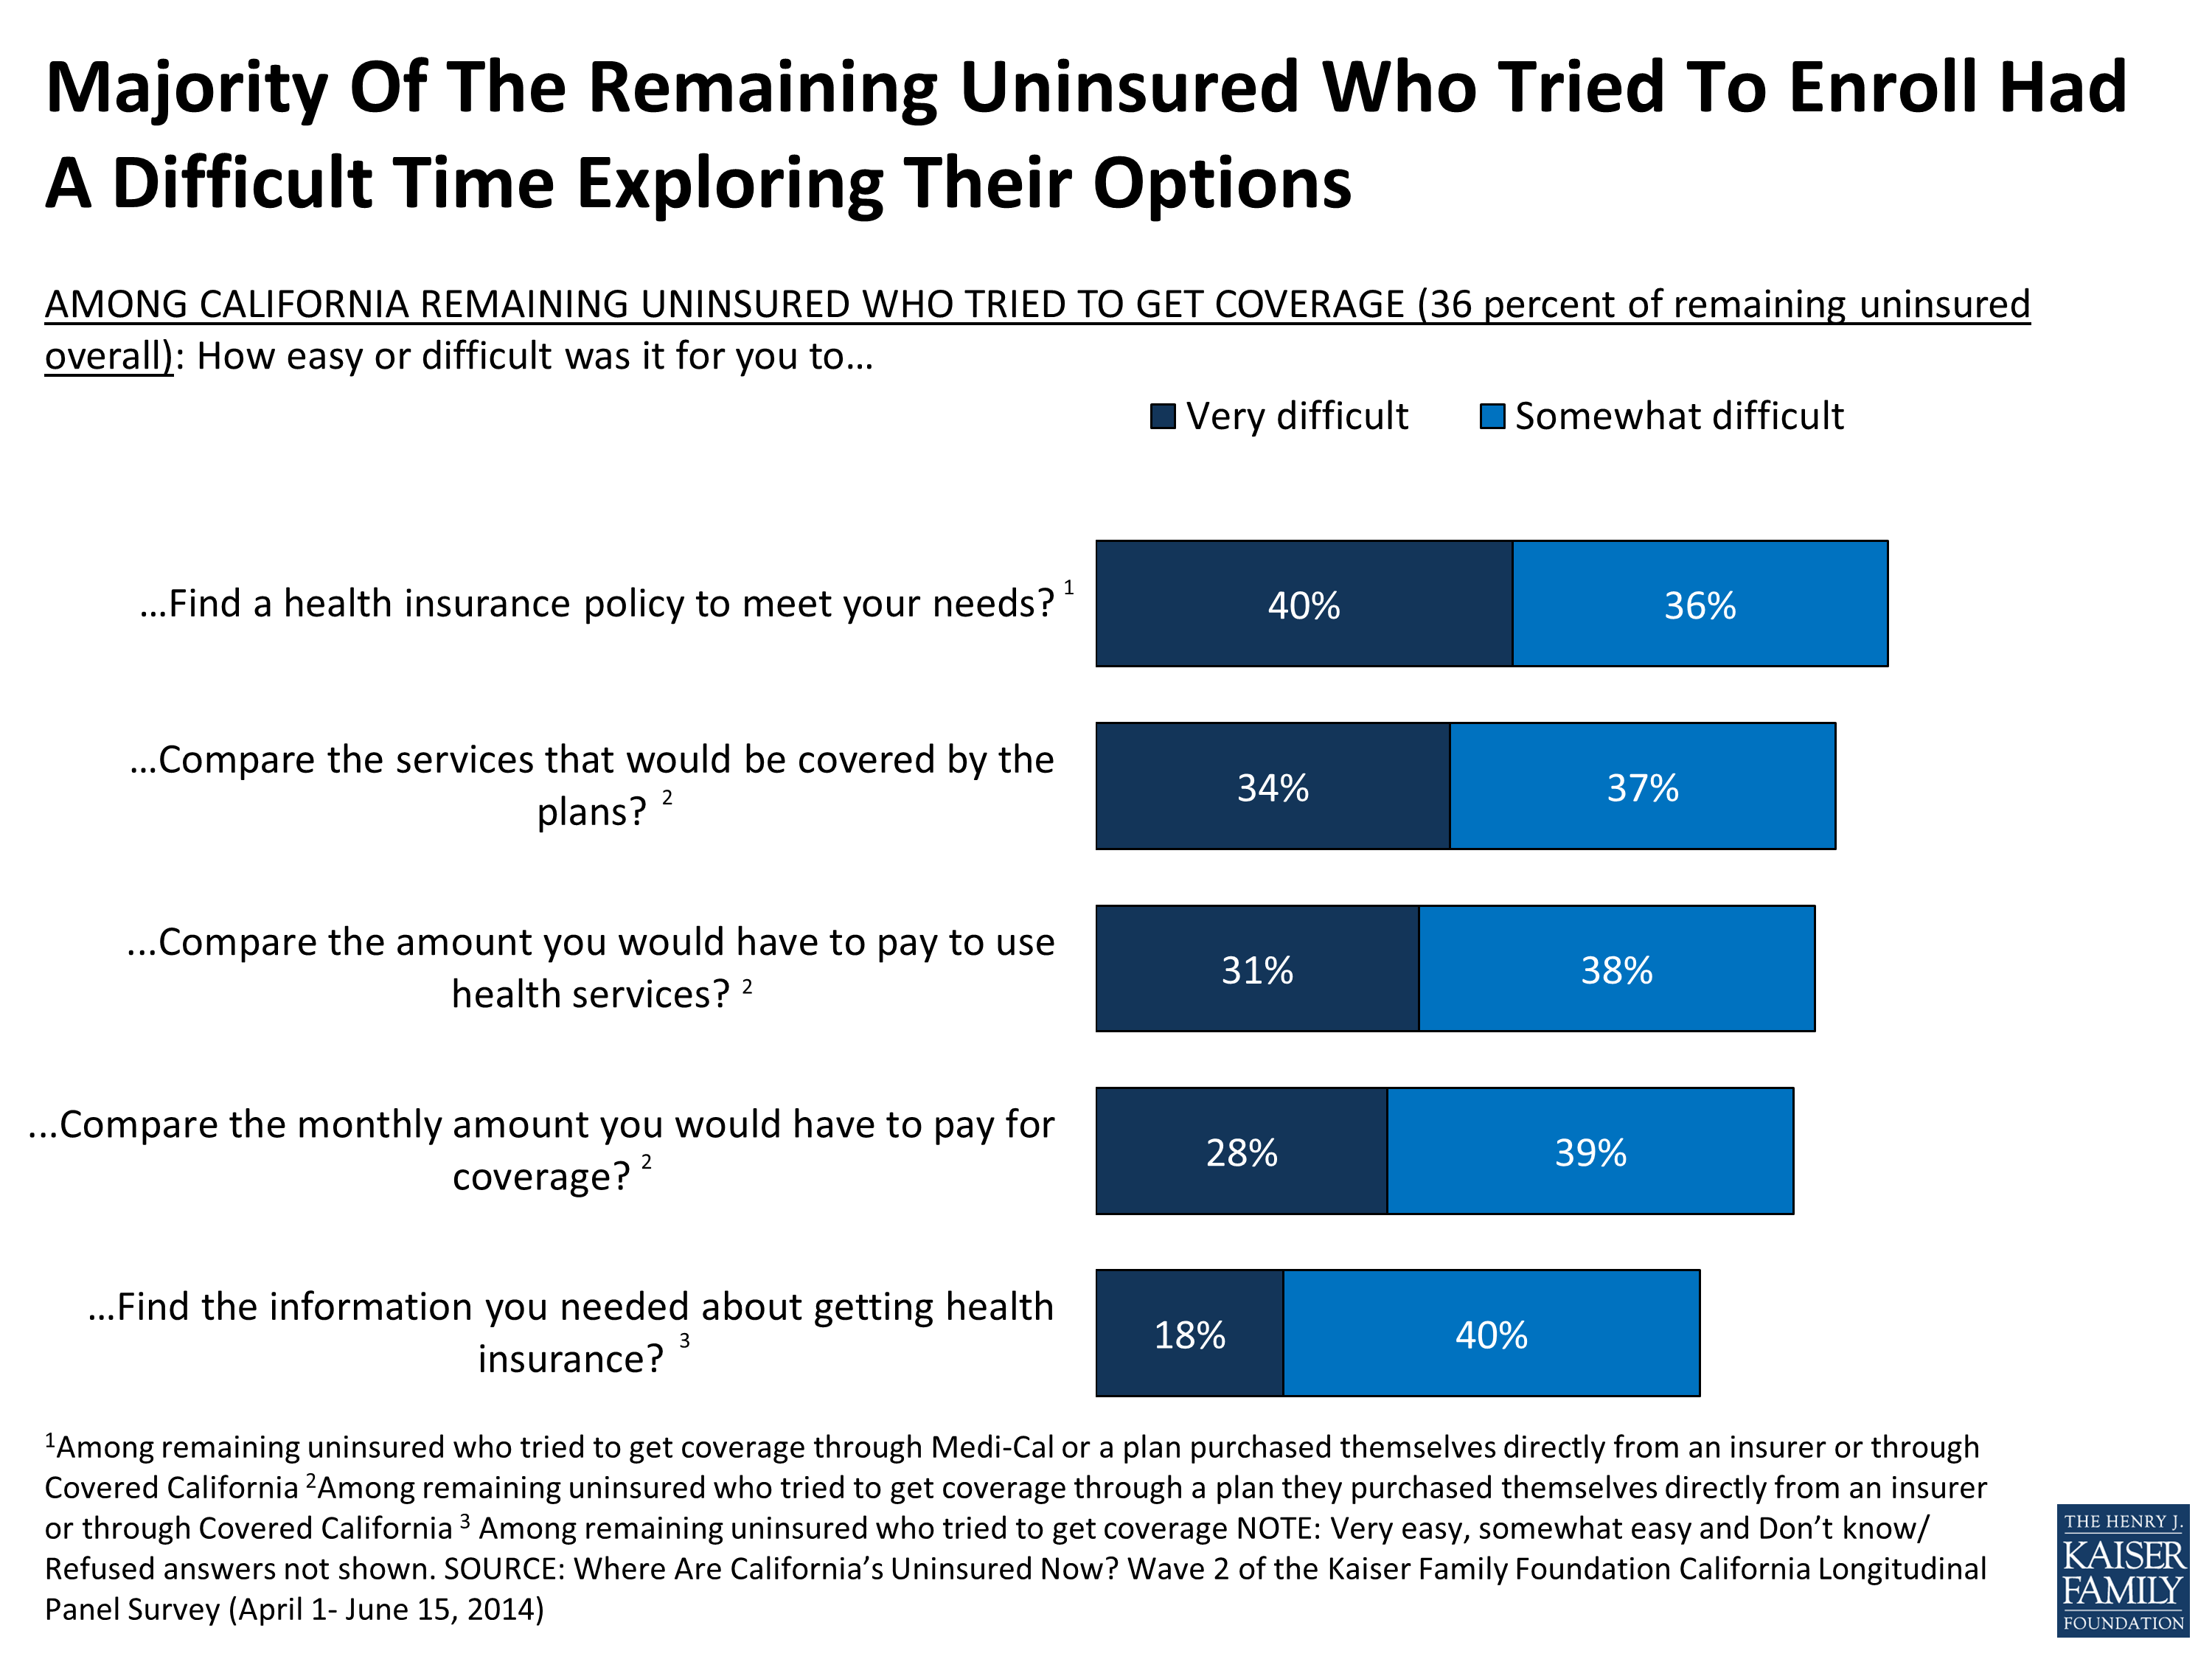
Figure 30
Some of the remaining uninsured report visiting the Covered California website (30 percent) or calling the 1-800 number (15 percent), but unlike those who got insurance, most say they found them unhelpful (65 percent of those who visited website and 66 percent of those who called the 1-800 number).
Are The Remaining Uninsured Aware Of Coverage Options?
Eight in ten (81 percent) of the remaining uninsured are aware of the requirement to buy health insurance under the ACA, and most (65 percent) think the mandate applies to them (Figure 31). The remaining uninsured are divided on whether or not they’ll have to pay a fine this year with 44 percent saying they think they will be penalized and 43 percent saying they won’t. Many, in fact, may be exempt due to financial hardship or other exceptions under the law.
Other provisions are less widely recognized, including the parts of the law that may benefit the remaining uninsured most. For example, 6 in 10 remaining uninsured say they are aware of the Medi-Cal expansion (58 percent), and a similar share say they are aware the law provides financial assistance to help low and moderate income Americans (60 percent), leaving roughly 4 in 10 unaware of these aspects of the law that may open doors for them to access coverage (Figure 31).
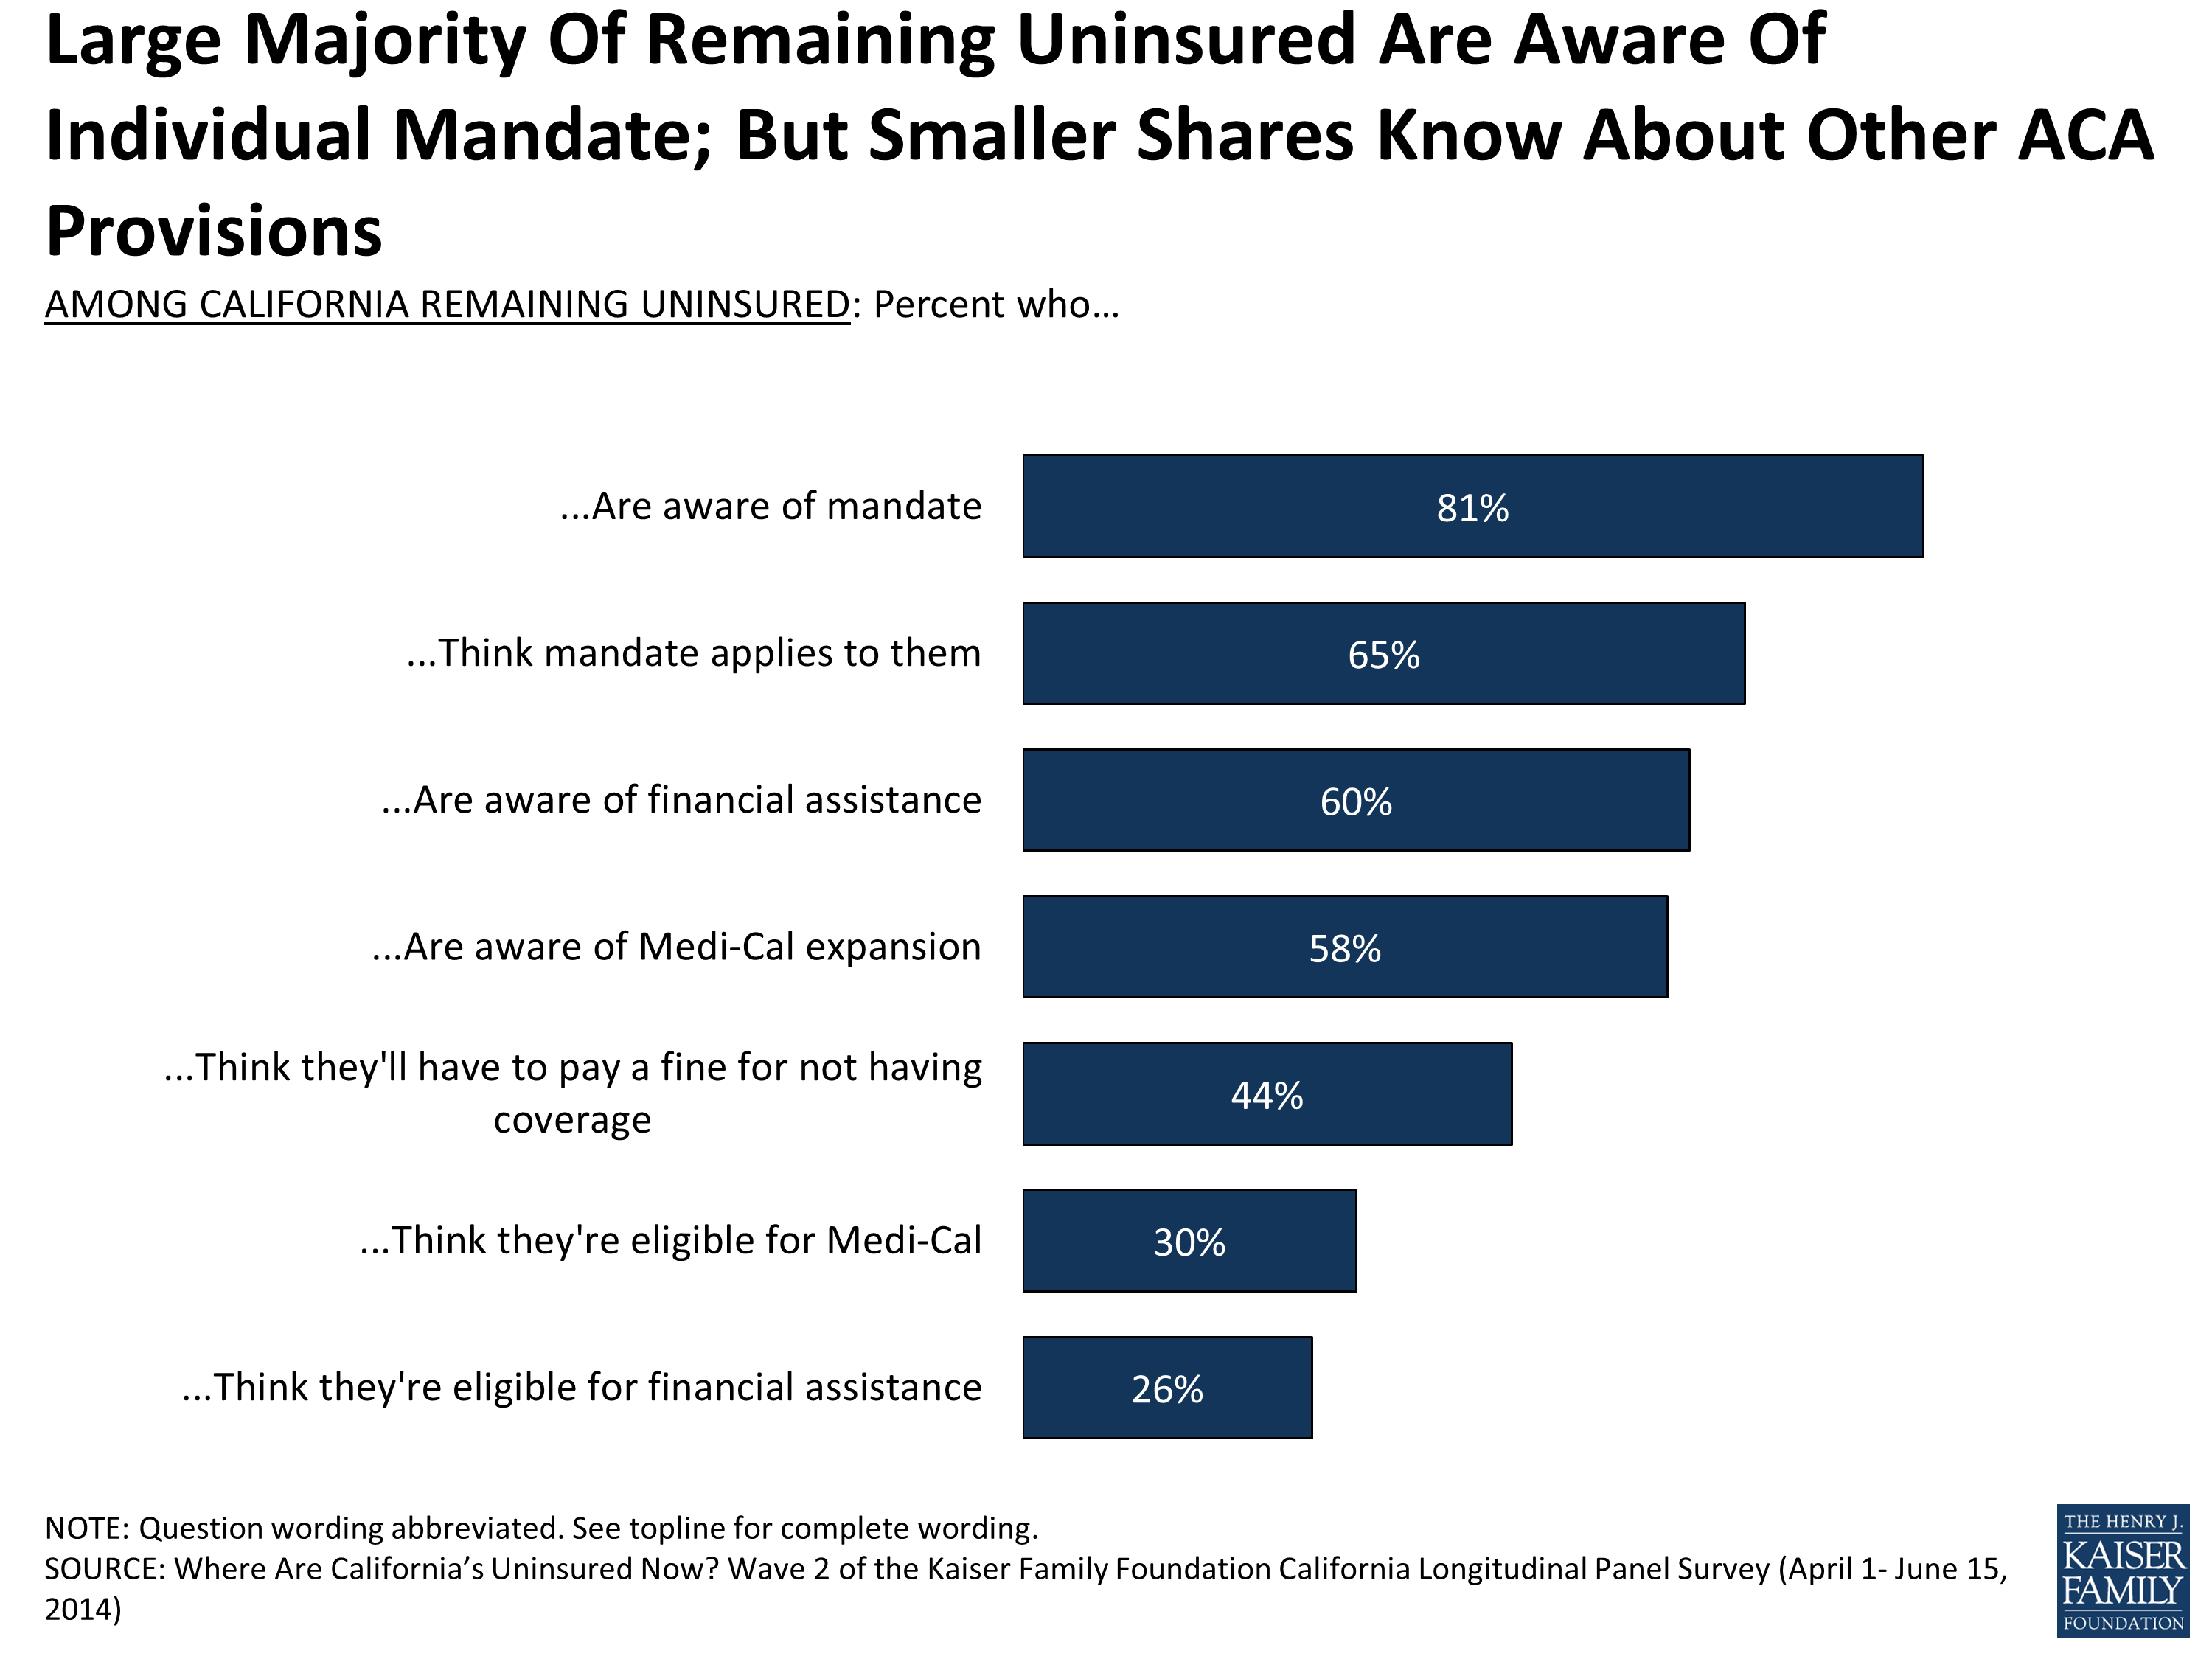
Figure 31
On a more personal level, 6 in 10 (61 percent) of the remaining uninsured say they are lacking information on how the law will impact them (Figure 32). Confusion about what assistance they may be eligible for is also widespread. Less than half (43 percent) of those likely eligible for Medi-Cal think they would qualify for the program. Of those in the group potentially eligible for subsidies through Covered California, about 3 in 10 (29 percent) think they are eligible for assistance.
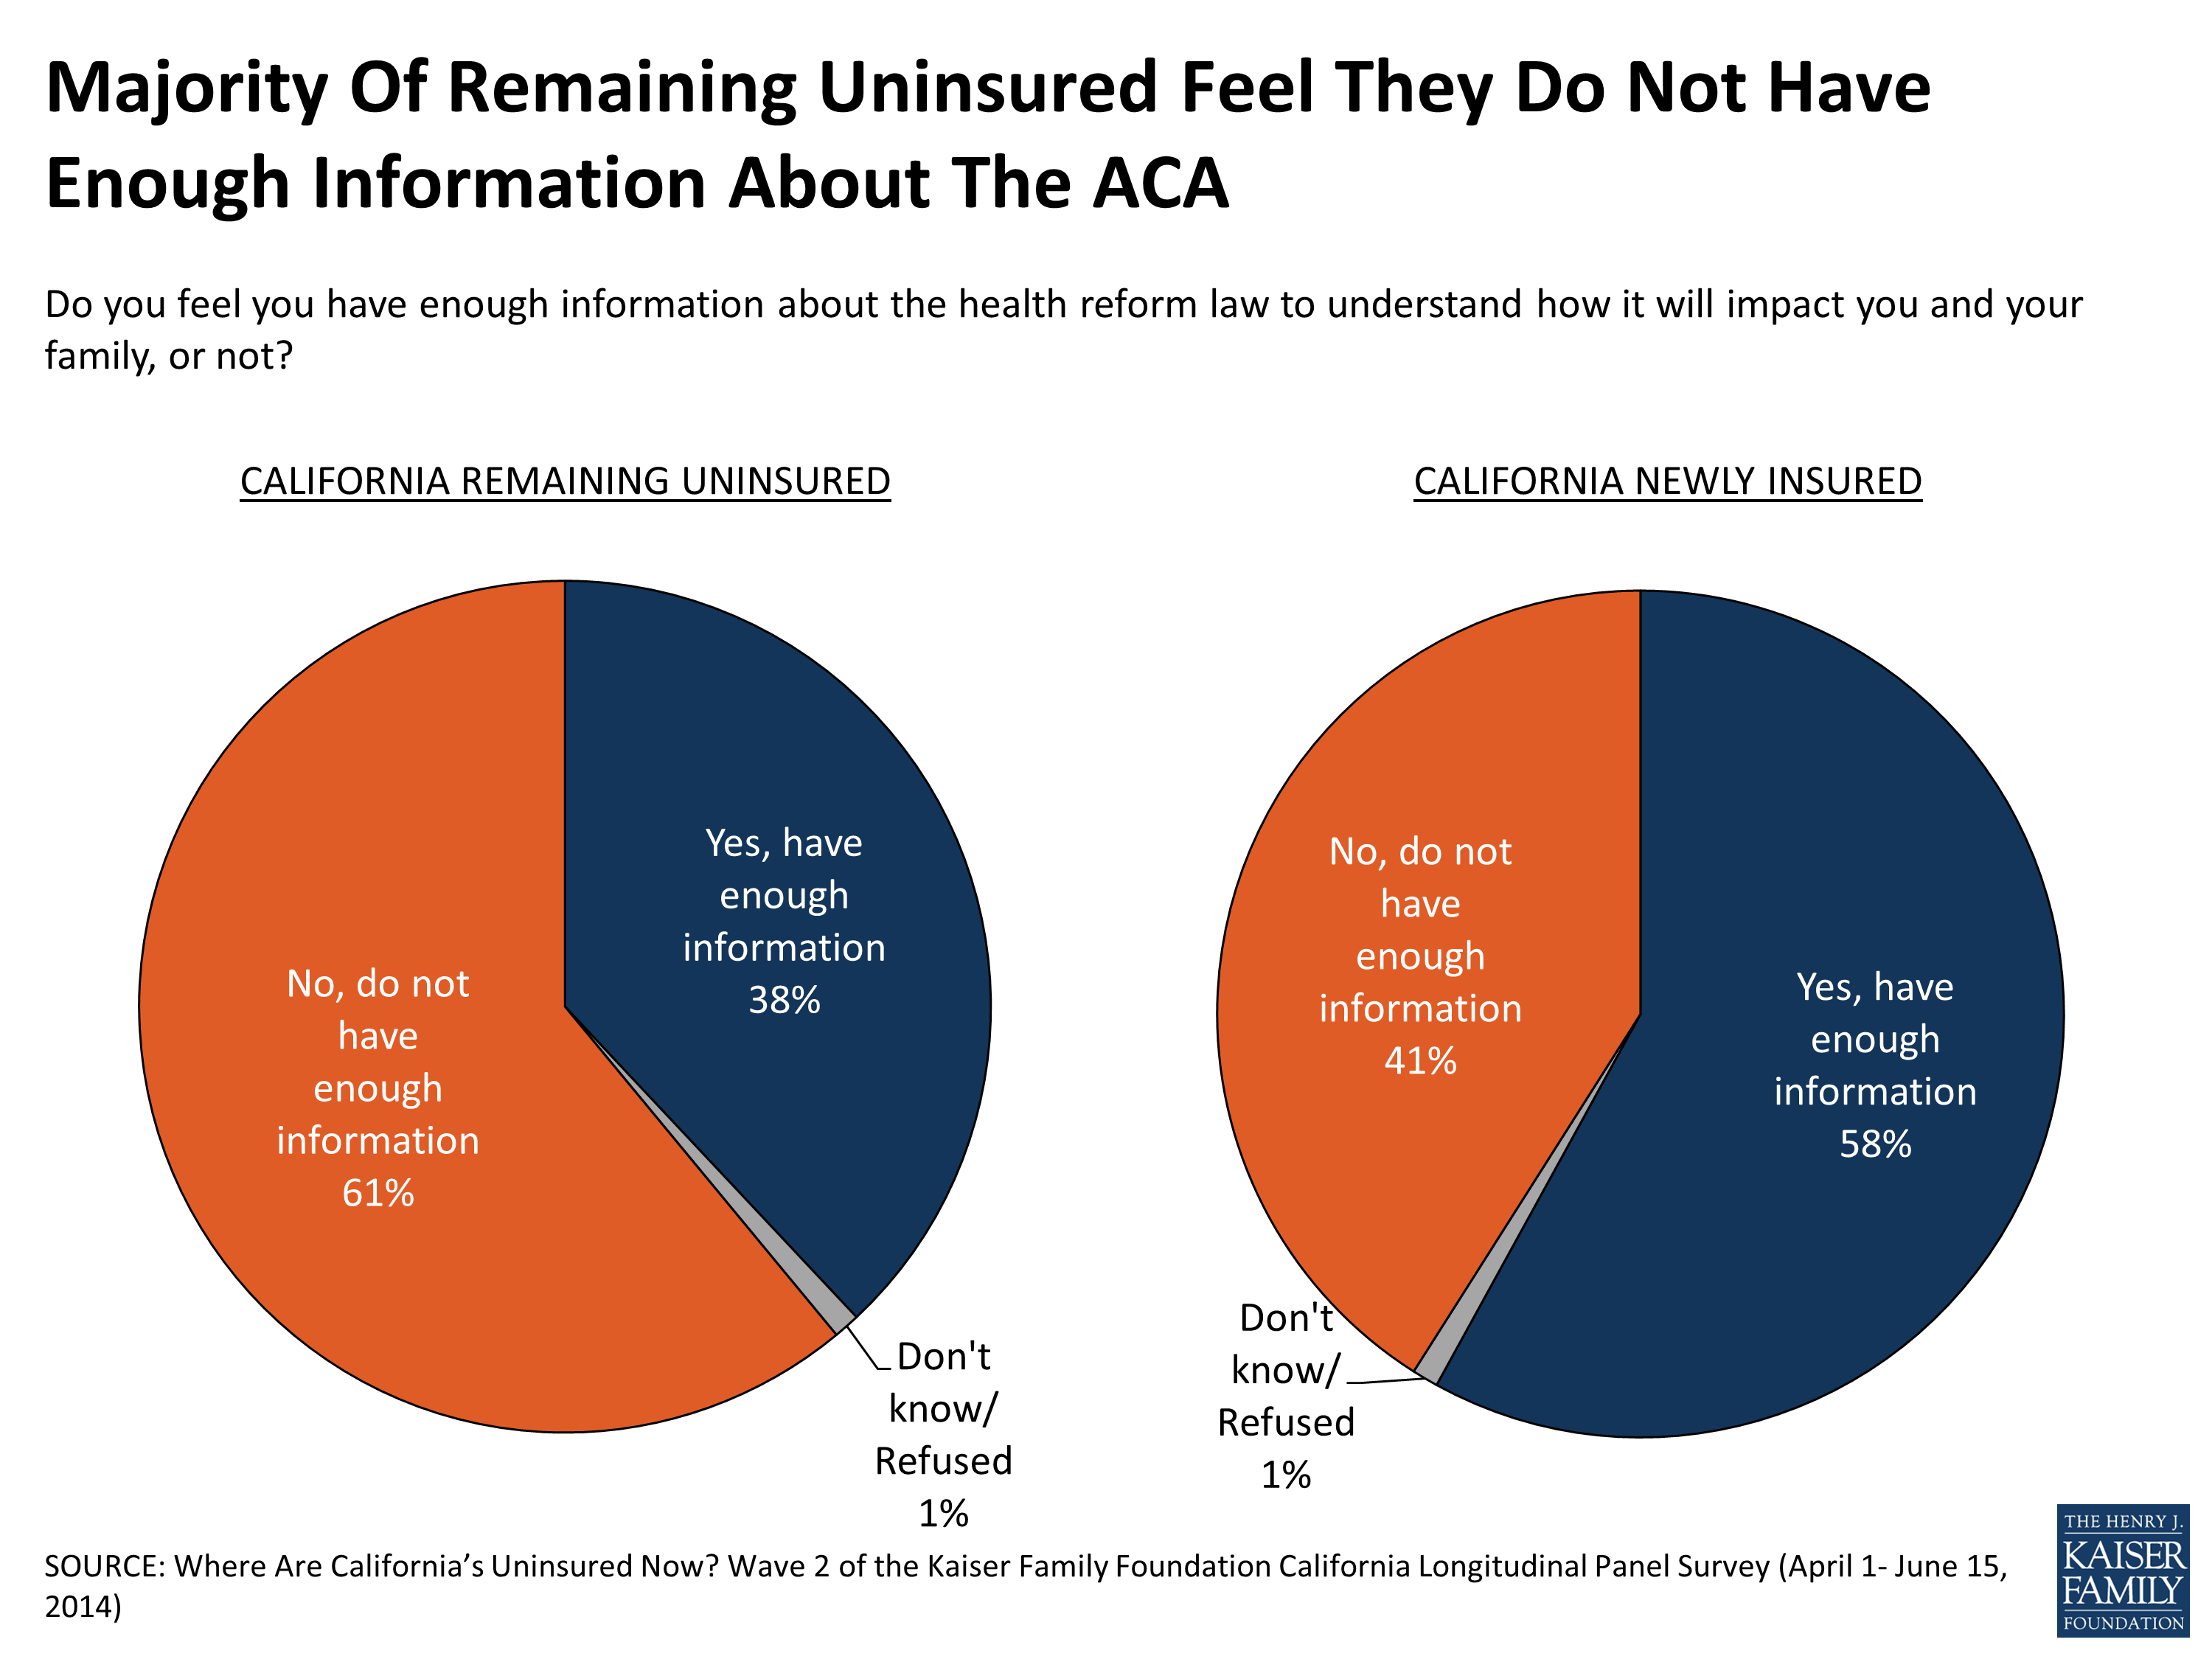
Figure 32
Remaining Uninsured Hispanics
Forty-eight percent of Hispanics who were uninsured prior to open enrollment report remaining uninsured, and almost half of these remaining uninsured Hispanics (46 percent) may not be eligible for coverage under the ACA due to their immigration status (22 percent of previously uninsured Hispanics overall) (Figure 33). As a result, many worry about the potential link between health insurance and immigration authorities. Over half (54 percent) of Hispanics who remain uninsured, particularly those who prefer to communicate in Spanish or are undocumented themselves (69 percent or 73 percent, respectively), say they are worried that getting coverage will draw attention to their families immigration status (Figure 34), and despite the Administration’s assurance otherwise3 many worry it could result in deportation. Seven in 10 remaining uninsured Hispanics who say they were born outside the U.S. (72 percent, or 52 percent of remaining uninsured Hispanics overall) say they are worried that signing up for health insurance could hurt their ability to become a U.S. citizen, including half (51 percent) who say they are very worried.
| Figure 33: Demographics Of Remaining Uninsured Hispanics | |
| REMAINING UNINSURED HISPANICS | |
| AGE | |
| 19-34 | 41% |
| 35-49 | 40 |
| 50-64 | 18 |
| LANGUAGE OF INTERVIEW | |
| English | 30 |
| Spanish | 70 |
| LENGTH OF TIME UNINSURED | |
| 2 months to less than a year | 6 |
| 1 year to less than 2 years | 9 |
| 2 years or more | 38 |
| Never had insurance | 46 |
| EMPLOYMENT | |
| Employed | 67 |
| Unemployed | 14 |
| A student, retired, on disability and can’t work, or stay at home parent | 20 |
| RESIDENT STATUS | |
| Citizen/ legal immigrant | 52 |
| Undocumented immigrant | 46 |
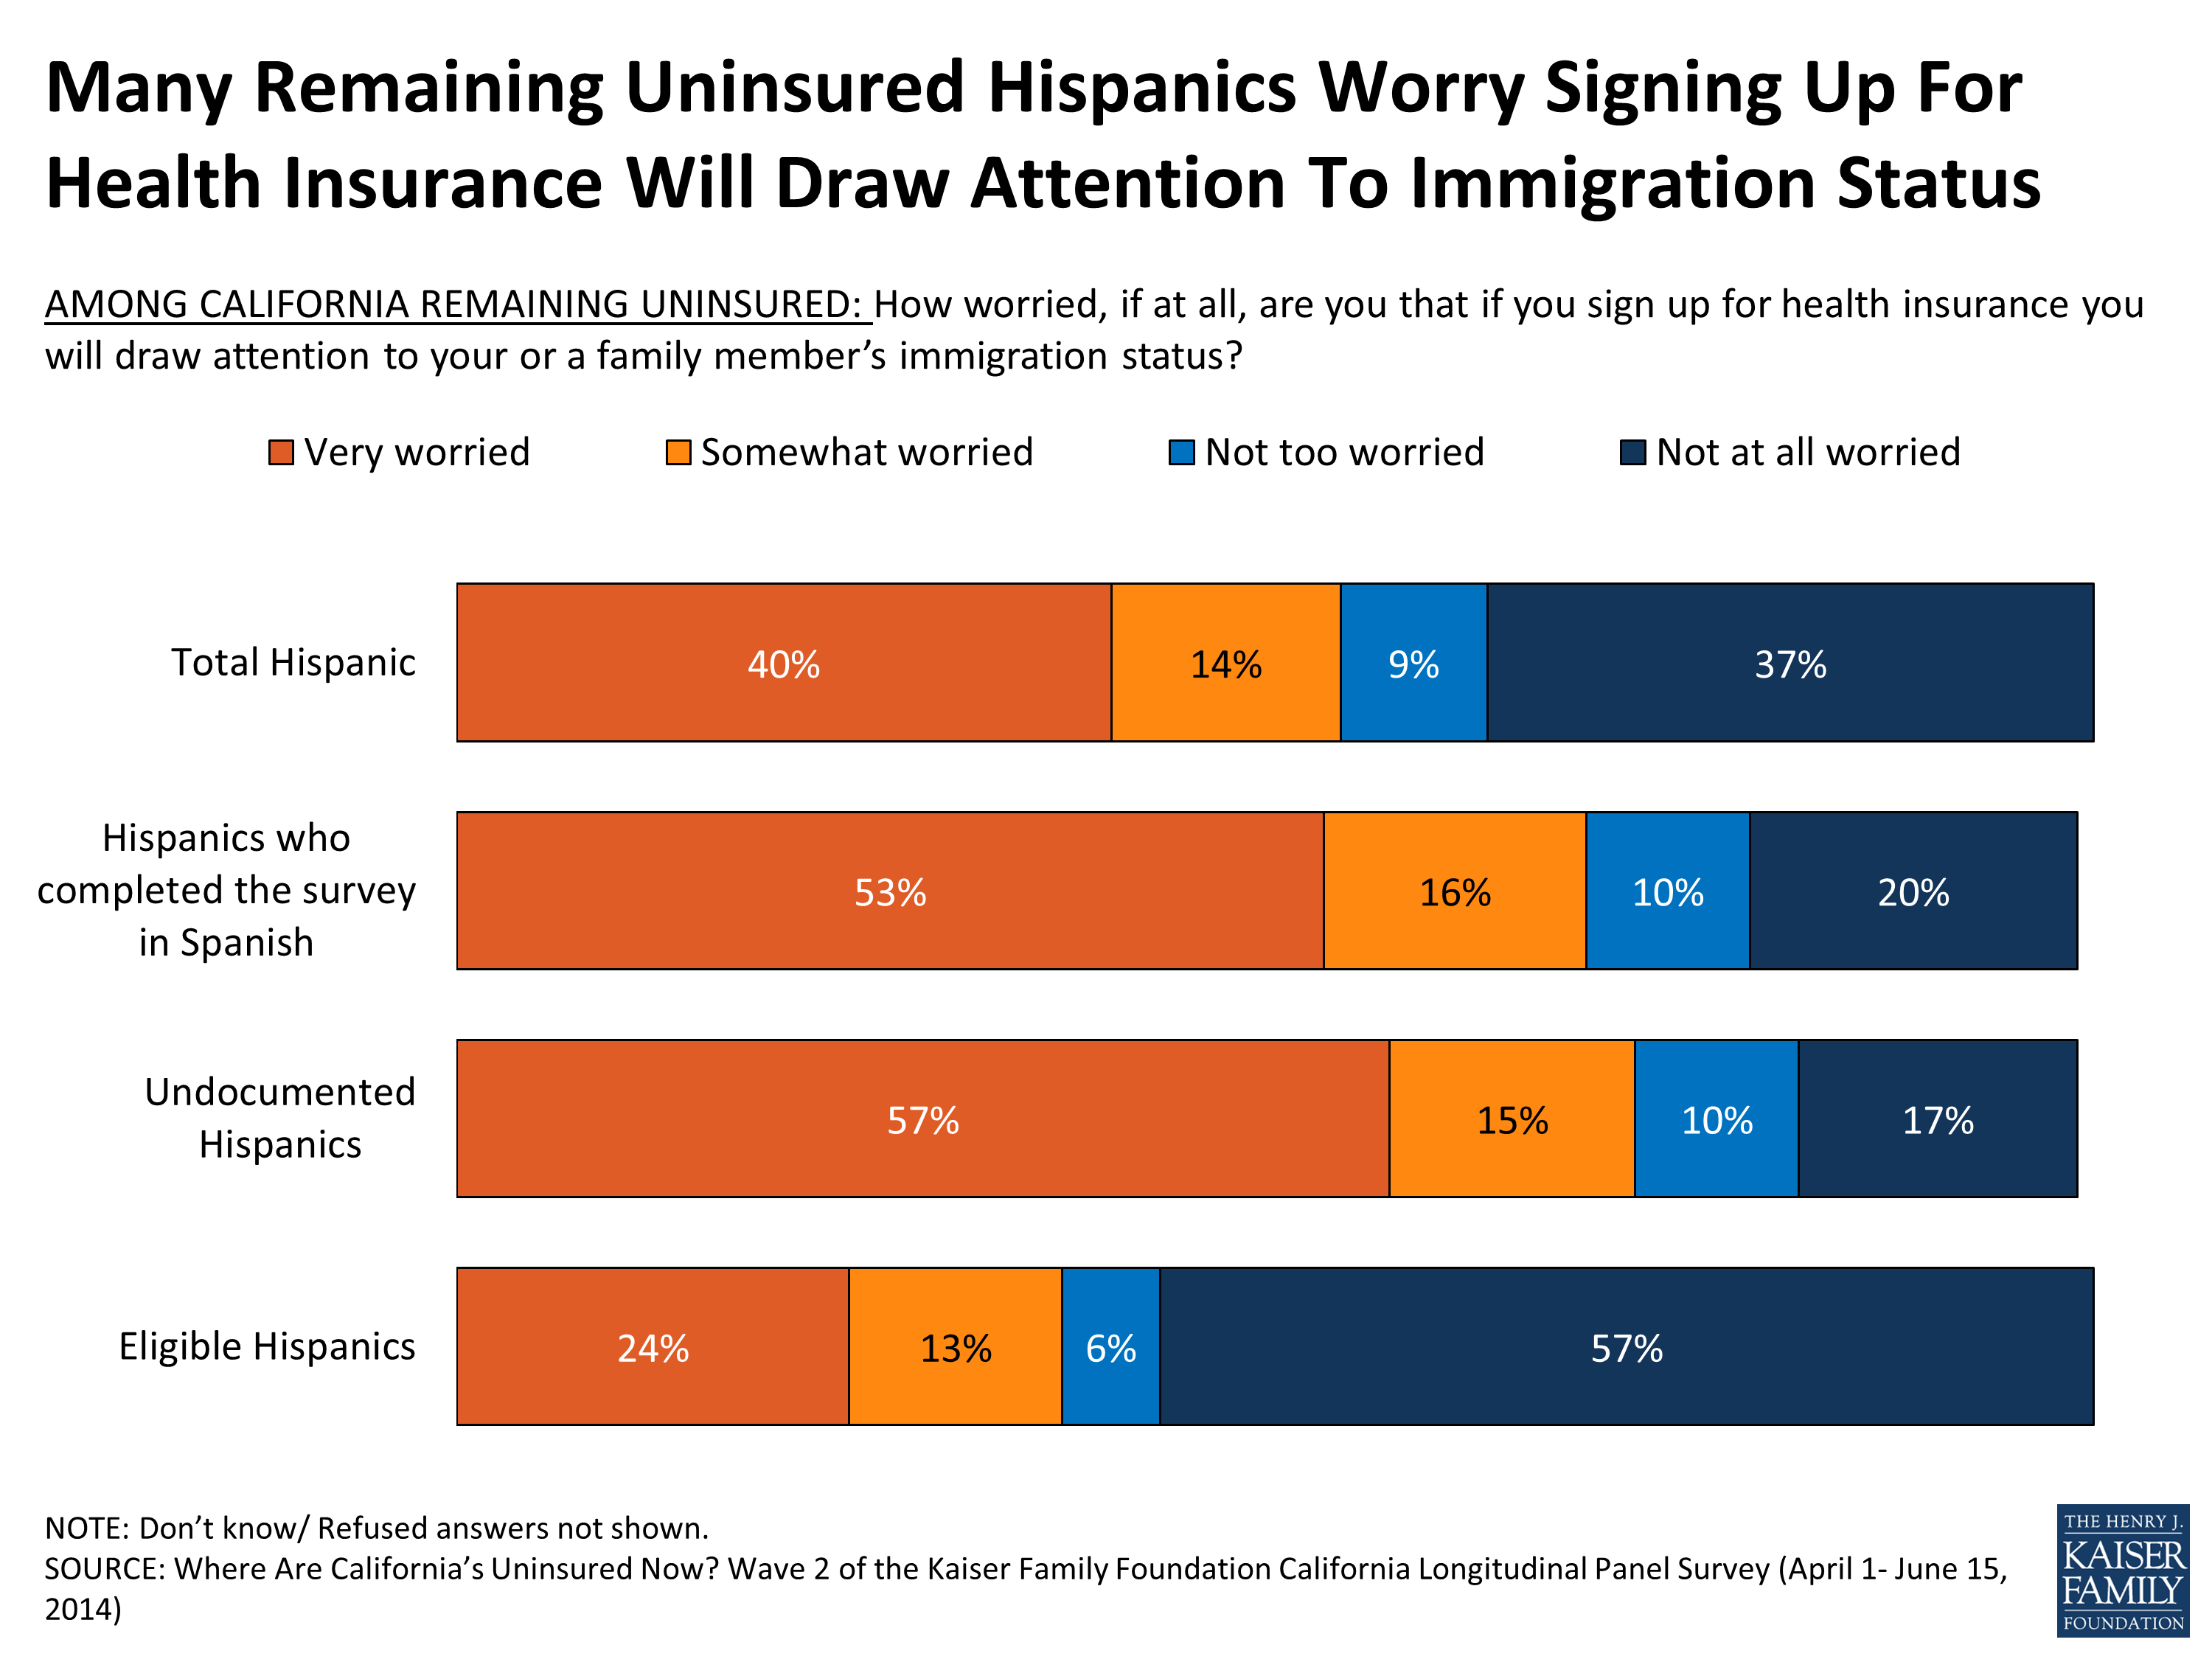
Figure 34
In addition to immigration concerns, language may also present a barrier for some Hispanics who remain uninsured. Fully 70 percent of remaining uninsured Hispanics took the survey in Spanish (34 percent of Hispanics overall) and they are divided as to the amount of information about signing up for health insurance that is available in Spanish. About half (52 percent) say that, in their experience, there is at least some information in Spanish available (Figure 35) and about 4 in 10 say there is only a little or no information in Spanish. Personal assistance in Spanish may be more visible – about 6 in 10 (58 percent) remaining uninsured Hispanics who took the survey in Spanish say they are aware of people in their community trained to help them sign up for coverage in Spanish.
| Figure 35: Remaining Uninsured By Race/Ethnicity | ||
| Percent remaining uninsured Spanish-speaking Hispanics (70 percent of remaining uninsured Hispanics) reporting that… | ||
| …there are at least some information about signing up for coverage available in Spanish | 52% | |
| …there are people in their community trained to help them sign up for health insurance in Spanish | 58% | |
| Percent remaining uninsured reporting that, in their view,… | HISPANIC | WHITE, NOT HISPANIC |
| …Health insurance is something I need | 78% | 60% |
| …Health insurance is worth the money | 72% | 38% |
In spite of these potential barriers there is widespread overall support for the role of health insurance among Hispanics who remain uninsured – roughly three quarters (78 percent) say health insurance is something they need and is worth the cost (72 percent), shares that are higher than their white peers (Figure 35).
California’s Undocumented Uninsured
In California, undocumented immigrants make up about a fifth of those who were uninsured before the ACA expansions kicked in, and under the law, they are not eligible for Medi-Cal or subsidies through the exchange. As a group they are largely aware of these restrictions – 63 percent say they are not eligible for Medi-Cal and 70 percent say they don’t qualify for financial assistance through Covered California. Half say the mandate doesn’t apply to them and most (60 percent) correctly respond that they won’t have to pay a fine for not having coverage.
While the ACA restricts access to health benefits for undocumented immigrants under the law, there is still keen interest in coverage among this group. Since last summer about a third (35 percent) of California’s undocumented uninsured say they obtained coverage and of those who remain uninsured, half say they intend to get coverage later this year. In fact, the remaining undocumented uninsured are more apt to say they place a high value on insurance than other remaining uninsured Californians; nearly three quarters (73 percent) of the undocumented uninsured say health insurance is worth the cost and 85 percent say it is something they need, each 20 percentage points higher than the share for other remaining uninsured Californians.
Conclusion
As the open enrollment period came to a close in the spring, nearly 6 in 10 of California’s previously uninsured report gaining coverage, with the largest share (25 percent) reporting they got coverage through Medi-Cal. All told, about a third of California’s previously uninsured say they enrolled in the two types of coverage most directly tied to the ACA – Medi-Cal and plans through Covered California. Forty-two percent say they remain uninsured including 13 percent who are ineligible for Medi-Cal or Covered California due to their immigration status.
Future waves of the Kaiser Family Foundation California Longitudinal Panel Survey will continue to track this same, representative group of individuals who were uninsured before the major provisions of the ACA took effect to learn more about how people are using their coverage, their experiences finding health care providers and paying for care, and whether they shop for coverage during the next open enrollment period, remain in the same plan or become uninsured again. At the same time, future surveys will determine if some of the remaining uninsured from this wave of the survey gain coverage and what eventually brought them into the fold. They also will measure the extent to which perceived or actual barriers such as cost and immigration status keep others from getting health insurance and how those remaining uninsured fare. Returning to the same previously uninsured Californians at multiple points in time allows for a unique look at the views and experiences of this key group as they navigate new coverage options under the ACA and the changing health care system.
About The Terms Used In This Report
This report primarily examines three key groups: 1) the overall group of Californians who were uninsured prior to the ACA’s first open enrollment periods, most often referred to as “California’s previously uninsured,” 2) the subgroup of previously uninsured who report getting coverage, referred to as the “newly insured,” and 3) the subgroup of previously uninsured who report that they still do not have coverage, referred to as the “remaining uninsured.” And, as noted in the Survey Methodology Section, only those uninsured for at least two months were included in the baseline survey. Other terms used occasionally throughout the report are defined below:
- Eligible Previously Uninsured Californians: Because the coverage expansions under the ACA do not extend to undocumented immigrants, some of the analyses focuses on those who reported being U.S. citizens or permanent residents in the baseline survey, described in shorthand as those who are ‘eligible’ for the ACA’s coverage expansions.
- Undocumented Previously Uninsured Californians: For the purposes of this report, undocumented immigrants are defined as those who reported in the baseline survey that a) they were not born in the United States or Puerto Rico, b) they came to this country without a green card, and c) they have not received a green card or become a permanent resident since arriving. There are several ways that this definition, while workable for the purposes of a broad analysis of this sort, falls short of the complexity of real life. First, it relies on self-reporting, and since respondents have an incentive not to reveal unlawful immigration status, it is undoubtedly a somewhat imperfect measure. Second, those that did not answer all three in the series of immigration status items in wave 1 (14 of wave 2 respondents) were not able to be categorized. Third, by necessity of time and efficiency, the survey did not allow for a full exploration of the many nuances inherent in the U.S. immigration system. For example, this category may actually include a small number of individuals in California as refugees, asylees or other humanitarian immigrants who might better be placed among the ‘eligible uninsured’. The survey, unfortunately, does not allow this level of detailed sorting. Since estimated immigration status is based on individuals’ responses to the baseline survey, it is possible that some small share of those thought to be undocumented immigrants have now become permanent residents or received a green card.
- Income categories: Because eligibility for two of the law’s main components – the Medi-Cal expansion and the tax credits being made available to purchase insurance on the new exchanges – is based on an individual’s family income relative to the federal poverty level (FPL), in some cases we report survey results by FPL categories. Eligible previously uninsured Californians with incomes 138% FPL or less (roughly $32,000 a year for a family of 4 in 2013) are eligible for Medi-Cal coverage, while those with incomes greater than 138% and up to 400% FPL (roughly $32,000-$94,000 for a family of 4 in 2013), are eligible for subsidies to purchase insurance through Covered California Marketplace. Those with incomes above 400% FPL are allowed to buy insurance through Covered California, but are not eligible for subsidy assistance. For convenience, we sometimes refer to the eligible group with incomes 138% FPL or less as the “Medi-Cal target group”, and those greater than 138% and up to 400% FPL as the “exchange subsidy target group”. These obviously are approximations that do not allow for every real world exception to be taken into account. For example, lawfully present immigrants may remain subject to a five year wait before they may enroll in Medi-Cal, but for the purposes of this analysis they are included in the Medi-Cal target group if they meet the income criteria. Similarly, some of those in the exchange subsidy target group may not be eligible for marketplace subsidies if they have access to affordable employer coverage, a situation difficult to ascertain in a phone survey.
Methodology
This is the second in a series of surveys by the Kaiser Family Foundation (KFF) tracking the views and experiences of a group of Californians who were uninsured in the summer of 2013, prior to implementation of the ACA’s insurance market reforms and coverage expansions through Covered California and Medi-Cal. Future surveys will continue to track this group’s experiences over the course of the next year and a half. The first survey (Wave 1) was conducted from July 11-August 29, 2013, with a randomly selected group of individuals who were uninsured at the time of the interview and was paid for entirely by KFF. The current survey (Wave 2) was conducted from April 1-June 15, 2014, with the same longitudinal panel of respondents, whether they obtained coverage or remained uninsured. Both surveys were designed and analyzed by researchers at KFF. Social Science Research Solutions collaborated with KFF researchers on sample design, weighting, and supervised fieldwork. Fieldwork costs associated with Wave 2 of the survey were paid for by The California Endowment.
The Wave 1 survey was conducted among a representative random sample of 2,001 adults ages 19-64 living in California who reported having been without health insurance for at least two months at the time of the interview1 (note: persons without a telephone could not be included in the random selection process). Computer-assisted telephone interviews conducted by landline (990) and cell phone (1,011, including 660 who had no landline telephone) were carried out in English and Spanish by SSRS. To increase efficiency in reaching this low-incidence, hard-to-reach group, both the landline and cell phone sampling frames oversampled areas with a lower-income population (since being uninsured is negatively correlated with income). The landline sample frame also oversampled households whose phone numbers were matched with directory listings indicating the presence of at least one person age 19-64 and a household income of less than $25,000. Additionally, 230 interviews (130 landline, 100 cell phone) were conducted with respondents who previously completed recent national SSRS omnibus surveys of the general public and indicated they were ages 19-64 and uninsured. These previous surveys were conducted with nationally representative, random-digit-dial landline and cell phone samples.
The current survey, Wave 2, also consisted of computer-assisted telephone interviews conducted by landline (623) and cell phone (545, including 327 who had no landline phone) in English and Spanish. Screening for Wave 2 involved verifying that the respondent had participated in Wave 1. Multiple attempts were made to reach every respondent from Wave 1 and encourage participation in Wave 2. Efforts included multiple dialing at various times of day and throughout the week, mailings and emails to those who provided such contact information, repeated dialing of non-working numbers, and attempts to find alternative phone numbers for non-working numbers.
In order to re-connect with respondents who may be more willing to complete the survey online, an abbreviated web version was introduced on May 14. The online questionnaire was offered in English and Spanish and was limited to key questions about insurance status, type of coverage, and reasons for obtaining coverage or remaining uninsured. A total of 51 respondents completed the online version of the survey.
A multi-stage weighting design was applied to ensure accurate representation of California’s nonelderly adult uninsured population prior to the ACA’s coverage expansions. The weighting process for Wave 2 involved corrections for sample design, as well as sample weighting to match the weighted Wave 2 sample to Wave 1 responses along demographic characteristics. As it did for Wave 1, the Wave 2 base weight accounted for the oversamples used in the sample design, as well as the likelihood of non-response for the sample from earlier omnibus surveys, number of eligible household members for the landline sample, and a correction to account for the fact that respondents with both a landline and cell phone have a higher probability of selection. Demographic weighting parameters for Wave 2 were based on Wave 1 weighted demographics, which were adjusted for age, education, race/ethnicity, nativity (for Hispanics only), Hispanics by gender, presence of own child in household, marital status, California region, poverty level, and phone usage. For more information on weighting and data sources, see the Wave 1 methodology. All differences referred to in the report are statistically significant. Statistical tests of significance account for the effect of weighting, and, for trend analysis, testing takes into account the survey’s panel design.
A unique consideration for surveys with a longitudinal panel design is whether those who participate in subsequent waves of the survey differ from those who refuse to participate again or are unable to be recontacted. Sixty-one percent of Wave 1 respondents completed the Wave 2 survey, and while there are some differences in the unweighted demographics of those who completed Wave 2 and the full Wave 1 sample, these differences are corrected for by weighting. As shown in the table below the total weighted distributions are similar for Wave 1 and Wave 2 for age, gender, race/ethnicity, self-reported health status, disability status, party identification, education and income. See the Wave 2 Attrition Appendix for more information on attrition.
| Unweighted | Weighted | |||||
| Wave 1 |
Wave 2 |
Percentage Point | Wave 1 |
Wave 2 |
Percentage Point | |
| Difference (W1 – W2) | Difference (W1 – W2) | |||||
| Gender | ||||||
| Male | 48% | 44% | 4 | 54% | 53% | 1 |
| Female | 52 | 56 | -4 | 46 | 47 | -1 |
| Race/ethnicity | ||||||
| White | 27 | 32 | -5 | 26 | 27 | -1 |
| Black | 7 | 8 | -1 | 5 | 6 | -1 |
| Hispanic | 58 | 52 | 6 | 56 | 55 | 1 |
| Other Race | 8 | 7 | 1 | 12 | 12 | 0 |
| Age | ||||||
| 18 to 29 | 23 | 18 | 5 | 33 | 32 | 1 |
| 30 to 39 | 21 | 21 | 0 | 24 | 24 | 0 |
| 40 to 49 | 22 | 22 | 0 | 21 | 21 | 0 |
| 50 to 64 | 35 | 39 | -4 | 22 | 24 | -2 |
| Education | ||||||
| HS or less | 57 | 53 | 4 | 58 | 57 | 1 |
| Some college | 28 | 31 | -3 | 29 | 30 | -1 |
| College Grad+ | 15 | 16 | -1 | 12 | 13 | -1 |
| Phone status | ||||||
| Landline | 49 | 54 | -5 | 42 | 44 | -2 |
| Cell | 51 | 46 | 5 | 58 | 56 | 2 |
| Marital status | ||||||
| Married | 33 | 32 | 1 | 37 | 37 | 0 |
| Not Married | 67 | 68 | -1 | 62 | 63 | -1 |
| Family income | ||||||
| <138% FPL | 60 | 59 | 1 | 52 | 53 | -1 |
| 138%-400% FPL | 30 | 32 | -2 | 36 | 35 | 1 |
| 400%+ | 5 | 5 | 0 | 7 | 7 | 0 |
| Language of interview | ||||||
| English | 63 | 68 | -5 | 65 | 67 | -2 |
| Spanish | 37 | 32 | 5 | 35 | 33 | 2 |
| Resident status | ||||||
| Citizen/legal immigrant | 79 | 82 | -3 | 78 | 79 | -1 |
| Undocumented immigrant | 20 | 16 | 4 | 21 | 19 | 2 |
| Party identification | ||||||
| Republican | 11 | 12 | -1 | 11 | 12 | -1 |
| Democrat | 35 | 36 | -1 | 32 | 31 | 1 |
| Independent | 35 | 34 | 1 | 37 | 38 | -1 |
| Other | 9 | 8 | 1 | 9 | 9 | 0 |
Another consideration for panel surveys is the potential for “sensitization effects,” that is, what effect returning to the same people about the same topics has on their experiences or views. For example, after taking the baseline survey that covered many aspects of the coverage expansions under the ACA, were people more likely to seek out information about health insurance and enroll than they would have been otherwise? While there is no direct way to measure this effect on this survey, other analyses have found that these effects are minimal and short-lived2 and we do not believe they would have had a substantial impact on results presented here, particularly given all the other media coverage, advertising, and outreach targeted at this population during the fall and winter of 2013 and 2014.
The margin of sampling error including the design effect for the full sample is plus or minus 4 percentage points. For the newly insured, it is plus or minus 5 percentage points and for the remaining uninsured it is plus or minus 7 percentage points. Numbers of respondents and margin of sampling error for key subgroups are shown in the table below.
| Group | N | MOSE |
|
Total Wave 2 |
1,219 | +/- 4 percentage points |
|
Newly insured |
740 | +/- 5 percentage points |
|
Newly insured by non-group plan |
160 |
+/- 11 percentage points |
|
Newly insured through Covered California |
116 |
+/- 13 percentage points |
|
Newly insured by Medi-Cal |
368 |
+/- 8 percentage points |
|
Newly insured through an employer |
129 |
+/- 12 percentage points |
|
Newly insured Hispanics |
347 |
+/- 8 percentage points |
| Remaining uninsured |
478 |
+/- 7 percentage points |
| Remaining uninsured Hispanics |
284 |
+/- 8 percentage points |
| Remaining uninsured undocumented immigrants |
131 |
+/- 12 percentage points |
For results based on other subgroups, the margin of sampling error may be higher. Sample sizes and margin of sampling errors for other subgroups are available by request. Note that sampling error is only one of many potential sources of error in this or any other public opinion poll.
Some demographic measures referred to in the report were only asked during the baseline survey, such as questions about educational attainment, debilitating chronic condition, length of time uninsured, resident status, and race/ethnicity. For more information on the first wave of the Kaiser Family Foundation California Longitudinal Panel Survey visit, https://www.kff.org/health-reform/report/californias-uninsured-on-the-eve-of-aca-open-enrollment/.
Endnotes
Executive Summary
The baseline survey included only those adult Californians ages 19-64 who reported being without coverage for at least two months. Because this panel survey focuses on a specific group who were uninsured prior to open enrollment, it does not estimate the overall change in the number of uninsured Californians. The approximate number of newly insured adult Californians is calculated with the estimate of 5.9 million uninsured nonelderly adults based on a Kaiser Family Foundation analysis of 2013 ASEC Supplement to the Current Population Survey, available at https://www.kff.org/other/state-indicator/adults-19-64/.
For the purposes of this report, undocumented immigrants are defined as those that reported in the baseline survey that a) they were not born in the United States, and b) they came to this country without a green card, and c) they have not received a green card or become permanent residents since arriving. See the “About The Terms In This Report” Section for more details.
Among ‘eligible’ previously uninsured Californians earning 138% FPL or less, 61 percent report gaining coverage and 39 percent say they remain uninsured. For those ‘eligible’ between 139% and 400% FPL, 66 percent report now being covered and 34 percent say they remain uninsured. For the purposes of this report, the previously uninsured who are ‘eligible’ are defined as California residents ages 19-64 who have been uninsured for at least two months and would be eligible for participation in the ACA coverage expansion based on their self-reported status as a citizen, permanent resident, or lawfully present immigrant.
Key Findings
Introduction
For more information on Wave 1, see “California’s Uninsured on the Eve of ACA Open Enrollment: The Kaiser Family Foundation Baseline Survey,” Kaiser Family Foundation, September 2013, https://www.kff.org/health-reform/report/californias-uninsured-on-the-eve-of-aca-open-enrollment/.
DHHS Centers for Medicare & Medicaid Services, “Medicaid & CHIP: May 2014 Monthly Applications, Eligibility Determinations and Enrollment Report,” July 11, 2014 http://medicaid.gov/AffordableCareAct/Medicaid-Moving-Forward-2014/Downloads/May-2014-Enrollment-Report.pdf. DHHS Office of the Assistant Secretary for Planning and Evaluation Issue Brief, “Health Insurance Marketplace: Summary Enrollment Report For The Initial Annual Open Enrollment Period,” May 1, 2014 http://aspe.hhs.gov/health/reports/2014/MarketPlaceEnrollment/Apr2014/ib_2014Apr_enrollment.pdf. The California Department of Health Care Services estimates 1.9 million people have enrolled in Medi-Cal since open enrollment started, http://news.coveredca.com/2014/04/covered-californias-historic-first-open.html.
For more information on the experiences of insured and uninsured Californians prior to open enrollment, see, “The Uninsured At The Starting Line In California,” Kaiser Family Foundation, February 2014, https://www.kff.org/uninsured/report/the-uninsured-at-the-starting-line-in-california-california-findings-from-the-2013-kaiser-survey-of-low-income-americans-and-the-aca/
Section 1: Who Got Covered?
For the purposes of this report, undocumented immigrants are defined as those that reported in the baseline survey that a) they were not born in the United States, and b) they came to this country without a green card, and c) they have not received a green card or become permanent residents since arriving. See the “About The Terms In This Report” Section for more details.
In the baseline survey, 13 percent of California’s uninsured population reported having a disability, handicap or chronic disease that keeps them from participating fully in work, school, housework, or other activities. Most of those reporting such an ailment also report being in fair or poor health, but the measure of health status is more general with about a third reporting being in fair or poor health (32 percent for Wave 2 and 38 percent for Wave 1). The fact that the group reporting a debilitating chronic condition is a small but specific group may help explain why 77 percent of them report getting health insurance compared to 53 percent of those reporting being in fair or poor health.
Regression results are available on request.
Section 2: The Newly Insured
This share is lower than what has been reported by Covered California. According to Covered California, 88 percent of those covered through the Marketplace (including those who were previously insured and those who were not) have subsidized coverage. This may indicate that some of the newly insured are unaware of the assistance they’re receiving and may not know the real cost of their plan. Multiple factors may be contributing to this apparent under-reporting on the survey, but it is likely that at least some individuals receiving government financial help may be unaware that the government is paying a portion of their premium. Insurance concepts are complicated and many people have trouble reporting detailed information about their plans. During the enrollment process, some people may have been focused on the bottom line question of “What do I pay?” and less focused on whether that amount was subsidized or not. For the numbers from Covered California, see http://news.coveredca.com/2014/04/covered-californias-historic-first-open.html
Los Angeles Times, “Website glitch slows Obamacare enrollment in California,” March 11, 2014. http://articles.latimes.com/2014/mar/11/business/la-fi-mo-covered-california-obamacare-enrollment-20140311
The Covered California Marketplace reports the distribution of enrollment across metal types for all Covered California enrollees, not just the previously uninsured, as follows: 26% bronze, 62% silver, 6% gold, 5% platinum, 1% catastrophic. For more information, see http://news.coveredca.com/search?updated-max=2014-05-07T08:46:00-07:00&max-results=7&start=7&by-date=false This survey only includes those who were previously uninsured prior to the open enrollment period, but after excluding the 24 percent who said they didn’t know the metal level of their plan, the distribution is similar to what Covered California reported for all of its enrollees: 23% Bronze, 65% Silver, 2% Gold, 5% Platinum, 0% catastrophic.
Section 3: The Remaining Uninsured
For the purposes of this report, the ‘eligible remaining uninsured’ are California residents who said they had been uninsured for at least two months in the baseline survey and would be eligible for participation in the ACA coverage expansion based on their self-reported status as a citizen, permanent resident, or lawfully present immigrant. See the “About The Terms In This Report” Section for more details.
Kaiser Health News, “Mountainous Backlog Stalls Medi-Cal Expansion in California,” July 02, 2014. http://www.kffhealthnews.org/stories/2014/july/02/mountainous-backlog-stalls-medical-expansion-in-california.aspx
U.S. Immigration and Customs Enforcement. Clarification of Existing Practices Related to Certain Health Care Information, October 25, 2013. http://www.ice.gov/doclib/ero-outreach/pdf/ice-aca-memo.pdf
Methodology
Those who had been uninsured for less than two months were excluded from the survey since they may be experiencing a short period of uninsurance (i.e. someone who is between jobs), and the goal of the survey was to capture the experiences and views of those who have been without insurance for a longer period of time and are poised to experience the new coverage provisions of the ACA.
M. Brodie, “Sensitization Effects in a Study of the Impact of a Nationally Broadcast Special on Health Care Reform,” in Doctoral Thesis: Political Institutions, Participation, and Media Evaluations— Influences on Health Care Policy (Boston, Mass.: Harvard University, 1995).