Uncompensated Care for the Uninsured in 2013: A Detailed Examination
Executive Summary
Despite not having health insurance, millions of uninsured Americans use health care services every year. Since health care is costly and the vast majority of uninsured have limited financial means, many uninsured often cannot pay their medical bills.1 Recognizing the need for and importance of health care providers that care for those without insurance, the federal government, states and localities have long provided support—financial and otherwise—to help defray providers’ the costs of caring for uninsured individuals.
With the enactment of the Affordable Care Act (ACA), millions of previously uninsured individuals will gain insurance coverage through either Medicaid or private plans purchased through the health care marketplaces. As people gain coverage, providers’ costs associated with caring for uninsured individuals that previously went uncompensated will decline, as more people have a direct source of payment (insurance) for their care. In this paper, we take a close look at uncompensated care in 2013, just before implementation of health reform’s major coverage provisions. These estimates provide an important baseline against which to measure major changes that are occurring under the ACA. Key findings from the analysis include:
- On average, a person who is uninsured for the entire year will incur considerably lower medical expenses than someone who is insured for the full year. In 2013, the average uninsured person had half the amount of medical expenditures as the average insured person ($2,443 versus $4,876).
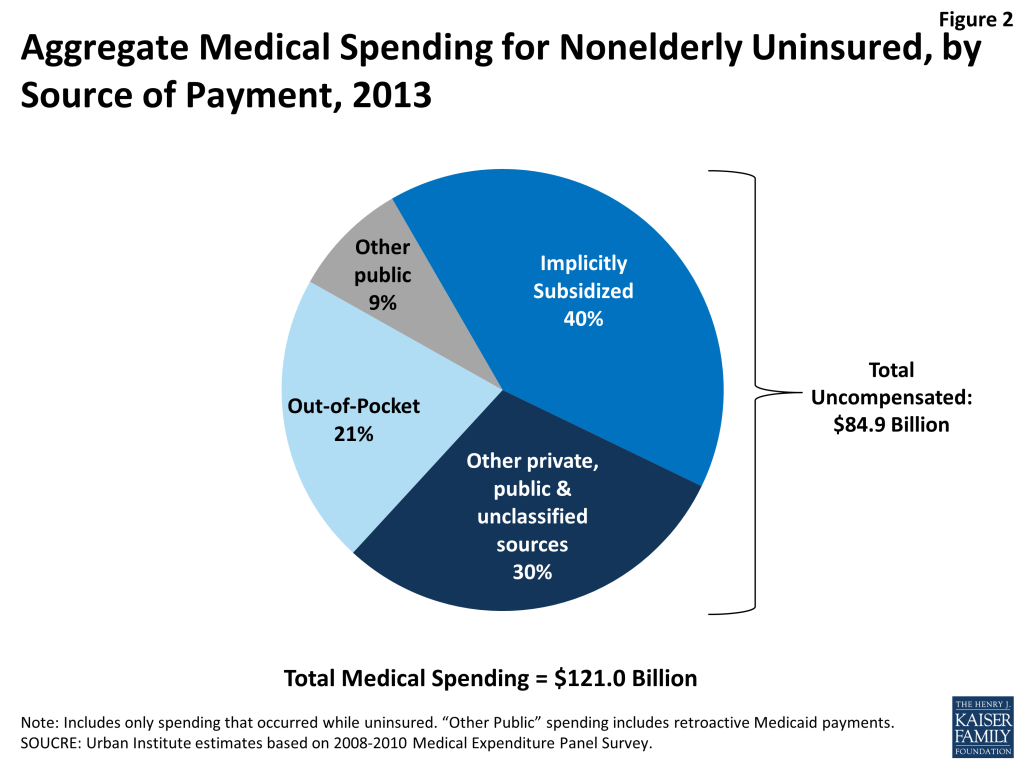
- In 2013, the cost of “uncompensated care” provided to uninsured individuals was $84.9 billion. Uncompensated care includes health care services without a direct source of payment. In addition, people who are uninsured paid an additional $25.8 billion out-of-pocket for their care.
- The majority of uncompensated care (60%) is provided in hospitals. Community based providers (including clinics and health centers) and office-based physicians provide the rest, providing 26% and 14% of uncompensated care, respectively.
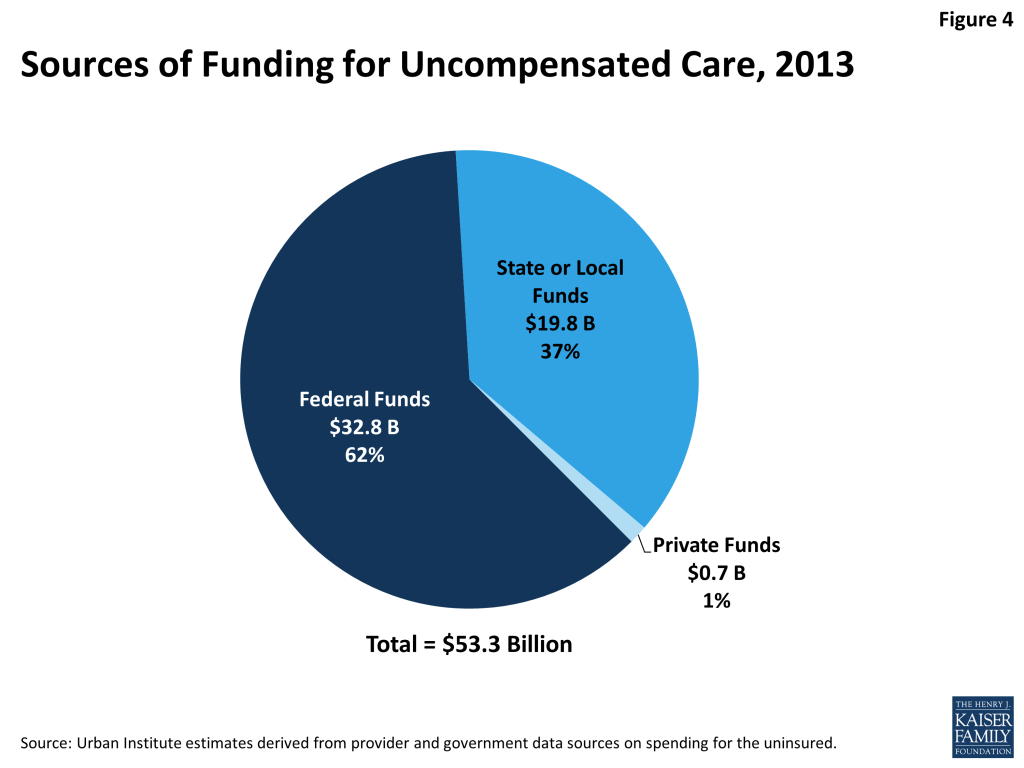
- In 2013, $53.3 billion was paid to help providers offset uncompensated care costs. Most of these funds ($32.8 billion) came from the federal government through a variety of programs including Medicaid and Medicare, the Veterans Health Administration, and other programs. States and localities provided $19.8 billion, and the private sector provided $0.7 billion.
Overview of Methods
We developed estimates of spending on uncompensated care by using two different approaches. First, we used the Medical Expenditure Panel Survey (MEPS), a household survey of the U.S. civilian non-institutionalized population, to examine use of medical care and source of payment for services (if any) for people with and without insurance coverage. We adjust the MEPS to inflate spending to 2013 $ and also to match national benchmarks for aggregate spending. We define total “uncompensated care” as the costs associated with care that was unpaid, but would have been paid if the person was insured, plus expenditures from indirect sources made on behalf of the uninsured. This approach provides estimates of per capita and aggregate spending on uncompensated care. Second, we used data from provider sources (hospitals, community providers, and physicians) to build an estimate of the value of uncompensated care provided by different types of providers. This second approach has some limitations in that the underlying data do not capture all services and it relies on conservative assumptions about how much program spending for different programs went towards services for the uninsured. Despite these limitations, the second estimate is useful because the underlying data enable us to estimate uncompensated care spending by provider type. Last, we examine budget and spending data for several public programs to develop estimates of how much funding is available from various sources to offset the cost of uncompensated care. More detail on the methods is available in the report and the statistical appendix.
The Cost of Uncompensated Care
Over 72 million nonelderly people were without insurance coverage for either the full year (40.8 million people) or for part of the year (31.4 million people) in 2013. On average, a person who is uninsured had considerably lower annual health care expenses than a person who is insured. This difference reflects the uninsured population’s lower health services utilization rate and lower intensity of service use compared to the insured population. Compared to nonelderly people who had insurance for a full year, for whom average per capita medical expenditures were $4,876, nonelderly people who were without insurance for a full year used health care services valued at about half that amount, or just $2,443 per capita per year (see Figure 1). Nonelderly people who were uninsured for part of the year had annual medical expenditures about 30% lower than people who were insured for the full year, spending an average of $3,439 annually per capita. Part-year uninsured individuals spent more per capita than full-year uninsured individuals largely due to higher spending in the months that they had coverage.
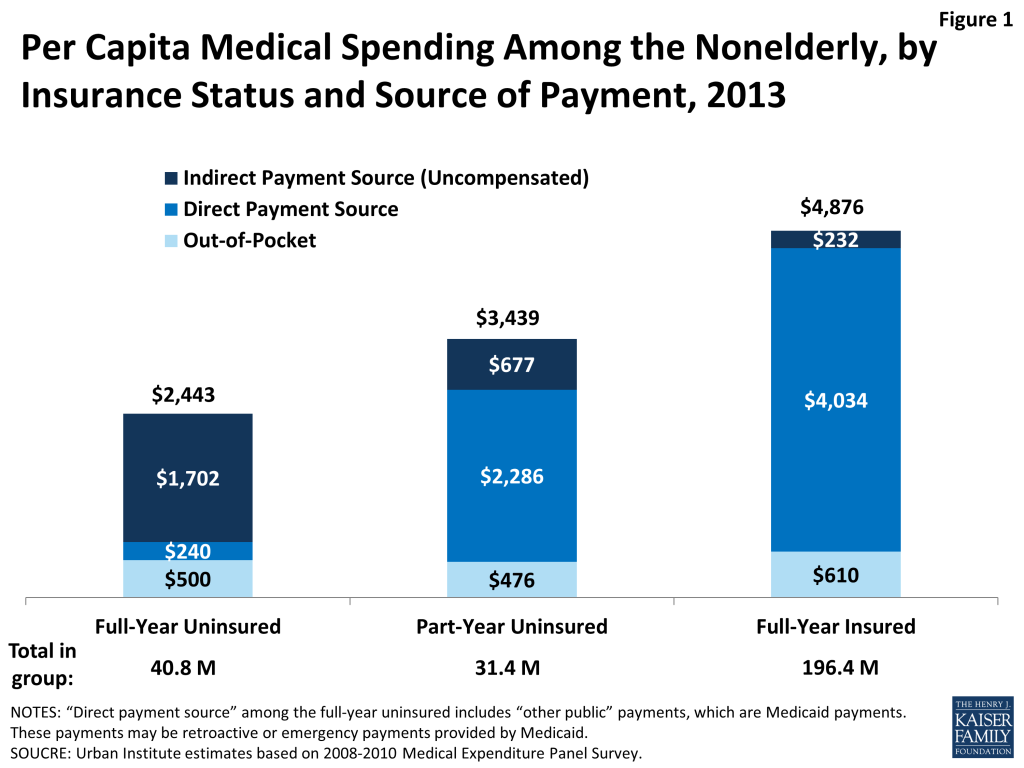
Despite lower overall spending, people without insurance pay nearly as much as insured people out-of-pocket for their care. Nonelderly people without coverage for the full year spent an average of $500 out-of-pocket per year, while part-year uninsured people spent an average of $476 per year and full-year insured people spent an average of $610 per year. Because uninsured individuals have much lower total spending per capita, these out-of-pocket amounts translate to very different shares of total expenses: full-year uninsured pay for 20% of their care out-of-pocket, compared to 14% for part-year uninsured and 12% for full-year insured.
While full-year uninsured individuals have a small amount of their care covered by a direct payment source ($240 per year, which likely represents retroactive Medicaid payments), most of their care ($1,702 per year, or 70% of their total annual expenses) is “uncompensated,” or not linked to a direct payment source tied to an individual (such as insurance coverage). Not surprisingly, nonelderly people who are part-year uninsured have a higher amount of their annual medical expenses covered by a direct payment source (specifically, their insurance coverage for the period they were insured, which covers $2,286 per capita), but on average, $677 of medical expenses (about 20% of total per capita expenses) for part-year uninsured people are uncompensated. For people who were insured for the full year, the majority of their care ($4,034, or 83%) is covered through direct payments by their insurance. Full-year insured people have a small amount ($232) of uncompensated care covered by payments from sources other than insurance.
In aggregate, medical care spending for the uninsured population—that is, for the full-year uninsured and for the periods that the part-year uninsured population lacked coverage—totaled $121 billion in 2013 (Figure 2). Of these expenses, 21%, or $25.8 billion, were paid out-of-pocket by the uninsured. The majority of expenses (70%), however, were uncompensated, totaling $84.9 billion in uncompensated care costs in 2013. Thirty percent ($35.9 billion) was uncompensated care indirectly paid for by other private, public, or unclassified sources, and 40 percent ($49.0 billion) was implicitly subsidized care not linked to a specific funding source.
Uncompensated Care Provided by Site of Service
Using a second source of data to estimate uncompensated care yields a very similar estimate of the aggregate value of uncompensated care used by the uninsured: $74.9 billion in 2013. This second estimate is lower than the $84.9 billion reported above because the underlying data do not capture all services. In addition, the second estimate relies on conservative assumptions about how much program spending for different programs went towards services for the uninsured. Despite these limitations, the second estimate is useful because the underlying data enable us to estimate uncompensated care spending by provider type.
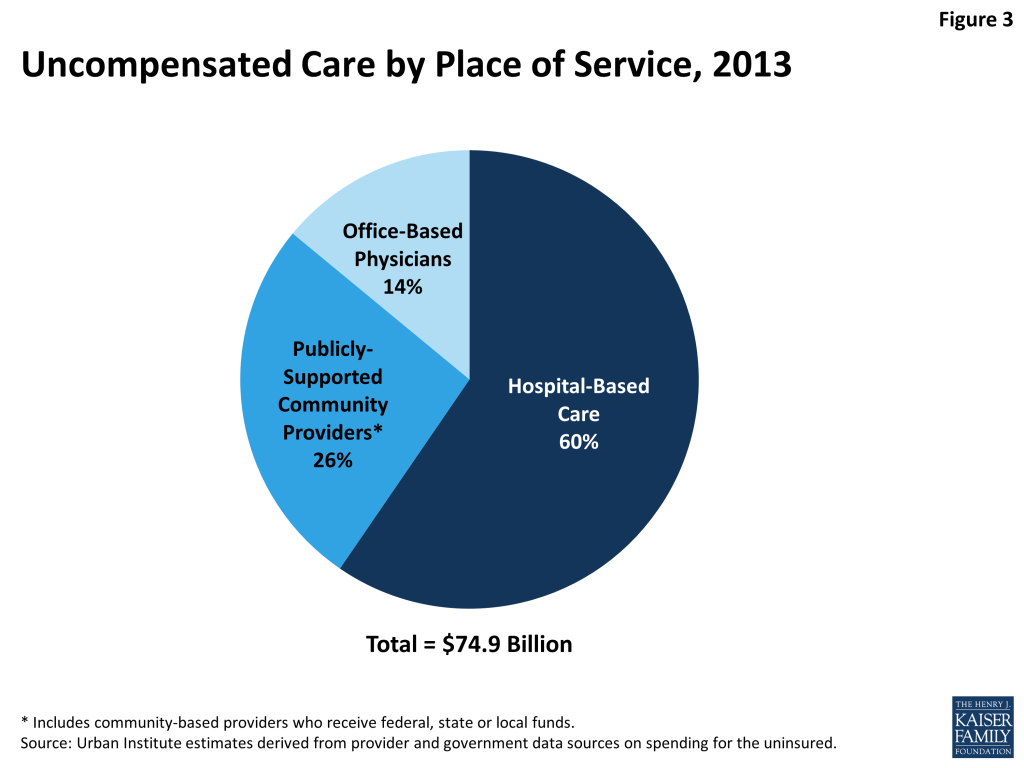
Hospitals, community providers (such as clinics and health centers), and office-based physicians all provide care to the uninsured. Using the second estimate of total uncompensated care provided to the uninsured population ($74.9 billion), we estimate what share was provided in hospitals versus community-based settings. Not surprisingly given the high cost of hospital-based care, the majority (60%) of uncompensated care is provided by hospitals. Community-based providers that receive public funds provide a little over a quarter (26%) of uncompensated care. The remainder of uncompensated care, 14%, is provided by office-based physicians.
Sources of Funding for Uncompensated Care
Providers do not bear the full cost of their uncompensated care. Rather, funding is available through a wide variety of sources to help providers defray the costs associated with uncompensated care. This funding may be linked to an individual patient’s care or may be paid as a lump sum or grant to a provider.
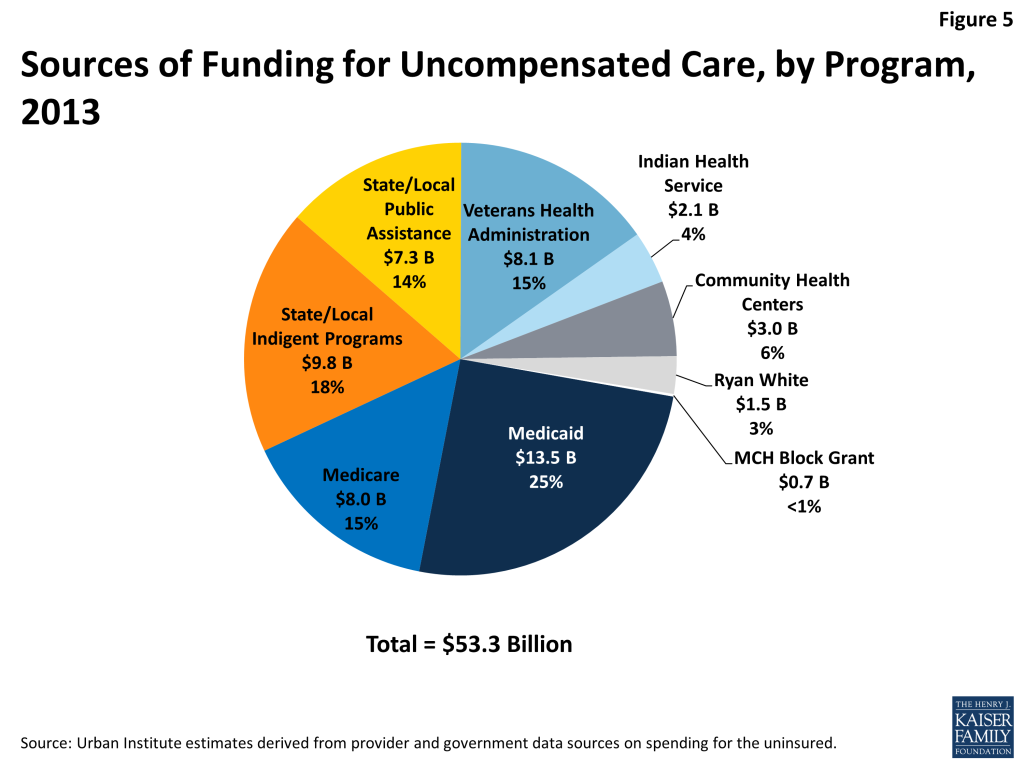
We estimate that in 2013, $53.3 billion was paid to help providers offset uncompensated care costs. Most of these funds ($32.8 billion) came from the federal government through a variety of programs including Medicaid and Medicare, the Veterans Health Administration, the Indian Health Service, Community Health Centers block grant, and Ryan White CARE Act (Figure 4). States and localities provided $19.8 billion, and the private sector provided $0.7 billion.
Looking at specific programs, Medicaid was the single largest source of funds to pay for uncompensated care (Figure 5). In 2013, we estimate Medicaid contributed $13.5 billion to help pay for care for the uninsured, accounting for 25.3 percent of funding, through its disproportionate share hospital (DSH) and upper payment limit (UPL) mechanisms. Through a separate DSH program and its indirect medical education spending, Medicare provided 15% of funds available for uncompensated care. At $9.8 billion, state and local appropriations for indigent care programs were the second largest funder (18%), followed by the Veterans Administration ($8.1 billion, or 15% of funding). Close behind was state and local public assistance funding at $7.3 billion, or 14%. At a much lower level, community health centers funding totaled $3 billion (6%), followed by the Indian Health Service ($2.1 billion, or 4%), Ryan White Care Act ($1.5 billion, or 3%) and Maternal and Child Health Title V Block Grant ($0.1 billion, or <1%).
In total, these sources of government funding offset about two-thirds of the cost of providing uncompensated care to the uninsured population ($53.3 billion available in funds to cover $84.9 billion in uncompensated care). With an additional $10.5 billion in charity care that was provided by office-based physicians, there remains $21.1 billion in uncompensated care that is not covered by government funding or physician charity care. Some argue that providers in fact cover the cost associated with providing this uncompensated care by charging higher rates to private payers, who in turn may charge enrollees higher premiums. However, there is no evidence that providers have charged private payers higher rates to offset rising uncompensated care costs. Further, the value of this uncompensated care is very small relative to total spending by private payers. In 2013, private health insurance expenditures were $925.2 billion, which means that even if all remaining uncompensated care costs were shifted to private insurers, it would represent only 2.3 percent of total private expenditures.
Discussion
While providers incur significant costs in caring for the uninsured, the bulk of their costs (about two-thirds) are compensated through a web of complex funding streams that are financed largely with public dollars. While these funding streams may offset the cost of uncompensated care in the aggregate, these funds may not be targeted to the individual providers who provide the most uncompensated care. As a result, some providers likely incur costs caring for the uninsured for which they receive little to no compensation. Thus, the system may be inefficiently making funds available to help pay for care for the uninsured.
The ACA includes a major expansion of insurance coverage, and millions have already enrolled in new plans. Based on the premise that coverage expansions under the ACA will result in fewer individuals receiving uncompensated care, the ACA also includes important provisions related to uncompensated care. Changes to DSH aim to better target Medicaid and Medicare DSH payments to hospitals; in addition, overall DSH funds will be reduced, reflecting the fact that there will be fewer uninsured individuals. However, with some states opting not to expand their Medicaid programs, and with some people remaining ineligible for coverage, it will be important to monitor how the DSH changes affect providers’ uncompensated care costs. This analysis estimated that hospitals provide the majority of uncompensated care to the uninsured, and federal payments under DSH provide a substantial amount of funding to help offset those costs. Thus, it is possible that changes to DSH will lead hospitals to reduce the level of uncompensated care they provide or to pursue aggressive billing against uninsured patients.
States and localities, which also provide a substantial amount of funding for uncompensated care, could change their spending under the ACA. Relying on the same logic that the federal government used to reduce Medicare and Medicaid DSH payments, states and localities could argue that providers will need less uncompensated care funding because more of the uninsured will have coverage through Medicaid, health insurance marketplaces or other coverage. The benefits from the coverage expansion, however, will vary widely across states and even within areas within a state.
While the ACA holds great promise to substantially expand coverage and thus reduce the amount of uncompensated care in the system, many people will remain uninsured even after full implementation. These remaining uninsured include those left out of Medicaid expansions because their state chose not to expand; people who are ineligible for assistance because they are undocumented immigrants; and others who either do not have an affordable offer of coverage or choose to remain uninsured. As the ACA continues to roll out across the nation and as payment and delivery systems adapt to the changing policy environment, it will be important to monitor how levels of uncompensated care and funding for that care affect specific health care providers and the provision of uncompensated care for uninsured individuals.
Introduction
Despite not having health insurance, millions of uninsured Americans use health care services every year. Since health care is costly and the vast majority of uninsured have limited financial means, many uninsured often cannot pay their medical bills.2 Recognizing the need for and importance of health care providers that care for those without insurance, the federal government, states and localities have long provided support—financial and otherwise—to help defray providers’ the costs of caring for uninsured individuals.
The federal government, for instance, heavily invests in the roughly 1,200 community health centers located across the country. It also helps to cover providers’ uncompensated care costs through Medicare and Medicaid disproportionate share hospital (DSH) payments, which are targeted to hospitals to partially offset costs associated with caring for the uninsured and other vulnerable populations. Providers that render care to the uninsured vary widely across the country, ranging from teaching hospitals and community health centers to office-based physicians and school-based clinics.With the enactment of the Affordable Care Act (ACA), signed into law on March 23, 2010, the nation’s health care landscape will be fundamentally reshaped, particularly for how care is delivered to the low-income uninsured and how that care is financed. Chief among the ACA’s many provisions is the Medicaid expansion in which states, at their option, can cover individuals up to 138 percent of the federal poverty line (FPL). The ACA also provides subsidies for people with incomes below 400 percent of the FPL to purchase health insurance and tax credits to help small businesses provide coverage to their employees. In addition, the law establishes health insurance Marketplaces for individuals and businesses to obtain health coverage and requires individuals to have coverage if affordable insurance offers are available. Over the next decade an estimated 25 million people will gain health insurance through the ACA.3
To help cover the costs of this significant expansion of insurance coverage afforded by the ACA, the federal government is providing considerable financial support. For example, for states choosing to expand Medicaid, the federal government will pay all of the costs between 2014 and 2016; the federal share will gradually decline until 2019 when it will be permanently set at 90 percent. The federal government is also paying 100 percent of the cost of premium tax credits for Marketplace coverage. All totaled, the cost of the ACA to the federal government is estimated to be around $1.3 trillion over the first ten years (2013-2023).4
Some of the costs associated with the ACA, however, will be offset by reductions in health care providers’ uncompensated care costs: providers’ costs associated with caring for uninsured individuals that previously went uncompensated will decline because many of these individuals will have insurance coverage once the ACA is fully implemented. Anticipating fewer uninsured and lower levels of uncompensated care, the ACA reduces federal Medicare DSH payments beginning in 2014 through 2020 and Medicaid DSH beginning in 2016 through 2020. With the expansion of coverage under the ACA, state governments and localities could also realize savings. Many states and local areas support health care services and programs for the uninsured. With higher levels of insurance coverage provided by the ACA, the need for such support may decline.
In this report, we build on earlier work and take a close look at uncompensated care in 2013, just before implementation of health reform.5 As detailed below, we use two alternative approaches to estimate the cost associated with uncompensated care that was provided to the nonelderly uninsured in 2013. We also examine how uncompensated care was distributed across health care providers as well as the sources of funding currently in the health care system to help defray providers’ uncompensated care costs. Finally, we explore the long-standing issue of whether and to what extent private health insurance dollars were used to cover health care costs of the uninsured.
Study findings offer a comprehensive picture of uncompensated care for the uninsured prior to coverage expansions under the ACA, including the level of spending, which providers render it, and the funding sources available to help pay for it. Apart from providing this basic information, study findings identify potential federal, state and local funds currently used to finance uncompensated care that under health reform could be saved and redirected for other purposes or to help pay for care received by the newly insured.
The paper is organized in several sections. In the first two sections, we present estimates of uncompensated care in 2013 using two alternative approaches. In the third section, we examine the different sources of funding currently available in the health care system to help pay for uncompensated care. Then we examine the extent to which private health insurance dollars are used to help cover uncompensated care. We conclude with a discussion of the study findings and their policy implications.
Report: The Cost Of Uncompensated Care
In this section we present 2013 estimates of uncompensated care costs for the uninsured based on data from the Medical Expenditure Panel Survey (MEPS). We begin with a brief description of the survey and the methods; a detailed discussion is provided in the statistical appendix.
Data and Methods for MEPS Analysis
MEPS Survey
The MEPS is a household survey nationally representative of the U.S. civilian non-institutionalized population.6 It has a rotating panel design, where each panel covers two complete calendar years. The Household Component (HC) collects detailed information on health insurance status and medical care use by month, as well as medical expenditures by source. To improve measurement of individuals’ responses to questions about health care use and cost, the MEPS includes the Medical Provider Component (MPC), which links select respondents’ information on medical use with provider information on and expenditures for health care services by payer (e.g., private insurance, public sources). We use both the HC and MPC data in our analysis.
To obtain more precise uncompensated care estimates, we pool three years of MEPS data, representing calendar years 2008, 2009, and 2010. 7 Given that most elderly have Medicare coverage, we limit our analysis sample to respondents aged 0 to 64. Our final study sample is 86,047 respondent-year observations.
Adjustments to the MEPS Data
Several adjustments were made to the MEPS data that are detailed in the statistical appendix. The first is a reconciliation adjustment for the acknowledged level of expenditure differences between the MEPS and the National Health Expenditure Accounts (NHEA) data, which are widely viewed as a full accounting of national health care expenditures.8 Based on previous work by Sing et al., observed expenditures in the MEPS were inflated by payer (private insurance, Medicare, Medicaid, other) to more accurately represent aggregate medical expenditures in the U.S. as presented in the NHEA.9
We use MEPS data for 2008 to 2010 for the analysis. To project uncompensated care for the 2013 population, two additional adjustments were imposed on the MEPS: The first was a population growth adjustment made to target the 2013 population; the second was to adjust for the change in per capita medical expenditures, which accounts for price and quantity changes per person that occurred between 2008 and 2013. These adjustments are based on the projections of Personal Health Care Expenditures from the NHEA.10
Estimating Uncompensated Care Using the MEPS
One important distinction between the NHEA and the MEPS is that the MEPS data do not include “implicitly subsidized care,” defined here as care received by the uninsured but not paid for by a directly identifiable source that can be linked to the patient. Implicitly subsidized care may be covered through indirect payments made to providers (from either private or public sources) that decrease the cost of medical care provided to the uninsured. Examples of implicitly subsidized care include Medicaid DSH payments and private grant programs.
We estimate the amount of implicitly subsidized care using the MEPS data. This calculation, detailed in the statistical appendix, compares the level of payment providers would have expected, on average, from the uninsured if they had had insurance to what they actually received from the uninsured. The difference is our estimate of implicitly subsidized care.
We define total “uncompensated care” as the costs associated with implicitly subsidized care (described above) plus expenditures from indirect sources made on behalf of the uninsured. These indirect sources, which we refer to as “other private, public, and unclassified sources,” include a wide range of payers such as the Veterans Administration, the Indian Health Service, local and state health departments, as well as automobile and homeowner’s insurance.11 We did not include spending from the MEPS expenditure category “other public” that is sometimes linked to uninsured individuals.12 This “other public” category is actually Medicaid expenditures, for which in theory there should be none for our study sample of individuals during the period in which they report being uninsured. That we find some Medicaid expenditures in periods in which an individual reported being uninsured may reflect a presumptive Medicaid eligibility decision and/or reporting error made by respondents.
Results for MEPS Analysis
Health Care Spending and Uncompensated Care Costs per Uninsured Person
Using the MEPS data, Table 1 reports projected estimates of per capita medical spending among nonelderly respondents, by insurance status and source of payment in 2013.13 We show spending estimates by four insurance statuses: all uninsured (full-and part-year uninsured), full-year uninsured only, part-year uninsured only, and, for comparison, full-year insured. For the part-year uninsured, we further break out spending and show spending while individuals are insured and while they are uninsured. We broke out sources of payment by direct payment sources (out-of-pocket, private insurance, Medicare, Medicaid, and other public) and indirect sources, including other private, public, and unclassified sources, and an estimate of implicitly subsidized care.
Across all uninsured (both those uninsured for the full year and those uninsured for only part of the year), medical spending per capita totaled a projected $2,876 in 2013 (Column 1). The single largest source of payment for the uninsured is implicitly subsidized care, which equals $653 per person. Indirect payments made by other private, public and unclassified sources were the second highest ($604 per person). Taken together, uncompensated care spending for the full-year uninsured is estimated at $1,257 per person in 2013, which represents approximately 44 percent of total per capita medical spending ($2,876) for the uninsured overall.
For the full-year uninsured (column 2), by far the largest single source of payment for health is implicitly subsidized care, which equals $1,005 per person. Indirect payments made by other private, public and unclassified sources were the second highest ($697 per person). Taken together, uncompensated care spending for the full-year uninsured are estimated at $1,702 per person in 2013, which represents approximately 70 percent of total per capita medical spending ($2,443) for the full-year uninsured. Remaining spending are payments made out-of-pocket by the uninsured ($500 per person) and spending by other public sources ($240 per person).
| Table 1: Per capita medical spending by insurance status and source of payment among the nonelderly (projected 2013$) | ||||||||
| All uninsured | Full-year uninsured | Part-year uninsured | Full-year insured | |||||
| (1) | (2) | (3) | (4) | (5) | (6) | |||
| All | While insured | While uninsured | ||||||
| Sample size | 26,419 | 15,627 | 10,792 | 57,979 | ||||
| 2013 population estimate | 72,180,997 | 40,799,801 | 31,381,196 | 196,400,000 | ||||
| Total expenditures ($) | $2,876 | $2,443 | $3,439 | $2,878 | $561 | $4,876 | ||
| By source of payment ($) | ||||||||
| Direct sources | $1.62 | $740 | $2,762 | $2,601 | $162 | $4,644 | ||
| Out-of-pocket | $490 | $500 | $476 | $315 | $162 | $610 | ||
| Private insurance | $559 | $0 | $1,286 | $1,286 | $0 | $2,966 | ||
| Medicare | $24 | $0 | $56 | $56 | $0 | $343 | ||
| Medicaid | $411 | $0 | $944 | $944 | $0 | $725 | ||
| Other public a | $136 | $240 | $0 | $0 | $0 | $0 | ||
| Indirect sources (uncompensated care) | $1,257 | $1,702 | $677 | $278 | $399 | $232 | ||
| Other private, public & unclassified sources b | $604 | $697 | $482 | $278 | $204 | $232 | ||
| Implicitly subsidized | $653 | $1,005 | $195 | $0 | $195 | $0 | ||
| Source: Urban Institute estimates using MEPS data representing calendar years 2008, 2009, and 2010, pooled together.Note: Estimates are restricted to respondents aged 0-64 with 12 months of health insurance data.a Corresponds to the MEPS expenditure category “other public,” which are Medicaid payments among respondents that reported zero months of Medicaid coverageb Includes payments from the following MEPS expenditure categories: other private, VA, Tricare, other federal, other state & local, workers compensation, and other unclassified sources. | ||||||||
As expected, medical spending for those covered by health insurance for the entire year are much higher than that that of uninsured. Per person spending among the full-year insured equals $4,876 per person (column 6), about 70 percent higher than that for all uninsured ($2,876; column1).Medical spending for the part-year uninsured was estimated at $3,439 per person (column 3). Not surprisingly, most health care costs for part-year uninsured (84 percent, or$2,878 per person, column 4) occurred during periods in which they had insurance. Private insurance and Medicaid contributed approximately 77 percent of per capita spending during the time respondents reported being insured ($1,286 and $944 per person, respectively). For the period during which these individuals were uninsured (column 5), medical spending was just $561 per person. Implicitly subsidized care was $195 per person, while expenditures from other private, public, and unclassified sources were $204 per person.
Aggregate Uncompensated Care Spending for the Uninsured Population
Table 2 reports projected aggregate medical expenditures for 2013 for the entire uninsured nonelderly population for the months that they were uninsured.14 Column 1 shows aggregate medical expenditures for individuals who were uninsured at any time during the year; columns 2 and 3 show this information for full-year uninsured only and part-year uninsured only, respectively. Total uncompensated care for all uninsured in 2013 is estimated at $84.9 billion (column 1). Nearly two-thirds of that uncompensated care ($49.0 billion) is implicitly subsidized care with the balance ($35.9 billion) paid by other private, public, and unclassified sources. Uncompensated care for the uninsured accounts for approximately 70 percent of their total medical expenditures while uninsured ($121.0 billion) in 2013. Remaining expenditures for the uninsured were $25.8 billion in out-of-pocket payments and $10.3 billion in Medicaid spending (i.e., “other public”), which likely represent retroactive payments.15 The vast majority of uncompensated care (85 percent; $72.0 billion) spent on the uninsured is for those who are without insurance the full year (column 2).
| Table 2: Aggregate medical expenditures for the nonelderly uninsured, by source of payment (projected, billions 2013$) | |||
| (1) | (2) | (3) | |
| All uninsured, at any point during the year | Full-year uninsured | Part-year uninsured | |
| Total uncompensated care expenditures | $84.9 | $72.0 | $12.9 |
| Implicitly subsidized a | $49.0 | $42.7 | $6.3 |
| Other private, public & unclassified sources b | $35.9 | $29.3 | $6.6 |
| Out-of-pocket expenditures | $25.8 | $20.6 | $5.1 |
| Other public c | $10.3 | $10.3 | $0.0 |
| Total medical expenditures | $121.0 | $102.9 | $18.1 |
| Source: Urban Institute estimates using MEPS data representing calendar years 2008, 2009, and 2010, pooled together.Note: Per capita expenditures in Table 1 were calculated over MEPS respondents with 12 months of health insurance data, whereas the aggregate expenditures in Table 2were calculated over all respondents. As a result, the aggregate estimates are larger than the per capita estimates multiplied by their respective population size. In addition, aggregate spending estimates are calculated only for periods of time that people lack coverage. Months during which the part-year uninsured had insurance coverage are not counted.a See the statistical appendix for details on the construction of implicitly subsidized care.b Includes the following MEPS expenditure categories: other private, VA, Tricare, other federal, other state & local, workers compensation, and other unclassified sources.c Corresponds to the MEPS expenditure category “other public,” which are Medicaid payments among respondents that reported zero months of Medicaid coverage. | |||
Report: Uncompensated Care Provided By Site Of Service
In this section, we present a second estimate of 2013 uncompensated care costs. Given the many assumptions required to generate the estimates, we made two estimates to crosscheck our work. The data we use for the second estimate also enables us to assess how the burden of uncompensated care is divided among health care providers and what are the different sources of funding currently in the health care system to help pay for uncompensated care.
Aggregate Uncompensated Care for Uninsured Using Second Approach
Under the second approach, we estimate that uncompensated care totaled $74.9 billion in 2013 (Table 3). This is about 12 percent lower than the $84.9 billion in uncompensated care we estimate using MEPS data (Table 2). The lower estimate generated under the second approach likely reflects the lack of data for some known sources of uncompensated care. For example, using the second approach, we do not have information on the free drugs provided by pharmaceutical companies. Similarly, we do not have data on uncompensated care that is recognized as being provided by a wide range of health providers such as pharmacists, dentists, optometrists, therapists, and providers of medical devices and supplies.16
| Table 3: Uncompensated Care Costs by Place of Service (projected, 2013 ($billions)) | ||
| Place of Service | Total Costs | % Costs |
| Total Uncompensated Care | $74.9 | 100% |
| Hospital-based | $44.6 | 59.5% |
| Community-Based | $30.3 | 40.5% |
| Publicly Supported | $19.8 | 26.4% |
| Federal | $14.8 | 19.8% |
| State/local | $5.0 | 6.7% |
| Office-Based Physicians | $10.5 | 14% |
| Source: Urban Institute estimates derived from secondary data. | ||
The difference between our two estimates could also reflect the conservative assumptions we made about uncompensated care provided by publicly supported providers such as the Veterans Administration and the Indian Health Service (see below). For uncompensated care supported by these public programs, we assume that that the uninsured use care proportionate to their share of the overall population. In reality, however, the insured have access to other providers and probably only occasionally use publicly-supported providers like the Veterans Administration. We are thus likely underestimating the level of uncompensated care these publicly-supported providers render to the uninsured.
Uncompensated Care Costs by Place of Service (Hospital versus Community)
Of the $74.9 billion in uncompensated care for the uninsured (the estimate from the published data from government sources and provider data), we further estimate that about 60 percent ($44.6 billion) is provided by hospitals, with the balance ($30.3 billion) rendered by community-based providers, including those who receive public funds and office-based physicians (Table 3). Of the uncompensated care rendered in the community, $14.8 billion was provided by a collection of community-based providers that are at least in part sponsored by the federal government such as the Veterans Administration. Another $5.0 billion was provided by community-based health care programs and services supported with funds provided by states and local governments. Office-based physicians provided an estimated $10.5 billion in uncompensated care to the uninsured. Below we describe the various data sources and assumptions we used to arrive at these estimates.
Data and Assumptions Used for Uncompensated Care by Place of Services Analysis
Hospital Uncompensated Care Costs
Uncompensated care is defined by the American Hospital Association (AHA) as care for which no payment is ever received from the patient or an insurer.17 The AHA’s estimate of hospitals’ total unreimbursed costs includes both bad debt and charity care but excludes underpayment from Medicaid and Medicare. The AHA defines charity care as unreimbursed services for which hospitals did not expect to receive payment because the patient’s inability to pay had been predetermined; bad debt is unreimbursed services for which hospitals had expected to receive a payment but ultimately did not receive payment. Despite the differences in how they are defined, in practice hospitals often struggle to draw a distinction between charity care and bad debt.18
The AHA calculates the cost of uncompensated care by multiplying hospitals’ charges for uncompensated care by their cost-to-charge ratios. Using data from its 2011 annual survey, the AHA reported that, nationally, uncompensated care comprised 5.9 percent of total hospital expenses, costing hospitals approximately $41.1 billion.19 We inflate this estimate to report that hospitals delivered $44.6 billion in uncompensated care in 2013 (Table 3).
Community-Based Uncompensated Care
We break out community-based uncompensated care into two categories: (1) uncompensated care provided by community-based providers that received financial support from the federal government, states and localities, and (2) uncompensated care provided by office-based physicians. Overall, we estimated that community-based uncompensated care totaled $30.3 billion in 2013.
Publicly-Supported. Of community-based uncompensated care, $19.8 billion is sponsored with public funds, either through the federal government or states and localities. Federal programs that support such community-based care include the Veterans Health Administration, the Indian Health Service, and HRSA’s Community Health Centers. State and local governments also support community-based programs that provide health care services to the uninsured.
To develop the estimate of federal funds for community-based uncompensated care, we rely on program and budget data published by six federal programs that support care delivered by clinics and other direct care providers. Specifically, we include spending on six federal programs: the Veterans Administration, the Indian Health Service, the Community Health Centers, the Maternal and Child Health Bureau, and the HIV/AIDS Bureau (Ryan White Care Act).20 Many of these providers also render care to insured low-income individuals. To the extent possible, we exclude from our estimates of uncompensated care the share of costs attributable to patients with insurance. We also exclude, to the extent possible, costs associated with long-term care services. In particular, our estimates of uncompensated care spending by federal programs use published program expenditure data for acute care medical services and the share of program costs (or users) identified as being provided to uninsured or self-pay patients. The proportion of uninsured users were either estimated directly from program-specific data or computed from health insurance coverage data collected by the Current Population Survey.
For the estimate of uncompensated care supported by state and local governments, we used information on public assistance programs for which data are available from the Office of the Actuary at the Centers for Medicare and Medicaid Services).21 We estimate that state and local governments’ indigent care and public assistance programs also spend a large amount on care for the uninsured—$5.0 billion in services delivered to the uninsured rendered by a variety of providers.
Office-Based Physicians’ Uncompensated Care
Office-based physicians were estimated to provide $10.5 billion in uncompensated care to the uninsured in 2013. To derive this estimate, we figured number of hours of care physicians provide to the uninsured and then multiplied that by the average gross hourly income of physicians. We used two data sources for this calculation. The first was the 2008 Health Tracking Physician Survey conducted by The Center for Studying Health System Change which reported that in 2008, 59.1 percent of physicians provided some charity care, providing an average of 9.5 hours per month delivering that care.22 Using a 2007 estimate of physicians’ average gross earnings per hour of $281.50,23 and inflating to 2013 prices, we arrive at an estimate of $9.4 billion in uncompensated care delivered by physicians.24
The second data source we use to estimate the level of physicians’ uncompensated care was the 2009 American Medical Association’s Physician Practice Information Survey which found that 53.5 percent of physicians spent an average of three hours per week (or 12 hours per month) delivering uncompensated care.25 Using the weighted number of physicians from the CSHC survey, this would amount to $11.6 billion in uncompensated care from physicians. Since these estimates were fairly close, we split the difference and estimate that the amount of uncompensated care provided by physicians is $10.5 billion in 2013.
As mentioned, we acknowledge that our estimate of uncompensated care provided in the community is understated because we do not include uncompensated care known to be rendered by a host of other providers, including pharmacists and dentists.
Report: Sources Of Funding For Uncompensated Care
Relying on secondary data sources, we estimate that uncompensated care for the uninsured to be $74.9 billion in 2013 (Table 3). Providers, however, often do not bear the full cost of their uncompensated care. Through various, complicated ways, funding is available from a wide variety of sources (e.g., the federal government as well as private entities) to help providers defray the costs associated with uncompensated care. Sometimes this funding is directly linked to an individual patient’s care, but often it is paid out in a lump sum such as Medicaid DSH payments or state or local grants dedicated to fund community indigent health programs or services.
Uncompensated care funding sources are diverse, ranging from the Medicaid program, to the Veterans Administration, to community health centers. In this section, we estimate the level of funds provided by major funders of uncompensated care in 2013, including the federal government, states and local governments, and private entities. To do this, we rely on several data sources, including program and budget data we used in the previous sections.
Table 4 summarizes our results on sources of uncompensated care funding in 2013. We estimate that across the various funding streams, $53.3 billion was paid in 2013 to help providers offset uncompensated care costs. As shown, the federal government is by far the largest funder of uncompensated care. In 2013, we estimate across a range of programs, the federal government provides $32.8 billion (61.5 percent) to help providers cover costs associated with caring for the uninsured. State and localities are the second largest, providing another $19.8 billion; the private sector is estimated to contribute $0.7 billion.
In terms of programs, Medicaid is the single largest funder of uncompensated care. In 2013, we estimate Medicaid contributed $13.5 billion to help pay for care for the uninsured, accounting for 25.3 percent of funding. At $9.8 billion, state and local appropriations for indigent care programs were the second largest funder, followed by the Veterans Administration ($8.1 billion) and Medicare ($8.0 billion). Close behind was state and local public assistance funding at $7.3 billion. At a much lower level, community health centers funding totaled $3 billion, followed by the Indian Health Service ($2.1 billion), Ryan White Care Act ($1.5 billion) and Maternal and Child Health Title V Block Grant ($0.1 billion).
We report aggregate Medicaid, Medicare and state and local government payments made to providers, mostly hospitals. At the individual provider level, these payments may overcompensate some providers for their uncompensated care but undercompensate others. To the extent that funding for uncompensated care does not match a given provider’s rendering of that care, the funding reported in Table 4 may not defray providers’ uncompensated care as much as indicated.
| Table 4: Uncompensated Care Funding by Program Type and Funding Source, Projected 2013 ($billions) | ||||
| Funding Source | ||||
| Program | Federal | State/Local | Private | Total |
| Total | $32.8(61.5%) | $19.8(37.1%) | $0.7(1.3%) | $53.3(100%) |
| Medicaid program (DSH and UPL payments) | $11.8 | $1.6 | $13.5(25.3%) | |
| Medicare program (DSH and IME payments) | $8.0 | $8.0(15.0%) | ||
| State/local tax appropriations for indigent programs | $9.8 | $9.8(18.4%) | ||
| State/local public assistance | $7.3 | $7.3(13.7%) | ||
| Veterans Health Administration | $8.1 | $8.1(15.2%) | ||
| Indian Health Service | $2.1 | $2.1(3.9%) | ||
| Community Health Centers | $1.9 | $0.8 | $0.3 | $3.0(5.6%) |
| Ryan White CARE Act | $0.9 | $0.2 | $0.4 | $1.5(2.8%) |
| MCH Title V Block Grant | * | $0.1 | * | $0.1(0.2%) |
| Note: * We estimated that federal government provided $20.0 million and private sources $22.4 million in funding for MCH Title V Block Grant, but because of rounding these amounts are not shown in table.Source: Urban Institute estimates derived from secondary data. | ||||
Data Sources and Assumptions Used for Sources of Funding Analysis
In this section we describe the data sources and the assumptions used to generate the estimates presented in Table 4 by each of the funding sources. As part of this discussion, where appropriate, we break out what share of each funding source is directed to hospitals. This information is used in the following section that looks at the extent to which uncompensated care funding covers providers’ costs.
| Table 5. Estimates of Medicaid and Medicare Supplemental Payments Available to Fund Uncompensated Care, projected 2013($billions) | |||||
| Provider | Potentially Available Amount ($Billions) | ||||
| Federal | State/Local | Total | |||
| Medicaid | |||||
| DSH Payments | 9.6 | 1.5 | 11.1 | ||
| UPL Payments | 14.3 | 1.7 | 16.1 | ||
| Less Medicaid Underpayments | -12.1 | -1.6 | -13.7 | ||
| Total Medicaid | 11.8 | 1.6 | 13.5 | ||
| Medicare | |||||
| DSH Payments | $5.7 | 0.0 | 5.7 | ||
| IME Payments | 2.3 | 0.0 | 2.3 | ||
| Total Medicare | 8.0 | 0.0 | 8.0 | ||
| Source: Urban Institute calculations. | |||||
The Medicaid Program
Medicaid has two major payments that help fund the cost of hospital uncompensated care: DSH payments and upper payment limit (UPL) payments. DSH payments, for which there is a capped federal allotment, are a required Medicaid payment targeted to hospitals that treat large numbers of low-income patients.26 UPL payments are optional Medicaid payments that states can make under the Medicare upper payment limit to a range of providers including hospitals. Since state Medicaid reimbursement levels are often less than those of Medicare’s, states can make additional Medicaid payments that are above their regular Medicaid rates, yet within the Medicare UPL. Both DSH and UPL payments can help defray hospitals’ uncompensated care costs associated with caring for the uninsured as well as help make up for the so-called “Medicaid underpayment” or “Medicaid shortfall” due to Medicaid hospital rates often being less than costs of providing the service.
DSH Payments
To estimate funds available to help pay for hospitals uncompensated care through Medicaid DSH payments we used a several step process. The preliminary 2013 federal Medicaid DSH allotment is $11.5 billion.27 Some share of the allotment (roughly $1.9 billion) is allocated to mental hospitals, so the federal DSH allotment available to acute care hospitals is estimated at $9.6 billion. Assuming that states fully spent out their DSH allotments (which is frequently the case) and applying an average federal match of 59.6 percent in 2013, total federal and state DSH payments to inpatient acute care hospitals in 2013 are estimated to be $16.0 billion, of which $9.6 billion is federal and $6.4 billion is state funds (before adjustments below).28
The state share of DSH payments, however, is often financed with provider taxes (PTs), inter-governmental transfers (IGTs), certified public expenditures (CPEs) and the like. As a result, states’ shares of DSH payments often do not represent new funds to hospitals.29 Based on a 2009 survey of state financing of DSH payments, an estimated 77.2 percent of states’ share of DSH payments to acute care hospitals was financed with revenues gained from PTs, IGTs or CPEs.30 For our study, we assumed that the balance, 22.8 percent, was financed with state general funds (SGFs). We further assumed that the states’ share raised by PTs and the like do not represent “new” funds to the hospitals but SGFs do. Last, we assumed that the share of SGF used to finance inpatient DSH payments has remained constant between 2009 and 2013. Assuming that only 22.8 percent of the state share of DSH payments represent real new dollars to hospitals, we estimate that $1.5 billion ($6.4 billion x 22.8%) in state funds are available to help fund hospitals’ uncompensated care through Medicaid DSH programs. Adding our estimate of the state DSH ($1.5 billion) to our estimate of the full federal DSH allotment for acute care hospitals ($9.6 billion), we estimate a total of $11.1 billion in Medicaid DSH payments were available to acute care hospitals to help cover their uncompensated care costs in 2013 (Table 5).
UPL Payments
According to the CMS-64, in 2011, 34 states made an estimated $17.7 billion (federal and state) in inpatient hospital UPL payments, and 21 states made $4.4 billion (federal and state) in outpatient hospital UPL payments, for combined total UPL payments of $22.1 billion.31 Assuming an average (not-ARRA enhanced) federal match of 59.9 percent in 2011,32 the federal share of UPL payments is $13.2 billion; the state share $8.9 billion in 2011.
Akin to DSH payments, states often use IGT, CPEs and the like to fund UPL payments. A 2009 survey found that 82.0 percent of state’s hospital UPL payments was financed with revenues from provider taxes, IGTs or CPEs. We assume that the balance, 18.0 percent, was financed with SGFs. Consistent with our assumptions for DSH payments, we assumed that the state share raised by PTs, IGTs and CPEs for UPL payments do not represent “new” funds to the hospitals but SGFs do. We also assumed that the share of SGF used to finance inpatient UPL payments has remained constant between 2009 and 2013, and that the same financing ratio applies to both inpatient and outpatient UPL payments.
Applying the 18.0 percent SGF to the estimated state share of UPL payments ($8.9 billion) in 2011, we estimate $1.6 billion of states’ share of UPL were available to fund hospitals’ uncompensated care in 2011. We then used the National Health Expenditures hospital data to inflate the supplemental provider payments from 2013, estimating that UPL payments potentially available to fund hospitals’ uncompensated care for uninsured totaled $16.1 billion, of which $14.3 billion was federal funds and $1.7 billion was state funds (Table 5).
Adjusting for Medicaid Underpayment
In a final step to estimate the level of Medicaid funding potentially available to hospitals for uncompensated care, we subtract a portion of Medicaid DSH and UPL payments as an offset that implicitly compensates some hospitals for low Medicaid payment rates, sometimes referred to as the “Medicaid underpayment.” The AHA defines the Medicaid underpayment as the difference between hospitals’ incurred costs of providing care to Medicaid patients and the reimbursement hospitals receive from state Medicaid programs for that care. The AHA estimated Medicaid underpayments in 2012 at $13.7 billion.33 Distributing this between the federal and state shares, we estimate $12.1 billion in federal payments and $1.6 billion in state payments. We then subtract these underpayments from our estimates of DSH and UPL payments. After adjusting for underpayments, estimate that total Medicaid payments available to cover hospital uncompensated care were $13.5 billion in 2013. 34
The Medicare Program
Medicare provides support for uncompensated care through Medicare DSH payments and its indirect medical education (IME) program. All Medicare payments for uncompensated care are from federal funds.
Medicare DSH payments
Medicare’s DSH adjustment to payment rates, included in the Prospective Payment Systems (PPS) for hospital inpatient services, is an attempt to provide additional funding to hospitals that treat a large number of poor patients. Hospitals qualify for Medicare DSH payments if their ratio of low-income patients (called the disproportionate patient percentage or DPP) is above 15 percent. The DPP is calculated using the proportion of Medicare inpatient days accounted for by Medicare beneficiaries who are eligible for Supplemental Security Income and the proportion of all inpatient days by people covered by Medicaid.
Medicare DSH payments are justified by the assumption that hospitals that treat a large proportion of low-income patients have higher costs and thus need to be reimbursed at higher rates. In recent years, however, there has been some dispute over whether a hospital’s share of low-income patients is actually correlated with higher costs. Medicare Payment Advisory Commission (MedPac) studies have found that the DPP, the low-income patient share, is only loosely tied to higher Medicare costs per case.35 The distribution of DSH payments also calls into question whether they solely support indigent care, as their distribution across hospitals often does not align with where the concentration of uncompensated care is the highest.36 Consequently, we assume that only half of Medicare DSH payments actually support uncompensated care. Given the Congressional Budget Office’s 2013 forecast of $11.4 billion37 in Medicare DSH payments, we attribute $5.7 billion as potentially available to pay for hospitals’ uncompensated care for the uninsured (Table 5).
Medicare IME payments
An adjustment for IME, based on the hospital’s ratio of residents per bed, is also incorporated into Medicare hospital payments in an effort to recognize the higher patient costs incurred by hospitals with graduate medical programs. A major justification for this adjustment rests on the claim that teaching hospitals take on the responsibility of treating the uninsured, among other important social missions. Recent MedPac studies, however, also questioned the strength of this relationship. IME payments appear to support many functions in addition to supporting uncompensated care. For this reason, we attribute only one-third of total IME payments, $2.3 billion, to care for the uninsured.38 We combine the portion of Medicare’s DSH and IME program payments, which are potentially available to support uncompensated care, and calculate that $8.0 billion in federal dollars are available to support uncompensated care through the Medicare program in 2013 (Table 5).
State and Local Governments
Medical care for the uninsured is funded by payments from state and local governments in the form of tax appropriations and support to public assistance and indigent care programs for which data are published by the Office of the Actuary at the Centers for Medicare and Medicaid Services (CMS).39 Although there is no information to indicate exactly how these tax appropriations are used, they are largely directed to public hospitals to support a variety of functions.40 So while these funds are not specifically earmarked to support uncompensated care to the uninsured, the hospitals to which they are targeted suggest they are available for that purpose.
In 2011, CMS reported that the total state and local medical care spending was $20.9 billion, with $18.1 billion going to hospitals and $2.8 billion going towards supporting home health care and other personal services. We only include those funds going towards hospitals; we assume that the funds directed towards home health care and other personal services likely support long-term care services, which we excluded. We assume that half of public payments to hospitals support uncompensated care, (with the remaining half going to other hospital functions), which produces an estimate of $9.1 billion in 2011. After inflating to 2013, our estimate of state and local appropriations dedicated to indigent health care programs is $9.8 billion (Table 4).
The CMS data also report that state and local government public assistance programs or indigent care programs spent $6.7 billion on medical care in 2011, with $2.1 billion going to hospitals; the balance ($4.6 billion) went to physicians and clinic services, prescription drugs, and other providers. After inflating to 2013 dollars, we estimate that these state and local public assistance programs support $7.3 billion in uncompensated care (Table 4).
Veterans Health Administration
The Veterans Health Administration (VHA) spent $45.5 billion on medical care for veterans in 2012 (Table 6).41 Using the President’s Budget for the Department of Affairs Medical programs, we calculated that $32.4 billion, 71 percent of total VHA medical care spending, funded direct acute hospital care, outpatient care, and related operating expenses.42 According to a study conducted on veteran’s health insurance coverage, 24 percent of VHA users lack health coverage.43 Applying the proportion of VHA users who are uninsured, 24 percent, to the estimate of acute hospital and outpatient care spending, $32.4 billion, we estimate that the VHA spent approximately $7.8 billion on care to the uninsured in 2012. Inflating this figure to the projected 2013 budget level produces an estimate of $8.1 billion in VHA spending on the uninsured in 2013, all of which is federal funds (Table 4).44 VHA is a federal program, so all these funds are attributed to federal sources.
| Table 6. Veterans Health Administration (VHA) Expenditures on Care to the Uninsured, 2013 ($billions) | ||
| Total VHA medical expenditures, 2012 | $45.5 | |
| Amount for direct acute medical care (71% of total)a | $32.4 | |
| Percent of VHA Users with Only VHA Coverageb | 24.0% | |
| Estimated Direct Medical Care Expenditures on the Uninsured, year | $7.8 | |
| Inflated to 2013 budget estimate (factor of 1.037)c | $8.1 | |
| Source: U.S. Dept. of Veterans Affairs expenditures data: http://www.va.gov/vetdata/Expenditures.asp.a 71% derived from FY 2012 national VHA budget (in millions): acute hospital care services (7,210) + outpatient care services (24,126) + proportionate general operating expenses ($1,052) = total direct medical ($32,388)/total medical program budget ($45,521) = 71%. See http://www.whitehouse.gov/sites/default/files/omb/budget/fy2013/assets/vet.pdf.b Could not find a more recent estimate so we are using the estimate from Shen, Lee, Hendicks and Kazis. “Veteran’s Health Insurance and Demand for VA Care.” http://gateway.nlm.nih.gov/MeetingAbstracts/102272533.html.c Inflation factor based on difference between 2012 estimated VA budget for medical services and 2013 estimate budget for these services. Department of Veteran’s Affairs FY 2013 Budget Estimate. http://www.va.gov/budget/summary/VolumeMedicalPrograms.pdf. | ||
Indian Health Service
Approximately 2.1 million of the nation’s estimated 3.3 million American Indians and Alaskan natives receive health care from the Indian Health Service (IHS). The extensive Federal IHS delivery system is comprised of 28 hospitals, 61 health centers, and 33 health stations, with additional services purchased from private providers outside the IHS delivery system.45 The IHS is a significant source of care for those without another source of health coverage, as 32 percent of American Indians and Alaska Natives are uninsured.46
The IHS was budgeted to receive $3.1 billion in Federal appropriations for acute care services in 2013 (Table 7).47 We subtract third-party collections for acute care services from total expenditures on these services and calculate what share of this funding is devoted to care for the uninsured. With third-party payers paying for approximately one-third of acute care services, we estimate that the IHS will spend $2.1 billion in federal funds on the uninsured in 2013 (Table 4).48
| Table 7. Indian Health Service Appropriations for Medical Care to the Uninsured ($billions), 2013 | |
| Acute Care Services, 2013 | $3.1 |
| Insurance Collections | $1.0 |
| Total Support for Care to Uninsured (AC funding – AC collection)a | $2.1 |
| Source: Department of Health and Human Services Indian Health Service FY 2013 Performance Budget Submission.a Uses FY 2013 continuing resolution estimate from Department of Health and Human Services Indian Health Service FY 2014 Justification of Estimates for Appropriations Committees so no inflation necessary. http://www.ihs.gov/BudgetFormulation/documents/FY2014BudgetJustification.pdf. | |
Community Health Centers
In 2011, the Community Health Centers (CHC) program delivered care to over 20 million patients, including 7 million uninsured, about 36 percent of total patients CHCs served.49 We calculate total CHC spending on medical and clinical care services by summing direct care costs and related facility/administrative costs and estimate a total of $12.3 billion in direct medical spending in 2011 (Table 8).50 We exclude costs associated with enabling services such as case management and outreach. To estimate CHC spending on the uninsured, we apply the proportion of charges attributable to uninsured patients, 27.2 percent, to the total costs for direct care ($12.3 billion) to estimate $3.3 billion spent on care for the uninsured. We also subtract out-of-pocket payments by the uninsured ($0.8 billion) to estimate that CHCs provided $2.5 billion in uncompensated care for the uninsured in 2011.51 Inflating this figure to the projected 2013 budget level produces an estimate of $3.0 billion in CHC spending on the uninsured.
| Table 8. Estimated Cost of Uncompensated Care to the Uninsured at Community Health Centers, 2013 ($billions) | ||
| Medical and Clinical Service Costs, 2011a | $12.3 | |
| Share of Charges * (Uninsured) | 27.2% | |
| Medical and Clinical Service Costs (Uninsured) | $3.3 | |
| Self-Pay Collections (Uninsured) | $0.8 | |
| Total-Uncompensated Care Costs (Uninsured) | $2.5 | |
| Inflated to 2013 Budget Estimate (factor of 1.196)b | $3.0 | |
| Source: Bureau of Primary Health Care, HRSA, Uniform Data System, National Rollup report (2011).Notes:*Uninsured patients’ charges / all patients’ charges = $3.78 / $13.88 = 27.23%.a Accrued cost for medical care and other clinical services. Does not include any facility or non-clinical support services.b Inflation factor based on difference between 2011 actual Community Health Center budget and President’s 2013 budget for the program. FY 2013 HHS Budget in Brief. http://www.hhs.gov/budget/budget-brief-fy2013.pdf | ||
To support their operations, CHCs receive financial support from the federal government, states and localities as well as private funds. To break down the total amount spent by the CHC on the uninsured into that funded by the federal government, state/local, and private sources, we assume that the proportion in which they support uncompensated care is the same as the proportion in which they contribute to CHCs’ grant revenues. By applying these ratios to the total CHC uncompensated care costs, we calculate that federal spending, which is responsible for 63.0 percent of CHC grant revenue, accounts for $1.9 billion of CHCs’ uncompensated care. State/local spending, which is responsible for 27.5 percent of CHC grant revenue, pays for $830.5 million, and private spending, 9.4 percent of CHC grant revenue, pays for $283.9 million in 2013 (Table 4).52
Ryan White CARE Act
The Ryan White Comprehensive AIDS Resources Emergency Act (CARE) provides HIV-related services to over half a million people each year who are low-income, uninsured, or underinsured persons living with HIV and AIDS. CARE funds are directed to supporting primary medical care, including outpatient and inpatient services, as well as providing medications and support services.53 The majorityof direct medical care delivered via the CARE Act is funded through Part A (emergency assistance to the metropolitan areas most affected by the HIV/AIDS epidemic) and Part B, including the AIDS Drugs Assistance Program (ADAP).54 We only include the funds directed through these two parts of the program in our estimate of uncompensated care to the uninsured.
To calculate the share of CARE spending that is attributable to care for the uninsured (Table 9), we first calculate the share of funds spent on direct medical care in each of three categories: Part A spending (83 percent), Part B non-ADAP spending (77 percent), and Part B ADAP spending (100 percent).55 We then multiply the total medical care spending in each category by the share of charges attributable to the uninsured based on the uninsured rate among that part of the program’s users. Sixty percent of ADAP users are uninsured,56 and 33 percent of all CARE Act recipients are uninsured.57 Applying these proportions of the uninsured patients to their respective total costs attributable to direct medical care, we estimate $1.4 billion was spent on the uninsured in 2012. After inflating this figure to anticipated 2013 budget levels, we estimate that the CARE Act Program spent $1.5 billion in spending on the uninsured.58
To calculate the distribution of CARE Act program’s total spending among federal, state/local, and private sources we add the federal share of ADAP spending (50.2 percent) to Part A and Part B non-ADAP spending, both of which are entirely federally funded. This produces an estimated $904.8 million in federal funding. State and local governments contribute 16.5 percent of ADAP funding, resulting in an estimated $197 million in spending on the uninsured. Private sources provided $398 million (Table 4).59
| Table 9. Ryan White CARE Act Spending on Medical Care to the Uninsured, 2013 ($billions) | |
| Part A | |
| Federal Grants to Eligible Metropolitan Areas | $0.7 |
| Amount for Direct Medical Care | 83.2% |
| Percent of Part A Patients Uninsuredc | 33% |
| Part A Medical Care Spending on Uninsured | $0.2 |
| Inflated to 2013 budget estimate (factor of 1)d | $0.2 |
| Part B (Non-ADAP) | |
| Federal Grants (excluding ADAP) | $0.4 |
| Estimated Share for Direct Medical Careb | 76.7% |
| Percent of CARE Act Patients Uninsuredc | 33% |
| Part B Spending on Uninsured | $0.1 |
| Inflated to 2013 budget estimate (factor of 1.033)d | $0.1 |
| Part B AIDS Drug Assistance Program (ADAP) | |
| Total ADAP Budget, Federal and State Sourcesa | $1.9 |
| Amount for Direct Care | 100% |
| Percent of ADAP Patients Uninsured | 60% |
| ADAP Spending on Uninsured | $1.1 |
| Inflated to 2013 budget estimate (factor of 1.072)d | $1.2 |
| Total Ryan White Care to Uninsured, 2013 | $1.5 |
| Source: The Ryan White HIV/AIDS Program Progress Report 2012. Ahead of the Curve. U.S. Department of Health and Human Services. November 2012. http://hab.hrsa.gov/data/reports/progressreport2012.pdf; Kaiser State Health Facts Online, Insurance Status of AIDS Drug Assistance Program (ADAP) Clients, 2011 www.statehealthfacts.org; HRSA. Part A Allocations Report for Total Part A Grantees http://hab.hrsa.gov/data/reports/files/fy12partaallocations.pdfand FY 2012 Allocation Report for All Grantees http://hab.hrsa.gov/data/reports/files/fy12partballocations.pdfNotes:a The ADAP budget is spending almost entirely on medications. Some states also use ADAP funds to purchase/maintain health insurance coverage. This figure does not include nationwide ADAP spending on insurance.b Excludes support services, outreach and education, case management, and early intervention. Includes a proportionate amount of administration and planning monies.c CRS Report for Congress reports that in 2011, 33% of the patients served by the Ryan White program are uninsured. http://www.fas.org/sgp/crs/misc/RL33279.pdfd Inflation factor based on difference between 2011 actual Ryan White HIV/AIDS Activities budget and President’s 2013 budget for the program. FY 2013 HHS Budget in Brief. http://www.hhs.gov/budget/budget-brief-fy2013.pdf | |
Maternal and Child Health Bureau
The Title V Maternal and Child Health (MCH) Block Grant program supports a broad range of enabling, population-based, and direct health care services for over 44 million pregnant women and children, including children with special health needs.60 The program’s primary aim is to improve the health of all mothers and children in the U.S., focusing on low-income, uninsured, and underinsured persons. On average, 7.5 percent of those served by the program are uninsured.61
To estimate the share of MCH Block Grant spending that goes toward care for the uninsured, we calculate the share of total spending for each category of program recipient (pregnant women, infants, etc.) that is attributable to direct care services, 65.5 percent, and add a proportionate share of infrastructure expenditures. We then multiply this spending by the share of program recipients in each category who are uninsured, which produces an estimated $213 million in MCH spending (Table 10). Because some MCH spending comes from program income, we reduce estimated total spending on the uninsured by 33 percent and calculate an estimate of $142.7 million in uncompensated care for the MCH Block Grant.
We allocate MCH’s total spending on the uninsured among state/local, federal, and private funding sources by multiplying the MCH spending on the uninsured by the share of total program spending attributable to each source. The bulk of the funding, 69.5 percent is attributable to state/local governments, which accounts for $99.2 million. The federal government is responsible for 14 percent, $20.0 million, and private sources fund the remaining 15.7 percent, $22.4 million (Table 4).62
| Table 10. Maternal and Child Health (MCH) Block Grant Spending on Care for Uninsured in US, 2013 ($millions) | ||||||
| Pregnant Women | Infants<1 | Children 1-22 | Children w/ Special Health Needs | All Others | All Users | |
| Total MCD Block Grant expenditures, 2013a | $302.2 | $405.1 | $1,175.1 | $3,593.7 | $262.6 | $5,738.7 |
| Average share attributable to Direct Health Care & Related Infrastructure: 65.5*% | $214.3 | $287.3 | $833.6 | $2,549.2 | $186.3 | $4,068.7 |
| Percent of users uninsured | 5.4% | 5.6% | 5.7% | 3.6% | 24.7% | — |
| Est. MCH Block Grant spending on uninsured, 2013 | $11.6 | $16.1 | $47.5 | $91.8 | $46.0 | $213.0 |
| Source: Maternal and Child Health Bureau, HRSA Title V Information System (TVIS), FY 2011, https://performance.hrsa.gov/mchb/mchreportsa Included Federal allocation, match and overmatch, and program income.b Inflation factor based on difference between 2011 actual Maternal and Child Health Bureau budget and President’s 2013 budget for the program. FY 2013 HHS Budget in Brief. http://www.hhs.gov/budget/budget-brief-fy2013.pdf | ||||||
Report: Cost Shifting And Remaining Uncompensated Care Costs
Some observers maintain that some uncompensated care is financed by private insurance through cost-shifting—that is, health care providers, particularly hospitals, make up for losses they incur in treating uninsured patients by charging higher prices to and collecting higher payments from privately insured patients. This is a long-standing, complicated and controversial issue. Recent data suggest that private insurance payments exceed hospitals’ costs by over 30 percent.63 In contrast, payments by both Medicare and Medicaid are less than hospital costs.64 That private insurance payments exceed hospitals’ costs by a considerable amount enables hospitals to finance Medicare and Medicaid underpayments, as well as other expenditure items hospitals determined to be part of their missions.
However, there is limited evidence to indicate that rising numbers of uninsured people (and thus increases in uncompensated care) have caused hospitals to increase their charges to the privately insured. Even as the uninsured rate grew over the past two decades, hospitals’ uncompensated care as a share of overall cost has remained steady. Further, the private payment to cost ratio has steadily increased since 2001, suggesting that the rise in private surpluses is related to other forces, not caring for the uninsured.
Some hospitals with substantial market power in a local area may be able to negotiate higher charges in response to an increase in uncompensated care or a growth in Medicare and Medicaid underpayments. A prime example of such a hospital is major teaching hospitals. MedPac data, however, have shown that major teaching hospitals typically have lower private payment to cost ratios, high ratios of uncompensated care costs as a percentage of overall cost, and low total margins compared with other hospitals.65 MedPac work has also demonstrated that while some teaching hospitals may be able to increase charges when necessary, this does not seem to be the dominant pattern for hospitals overall.66 Specifically, MedPac found that in markets where private payments were high, hospital costs were also high. The presence of high private payments meant financial pressure was weak and hospitals incurred greater costs. Hospitals in these markets often lost money on Medicare because Medicare payments are set exogenously based on diagnoses and geographic cost indices, not the actual cost experience of the hospitals. This study also reported that in areas where there was more financial pressure because of a more competitive market, hospitals could not demand higher private payments, thus their costs were lower but their Medicare margins higher.
Based on the data generated in this study, we estimate the potential scope of cost shifting to private payers is relatively small. The value of uncompensated care in 2013 was $84.9 billion, and government sources provided $53.3 billion in payments to providers to help offset these costs. Of the remaining $31.6 billion in uncompensated care, $10.5 billion is charity care provided by office-based physicians (Table 3), which leaves $21.1 billion in uncompensated care costs that arguably could be financed by private insurance in the form of higher payments and ultimately higher insurance premiums in 2013. Total private health insurance expenditures in 2013 are estimated to be $925.2 billion (based on NHE projections). Using our estimate of $21.1 billion in providers’ uncompensated care costs that does not represent physician charity or is not covered by government funds, the amount potentially associated with uncompensated care cost shifting is only 2.3 percent of private health insurance costs in 2013. Even if our $21.1 billion estimate of the level of providers’ uncompensated care costs that is potentially financed by private insurance is off by as much as 100 percent (due to government funds overpaying some hospitals and undercompensating others, for example) and is instead $42.2 billion, the potential cost shift of caring for the uninsured to private insurance would only account for 4.6 percent of private health insurance costs in 2013.
Report: Discussion
In this study, using MEPS data, we estimated providers’ uncompensated care for the uninsured in the U.S. health system at $84.9 billion in 2013. Relying on secondary data from government and provider sources, we produced a second 2013 estimate of uncompensated care of $74.9 billion. We believe that the latter understates uncompensated care: For one, the second estimate does not include acknowledged uncompensated care provided by office-based non-physician health care providers such as dentists, optometrists and chiropractors. Further, owing to data limitations, we made some admittedly crude assumptions about the shares of government-sponsored community-based providers’ budgets (such as the Veterans Administration) that went to pay for care for the uninsured. For many of these providers, we assumed this share was equal to the level of uninsurance in the overall population. Given that insured individuals generally have more options on where to get health care than the uninsured, we recognize that this assumption underestimates how much of these providers’ budgets is spent on the uninsured. For these reasons, we believe that the $84.9 billion estimate is closer to the actual level of uncompensated care in 2013.
While providers incur significant costs in caring for the uninsured, the bulk of their costs are compensated through a web of complex funding streams that are financed largely with public dollars. Only a small share, at the most 4.6 percent, of uncompensated care is estimated to be paid for through cost-shifting to those with private insurance.
We estimate that in the aggregate nearly two-thirds of providers’ uncompensated care costs are offset with government payments designed to cover these costs. Importantly, however, our analysis examines providers’ uncompensated care costs and sources of funding overall, not at the individual provider level. It has long been recognized that funding for uncompensated care is not perfectly allocated to match each provider’s uncompensated care. As a result, some providers likely incur costs caring for the uninsured for which they receive little to no compensation for. Indeed, important provisions in the ACA calls for improved targeting of Medicaid and Medicare DSH payments to hospitals.
Consistent with earlier work, our analysis shows that the federal government is the largest funder of uncompensated care, providing more than three-fifths of the available funding. Through DSH and UPL payments, we estimate that Medicaid provided 25.3 percent of total available public funds to cover uncompensated care costs, far surpassing the level of other funding streams. The Medicare program, through both DSH and IME payments, is also a major funder of uncompensated care. Combined these Medicaid and Medicare payments comprised an estimated 40.3 percent of uncompensated care funding in 2013.
Given the importance of these Medicare and Medicaid payments in helping to defray providers’ uncompensated care costs, it will be critical to monitor how the ACA cutbacks in DSH payments affect hospitals, which we estimate provided about 60 percent of uncompensated care in 2013. Based on the premise that the ACA reforms will result in fewer individuals receiving uncompensated care, the law reduces Medicare and Medicaid DSH payments. While as of this writing DHHS has yet to release final rules on the reductions, by 2019 Medicaid DSH payments are to be cut about 50 percent over baseline projections and Medicare DSH payments 28 percent.67 DSH payment cuts will affect some individual hospitals more than others, since hospitals vary in the amount of uncompensated care they provide and the amount of DSH funding they receive.
Additional concerns have surfaced about how the cutbacks will affect hospitals, particularly considering that the 2012 Supreme Court decision making the Medicaid expansion optional under the ACA and several states deciding not to expand their Medicaid programs. Given this, the coverage gains from the ACA Medicaid will be less than initially projected, and hospitals will likely have a higher level of uncompensated care than had been projected in the post-reform world. General concerns about general ACA rollout (e.g., low public awareness and limited outreach and enrollment) have raised further concerns about the reduction in uncompensated care. All in all, this could potentially lead some hospitals to reduce the level of uncompensated care they provide or pursue aggressive billing against the uninsured.
More broadly, states and localities could similarly reduce their considerable funding of uncompensated care for the indigent, which we estimated to account for nearly a third of overall funding for uncompensated care. Relying on the same logic that the federal government used to reduce Medicare and Medicaid DSH payments, states and localities could argue that providers will need less uncompensated care funding because more of the uninsured will have coverage through Medicaid, health insurance marketplaces or other coverage. The benefits from the coverage expansion, however, will vary widely across states and even within areas within a state.
The nation is currently in a highly dynamic health care environment. We have recently implemented dramatic policy changes that will affect the overall level of public and private insurance coverage, as well as uncompensated care funding. How levels of uncompensated care and funding for that care will affect specific health care providers is unclear at this juncture. It will be essential for federal, state and local policymakers, providers, and consumer advocates to monitor how these many changes affect the provision of uncompensated care for uninsured individuals, of whom there still will be an estimated 29 million in 2017.68
Statistical Appendix
MEPS Design, Analysis Sample, and Definitions
The MEPS is a household survey that is nationally representative of the U.S. civilian non-institutionalized population.69 Consequently, it does not include individuals staying in nursing homes or long-term hospitals, those with long stays in acute-care hospitals, those in the military or people in correctional facilities. It has a rotating panel design, where each panel covers two complete calendar years with five rounds of data collection. Each panel is selected from a subsample of households participating in the National Health Interview Survey (NHIS).
The MEPS Household Component (HC) collects information on medical expenditures directly related to a respondent from a specific source. As a result, indirect payments not related to respondents’ specific medical events are not included in the MEPS. Examples of indirect payments include disproportionate share payments, grants, and tax appropriations. MEPS also does not collect expenditures on over-the-counter items or phone contacts with providers.
In addition to the HC, the Medical Provider Component (MPC) is a follow-up survey, which links select respondents’ information on medical use with medical providers. It collects information such as dates of visit, type of use, charges and expenditures for health care services by payer. It is used as a source from which to impute data in the HC, in order to improve self-reported data as well as estimate service expenditures for individuals covered by plans with capitation payments.
Medical expenditures in the MEPS are disaggregated by source of payment. Standard sources include private insurance companies, Medicare, Medicaid, and payments made by the respondent (out-of-pocket expenditures). Additional categories, referred to here as “other private, public and unclassified sources,” include the other private sources, Veterans Health Administration, Tricare, other federal sources, other state and local sources, workers compensation, other unclassified sources.
To obtain more precise uncompensated care estimates using the MEPS, the three most recent years of survey data available were pooled representing calendar years 2008, 2009, and 2010, which includes 102,767 respondent-year observations. This work is limited to respondents aged 0 to 64, with positive sample weights, resulting in a final subsample of 86,047 respondent-year observations.
MEPS/National Health Expenditure Accounts Reconciliation Adjustment
The MEPS captures less aggregate medical expenditures than the National Health Expenditure Accounts (NHEA) data, which is considered the standard for aggregate medical expenditure estimates for the entire U.S. This discrepancy between the MEPS and the NHEA persists even after accounting for differences in populations across sources, as well as differences in medical expenditure categories collected.70 For example, the MEPS is limited to the civilian non-institutionalized population, whereas the NHEA data covers all individuals—including those in nursing homes, correctional facilities, and the military that are excluded from the MEPS.71 Examples of expenditure categories in the NHEA that are not in the MEPS include non-durable medical products (i.e., “over-the-counter” items), nursing home care, public administration, and research. After accounting for these differences, previous work estimates that the MEPS collects between 13.8 percent (Sing et al., 2006) and 17.6 percent (Bernard et al., 2013) less expenditures than the NHEA data.
We apply a reconciliation adjustment to the pooled MEPS expenditure data in order to more closely reflect the NHEA aggregate expenditure totals. Using information reported in Sing et al. (2006), we calculate adjustment factors for payments by private insurance, Medicaid, Medicare, and all other sources (defense, Veterans’ Affairs, workers’ compensation, other public, and other sources) and apply them to the corresponding expenditure categories in the MEPS. These factors are reported in Table A1. Note that there is no adjustment for out-of-pocket expenditures. This is because the NHEA does not directly measure this category of expenditures—it is a residual—whereas the MEPS collects this information directly from respondents. That is, we assume the out-of-pocket expenditures collected in the MEPS are more accurate.
| Table A1: MEPS/NHEA Reconciliation Adjustment Factors | |
| Source of payment | Adjustment factor |
| Out-of-pocket | 1.000 |
| Private insurance | 1.262 |
| Medicaid | 1.462 |
| Medicare | 1.110 |
| All other sources | 0.977 |
| Source: Calculations from Sing et al. (2006), tables 2 and 5. | |
The decision to use adjustment factors from Sing et al. (2006), and not Sing et al. (2013), was a result of how the factors change between studies, notably “all other sources.” Using Sing et al. (2006) it is equal to 0.977 (see Table A1) compared with 1.294 using Sing et al. (2013). This large increase stems from a disproportionate decrease in workers compensation expenditures collected in the MEPS compared with the NHEA data between these two studies.72 Furthermore, the contribution of workers’ compensation to the uncompensated care estimate (calculation defined below) is relatively small, while the contribution of the collective group “all other sources” to the uncompensated care estimate is large. Consequently, the “all other sources” adjustment factor equal to 0.977 results in a more conservative estimate of uncompensated care. Finally, the remaining adjustment factors changed relatively little between studies.
Population Growth and Medical Expenditures per Person Adjustments
Two additional adjustments were imposed on the MEPS in order to project uncompensated care for the 2013 population. This is because the data used in this study represents the populations corresponding to calendar years 2008, 2009 and 2010, pooled together, which were the most recent MEPS data available at the time of the analysis. The first adjustment targets the 2013 population total, and the adjustment factors are reported in Table A2. The second adjustment attempts to account for changes in both the price and quantity of medical use per person between 2008 through 2010 and 2013. These factors also are reported in Table A2 and are calculated from the NHEA per capita personal health care expenditures, historical data and projections.73
| Table A2: Per Capita Medical Expenditure and Population Growth Adjustment Factors for 2013 Projections | ||
| Per capita medical expenditure adjustment factors | Population growth adjustment factors | |
| 2008 to 2013 | 1.167 | 1.041 |
| 2009 to 2013 | 1.121 | 1.033 |
| 2010 to 2013 | 1.090 | 1.025 |
| Source: Calculations from the National Health Expenditure Projections 2011-2021, Personal Health Care Expenditures per Capita, tables 1 and 5. | ||
While the adjustments described above account for population growth and increases in per capita medical expenditures, they do not account for changes in broader underlying economic relationships. In particular, the reference period for our data (2008-2010) in part covers the great recession (December 2007 to June 2009), and the initial recovery. Should there be significant differences in 2013 population compared with that of 2008-2010—e.g., unemployment, poverty/family income, rate of uninsured—they will not be accounted for in the 2013 uncompensated care projections reported here.
Estimating Uncompensated Care
Medical Expenditures Among Individuals with Part Year Coverage
In this work, medical expenditures during months respondents report that they were uninsured are distinguished from months while insured. We combine the monthly self-reported health insurance data in the MEPS-HC with monthly expenditure data (by service and payer) located in the MEPS events files to make this distinction. In a small number of cases, respondents’ reported they were uninsured in a given month, but have corresponding expenditures from private insurance, Medicaid, or Medicare. This may occur due to reporting error on insurance coverage. We reclassify such expenditures as those while insured.
Defining Implicitly Subsidized Care
“Implicitly subsidized care” is defined here as care received when a person is uninsured but not paid for by a directly identifiable source linked to the patient. Such payments include indirect payments to providers, from private or public sources, that partially offset the cost of medical care provided to the uninsured. Examples of implicitly subsidized care include public and private grant programs and Medicare and Medicaid disproportionate share (DSH) payments. As these payments are not tied to a particular individual, they are not measured in the MEPS.
Intuitively, the estimate of implicitly subsidized care using the MEPS equals the difference between total expected payments for medical services while the respondent is uninsured, as if they were insured, and any payments from private sources. To calculate the value of implicitly subsidized care, we multiply the aggregate payment to charge ratio for privately insured individuals with total charges for while uninsured, then subtract from that amount the actual payment received by private sources. More formally, implicitly subsidized care is defined for each MEPS respondent as follows:
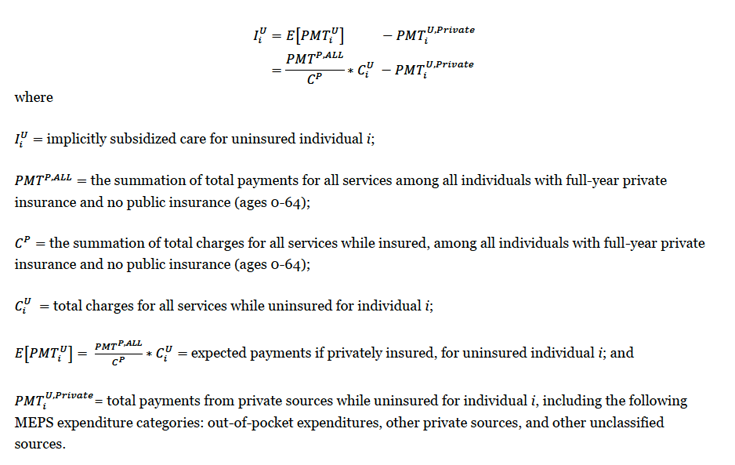
Defining Uncompensated Care
We define total “uncompensated care” as the costs associated with implicitly subsidized care (described above) plus expenditures from indirect sources made on behalf of the uninsured. These indirect sources, which we refer to as “other private, public, and unclassified sources,” include a wide range of payers such as the Veterans Administration, the Indian Health Service, local and state health departments, as well as automobile and homeowner’s insurance.74 Specifically, the MEPS expenditure categories included are VA, workers’ compensation, other federal, other state and local, other private, and other unclassified sources. These payments are included in the calculation of uncompensated care as they are indirect sources, which would most likely have been paid by a health insurance plan, private or public, had the individual been insured. The calculation of uncompensated care assumes that payments from other sources are paid at 100 percent, and any discrepancy between charges corresponding to these sources and expected private payments represent a contractual discount accepted by the provider.
The sources of payment included in “other private, public, and unclassified sources” excludes payments from private insurance, the respondent (i.e., out-of-pocket), Medicare, and Medicaid.75 Payments corresponding to the MEPS expenditure category “other public” are also excluded, which is sometimes linked to uninsured individuals.76 This “other public” category is actually Medicaid expenditures, for which in theory there should be none for our study sample of individuals who report being uninsured.77 That we find some Medicaid expenditures (defined by MEPS as “other public” expenditures) for periods in which an individual reported being uninsured may reflect a presumptive Medicaid eligibility decision on behalf of medical providers and/or reporting error made by respondents.78
Endnotes
- ASPE Research Brief, “The Value of Health Insurance: Few of the Uninsured Have Adequate Resources to Pay Potential Hospital Bills,” U.S. Department of Health and Human Services, 2011. ↩︎
- ASPE Research Brief, “The Value of Health Insurance: Few of the Uninsured Have Adequate Resources to Pay Potential Hospital Bills,” U.S. Department of Health and Human Services, 2011. ↩︎
- Congressional Budget Office, “Table 1: CBO’s May 2013 Estimate of the Effects of the Affordable Care Act on Health Insurance Coverage,” 2013. http://www.cbo.gov/publication/44176 ↩︎
- Congressional Budget Office, “Table 2: CBO’s May 2013 Estimate of the Budgetary Effects of the Insurance Coverage Provisions Contained in the Affordable Care Act,” 2013. http://www.cbo.gov/publication/44176 ↩︎
- Hadley J, Holahan J, Coughlin TA, Miller D. “Covering the Uninsured in 2008: Current Costs, Sources of Payment, and Incremental Costs,” Health Affairs 27 (5): w399-w415, 2008. http://content.healthaffairs.org/content/27/5/w399.full ↩︎
- For more details see “MEPS HC-138, 2010 Full Year Consolidated Data File” available at http://meps.ahrq.gov/mepsweb/data_stats/download_data/pufs/h138/h138doc.pdf. ↩︎
- The 2008, 2009, and 2010 MEPS files were the most current data available at the time this research was completed. ↩︎
- Sing M, Banthin JS, Selden TM, Cowan CA, Keehan SP. “Reconciling Medical Expenditure Estimates from the MEPS and NHEA, 2002,” Health Care Financing and Review 28 (1): 25-40, Fall 2006; Bernard D, Cowan C, Selden T, Cai L, Catlin A, Heffler S. “Reconciling Medical Expenditure Estimates from the MEPS and NHEA, 2007.” Medicare & Medicaid Research Review 2 (4): E1-E20. ↩︎
- Ibid. ↩︎
- See National Health Expenditure Projections 2011-2021. Baltimore, MD: Centers for Medicare and Medicaid Services, Office of the Actuary, National Health Statistics Group, http://www.cms.gov/Research-Statistics-Data-and-Systems/Statistics-Trends-and-Reports/NationalHealthExpendData/Downloads/Proj2011PDF.pdf. ↩︎
- More specifically, indirect sources of uncompensated care include the following MEPS expenditure categories: other private, the Veterans Administration, Tricare, other federal, other state and local, workers compensation, and other unclassified sources. Other federal includes expenditures on behalf of the Indian Health Service and military treatment facilities. Other state and local includes expenditures on behalf of community clinics, local and state health departments, and other state programs than Medicaid. Other unclassified sources may include automobile or homeowner’s insurance, or other unknown sources. Other private includes expenditures from private insurance companies among individuals that report no private coverage, which may arise due to non-comprehensive health insurance and/or reporting error. ↩︎
- Among the 15,919 respondents that did not report any health insurance during the year, 1,584 have positive “other public” expenditures. For more documentation on “other public” expenditures, see page C-101 of “MEPS HC-138, 2010 Full Year Consolidated Data File” available at http://meps.ahrq.gov/mepsweb/data_stats/download_data/pufs/h138/h138doc.pdf. ↩︎
- To accurately capture annual costs, Table 1 is limited to respondents with 12 months of health insurance data. Those with less than 12 months of health insurance data are mostly infants, but may also include those who die during the year and individuals in a particular household who moved out. ↩︎
- The estimates reported in Table 2 are larger than the corresponding per person amount multiplied by their respective population size reported in Table 1. This is because Table 1 is restricted to nonelderly respondents with 12 months of available health insurance coverage data, while Table 2 includes all nonelderly respondents both those with full insurance information and those with only partial information. In addition, aggregate spending estimates are calculated only for periods of time that people lack coverage. Months during which the part-year uninsured had insurance coverage are not counted. ↩︎
- As discussed in the methods section and statistical appendix, the MEPS medical expenditure category “other public” equals Medicaid payments among individuals that report zero months of Medicaid coverage. ↩︎
- GPO. “Congratulating American Dental Association on its 150th Anniversary.” May 2009. http://www.gpo.gov/fdsys/pkg/CREC-2009-05-12/html/CREC-2009-05-12-pt1-PgH5420.htm ↩︎
- Uncompensated Hospital Care Cost Fact Sheet. Washington, DC: American Hospital Association, January 2013. Patients who are insured may also contribute to a hospital’s bad debt, which would result in an over estimation of the value of uncompensated care for the uninsured. We believe, however, any overestimate that may result from this is offset by other sources of uncompensated care that we were unable to measure. ↩︎
- Ibid. ↩︎
- Ibid. ↩︎
- Despite that much of the care provided by the Veterans Health Administration and the Indian Health Service is through hospitals, we include their spending on uncompensated care in the community-based providers’ category because the AHA excludes federal hospitals such as the VA from its estimate of hospitals’ uncompensated care. ↩︎
- Table 19: National Health Expenditures by type of Expenditure and Program, Calendar Year 2011. Washington, DC: Centers for Medicare and Medicaid Services, Office of the Actuary, National Health Statistics Group. ↩︎
- Boukus ER, Cassil A, O’Malley AS. “A Snapshot of U.S. Physicians: Key Findings from the 2008 Health Tracking Physician Survey.” Data Bulletin No. 35. Washington, DC: Center for Studying Health System Change, September 2009. http://www.hschange.com/CONTENT/1078/. ↩︎
- Berenson R, Zuckerman S, Stockley K, Nath R, Gans D, Hammons T. What If All Physician Services Were Paid Under the Medicare Fee Schedule? An Analysis Using Medical Group Management Association Data. Washington, DC: Urban Institute, March 2010. http://www.urban.org/UploadedPDF/412051_physcian_service.pdf. ↩︎
- Inflation based on projected physician expenses from the NHE. This does not exclude the amount of uncompensated care provided by salaried physicians employed by hospitals and clinics. ↩︎
- Report I: Summary Data from the Physician Practice Information Survey: All Specialties Combined. Chicago, IL: American Medical Association, March 2009, http://www.ama-assn.org/resources/doc/rbrvs/ppi-survey-data-summary.pdf. ↩︎
- Some states also provide Medicaid graduate medical education payments, which are not accounted for in our analysis. ↩︎
- Medicaid Program; Disproportionate Share Hospital Allotments and Institutions for Mental Diseases Disproportionate Share Hospital Limits for FY 2012, and Preliminary FY 2013 Disproportionate Share Hospital Allotments and Limits. Federal RegisterNotices 78(144 ) Friday, July 26, 2013 http://www.gpo.gov/fdsys/pkg/FR-2013-07-26/pdf/2013-17965.pdf ↩︎
- An Overview of Changes in the Federal Medical Assistance Percentages (FMAPs) for Medicaid. Kaiser Commission for Medicaid and the Uninsured, July 2013, https://modern.kff.org/wp-content/uploads/2013/01/8210.pdf ↩︎
- Data from unpublished 2011 Urban Institute survey. ↩︎
- Ibid. ↩︎
- CMS-64 Quarterly Expense Report. “Financial Management Report for FY 2011.” http://medicaid.gov/Medicaid-CHIP-Program-Information/By-Topics/Data-and-Systems/MBES/CMS-64-Quarterly-Expense-Report.html. ↩︎
- An Overview of Changes in the Federal Medical Assistance Percentages (FMAPs) for Medicaid. ↩︎
- American Hospital Association. Underpayment by Medicare and Medicaid: fact sheet, 2014. Chicago (IL). Available from: http://www.aha.org/content/14/2012-medicare-med-underpay.pdf. ↩︎
- To be conservative we did not inflate Medicaid underpayments to 2013 because of the uncertainty around Medicaid reimbursement levels and hospital costs. ↩︎
- Medicare Payment Advisory Commission, Report to the Congress: Medicare Payment Policy, March 2007, p. 77. ↩︎
- Report to the Congress: Medicare Payment Policy. Washington, DC: Medicare Payment Advisory Commission, March 2007, p.77. ↩︎
- March 2012 Medicare Baseline. Washington, DC: Congressional Budget Office, Match 13, 2012, http://www.cbo.gov/sites/default/files/cbofiles/attachments/43060_Medicare.pdf. ↩︎
- Ibid. ↩︎
- Centers for Medicare and Medicaid Services. Table 19: National Health Expenditures by type of Expenditure and Program, Calendar Year 2011. ↩︎
- Center for Medicare and Medicaid Services. “The Nation’s Health Dollar ($2.7 Trillion), Calendar Year 2011: Where It Went.” http://www.cms.gov/Research-Statistics-Data-and-Systems/Statistics-Trends-and-Reports/NationalHealthExpendData/Downloads/PieChartSourcesExpenditures2011.pdf ↩︎
- Expenditures: Veteran Data and Information 2012. Washington, DC: US Dept. of Veterans Affairs, National Center for Veterans Analysis and Statistics, http://www.va.gov/vetdata/Expenditures.asp. ↩︎
- FY 2013 President’s Budget for the Department of Veterans Affairs Medical Programs. Washington, DC: White House, http://www.whitehouse.gov/sites/default/files/omb/budget/fy2013/assets/vet.pdf. ↩︎
- Estimate from Shen Y, Lee A, Hendricks A, Kazis L. “Veterans’ Health Insurance and Demand for VA Care.” http://gateway.nlm.nih.gov/MeetingAbstracts/102272533.html ↩︎
- Inflation factor derived from 2013 spending estimate in the Department of Veterans Affairs FY 213 Budget Estimate. ↩︎
- Indian Health Service Fact Sheet. Rockville MD: US Department of Health and Human Services, Indian Health Service, 2013, http://www.ihs.gov/factsheets/index.cfm?module=dsp_fact_quicklook ↩︎
- 2012 March Supplement to the Current Population Survey. ↩︎
- This amount also includes a proportionate share of support costs. Indian Health Service Budget Request FY 2014. Rockville MD: US Department of Health and Human Services, Indian Health Service, March 12, 2013. http://www.ihs.gov/BudgetFormulation/documents/FY2014BudgetJustification.pdf ↩︎
- Indian Health Service Budget Request FY 2014. ↩︎
- National Rollup Report. FY 2011. Rockville MD: US Department of Health and Human Services, Bureau of Primary Health Care, HRSA Community Health Center Uniform Data System, http://bphc.hrsa.gov/uds/doc/2011/National_Universal.pdf ↩︎
- Ibid. ↩︎
- Ibid. ↩︎
- Ibid. pg. 63 ↩︎
- Ahead of the Curve: The Ryan White HIV/AIDS Program Progress Report 2012. Rockville, MD: US Department of Health and Human Services, November 2012, http://hab.hrsa.gov/data/reports/progressreport2012.pdf ↩︎
- Used to be called titles. Systems switched in 2007. This also prevents double counting of funds because Part C and Part D are directed to other various community health programs, including CHCs and the MCHB program. ↩︎
- Part A Allocations Report for Total Part A Grantees (http://hab.hrsa.gov/data/reports/files/fy12partaallocations.pdf) and FY 2012 Allocation Report for All Grantees (http://hab.hrsa.gov/data/reports/files/fy12partballocations.pdf). Rockville, MD: US Department of Health and Human Services, Health Resources and Services Administration. ↩︎
- Insurance Status of AIDS Drug Assistance Program (ADAP) Clients, 2011. Kaiser State Health Facts Online, www.statehealthfacts.org. ↩︎
- Johnson AJ. The Ryan White HIV/AIDS Program. Washington, DC: Congressional Research Service, 2011, http://www.fas.org/sgp/crs/misc/RL33279.pdf ↩︎
- Ryan White Program by Part, Funding & Grantees, FY 2012. Kaiser State Health Facts Online, https://modern.kff.org/hivaids/fact-sheet/the-ryan-white-program/ ↩︎
- Distribution of AIDS Drug Assistance Program (ADAP) Budget by Source, FY 2011. Kaiser State Health Facts Online, https://modern.kff.org/hivaids/state-indicator/adap-budget-by-source/ ↩︎
- Federal-State Title V Block Grant Partnership Budget, by Category of Service FY 2013. Rockville, MD: US Department of Health and Human Services, Maternal and Child Health Bureau, HRSA Title V Information System (TVIS), FY 2013, https://mchdata.hrsa.gov/tvisreports/FinancialData/; Number of Individuals Served by Title V, by Class of Individuals. Rockville, MD: US Department of Health and Human Services, Maternal and Child Health Bureau, HRSA, Title V Information System (TVIS), FY 2011, https://mchdata.hrsa.gov/tvisreports/ProgramData/ ↩︎
- Percentage of Individuals Served by Title V, by Source of Coverage. Rockville, MD: US Department of Health and Human Services, Maternal and Child Health Bureau, HRSA, Title V Information System (TVIS), FY 2011, https://mchdata.hrsa.gov/tvisreports/ProgramData/ ↩︎
- Federal-State Title V Block Grant Partnership Budget, FY 2013. Rockville, MD: US Department of Health and Human Services, Maternal and Child Health Bureau, HRSA Title V Information System (TVIS), FY 2013, https://mchdata.hrsa.gov/tvisreports/FinancialData/ ↩︎
- Medpac. Chart 6-22. Change in Medicare hospital inpatient costs per discharge and private payer payment-to-cost ratio, 1987-2010.” p. 82. Medpac: Health Care Spending and the Medicare Program. June 2012. ↩︎
- Underpayment by Medicare and Medicaid Fact Sheet. Washington, DC: American Hospital Association, December 2010. ↩︎
- Report to the Congress: Medicare Payment Policy. Washington, DC: Medicare Payment Advisory Commission, March 2001, p.182-186; A Data Book: Health Care Spending and the Medicare Program. Washington, DC: Medicare Payment Advisory Commission, June 2013, p.80-82. ↩︎
- Report to the Congress, Washington, DC: Medicare Payment Advisory Commission, March 2009, p.57-66. ↩︎
- See Memorandum from Richard S. Foster, Chief Actuary, Centers for Medicare & Medicaid Services, April 22, 2010, available at http://graphics8.nytimes.com/packages/pdf/health/oactmemo1.pdf. See Letter from Douglas W. Elmendorf, Director of the Congressional Budget Office, to Nancy Pelosi, Speaker, U.S. House of Representatives, Table 5, March 20, 2010. ↩︎
- Congressional Budget Office. “CBO’s February 2013 Estimate of the Effects of the Affordable Care Act on Health Insurance Coverage.” February 2013. http://www.cbo.gov/sites/default/files/cbofiles/attachments/43900_ACAInsuranceCoverageEffects.pdf ↩︎
- For details see “MEPS HC-138, 2010 Full Year Consolidated Data File” available at http://meps.ahrq.gov/mepsweb/data_stats/download_data/pufs/h138/h138doc.pdf. ↩︎
- M. Sing et al., “Reconciling Medical Expenditure Estimates from the MEPS and NHEA, 2002,” Health Care Financing and Review 28 (1): pp. 25-40, Fall 2006.; D. Bernard et al., “Reconciling Medical Expenditure Estimates from the MEPS and NHEA, 2007.” Medicare & Medicaid Research Review 2 (4): pp. E1-E20. ↩︎
- For documentation on the NHEA data, see “National Health Expenditures Accounts: Methodology Paper, 2011. Definitions, Sources, and Methods.” available at http://www.cms.gov/Research-Statistics-Data-and-Systems/Statistics-Trends-and-Reports/NationalHealthExpendData/Downloads/dsm-11.pdf. ↩︎
- This is apparent from the source of payment totals for workers’ compensation in Sing et al. (2006, table 2 and table 5) and Bernard et al. (2013, exhibit 2 and exhibit 5). ↩︎
- See “National Health Expenditure Projections 2011-2021” available at http://www.cms.gov/Research-Statistics-Data-and-Systems/Statistics-Trends-and-Reports/NationalHealthExpendData/Downloads/Proj2011PDF.pdf. ↩︎
- More specifically, indirect sources of uncompensated care include the following MEPS expenditure categories: other private, the Veterans Administration, Tricare, other federal, other state and local, workers compensation, and other unclassified sources. Other federal includes expenditures on behalf of the Indian Health Service and military treatment facilities. Other state and local includes expenditures on behalf of community clinics, local and state health departments, and other state programs than Medicaid. Other unclassified sources may include automobile or homeowner’s insurance, or other unknown sources. Other private includes expenditures from private insurance companies among individuals that report no private coverage, which may arise due to non-comprehensive health insurance and/or reporting error. ↩︎
- See page C-101 of “MEPS HC-138, 2010 Full Year Consolidated Data File” available at http://meps.ahrq.gov/mepsweb/data_stats/download_data/pufs/h138/h138doc.pdf. ↩︎
- Among the 15,919 respondents that did not report any health insurance during the year, 1,584 have positive “other public” expenditures. For more documentation on “other public” expenditures, see page C-101 of “MEPS HC-138, 2010 Full Year Consolidated Data File” available at http://meps.ahrq.gov/mepsweb/data_stats/download_data/pufs/h138/h138doc.pdf. ↩︎
- This is a slight deviation from previous work (Hadley et al, 2008), which included the “other public” category. Excluding “other public” in this part of the calculation results in a more conservative estimate of uncompensated care. ↩︎
- See page C-101 of “MEPS HC-138, 2010 Full Year Consolidated Data File” available at http://meps.ahrq.gov/mepsweb/data_stats/download_data/pufs/h138/h138doc.pdf. ↩︎