
Two Year Trends in Medicaid and CHIP Enrollment Data: Findings from the CMS Performance Indicator Project
Executive Summary
This brief provides an overview of recent trends in Medicaid and CHIP enrollment as of January 2016, based on data from the Centers for Medicare and Medicaid Services (CMS) produced as part of its Performance Indicator Project.1 The project was designed to provide timely data on Medicaid and CHIP eligibility and enrollment that are intended to help strengthen data-driven program management and oversight efforts at both the national and state level (an overview of the data can be found in Appendix A). They also provide insight into Medicaid and CHIP eligibility and enrollment experiences as the ACA is implemented. This brief examines data as of January 2016 to be able to look at two full years of data post implementation of the major coverage provisions in the Affordable Care Act (ACA). All available months of data are available here: Total enrollment, Child enrollment.) The data show:
As of January 2016, 72.9 million people were enrolled in Medicaid and CHIP. Over two-thirds of enrollees resided in states that have implemented the ACA Medicaid expansion.
Between Summer 2013 and January 2016, there was a net increase of nearly 15.5 million or 27% enrolled in Medicaid and CHIP among the 49 states reporting data for both periods. Most of this growth occurred in year one. Most of this growth was in large states in the West that implemented the Medicaid expansion.
Expansion states experienced significantly greater enrollment growth over the two year period, although there was variation across states. States that implemented the Medicaid expansion experienced over three times greater enrollment growth compared to states where the Medicaid expansion is not in effect (36% vs. 12%). Over the period, growth ranged from a high of 95% in Kentucky to slight decline in Wyoming and Nebraska.
Children account for a greater share of total Medicaid and CHIP enrollment in nearly all states that have not expanded Medicaid compared to states that have expanded. Reflecting higher eligibility levels for children, children accounted for a greater share of total Medicaid and CHIP enrollees in non-expansion states compared to states that have implemented the expansion to adults (68% vs. 44%).
Key Findings
As of the end of January 2016, 72.9 million people were enrolled in Medicaid or CHIP coverage nationwide. Over two-thirds (50.1 million of the 72.9 million) of all Medicaid and CHIP enrollees resided in states that have implemented the Medicaid expansion (Figure 1). A combination of expansion and non-expansion states have the highest Medicaid enrollment. California, New York and Texas account for just about one-third of all Medicaid enrollment. Together with Florida, Illinois, Ohio, Pennsylvania, and Michigan these eight states account for just over half of all Medicaid enrollment. (See Appendix Table B for state tables on enrollment.)
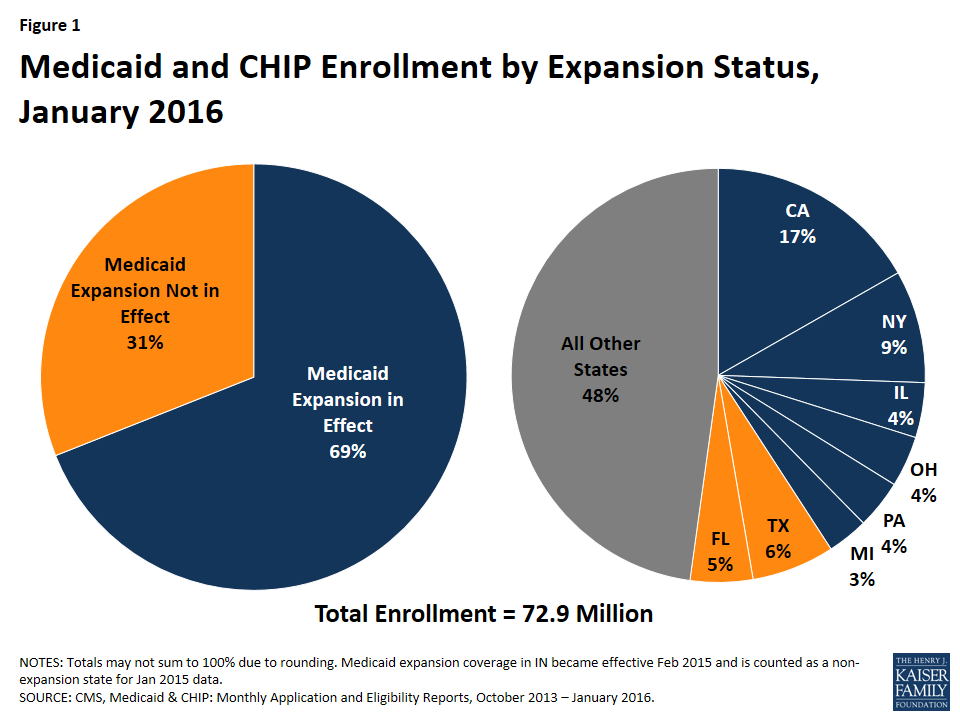
Figure 1: Medicaid and CHIP Enrollment by Expansion Status, January 2016
Between Summer 2013 and January 2016, there was a net increase of nearly 15.5 million people enrolled in Medicaid and CHIP among the 49 states reporting data for both periods. Most of this growth was in large states that implemented the Medicaid expansion (Figure 2). Overall, 82% of the net enrollment growth occurred in expansion states, and 48% was in the West, reflecting sizeable enrollment gains in large western states like California and recent expansion decisions in Montana and Alaska. Half (50%) of the 15.5 million net increase is attributable to growth in six expansion states (CA, NY, WA, KY, OH, and CO), with California accounting for 29% of the overall net growth. Changes in total enrollment over this period reflect varied factors including both net gains in enrollment and changes in the number of states reporting data.1

Figure 2: Total Net Medicaid and CHIP Enrollment Growth by Medicaid Expansion Status and Region, Summer 2013 to January 2016
States that expanded Medicaid have experienced significantly greater net Medicaid and CHIP enrollment growth since prior to the beginning of open enrollment than states that have not expanded. Nationally, total Medicaid and CHIP enrollment grew by 27% between Summer 2013 and January 2016. Growth was over three times higher (37%) in states that implemented the expansion compared to states where the Medicaid expansion is not in effect (12%) (Figure 3). However, there is significant variation in total growth across individual states from a high of 95% growth in Kentucky to slightly negative growth in Wyoming and Nebraska. (Figure 4)
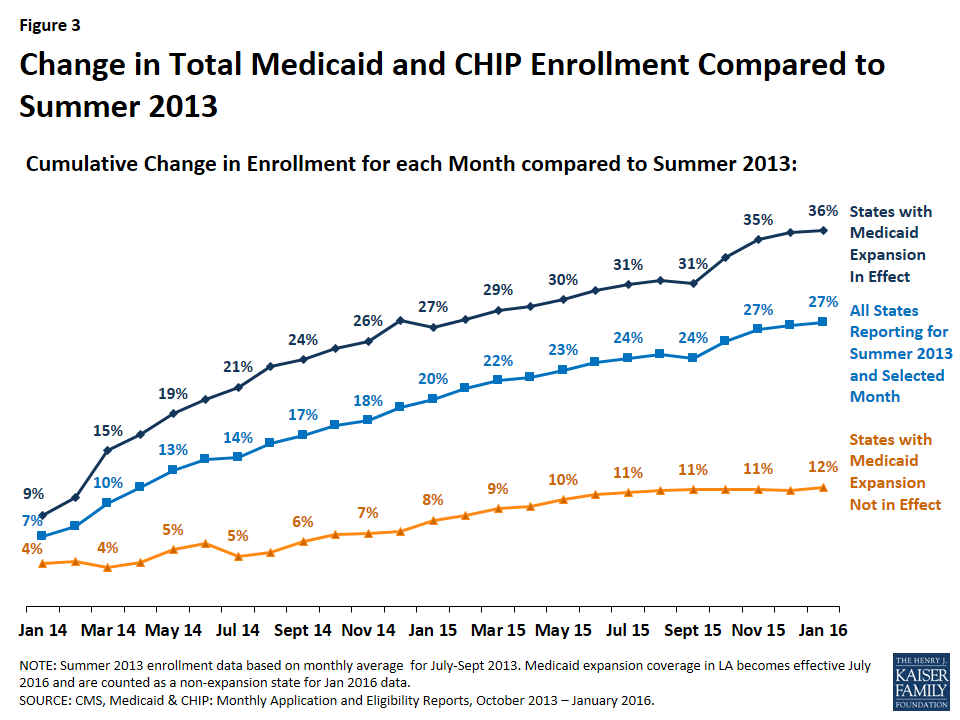
Figure 3: Change in Total Medicaid and CHIP Enrollment Compared to Summer 2013
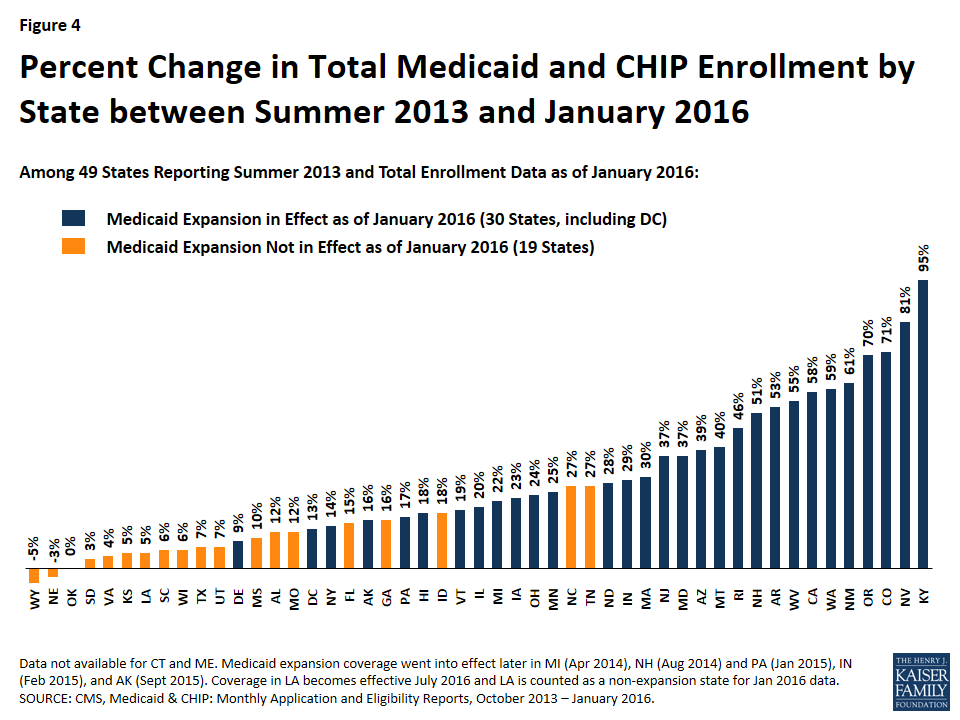
Figure 4: Percent Change in Total Medicaid and CHIP Enrollment by State between Summer 2013 and January 2016
Most growth occurred in the first year, with growth rates tapering off from January 2015-January 2016. Across all states, enrollment had increased by 20% compared in January 2015, to the Summer baseline data. Growth rates tapered in the following year to 7% with cumulative growth of 27% over the period. Across all states that implemented the expansion in January 2014, growth rates have slowed in the second year of implementation. (Figure 5)
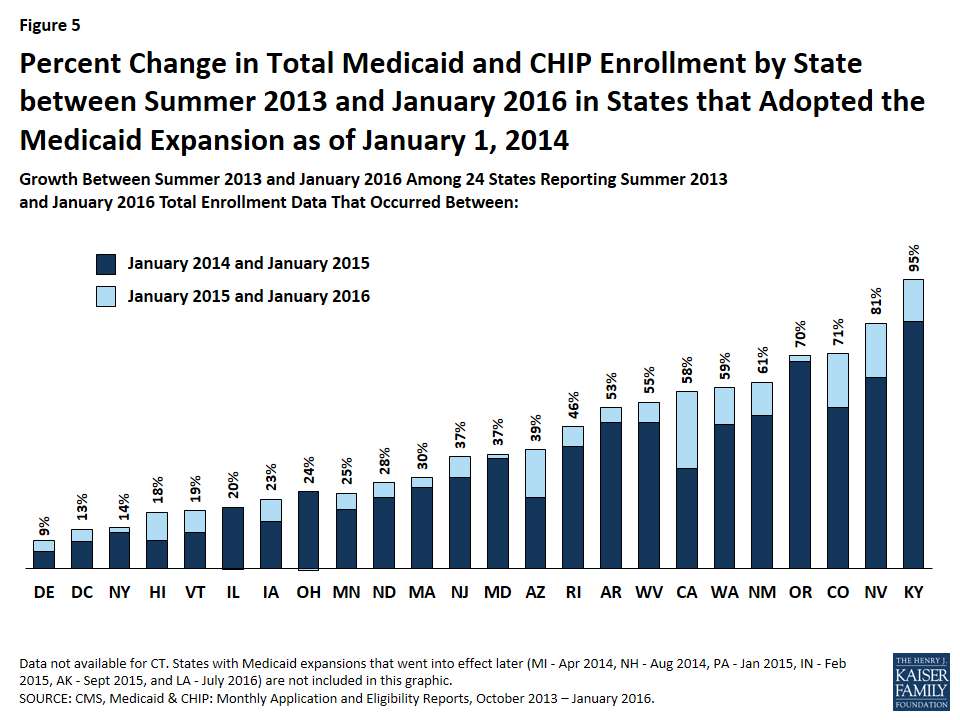
Figure 5: Percent Change in Total Medicaid and CHIP Enrollment by State between Summer 2013 and January 2016 in States that Adopted the Medicaid Expansion as of January 1, 2014
Children account for a greater share of total Medicaid and CHIP enrollment in nearly all states that have not expanded Medicaid. Among the 46 states reporting data for child and total enrollment as of January 2016, children made up just over half (53%) of total Medicaid and CHIP enrollment. They accounted for over two-thirds of total enrollment (68%) in states that have not expanded Medicaid compared to well under half (44%) among the states that have expanded and enrolled many new adults (Figure 6). The pattern is reflective of the fact that children’s eligibility levels are higher than those for adults in states that have not expanded.
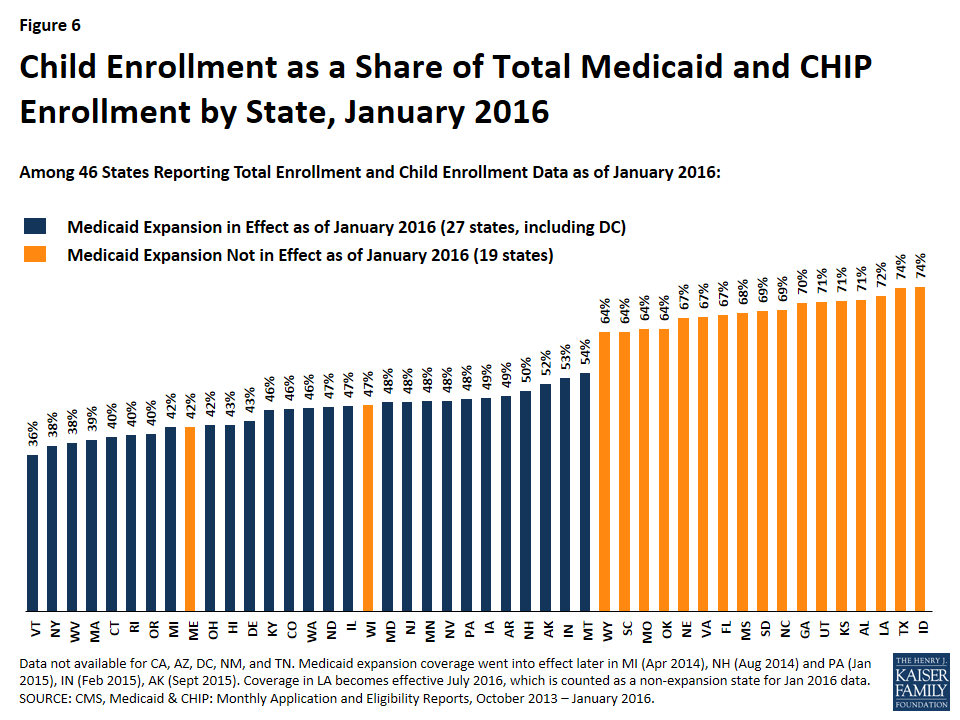
Figure 6: Child Enrollment as a Share of Total Medicaid and CHIP Enrollment by State, January 2016
Between January 2014 (the earliest children data reported) and January 2016, child enrollment increased by 1.9 million or 8% across the 36 states reporting data for both periods. Growth was 8% cumulative between January 2014 and January 2016 with a 6% increase in the first year and a 2% increase in the second year. Percent change over the two year period ranged from an increase of 23% in North Carolina to a decrease of 9% in Wyoming.
Conclusion
Data show that there has been significant net growth in Medicaid and CHIP enrollment since the major ACA coverage expansion went into effect, and states that have expanded Medicaid have experienced significantly greater growth compared to non-expansion states. Growth rates appear to be tapering off in year two following the implementation of the ACA.
Reflecting higher eligibility levels for children, children make up a greater share of total Medicaid and CHIP enrollees in non-expansion states compared to states that have expanded to adults. As a broader set of performance data is reported over time, the data will provide greater understanding of state Medicaid and CHIP eligibility and enrollment experiences, although they will not provide information on the number of newly eligible adults enrolled through the ACA Medicaid expansion. The performance data will complement other data initiatives at the federal level as well as additional reporting at the state level to provide more comprehensive and timely information on Medicaid and CHIP eligibility and enrollment that can support data-driven quality-improvement efforts and overall program management and oversight efforts at both the national and state level.
Appendices
Appendix A: Data Overview
At the end of 2013, CMS implemented a new eligibility and enrollment Performance Indicator Project for state Medicaid and CHIP programs, establishing 12 Medicaid and CHIP eligibility and enrollment performance indicators for states to report (listed at the end of the data overview. To date, CMS has reported a limited set of the indicators, including total Medicaid and CHIP enrollment, and enrollment of children in Medicaid and CHIP. Average monthly data for Summer 2013 are provided as a comparison point prior to the ACA major coverage expansions. Child enrollment data are only reported for January 2014 forward. Key definitions of the data are included below:
Pre-ACA Average Monthly Medicaid/CHIP Enrollment: The average number of individuals enrolled in Medicaid and CHIP for each month during the July-September, 2013 period using an average of enrollment numbers submitted by the states for each month in this period. Not all states submitted three months of data; the average is calculated using any months of baseline data that were provided. The unit of measurement is individuals enrolled as of the last day of the reporting period (month).
Post-ACA Medicaid/CHIP Monthly Enrollment: The total unduplicated number of individuals enrolled in Medicaid and CHIP as of the last day of each reporting period, including those with retroactive, conditional, and presumptive eligibility. This indicator is a point-in-time count of total program enrollment, and is not solely a count of those newly enrolled during the reporting period. This number includes only those individuals who are eligible for comprehensive benefits (e.g., emergency Medicaid, family planning-only coverage and limited benefit dual eligible individuals are excluded). Medicaid Section 1115 demonstration populations are included as long as the benefits and networks are comprehensive. CHIP children subject to a waiting period or premium lock-out period are considered eligible but not enrolled and are not included. Data are subject to change based on subsequent CMS enrollment reports. Other reporting on Medicaid and CHIP enrollment by states and researchers may include some beneficiaries excluded in these data (because comprehensive coverage is not provided), or may use a different methodology.
California changed its methodology by removing some limited benefit groups from enrollment beginning in September 2015, which lowered both the pre-ACA monthly enrollment as well as California’s monthly enrollment. However, California data reported for August 2015 and earlier months (as well as the related pre-ACA monthly enrollment) was not updated to reflect this change in methodology.
In this brief, data through January 2016 are used to show change for the two year period since the implementation of the coverage provisions in the ACA. The trends in Medicaid and CHIP enrollment since Summery 2013 reflect a combination of factors including state Medicaid expansion decisions, the Marketplace enrollment periods, and broader factors such as the economic environment. As of June 2016, 32 states, including DC, have adopted the Medicaid expansion for low-income adults. In most of these states, coverage under the expansion went into effect January 1, 2014, although coverage went into effect at later dates in six states – Michigan (April 1, 2014), New Hampshire (August 15, 2014,) Pennsylvania (January 1, 2015), Indiana (February 1, 2015), Alaska (September 1, 2015), and Montana (January 1, 2016). Louisiana has adopted the Medicaid expansion but implementation will begin in July 2016; as a result, the data in this brief do not reflect the Medicaid expansion in Louisiana. Eligibility for parents remains very limited in most states that have not expanded and adults without dependent children are not eligible for coverage in all but one non-expansion state.
While CMS may expand the scope of eligibility and enrollment indicators reported over time, the data will not provide information on the number of newly eligible adults enrolled through the ACA Medicaid expansion. States are reporting enrollment data, including counts of newly eligible adults, as part of the revised CMS federal match claiming forms (MBES data CMS-64 forms). A number of states have not been able to report enrollment data including California through the MBES data.1
Medicaid and CHIP Eligibility and Performance Indicators
–
Applications, Transfers, and Renewals
1. Total Number of Medicaid and CHIP Applications Received in Previous Week
2. Total Number of Medicaid and CHIP Applications Received in Previous Month
3. Total Number of Medicaid and CHIP Applications Received through Transfers from Marketplace
4. Total Number of Accounts up for Renewal
Determinations
5. Total Number of Individuals Determined Eligible for Medicaid or CHIP
6. Total Number of Individuals Determined Ineligible for Medicaid or CHIP
Efficiency of Application Processing
7. Processing Time for Eligibility Determinations
8 .Total Number of Applications and Redeterminations Pending a Determination
Enrollment
9. Total Enrollment
Call Center Operations
10. Total Call Center Volume
11. Average Caller Wait Time
12. Rate of Abandoned Calls
Appendix B: CMS Enrollment Data By State
| Appendix Table 1: Total Medicaid and CHIP Monthly Enrollment, Summer 2013 and January 2016 | ||||||||||
| State | Implementing Medicaid Expansion? | Monthly Average July – Sept. 2013 |
January 2016 | Percent Change, Summer 2013 and January 2016 |
||||||
| United States | — | 56,392,477 | 72,894,836 | 27% | ||||||
| Alabama | N | 799,176 | 896,668 | 12% | ||||||
| Alaska | Y – September 2015 | 122,334 | 142,301 | 16% | ||||||
| Arizona | Y | 1,201,770 | 1,670,422 | 39% | ||||||
| Arkansas | Y | 556,851 | 850,426 | 53% | ||||||
| California | Y | 7,755,381 | 12,259,866 | 58% | ||||||
| Colorado | Y | 783,420 | 1,336,161 | 71% | ||||||
| Connecticut | Y | NR | 756,725 | NR | ||||||
| Delaware | Y | 223,324 | 243,750 | 9% | ||||||
| District of Columbia | Y | 235,786 | 265,548 | 13% | ||||||
| Florida | N | 3,104,996 | 3,576,943 | 15% | ||||||
| Georgia | N | 1,535,090 | 1,786,428 | 16% | ||||||
| Hawaii | Y | 288,357 | 341,274 | 18% | ||||||
| Idaho | N | 238,150 | 282,207 | 18% | ||||||
| Illinois | Y | 2,626,943 | 3,143,856 | 20% | ||||||
| Indiana | Y – February 2016 | 1,120,674 | 1,450,637 | 29% | ||||||
| Iowa | Y | 493,515 | 605,467 | 23% | ||||||
| Kansas | N | 378,160 | 398,272 | 5% | ||||||
| Kentucky | Y | 606,805 | 1,182,852 | 95% | ||||||
| Louisiana | Y – July 2016 | 1,019,787 | 1,074,896 | 5% | ||||||
| Maine | N | NR | 279,528 | NR | ||||||
| Maryland | Y | 856,297 | 1,177,043 | 37% | ||||||
| Massachusetts | Y | 1,296,359 | 1,682,675 | 30% | ||||||
| Michigan | Y – April 2014 | 1,912,009 | 2,339,419 | 22% | ||||||
| Minnesota | Y | 873,040 | 1,087,569 | 25% | ||||||
| Mississippi | N | 637,229 | 700,536 | 10% | ||||||
| Missouri | N | 846,084 | 951,734 | 12% | ||||||
| Montana | Y – January 2016 | 148,974 | 208,754 | 40% | ||||||
| Nebraska | N | 244,600 | 238,099 | -3% | ||||||
| Nevada | Y | 332,560 | 600,854 | 81% | ||||||
| New Hampshire | Y – July 2014 | 127,082 | 191,812 | 51% | ||||||
| New Jersey | Y | 1,283,851 | 1,755,259 | 37% | ||||||
| New Mexico | Y | 457,678 | 737,850 | 61% | ||||||
| New York | Y | 5,678,417 | 6,446,670 | 14% | ||||||
| North Carolina | N | 1,595,952 | 2,019,528 | 27% | ||||||
| North Dakota | Y | 69,980 | 89,639 | 28% | ||||||
| Ohio | Y | 2,341,481 | 2,911,402 | 24% | ||||||
| Oklahoma | N | 790,051 | 789,536 | 0% | ||||||
| Oregon | Y | 626,356 | 1,064,700 | 70% | ||||||
| Pennsylvania | Y – January 2016 | 2,386,046 | 2,785,001 | 17% | ||||||
| Rhode Island | Y | 190,833 | 279,520 | 46% | ||||||
| South Carolina | N | 889,744 | 939,344 | 6% | ||||||
| South Dakota | N | 115,501 | 118,568 | 3% | ||||||
| Tennessee | N | 1,244,516 | 1,580,851 | 27% | ||||||
| Texas | N | 4,441,605 | 4,733,134 | 7% | ||||||
| Utah | N | 294,029 | 313,733 | 7% | ||||||
| Vermont | Y | 161,081 | 191,441 | 19% | ||||||
| Virginia | N | 935,434 | 976,271 | 4% | ||||||
| Washington | Y | 1,117,576 | 1,781,588 | 59% | ||||||
| West Virginia | Y | 354,544 | 548,197 | 55% | ||||||
| Wisconsin | N | 985,531 | 1,045,752 | 6% | ||||||
| Wyoming | N | 67,518 | 64,130 | -5% | ||||||
| # States Reporting: | — | 49 | 51 | 49 | ||||||
| NOTES: NR- Data not reported. All states that have adopted the Medicaid expansion did so in Jan 2014 unless otherwise noted in the table. SOURCE: CMS, Medicaid & CHIP: Monthly Application and Eligibility Reports, Oct 2013 – Jan 2016 |
||||||||||
| Appendix Table 2: Total Medicaid and CHIP Child Enrollment, January and January 2016 | |||||||||
| State | Implementing Medicaid Expansion? | January 2014 | January 2016 |
Percent Change,
Jan 2014 – Jan 2016
|
Child Enrollment as Share of Total Enrollment, Jan 2016 | ||||
| United States | — | 23,002,580 | 29,073,489 | 5% | 54% | ||||
| Alabama | N | 572,891 | 640,576 | 12% | 73% | ||||
| Alaska | Y – September 2015 | 72,990 | 70,241 | -4% | 58% | ||||
| Arizona | Y | NR | NR | NR | NR | ||||
| Arkansas | Y | NR | 432,691 | NR | 52% | ||||
| California | Y | NR | NR | NR | NR | ||||
| Colorado | Y | 521,062 | 577,887 | 11% | 48% | ||||
| Connecticut | Y | NR | 300,570 | NR | 41% | ||||
| Delaware | Y | 100,714 | 104,358 | 4% | 44% | ||||
| District of Columbia | Y | NR | NR | NR | NR | ||||
| Florida | N | 2,076,132 | 2,292,762 | 10% | 67% | ||||
| Georgia | N | NR | 1,211,139 | NR | 70% | ||||
| Hawaii | Y | 143,899 | 136,205 | -5% | 43% | ||||
| Idaho | N | 181,082 | 200,356 | 11% | 69% | ||||
| Illinois | Y | NR | 1,488,571 | NR | 48% | ||||
| Indiana | Y – February 2016 | 696,562 | 712,412 | 2% | 59% | ||||
| Iowa | Y | NR | 228,745 | NR | 45% | ||||
| Kansas | N | NR | 289,107 | NR | 71% | ||||
| Kentucky | Y | 527,034 | 475,918 | -10% | 43% | ||||
| Louisiana | Y – July 2016 | 724,246 | 758,881 | 5% | 72% | ||||
| Maine | N | 128,110 | 118,871 | -7% | 42% | ||||
| Maryland | Y | 567,867 | 585,518 | 3% | 51% | ||||
| Massachusetts | Y | 583,723 | 633,077 | 8% | 39% | ||||
| Michigan | Y – April 2014 | 1,024,050 | 967,146 | -6% | 43% | ||||
| Minnesota | Y | 427,164 | 485,015 | 14% | 47% | ||||
| Mississippi | N | 428,745 | 487,818 | 14% | 69% | ||||
| Missouri | N | 509,173 | 545,594 | 7% | 63% | ||||
| Montana | Y – January 2016 | 108,019 | 102,923 | -5% | 62% | ||||
| Nebraska | N | 158,177 | 157,129 | -1% | 67% | ||||
| Nevada | Y | NR | 265,496 | NR | 49% | ||||
| New Hampshire | Y – July 2014 | 87,055 | 92,289 | 6% | 54% | ||||
| New Jersey | Y | 744,535 | 816,839 | 10% | 49% | ||||
| New Mexico | Y | NR | NR | NR | NR | ||||
| New York | Y | 2,320,379 | 2,366,899 | 2% | 38% | ||||
| North Carolina | N | 1,126,665 | 1,256,336 | 12% | 68% | ||||
| North Dakota | Y | NR | 39,900 | NR | 46% | ||||
| Ohio | Y | 1,162,668 | 1,282,648 | 10% | 44% | ||||
| Oklahoma | N | 507,824 | 521,195 | 3% | 64% | ||||
| Oregon | Y | 399,782 | 427,667 | 7% | 41% | ||||
| Pennsylvania | Y – January 2016 | 1,264,811 | 1,282,627 | 1% | 51% | ||||
| Rhode Island | Y | NR | 110,321 | NR | 41% | ||||
| South Carolina | N | 578,153 | 653,584 | 13% | 66% | ||||
| South Dakota | N | 78,165 | 80,097 | 2% | 68% | ||||
| Tennessee | N | NR | NR | NR | NR | ||||
| Texas | N | 3,245,861 | 3,429,655 | 6% | 74% | ||||
| Utah | N | 232,107 | 205,744 | -11% | 70% | ||||
| Vermont | Y | 67,765 | 69,355 | 2% | 39% | ||||
| Virginia | N | 648,786 | 660,836 | 2% | 68% | ||||
| Washington | Y | 738,337 | 767,557 | 4% | 47% | ||||
| West Virginia | Y | 203,216 | 207,363 | 2% | 40% | ||||
| Wisconsin | N | NR | 488,890 | NR | 47% | ||||
| Wyoming | N | 44,831 | 44,681 | 0% | 65% | ||||
| # States Reporting: | — | 36 | 46 | 36 | 46 | ||||
|
NOTES: NR- Data not reported. Total growth in child enrollment for January 2014 and January 2016 is based on 36 states reporting data for January 2014 and January 2016.
SOURCE: CMS, Medicaid & CHIP: Monthly Application and Eligibility Reports, Oct 2013 – Jan 2016
|
|||||||||
Endnotes
Executive Summary
See Monthly Medicaid and CHIP reports at http://medicaid.gov/medicaid-chip-program-information/program-information/medicaid-and-chip-enrollment-data/medicaid-and-chip-application-eligibility-determination-and-enrollment-data.html. This analysis is based on reports for October 2013 through January 2016.
All months of data are available for download on a state by state basis on here: https://www.kff.org/health-reform/state-indicator/total-monthly-medicaid-and-chip-enrollment/. Child enrollment data are available here: https://www.kff.org/other/state-indicator/total-medicaid-and-chip-child-enrollment/.
Key Findings
Connecticut does not report data for Summer 2013 or for February and April 2014; Maine does not report data for Summer 2013 and February through April 2014; North Dakota does not report data for February through June 2014; and Vermont does not report data for November 2014. Moreover, the number of states with the Medicaid expansion in effect changes over the time period, with Michigan moving from non-expansion to expansion status in April 2014, New Hampshire shifting to expansion status in July 2014 and Pennsylvania shifting to expansion status in January 2016. Additionally, Medicaid expansion coverage in Indiana became effective February 2016, after the reporting period.