
Trends in Medicaid Spending Leading up to ACA Implementation
Data Sources
Because no existing Medicaid data source includes current spending data, current enrollment data, and detailed data on spending per enrollee, we combine data from three sources for this analysis.
CMS-64. The main source for spending data is the Medicaid Financial Management Reports (Form 64) from the Center for Medicare and Medicaid Services (CMS) for federal fiscal years 2007 to 2013, which are used to obtain aggregate spending. These data are available by state and spending category. At this time, the CMS-64 does not report enrollment or spending by eligibility group. However, in the new future, it will report total enrollment, as well as enrollment for the new adult eligibility group.
Beginning with FY 2010 data, the CMS-64 used new spending categories, which aim both to capture additional spending categories (e.g., those related to provisions under health reform) and to increase consistency across states in how certain types of spending (e.g., “other practitioner”) are classified. To compare the FY 2010 data to previous years, we relied on an updated crosswalk of spending categories from CMS to map the new categories to the previous years’ categories. This crosswalk allows us to examine trends over time, but it is possible that some services shifted categories in some states as a result of this change.
The net expenditure for prescription drugs in Medicaid reflects both the cost of the drug/dispensing fee as well as the rebate received from the drug manufacturer. Drug manufacturers are required to pay these rebates to the federal and state governments for outpatient prescription drugs as a condition of Medicaid coverage for the drug. In most cases, we report net drug expenditures (that is, outlays after accounting for rebates), which represent total program spending for prescription drugs. The rebates effectively lower the price that Medicaid pays for prescription drugs. In some cases, specified in the text, we also report spending for prescription drugs excluding rebates.
Medicaid Enrollment. Data on enrollment come from a survey of all 50 states and the District of Columbia conducted by Health Management Associates (HMA) for the Kaiser Commission on Medicaid and the Uninsured (KCMU). These data provide point in time enrollment for June of each year. Total enrollment data were reported for all states and the District of Columbia for two main groups: 1) aged and individuals with disabilities; and 2) child, parent, and other non-aged, non-disabled adult enrollment (throughout the report referred to simply as “family enrollment”).
MSIS. A third data source, the Medicaid Statistical Information System (MSIS), provides detailed, individual level spending and enrollment data stratified by service type and eligibility group. Data from the 2010 MSIS1 are used to estimate spending growth by eligibility group.
Analytic Approach
Accurately estimating per enrollee spending growth rates requires data that can link spending to enrollment groups. This is because simply dividing the total change in spending by the total change in enrollment would bias the estimate of the growth in spending per enrollee. Overall, for the time period of this analysis, spending would be biased downward because of the faster enrollment among less expensive family beneficiaries relative to the aged and disabled. This bias could be even more pronounced among subsets of services. For example, since families account for only a small share of long-term care spending, enrollment growth among families is not likely to affect long-term care spending.
Unfortunately, the CMS-64 does not enable us to stratify Medicaid spending growth for families versus the aged/disabled because CMS-64 data do not associate spending with eligibility groups. Therefore, the analysis presented in this paper draws on the Medicaid Statistical Information System (MSIS), to estimate spending per enrollee growth by eligibility group. MSIS provides detailed individual-level spending and enrollment data stratified by service type and eligibility group, but it is not available for the more recent years in this analysis. We use the 2010 MSIS, as well as the 2007 MSIS, the year corresponding with the start of the time period in this analysis.
The MSIS is incorporated into the per enrollee estimates in two ways. First, we use the 2010 MSIS data to estimate annual spending per enrollee growth by service in a way that accounts for differences in service use across eligibility groups. To do this, we use MSIS to calculate service-specific annual enrollment growth rates by obtaining service-specific weights for families versus the aged and disabled beneficiaries. These weights are equal to the share of Medicaid spending for each service that each eligibility group generates using the 2010 MSIS. Then, for each service category, we calculate a weighted average of the enrollment growth for the two eligibility groups. For example, the 2010 MSIS indicates that families account for 47 percent of spending on hospitals and physicians, while the aged and disabled beneficiaries account for 53 percent. Thus, we calculate the hospital and physician-specific enrollment growth by weighting the family enrollment growth by 0.47 and enrollment growth for the aged and disabled beneficiaries by 0.53. Finally, we divide the annual spending growth for each service by the weighted annual enrollment growth for each service to calculate the annual spending per enrollee growth for each service (see Box A-1).
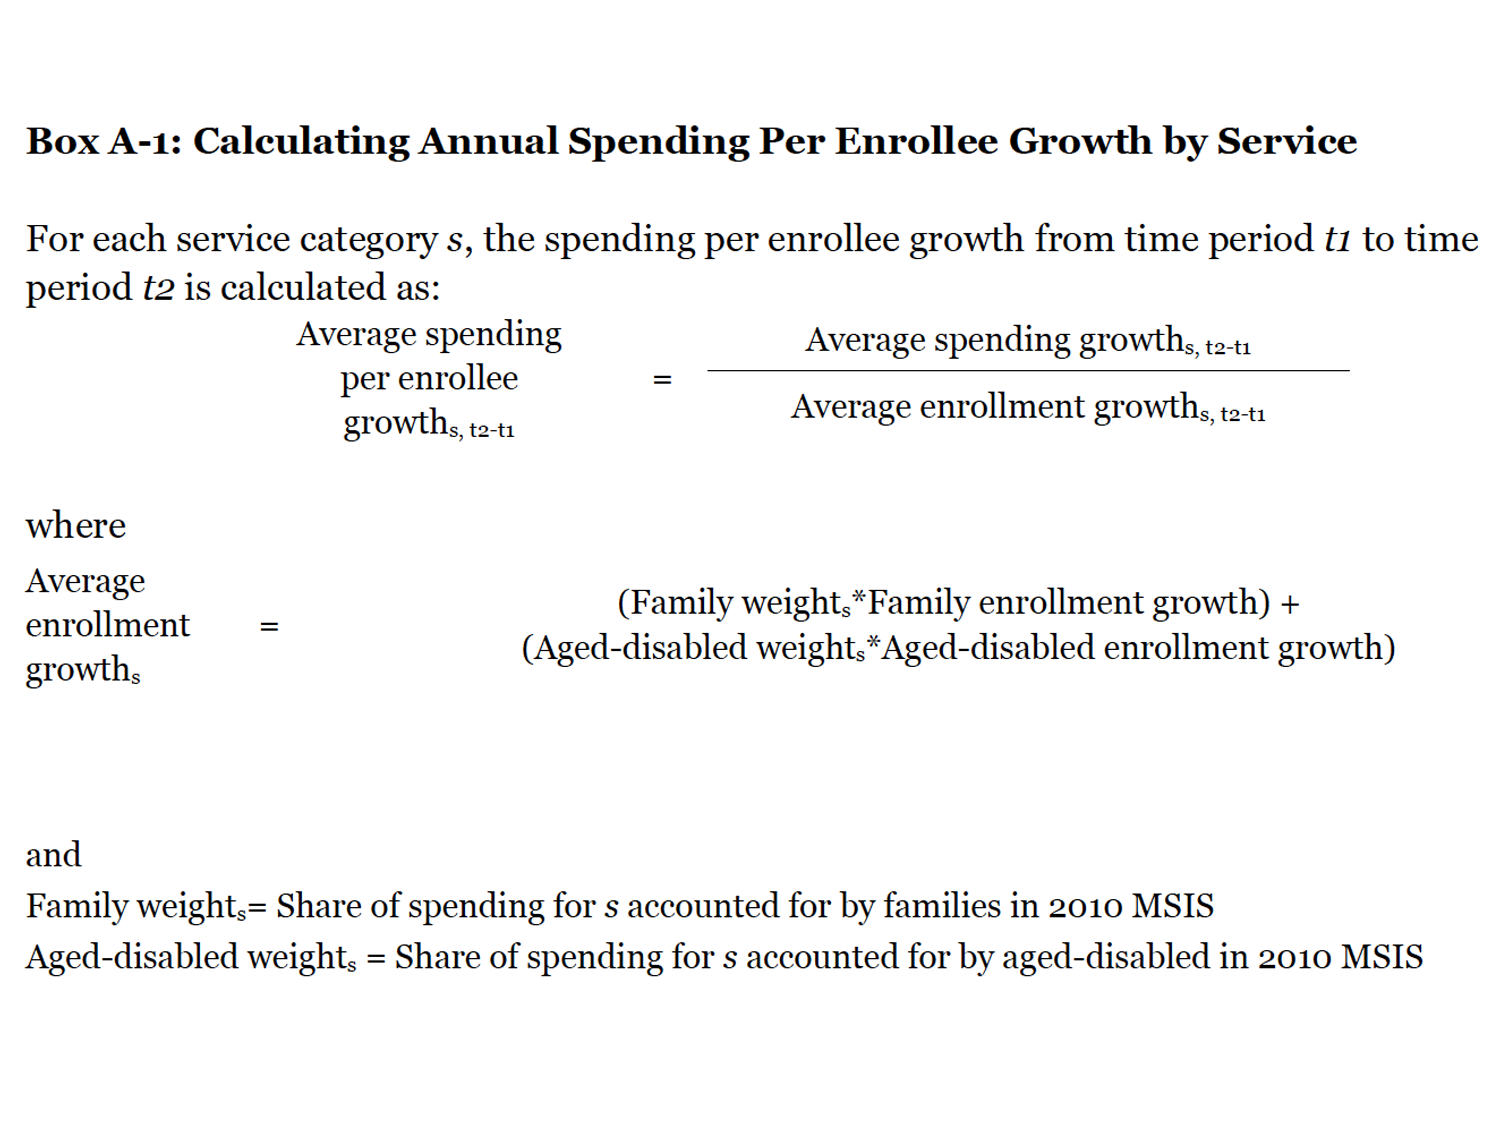
Box A-1: Calculating Annual Spending Per Enrollee Growth by Service
Second, we used MSIS data to estimate annual spending per enrollee growth by eligibility group in a way that similarly accounts for differences in service use across eligibility groups. This analysis enables us to deconstruct total spending growth from year to year into increases in enrollment and increases in spending per enrollee by eligibility group. First, we use the 2007 MSIS to establish baseline spending by eligibility group. Then, to calculate the annual spending per enrollee growth by eligibility group, we weight the annual growth in spending per enrollee for each service by the importance of that service to the specific eligibility group and then aggregate across all services (step 1 in Box A-2). For each eligibility group, we then multiply the annual spending per enrollee growth estimate times the annual enrollment growth. This gives us the annual spending growth rate for each eligibility group (step 2 in Box A-2). Finally, we apply these rates to baseline spending by eligibility group calculated using 2007 MSIS data (step 3 in Box A-2). The spending totals and rates of growth calculated using this method are shown in Table 3 and differ from the spending growth in Figure 5 and Table 1 because the data source and method used to calculate total spending are different. Total spending in Table 3 reflects sums of spending by eligibility group calculated by taking the 2007 MSIS spending level for each eligibility group and applying the corresponding growth rates calculated using data from Medicaid Financial Management Reports (HCFA/CMS Form 64), Medicaid Statistical Information System (MSIS), and KCMU/HMA enrollment data.
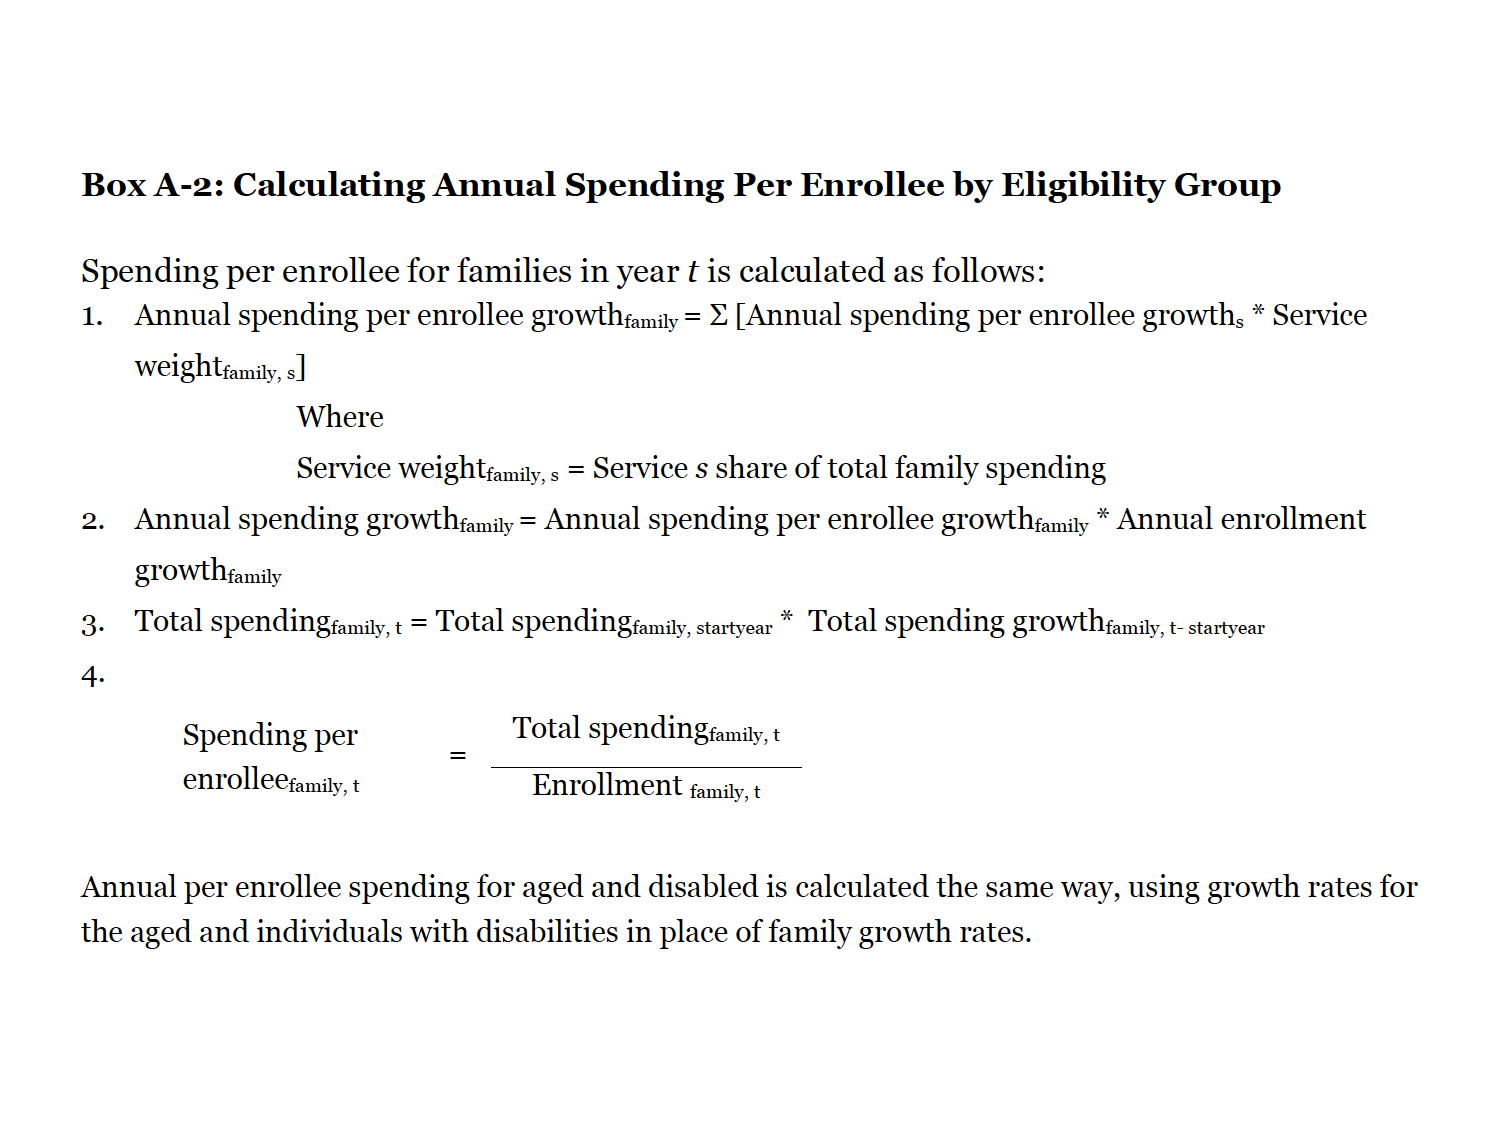
Box A-2: Calculating Annual Spending Per Enrollee by Eligibility Group
