Racial and Ethnic Disparities in COVID-19 Cases and Deaths in Nursing Homes
Data Note
Long-term care facilities, such as nursing homes, have experienced a disproportionate share of deaths during the COVID-19 pandemic. The most recently available data show long-term care facilities account for 8% of all coronavirus cases but more than 40% of all COVID-19 deaths. Overall, COVID-19 has taken a disproportionate toll on communities of color. Black, Hispanic, and American Indian and Alaska Native (AIAN) populations have been shown to be at increased risk for cases, deaths, and hospitalizations. However, because the Center for Medicare and Medicaid Services does not require nursing facilities to report race/ethnicity data for COVID-19 cases and deaths, it is not possible to document the full scope of the pandemic on communities of color in nursing homes, or other long-term care settings. Only four states report cases and deaths in long-term care facilities by race/ethnicity (Iowa, Indiana, Louisiana, and Mississippi).
In the absence of these data, this analysis uses linked datasets – one with facility-level cases and deaths as of October 11th and another with 2017 facility-level resident information by race/ethnicity – to examine cases and deaths based on racial/ethnic composition of nursing home residents. Specifically, it assesses whether nursing homes with relatively high shares of Black and Hispanic residents experienced a disproportionate burden of cases and deaths compared to those with lower shares of Black and Hispanic residents as well as a higher share of White residents. Data were not available to separately analyze cases and deaths for other racial/ethnic groups. The analysis is based on data from 13,982 nursing facilities nationwide (approximately 93% of all nursing facilities). In addition to national data, we present similar results at the state level, where sufficient data are available. See methods for more details on how nursing homes were categorized, data limitations, and analytic approach.
Deaths and Cases by Resident Race/Ethnicity
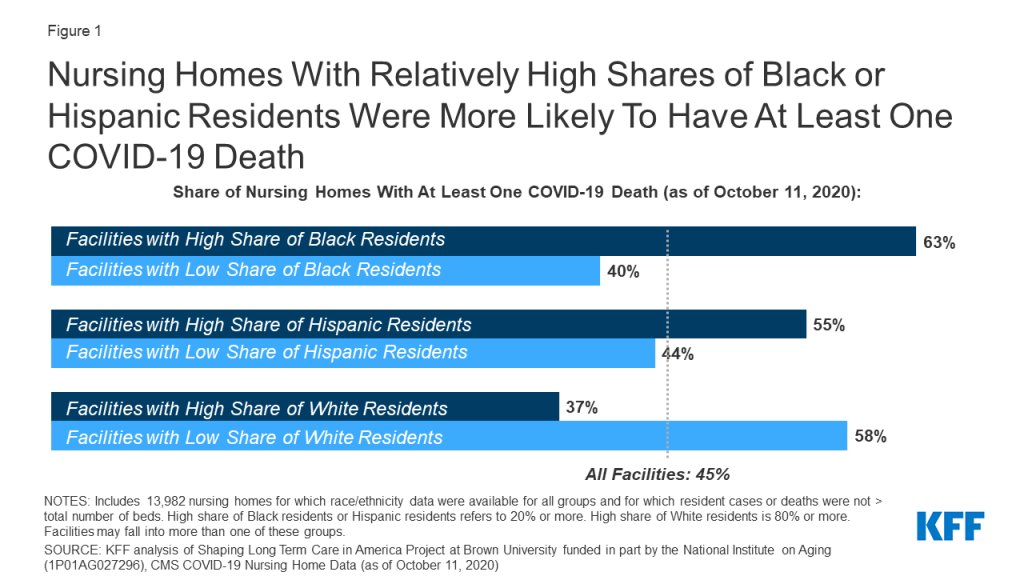
Nursing homes with relatively high shares of Black or Hispanic residents were more likely to report at least one COVID-19 death than nursing homes with lower shares of Black or Hispanic residents (Figure 1). Overall, within the 13,982 nursing homes included in this analysis, 12% of all nursing home residents are Black and 6% are Hispanic. Our analysis finds deaths due to COVID-19 were more common among nursing homes with relatively high shares of Black or Hispanic residents (defined in this analysis as 20% or greater). Nationwide, 63% of nursing homes with a relatively high share of Black residents reported one or more COVID-19 death, higher than the share reported by nursing homes with a lower share of Black residents (40%). Similarly, 55% of nursing homes with a relatively high share of Hispanic residents reported COVID-19 deaths, higher than the share reported by nursing homes with a lower share of Hispanic residents (44%).
Nursing homes with relatively high shares of Black or Hispanic residents were more likely to report coronavirus cases than other nursing homes, although the differences are narrower than for reported COVID-19 deaths (Figure 2). Nursing homes with a high share of Black residents were more likely to report coronavirus cases than nursing homes with a low share of Black residents (87% compared to 79%). Similarly, nursing homes with a relatively high share of Hispanic residents were more likely to report coronavirus cases (84%) than nursing homes with a lower share (81%).

Case Outbreak Severity by Resident Race/Ethnicity
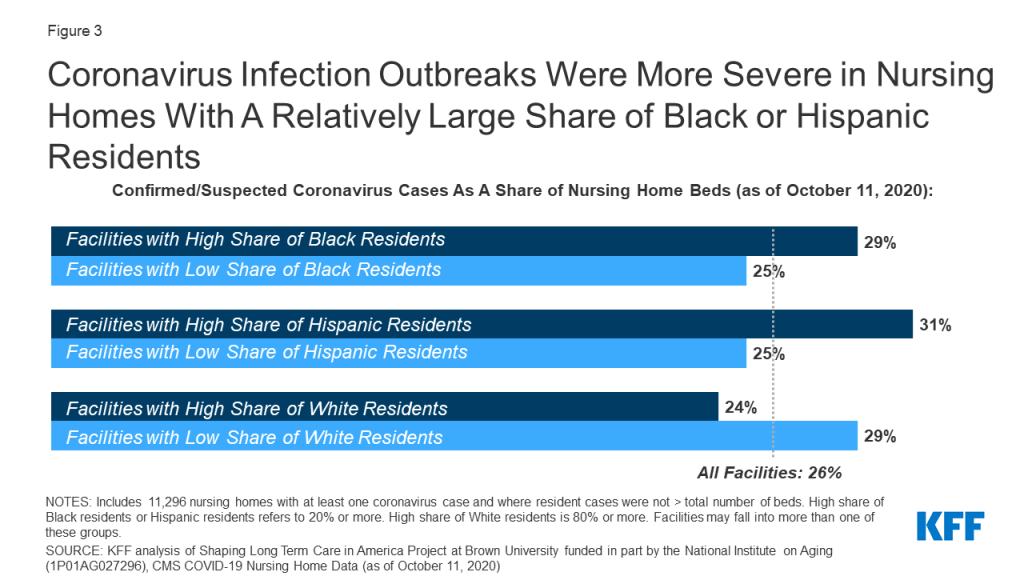
Among nursing homes that had at least one case of coronavirus, nursing homes with relatively high shares of Black or Hispanic residents reported more severe case outbreaks than nursing homes with low shares of Black or Hispanic residents, as measured by confirmed or suspected cases as a share of nursing home beds (Figure 3). In nursing homes with a relatively high share of Black residents, positive cases among residents account for 29% of beds, as compared to 25% of beds in nursing homes with a relatively low share of Black residents. Similarly, among nursing homes with a relatively high share of Hispanic residents, positive cases among all residents account for 31% of beds, as compared to 25% of beds in nursing homes with a relatively low share of Hispanic residents.
Cases and Deaths by Resident Race/Ethnicity in Select States
National patterns of COVID-19 deaths and cases in nursing homes with relatively high shares of Black or Hispanic residents generally persist at the state-level, based on data from 21 states. State-level analysis allows for a better understanding of whether observed national racial disparities may be attributed to regional outbreaks and geographic variations in the composition of the population by race/ethnicity. This analysis is limited to the twenty-one states with a sufficient number of nursing homes that had either a high share of Black or Hispanic residents, as described in greater detail in the methods section. Among these states, the experience of nursing homes with a high share of Black or Hispanic residents generally mirrored the national pattern.
In 19 of the 21 states for which there were sufficient data, nursing homes with a relatively high share of Black or Hispanic residents were more likely to report one or more death than other nursing homes in the state (Appendix Table 1). In some instances, these differences were relatively large, some with a gap of 20 percentage points or more. For example, in Florida, the share of nursing homes reporting one or more death due to COVID-19 was substantially higher among nursing homes with a high share of Hispanic residents than in other nursing homes (85% vs 63%). A similar gap between nursing homes with high and low share residents of Black residents was observed in five states (Illinois, Maryland, Michigan, New York, and Pennsylvania), where the gap in the share that reported at least one death was equal to or exceeded 20 percentage points. In Michigan, for example, 64% of nursing homes with a high share of Black residents reported 1 or more death, as compared to 35% in nursing homes with a low share of Black residents. The gap in the share of reported at least one death was not as pronounced in all states. For example, the gap between nursing homes with high versus lower shares of Black residents was fewer than 10 percentage points in Alabama, Florida, and Ohio.
Similarly, differences in the share of facilities that reported at least one case and case severity by resident race/ethnicity seen nationally generally also held in these states. Like the national data, state data shows that nursing homes with relatively more Black or Hispanic residents were more likely to report at least one COVID-19 case, though differences were less pronounced than death patterns; the exception to this pattern is Florida, Louisiana, North Carolina, and South Carolina where nursing facilities with higher and lower shares of Black residents were either equally likely to report at least one case (Florida and South Carolina) or facilities with a lower share of Black residents were slightly more likely to report a case (Louisiana and North Carolina).
With respect to the severity of outbreaks at the state level, the pattern observed at the national level was generally evident at the state level. However, in a few states, including Arkansas, Georgia, Louisiana, New Jersey, Ohio, and South Carolina, facilities with low shares of Black residents had equal or slightly more severe outbreak severity as facilities with high shares of Black residents.
Discussion
These findings confirm that nursing homes with a relatively large share of Black or Hispanic residents have been disproportionately affected by COVID-19, as measured by the share reporting deaths, share reporting cases, and the severity of outbreak. This analysis amplifies prior research that finds that the coronavirus has disproportionately impacted communities of color, including residents in nursing homes, potentially reflecting patterns of community transmission or nursing home quality. Research supports a strong relationship between nursing home cases and community transmission. There have been more mixed results when evaluating the relationship between nursing homes coronavirus outbreaks and nursing home quality, with some research finding a relationship and some not. Nursing homes are now required by the Center for Medicare and Medicaid services to report cases and deaths on a regular basis, but they are not required to report the data by race and ethnicity, and few states include such information in their own public reporting; such information is needed to document the direct impact of the pandemic on older residents of color, and the underlying factors that drive these disparities. Even without such data, this analysis makes it clear that residents in facilities that serve a relatively large share of Black and Hispanic residents have been disproportionately affected by the coronavirus.
Appendices: Methods
Data Sources
This analysis draws on federal data published by the Center for Medicare and Medicaid Services (CMS)and additional facility-level data from Brown School of Public Health’s LTCfocus.org data, which includes summary-level information derived from 2017 MDS (Minimum Dataset) data.
data on cases and deaths
Data on coronavirus cases and deaths in nursing homes is from federal data published by the Center for Medicare and Medicaid Services (CMS). CMS requires all Medicare and Medicaid certified nursing facilities to report data on suspected and confirmed coronavirus cases and deaths for residents and staff. These data collection standards make the federal data more comparable across states than state-published data. Data in this paper reflects nursing home cases and deaths as of October 11, 2020. A major limitation of this data is the time period included: facilities were only required to report data starting May 8th, 2020 and reporting cases or deaths prior to that date was not required. Thus, data may not be counting cases or deaths in facilities or states that experienced outbreaks earlier in spring 2020. For more information on the federal data, see KFF analysis comparing the state-reported data to the federal data.
In addition, some nursing homes in the CMS data report a greater number of cases and/or deaths than the total number of beds in the nursing home. We dropped approximately 1,000 nursing homes for which this was the case, leading to a final sample of 13,982 nursing homes. This sample is a subset of the approximately 15,000 nursing homes in the US.
Data on Race/Ethnicity of Residents
CMS does not require nursing facilities to report cases and deaths by race/ethnicity. Therefore, facility-level data on resident race/ethnicity was pulled from Brown School of Public Health’s LTCfocus.org data, which includes summary-level information derived from 2017 MDS (Minimum Dataset) data. MDS assessments are completed for all residents in nursing homes to identify each resident’s functional capabilities and help nursing home staff identify health problems. Demographic data, including race/ethnicity, is collected during this process as well. Brown School of Public Health provides summary data of MDS from 2010-2017, including facility-level data on the share of nursing home residents who are Black, White, or Hispanic. This analysis does not include data on staff cases and deaths since MDS does not collect data on racial makeup of nursing home staff, and we were unable to identify a data source for race/ethnicity of nursing home staff at the facility level.
The LTCfocus.org data censors data points representing fewer than 11 residents due to privacy standards set forth by CMS. Due to the small number of Black or Hispanic residents in many nursing homes, this created missing data points in nearly 9,000 nursing homes. For these “missing” data points, we imputed a value of 5.5 residents and calculated shares of residents based on the newly imputed value. We conducted a sensitivity analysis that showed that results were largely unchanged when the sample included and excluded the nursing homes with imputed data.
Classifying Facilities by Resident Race/Ethnicity
Overall, within the 13,982 nursing homes included in this analysis, 12% of all nursing home residents are Black and 6% are Hispanic. Nursing homes have a disproportionately low share of Hispanic residents when compared to total US population distribution by Race/Ethnicity. We categorized nursing homes where 20% or more of residents were Black or Hispanic as “High Share of Black Residents” or “High Share of Hispanic Residents.” This definition is based on the distribution of share of Black and Hispanic residents among the 13,982 nursing homes in our sample and a need to have adequate sample within each group. Many nursing homes reported extremely low shares of Black or Hispanic residents or zero Black or Hispanic residents. The following are the Ns for the groups reported in the paper:
| Number of Facilities Included in Analysis, by Race/Ethnicity Group | ||
| Category Definition | Total Facilities | |
| Total US Facilities | 13,982 | |
| Low Share of Black Residents | Under 20% | 10,995 |
| High Share of Black Residents | 20% or greater | 2,987 |
| Low Share of Hispanic Residents | Under 20% | 12,995 |
| High Share of Hispanic Residents | 20% or greater | 987 |
| Low Share of White Residents | Under 80% | 5,276 |
| High Share of White Residents | 80% or greater | 8,706 |
Residents may be double counted in race/ethnicity data (for example, a resident could be counted as both “White” and “Hispanic”). Therefore, some facilities with a “high” share of Black or Hispanic residents may overlap with facilities with a “high” share White residents.
Choosing States for State-Level Analysis
State-level analysis was limited to the states with 50 or more facilities in the high share of Black or Hispanic residents categories, based on our definitions of “high share” described above. In total, we were able to provide state-level data on 21 states. California, Florida, New York, and Texas each had 50 or more nursing homes with a high share of both Black and Hispanic residents, and the remaining 17 states in the analysis had only a sufficient number of nursing homes with a high share of Black residents.
Appendices: Table
| Appendix Table 1: COVID-19 Cases and Deaths In Nursing Homes by Resident Race/Ethnicity in Select States, as of October 11, 2020 | ||||
| Total Nursing Homes in Sample | Share of Nursing Homes with At Least One COVID-19 Death | Share of Nursing Homes with At Least One COVID-19 Case | COVID-19 Case Rate* Among Nursing Homes With Cases | |
| Total US Nursing Homes | 13,982 | 45% | 81% | 26% |
| Alabama | ||||
| All Nursing Homes | 215 | 65% | 97% | 37% |
| Low share of Black residents | 111 | 63% | 96% | 36% |
| High share of Black residents | 104 | 66% | 98% | 38% |
| Low share of Hispanic residents | N/A | N/A | N/A | N/A |
| High share of Hispanic residents | N/A | N/A | N/A | N/A |
| Arkansas | ||||
| All Nursing Homes | 201 | 46% | 82% | 26% |
| Low share of Black residents | 148 | 43% | 81% | 28% |
| High share of Black residents | 53 | 53% | 83% | 21% |
| Low share of Hispanic residents | N/A | N/A | N/A | N/A |
| High share of Hispanic residents | N/A | N/A | N/A | N/A |
| California | ||||
| All Nursing Homes | 1,029 | 44% | 85% | 33% |
| Low share of Black residents | 832 | 42% | 84% | 32% |
| High share of Black residents | 197 | 52% | 89% | 38% |
| Low share of Hispanic residents | 668 | 39% | 83% | 31% |
| High share of Hispanic residents | 361 | 53% | 90% | 37% |
| Florida | ||||
| All Nursing Homes | 643 | 65% | 93% | 30% |
| Low share of Black residents | 468 | 64% | 93% | 29% |
| High share of Black residents | 175 | 69% | 93% | 33% |
| Low share of Hispanic residents | 576 | 63% | 92% | 29% |
| High share of Hispanic residents | 67 | 85% | 94% | 35% |
| Georgia | ||||
| All Nursing Homes | 323 | 63% | 89% | 35% |
| Low share of Black residents | 100 | 54% | 88% | 37% |
| High share of Black residents | 223 | 66% | 89% | 34% |
| Low share of Hispanic residents | N/A | N/A | N/A | N/A |
| High share of Hispanic residents | N/A | N/A | N/A | N/A |
| Illinois | ||||
| All Nursing Homes | 688 | 48% | 83% | 24% |
| Low share of Black residents | 540 | 41% | 81% | 24% |
| High share of Black residents | 148 | 72% | 90% | 24% |
| Low share of Hispanic residents | N/A | N/A | N/A | N/A |
| High share of Hispanic residents | N/A | N/A | N/A | N/A |
| Indiana | ||||
| All Nursing Homes | 476 | 37% | 72% | 21% |
| Low share of Black residents | 426 | 36% | 71% | 20% |
| High share of Black residents | 50 | 50% | 80% | 26% |
| Low share of Hispanic residents | N/A | N/A | N/A | N/A |
| High share of Hispanic residents | N/A | N/A | N/A | N/A |
| Louisiana | ||||
| All Nursing Homes | 271 | 75% | 93% | 28% |
| Low share of Black residents | 95 | 77% | 95% | 29% |
| High share of Black residents | 176 | 73% | 92% | 28% |
| Low share of Hispanic residents | N/A | N/A | N/A | N/A |
| High share of Hispanic residents | N/A | N/A | N/A | N/A |
| Maryland | ||||
| All Nursing Homes | 216 | 61% | 84% | 29% |
| Low share of Black residents | 96 | 46% | 75% | 23% |
| High share of Black residents | 120 | 73% | 91% | 32% |
| Low share of Hispanic residents | N/A | N/A | N/A | N/A |
| High share of Hispanic residents | N/A | N/A | N/A | N/A |
| Michigan | ||||
| All Nursing Homes | 402 | 41% | 79% | 20% |
| Low share of Black residents | 310 | 35% | 78% | 19% |
| High share of Black residents | 92 | 64% | 82% | 22% |
| Low share of Hispanic residents | N/A | N/A | N/A | N/A |
| High share of Hispanic residents | N/A | N/A | N/A | N/A |
| Missouri | ||||
| All Nursing Homes | 489 | 41% | 78% | 23% |
| Low share of Black residents | 416 | 38% | 77% | 22% |
| High share of Black residents | 73 | 55% | 84% | 25% |
| Low share of Hispanic residents | N/A | N/A | N/A | N/A |
| High share of Hispanic residents | N/A | N/A | N/A | N/A |
| Mississippi | ||||
| All Nursing Homes | 180 | 66% | 89% | 39% |
| Low share of Black residents | 66 | 58% | 85% | 36% |
| High share of Black residents | 114 | 71% | 91% | 40% |
| Low share of Hispanic residents | N/A | N/A | N/A | N/A |
| High share of Hispanic residents | N/A | N/A | N/A | N/A |
| North Carolina | ||||
| All Nursing Homes | 395 | 41% | 81% | 26% |
| Low share of Black residents | 183 | 35% | 81% | 24% |
| High share of Black residents | 212 | 46% | 81% | 27% |
| Low share of Hispanic residents | N/A | N/A | N/A | N/A |
| High share of Hispanic residents | N/A | N/A | N/A | N/A |
| New Jersey | ||||
| All Nursing Homes | 336 | 79% | 91% | 30% |
| Low share of Black residents | 240 | 80% | 91% | 31% |
| High share of Black residents | 96 | 76% | 93% | 28% |
| Low share of Hispanic residents | N/A | N/A | N/A | N/A |
| High share of Hispanic residents | N/A | N/A | N/A | N/A |
| New York | ||||
| All Nursing Homes | 603 | 59% | 81% | 21% |
| Low share of Black residents | 424 | 54% | 75% | 20% |
| High share of Black residents | 179 | 73% | 93% | 22% |
| Low share of Hispanic residents | 530 | 58% | 79% | 20% |
| High share of Hispanic residents | 73 | 68% | 90% | 23% |
| Ohio | ||||
| All Nursing Homes | 872 | 36% | 70% | 23% |
| Low share of Black residents | 702 | 34% | 68% | 23% |
| High share of Black residents | 170 | 43% | 76% | 20% |
| Low share of Hispanic residents | N/A | N/A | N/A | N/A |
| High share of Hispanic residents | N/A | N/A | N/A | N/A |
| Pennsylvania | ||||
| All Nursing Homes | 655 | 46% | 83% | 29% |
| Low share of Black residents | 562 | 40% | 83% | 27% |
| High share of Black residents | 93 | 77% | 85% | 36% |
| Low share of Hispanic residents | N/A | N/A | N/A | N/A |
| High share of Hispanic residents | N/A | N/A | N/A | N/A |
| South Carolina | ||||
| All Nursing Homes | 167 | 69% | 93% | 39% |
| Low share of Black residents | 59 | 63% | 93% | 39% |
| High share of Black residents | 108 | 72% | 94% | 39% |
| Low share of Hispanic residents | N/A | N/A | N/A | N/A |
| High share of Hispanic residents | N/A | N/A | N/A | N/A |
| Tennessee | ||||
| All Nursing Homes | 294 | 44% | 87% | 20% |
| Low share of Black residents | 237 | 41% | 87% | 19% |
| High share of Black residents | 57 | 60% | 88% | 26% |
| Low share of Hispanic residents | N/A | N/A | N/A | N/A |
| High share of Hispanic residents | N/A | N/A | N/A | N/A |
| Texas | ||||
| All Nursing Homes | 1,052 | 50% | 81% | 25% |
| Low share of Black residents | 831 | 46% | 80% | 25% |
| High share of Black residents | 221 | 64% | 86% | 27% |
| Low share of Hispanic residents | 815 | 46% | 80% | 24% |
| High share of Hispanic residents | 237 | 61% | 84% | 31% |
| Virginia | ||||
| All Nursing Homes | 262 | 41% | 79% | 25% |
| Low share of Black residents | 128 | 31% | 76% | 24% |
| High share of Black residents | 134 | 51% | 81% | 26% |
| Low share of Hispanic residents | N/A | N/A | N/A | N/A |
| High share of Hispanic residents | N/A | N/A | N/A | N/A |
| NOTES: N/A=fewer than 50 facilities; High share = 20% or greater; Low share=Under 20%; * Case rate is calculated as resident cases/beds.SOURCE: KFF analysis of data from Shaping Long Term Care in America Project at Brown University and CMS COVID-19 Nursing Home Data as of 10/11/2020 | ||||