Modifying Medicare's Benefit Design: What's the Impact on Beneficiaries and Spending?
Findings
What are the expected effects on beneficiaries of a modified medicare benefit design combined with restrictions on medigap coverage?
Compared to current law, the modified Medicare benefit design and restrictions on Medigap first-dollar coverage under Option 1 would result in net savings of $0.7 billion in 2018 for beneficiaries in traditional Medicare, in the aggregate. This amount includes an estimated $4.3 billion increase in cost sharing for Medicare-covered services that occurs even with the addition of an annual cost-sharing limit, in part due to the higher deductible for Part B services compared to current law. The aggregate increase in cost sharing is offset by an estimated $5.0 billion reduction in premiums for Medicare Part B and Medigap (Table 2).
| Table 2: Change in Expected Annual Total Health Care Spending for Various Payers Under Four Medicare Benefit Design Options if Fully Implemented in 2018 | |||||
| Spending effects (in billions) | Option 1 Basic benefit redesign option |
Option 2 Lower deductible/cost-sharing limit option |
Option 3 Low-income subsidies option |
Option 4 Income-related option |
|
| Light blue shading indicates largest spending reduction of the 4 options | |||||
| Tan shading indicates largest spending increase of the 4 options | |||||
| Total health care spending | |||||
| Net change | -$8.8 | -$1.5 | -$5.9 | -$6.1 | |
| Spending1 | $4.8 | $15.1 | $4.9 | $9.4 | |
| Savings2 | -$13.5 | -$16.6 | -$10.8 | -$15.4 | |
| Federal spending | |||||
| Net change | -$5.5 | $8.8 | -$0.6 | $0.3 | |
| Medicare | -$3.0 | $14.1 | $1.8 | $5.9 | |
| Medicaid (federal) | -$2.8 | -$5.0 | -$2.7 | -$5.9 | |
| TRICARE | $0.3 | -$0.3 | $0.3 | $0.2 | |
| Beneficiary spending | |||||
| Net change | -$0.7 | -$3.8 | -$1.9 | -$0.9 | |
| Cost sharing | $4.3 | $1.1 | $2.8 | $3.2 | |
| Premiums | -$5.0 | -$4.8 | -$4.7 | -$4.1 | |
| Other payer spending | |||||
| Net change | -$2.6 | -$6.5 | -$3.4 | -$5.4 | |
| State Medicaid | -$2.1 | -$3.8 | -$2.0 | -$4.4 | |
| Employers | $0.2 | -$1.3 | -$0.4 | $0.04 | |
| Other supplemental insurers3 | -$0.6 | -$1.4 | -$1.0 | -$1.0 | |
| NOTE: 1Spending amounts are the sum of increases in federal, beneficiary, and other payer categories. 2Savings amounts are the sum of decreases in federal, beneficiary, and other payer categories. 3Other supplemental insurers includes Veterans’ Administration; Indian Health Service; Workers Compensation; other federal, state, and local sources; and other unclassified/unknown sources. SOURCE: Kaiser Family Foundation/Actuarial Research Corporation, June 2016. |
|||||
On a per capita basis, Part B premiums are expected to decrease under the basic benefit redesign option by $50 in 2018 (Table 3). This change corresponds to a projected reduction in Part B spending, which mainly reflects an increase in the deductible for beneficiaries who use only Part B services and an increase in cost sharing for certain services. Changes in Part B spending affect beneficiary Part B premiums because the standard Part B premium is set to cover 25 percent of program costs.1
| Table 3: Change in Expected Annual Per Capita Premiums by Traditional Medicare Beneficiaries Under Four Medicare Benefit Design Options if Fully Implemented in 2018 | |||||
| Option 1 Basic benefit redesign option |
Option 2 Lower deductible/cost-sharing limit option |
Option 3 Low-income subsidies option |
Option 4 Income-related option |
||
| Part B premiums | -$50 | $20 | -$30 | -$20 | |
| Medigap premiums | -$200 | -$400 | -$220 | -$280 | |
| Retiree premiums | $10 | -$110 | -$30 | <$10 | |
| NOTE: Estimates are rounded to the nearest $10. SOURCE: Kaiser Family Foundation/Actuarial Research Corporation, June 2016. |
|||||
Medigap premiums are also expected to decrease under the basic benefit redesign option by $200 per person in 2018. This is primarily because both the new cost-sharing limit in traditional Medicare and the prohibition on first-dollar Medigap coverage would reduce the amount of claims to be paid by Medigap (Table 3). Under this option, Medigap policyholders would be responsible for half ($325) of the Part A/B deductible, however, which would more than offset the amount of the premium reduction for those who incur even modest medical expenses and which could also lead to reductions in utilization by policyholders.
Although beneficiaries in traditional Medicare overall would see aggregate savings under the basic benefit redesign option, the spending effects at the individual level would vary, with some people expected to face higher costs and others expected to see lower costs compared to current law (Figure 1):
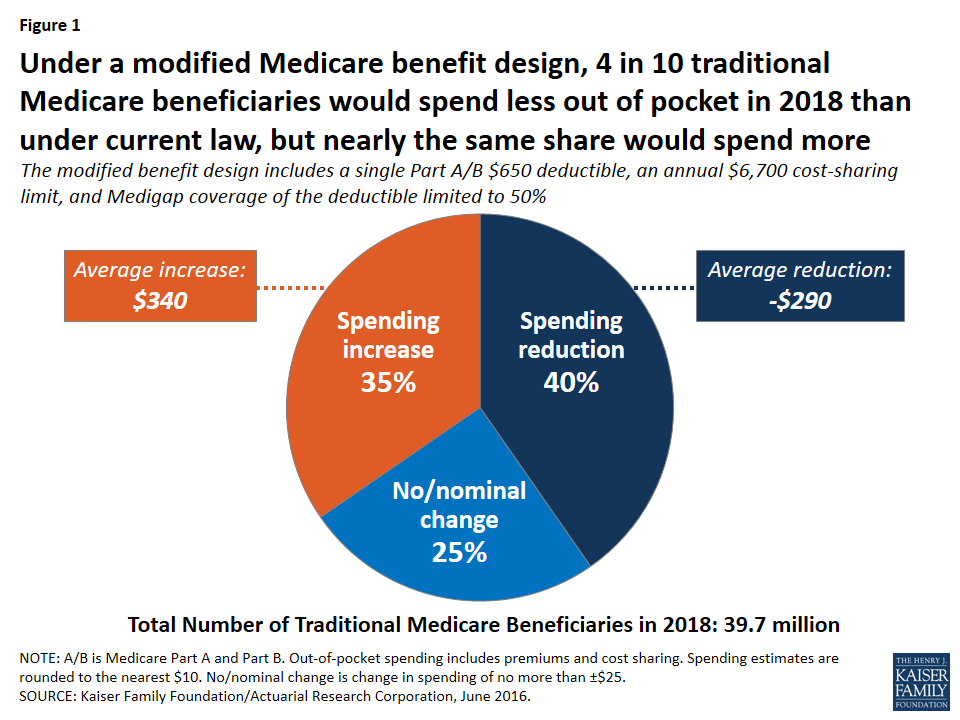
Figure 1: Under a modified Medicare benefit design, 4 in 10 traditional Medicare beneficiaries would spend less out of pocket in 2018 than under current law, but nearly the same share would spend more
- Overall, 40 percent of beneficiaries in traditional Medicare (16.0 million) are expected to see a reduction in out-of-pocket spending (including both premiums and cost sharing), averaging -$290 per person.
- Another 35 percent (13.7 million) would experience a spending increase, averaging $340 per person; this group includes 3.4 million beneficiaries with incomes below 150 percent of poverty, as discussed below.
- The remaining 25 percent (10.0 million) would experience no or only a nominal change in spending.
Some beneficiaries are expected to face higher out-of-pocket costs under the basic benefit redesign option as a result of the higher single A/B deductible relative to the deductible for Part B services under current law. At the same time, the new annual $6,700 cost-sharing limit in traditional Medicare would benefit 5 percent of traditional Medicare beneficiaries who are expected to exceed this limit in 2018. (Even more (11 percent) would benefit from a lower $4,000 limit, as under Option 2, discussed below.) Because of supplemental coverage, however, not all beneficiaries with high levels of cost sharing would directly benefit from the cost-sharing limit. For example, beneficiaries who are also enrolled in Medicaid and most Medigap policyholders already receive coverage for Medicare’s cost-sharing requirements.
Expected out-of-pocket spending effects by service use. Out-of-pocket spending changes would also vary depending upon a beneficiary’s use of services, with people using high-cost services benefitting more under the basic benefit redesign option, in general, than those using lower-cost services. Although beneficiaries who use costly services represent only a small share of the total traditional Medicare population, a larger share of these beneficiaries are expected to see a reduction in out-of-pocket spending than beneficiaries overall, and their average out-of-pocket cost savings are expected to be far greater. For example, just over half (52 percent) of beneficiaries who have an inpatient stay followed by a skilled nursing facility (SNF) stay would see a reduction in out-of-pocket spending under Option 1, versus 40 percent of all beneficiaries (Figure 2). More notably, average out-of-pocket cost savings among this group are estimated to be substantially greater than the overall average (-$1,480 per person versus -$290 overall) (Figure 3).
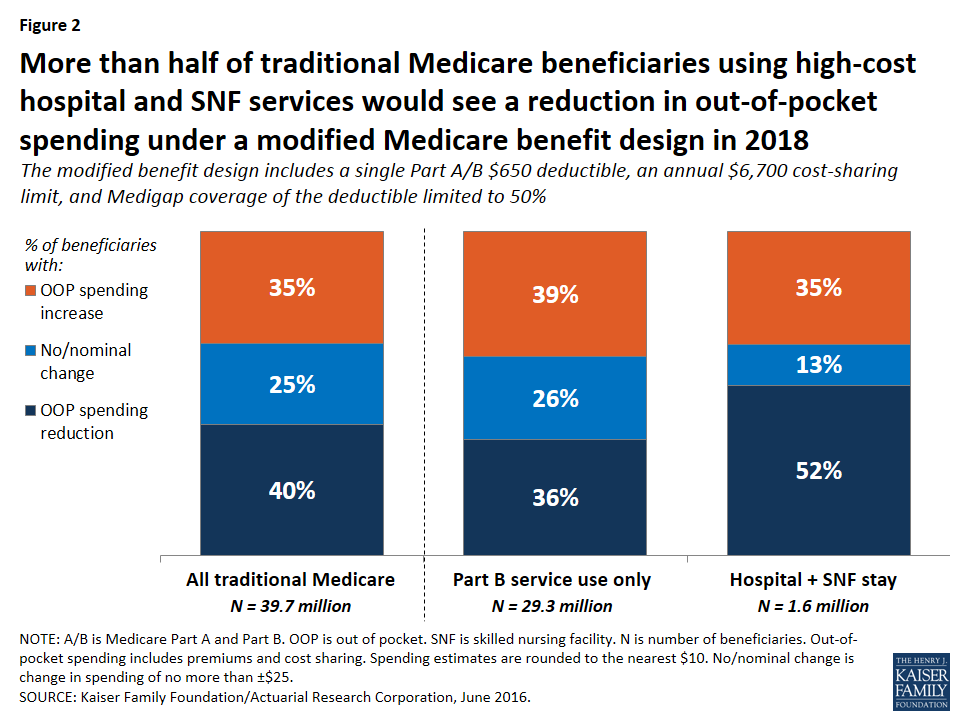
Figure 2: More than half of traditional Medicare beneficiaries using high-cost hospital and SNF services would see a reduction in out-of-pocket spending under a modified Medicare benefit design in 2018
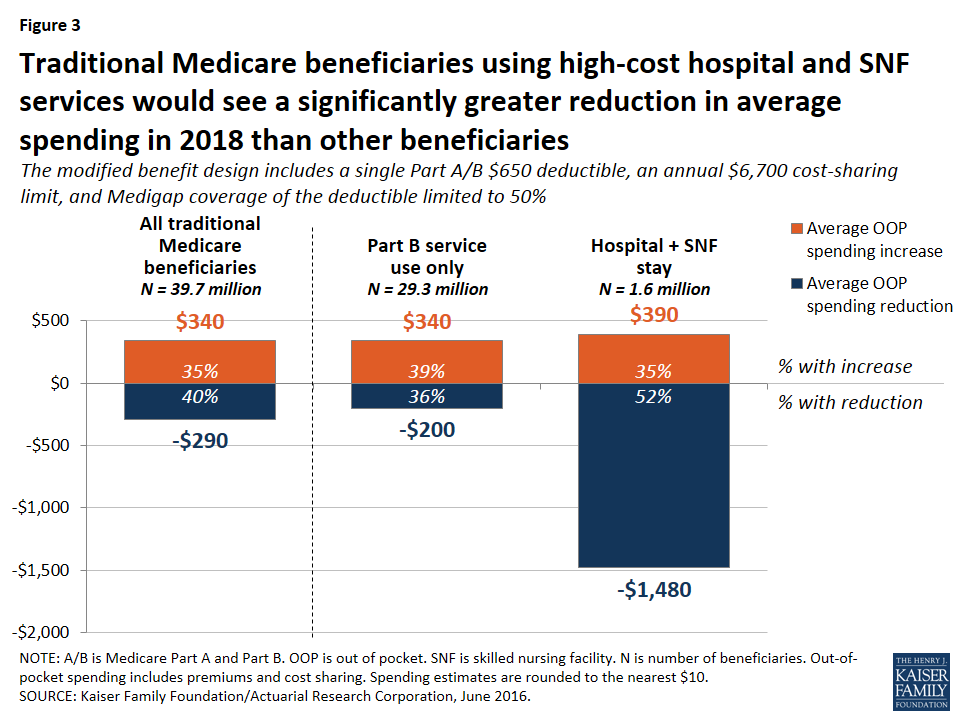
Figure 3: Traditional Medicare beneficiaries using high-cost hospital and SNF services would see a significantly greater reduction in average spending in 2018 than other beneficiaries
In contrast, among beneficiaries who use only Part B services (that is, those without a hospitalization, SNF stay, or other Part A service use)—a group that accounts for a majority of traditional Medicare beneficiaries—nearly four in 10 (39 percent) would pay more under the basic benefit redesign option compared to current law, a somewhat larger share than among beneficiaries overall (35 percent). These beneficiaries would face an average out-of-pocket spending increase that is the same as traditional beneficiaries overall ($340).
Expected out-of-pocket spending effects by income. The “near poor” (that is, beneficiaries with incomes between 100-150 percent of poverty) are not expected to fare as well under the basic benefit redesign option as those with lower or higher incomes, in terms of the share facing lower spending and average expected changes in spending. Among near-poor beneficiaries, 25 percent are expected to see lower out-of-pocket costs and 36 percent would face higher costs compared to current law (Figure 4). Altogether, 3.4 million traditional Medicare beneficiaries with incomes less than 150 percent of poverty would face higher out-of-pocket spending under the basic benefit redesign option compared to current law. This includes 1.8 million near-poor beneficiaries (36 percent, similar to the share of higher income beneficiaries facing a spending increase) and 1.6 million of those with incomes less than 100 percent of poverty (22 percent, a smaller share because many of the lowest-income beneficiaries receive assistance from Medicaid with Medicare cost-sharing requirements under current law).

Figure 4: A smaller share of lower-income traditional Medicare beneficiaries would see a reduction in out-of-pocket spending in 2018 under a modified Medicare benefit design than those with higher incomes
Among beneficiaries expected to see an increase in out-of-pocket spending, the average increase is expected to be larger among the near-poor group ($430) than among those with higher incomes ($330) or lower incomes ($350). The increase would be largest for near-poor beneficiaries because this group is less likely than higher-income beneficiaries to have supplemental coverage (such as employer or Medigap coverage) which would help enrollees with any increases in Medicare cost-sharing requirements.2 Moreover, beneficiaries with incomes above the federal poverty guidelines do not qualify for financial assistance from Medicaid to help pay Medicare Part A and Part B cost-sharing requirements, as many of those with the lowest incomes do under current law. As a result, the “near poor” would be disproportionately affected by increases in cost-sharing requirements under the basic benefit redesign option.
The share of beneficiaries expected to see a reduction in spending under the basic benefit redesign option increases with income. A smaller share of poor and near-poor beneficiaries would see a reduction in out-of-pocket spending in 2018 under the basic benefit redesign option than those with higher incomes (more than 150 percent of poverty) (19 percent, 25 percent, and 49 percent, respectively). While a smaller share of lower-income beneficiaries would see out-of-pocket cost savings, their average savings would be larger than savings among those with higher incomes (-$710, -$500, and -$220, respectively).
How would the basic benefit redesign option affect aggregate spending by Medicare, Medicaid, and other payers?
Overall, the basic benefit redesign option is expected to result in net total health care savings of $8.8 billion in 2018, including an estimated $5.5 billion in net federal savings, $2.6 billion in net savings to other payers, and $0.7 billion in net beneficiary savings (Figure 5; Table 2).
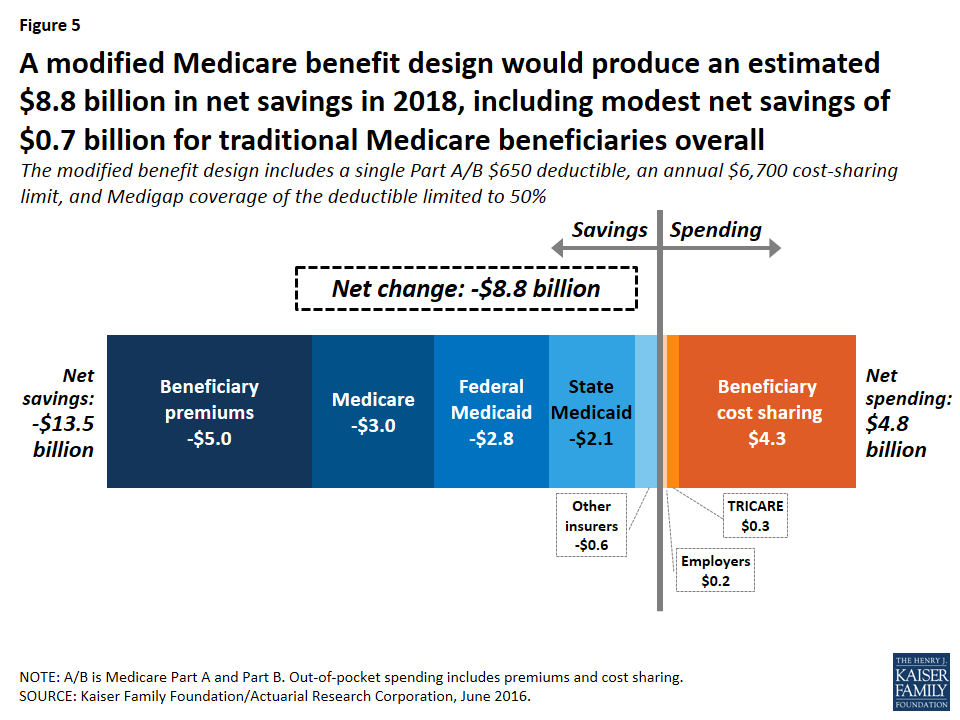
Figure 5: A modified Medicare benefit design would produce an estimated $8.8 billion in net savings in 2018, including modest net savings of $0.7 billion for traditional Medicare beneficiaries overall
- Net federal savings (-$5.5 billion) includes estimated savings for Medicare (-$3.0 billion) and Medicaid (-$2.8 billion), offset somewhat by modestly higher TRICARE spending ($0.3 billion).
- Other payers are projected to see a net spending reduction of $2.6 billion, with a $2.1 billion reduction in state Medicaid spending and a $0.6 billion reduction in spending by other supplemental insurers, offset somewhat by a $0.2 billion increase in employer spending.
Medicare spending. Medicare is expected to achieve estimated net savings of $3.0 billion under the basic benefit redesign option compared to current law, even with an increase in Medicare spending for some higher-cost services due to the new cost-sharing limit, including for inpatient and SNF services (Table 4).
| Table 4: Change in Expected Annual Medicare Benefit Payments Under Four Medicare Benefit Design Options if Fully Implemented in 2018 | ||||
| Spending effects, by type of service (in billions) | Option 1 Basic benefit redesign option |
Option 2 Lower deductible/cost-sharing limit option |
Option 3 Low-income subsidies option |
Option 4 Income-related option |
| Inpatient hospital | $2.3 | $4.2 | $2.8 | $3.5 |
| Outpatient | $0.8 | $4.5 | $1.7 | $2.6 |
| Physician | -$6.3 | -$0.6 | -$4.2 | -$3.4 |
| Skilled nursing facility | $2.6 | $4.6 | $2.9 | $3.4 |
| Home health (Part A) | -$0.5 | -$0.4 | -$0.5 | -$0.4 |
| Home health (Part B) | -$0.9 | -$0.7 | -$0.8 | -$0.7 |
| NOTE: Estimates do not sum to net change in Medicare spending for each option, as shown in Table 2, because they exclude aggregate spending changes for Medicare Advantage and Part B premiums. SOURCE: Kaiser Family Foundation/Actuarial Research Corporation, June 2016. |
||||
The net reduction in Medicare spending under the basic benefit redesign option is due to several factors.
- First, the single deductible for services covered under Parts A and B would mean a higher deductible than under current law for the majority of traditional Medicare beneficiaries who do not use Part A inpatient services; this change would shift costs from Medicare to beneficiaries.
- Second, the higher deductible (relative to the current-law Part B deductible) is expected to reduce beneficiaries’ utilization of Part B physician and other outpatient services and would thereby reduce Medicare spending for these services.
- Third, the new copayment on home health services under the basic benefit redesign option is expected to reduce utilization and spending for these services.
- Fourth, the restriction on Medigap coverage of the deductible would expose Medigap policyholders to a portion of their upfront costs for Medicare-covered services, which would in turn reduce their use of services and Medicare spending for beneficiaries with Medigap.
Federal and state Medicaid spending. Net Medicaid spending is expected to be lower under the basic benefit redesign option, with an estimated $2.8 billion reduction in federal Medicaid spending and a $2.1 billion reduction in state Medicaid spending in 2018. This reduction is mainly due to the new cost-sharing limit under Medicare, which would shift costs from Medicaid to Medicare for high-cost beneficiaries who are dually eligible for both programs. Lower Part B premiums would also reduce Medicaid costs for beneficiaries who are dually eligible for Medicare and Medicaid, because Medicaid currently pays Part B premiums for this group (along with Medicare cost-sharing requirements for many, but not all, dually eligible beneficiaries).
Employer spending. Costs to employers would increase by an estimated $0.2 billion in 2018 under Option 1. This would occur because employers would cover a portion of the new cost-sharing requirements, such as the higher Medicare deductible for beneficiaries without a hospitalization, on behalf of those with retiree coverage.
How would alternative benefit design options affect spending by beneficiaries and by medicare, medicaid, and other payers?
We evaluated the effects of three alternatives to the modified benefit design and Medigap coverage restrictions in Option 1:
- Option 2, the lower deductible and cost-sharing limit option, is similar to the basic benefit redesign option, but with a lower deductible and cost-sharing limit to reduce the share of beneficiaries facing spending increases and to increase the share of beneficiaries with a spending reduction, relative to Option 1.
- Option 3, the low-income subsidies option, has the same features as the basic benefit redesign option, and also provides full Medicare cost-sharing subsidies to a subset of low-income beneficiaries to reduce the spending burden associated with the modified benefit design for these beneficiaries.
- Option 4, the income-related option, is similar to the basic benefit redesign option, but modifies the deductible and cost-sharing limit based on income, with lower amounts for people with lower incomes and higher amounts for those with higher incomes, to increase the progressivity of the modified benefit design.
The following discussion compares how the effects on beneficiaries and spending by payer under Option 1, are expected to change under the alternative options described above, assuming full implementation in 2018.
Option 2: Lowering the deductible and cost-sharing limit for services covered under Medicare parts a and b
Expected effects on out-of-pocket spending. Compared to the basic benefit redesign option, lowering the deductible and cost-sharing limit to $400 and $4,000, respectively, for all traditional Medicare beneficiaries (Option 2) would reduce the share of beneficiaries facing a spending increase (from 35 percent to 25 percent) and increase average savings among those facing a spending reduction (from -$290 to -$440) (Figure 6).
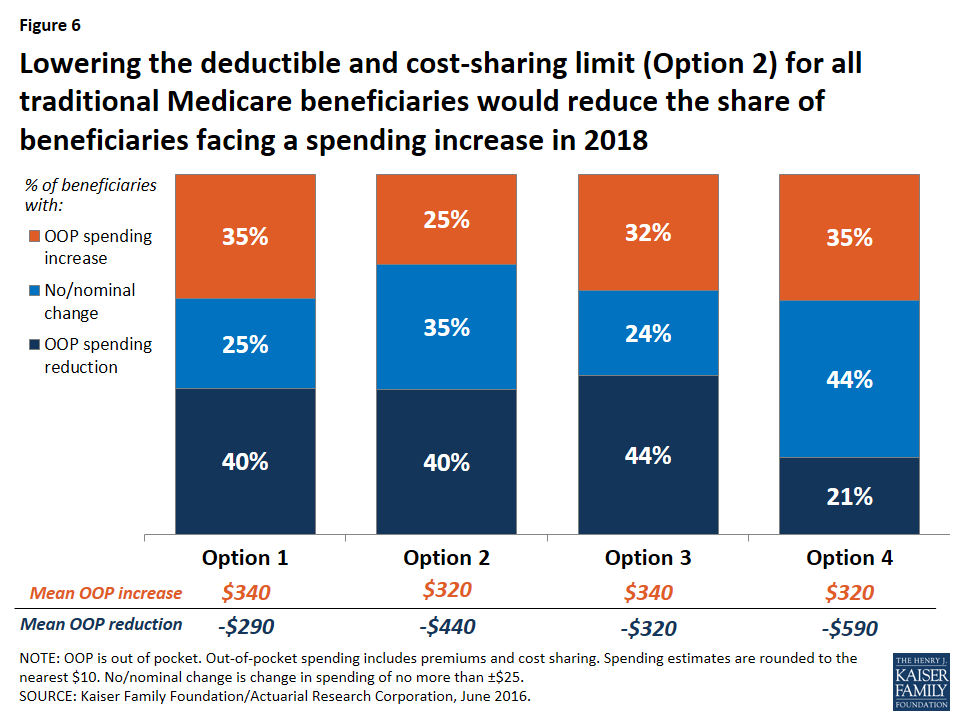
Figure 6: Lowering the deductible and cost-sharing limit (Option 2) for all traditional Medicare beneficiaries would reduce the share of beneficiaries facing a spending increase in 2018
Modifying the basic benefit redesign by lowering the deductible and cost-sharing limit would be particularly likely to benefit sicker beneficiaries, who would be more likely to reach the cost-sharing limit than other beneficiaries. For example, among those with both a hospital and SNF stay, the lower deductible and cost-sharing limit option would reduce the share who are expected to face an increase in their out-of-pocket costs by twenty percentage points (from 35 percent to 15 percent) and increase the share who are expected to see a reduction in their out-of-pocket costs by the same amount (from 52 percent to 72 percent), relative to the basic benefit redesign option (Figure 7).
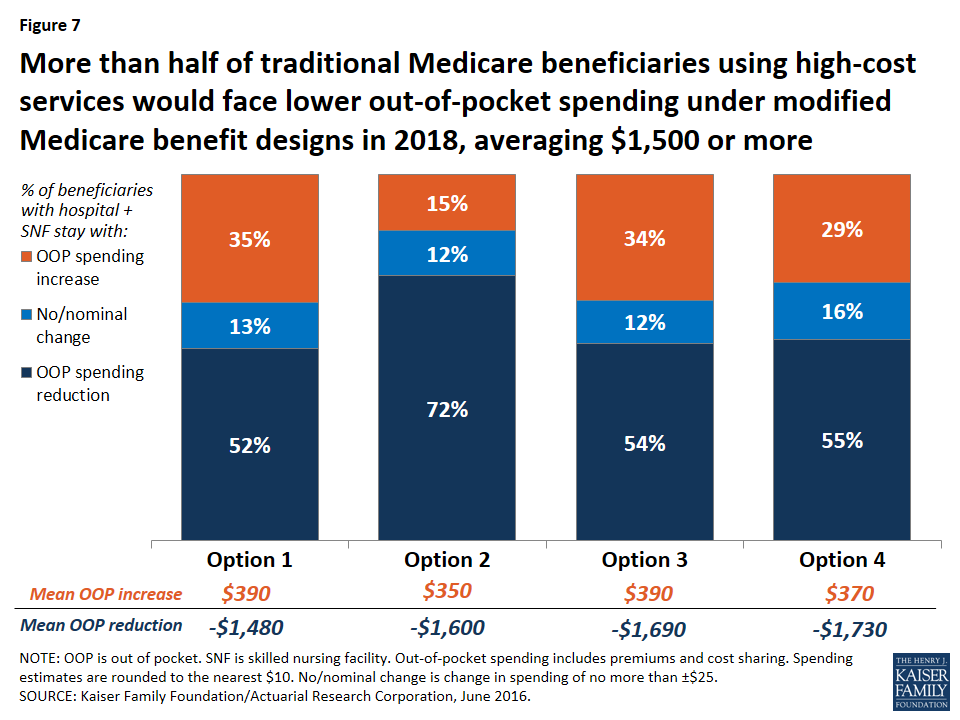
Figure 7: More than half of traditional Medicare beneficiaries using high-cost services would face lower out-of-pocket spending under modified Medicare benefit designs in 2018, averaging $1,500 or more
Expected effects on aggregate beneficiary spending. In terms of the aggregate effects on beneficiaries, savings are largest under Option 2 (-$3.8 billion), with its lower deductible and cost-sharing limit, compared to all other options. Net savings to beneficiaries under Option 2 is comprised of a $1.1 billion increase in spending on cost sharing offset by a $4.8 billion reduction in premium spending. On the one hand, the Part B premium would increase under the lower deductible and cost-sharing limit option, versus a decrease under the basic benefit redesign option (see Table 3 above). This is because with a lower deductible under Option 2, beneficiaries are expected to use more services than they would under the basic benefit redesign option, and Medicare would pay for a higher proportion of it, which would lead to higher Part B spending and, therefore, higher Part B premiums. In contrast, Medigap and employer premiums would be lower under Option 2 than under the basic benefit redesign option. This is because the lower deductible and cost-sharing limit would reduce the liability of supplemental insurers, which would be expected to result in lower premiums. These decreases would offset the more modest increase in Part B premiums, resulting in an aggregate reduction in premium spending by beneficiaries under the lower deductible and cost-sharing limit option.
Expected effects on aggregate spending by other payers. Lowering the deductible and cost-sharing limit would produce the largest aggregate savings to beneficiaries of the four options considered in this report, but it would also more than offset any federal savings from the basic benefit redesign option, resulting in an increase in federal spending of $8.8 billion (Figure 8). Net total health care savings would also be lower under the lower deductible and cost-sharing limit option (Option 2) than under the basic benefit redesign option (Option 1) (-$1.5 billion instead of -$8.8 billion), largely as a result of an expected increase in service use by beneficiaries and higher Medicare spending above the annual cost-sharing limit (see Table 2 above).
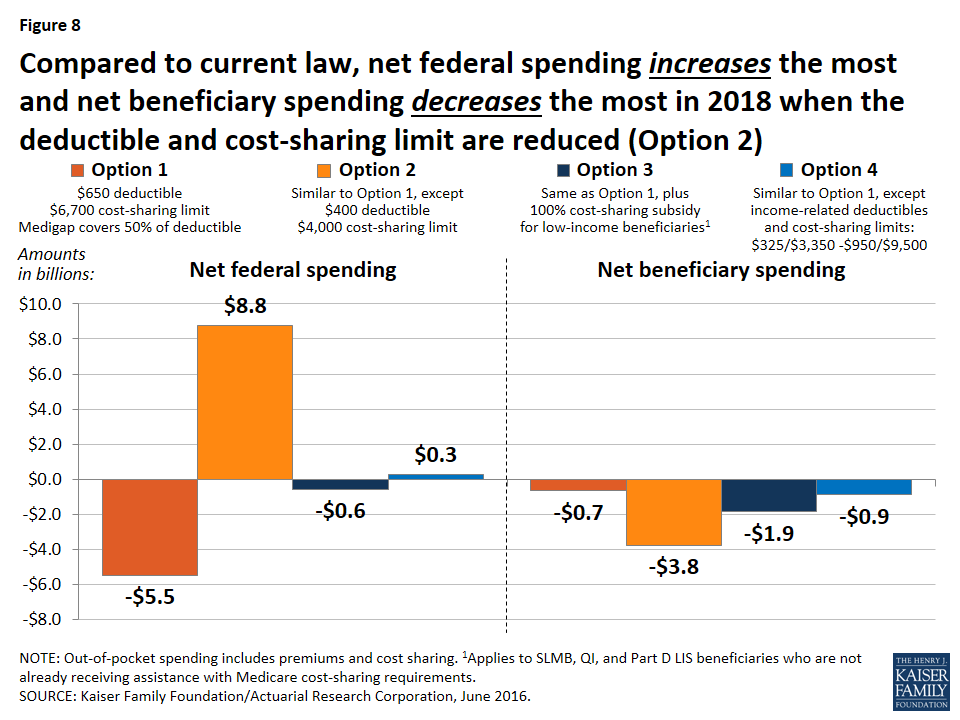
Figure 8: Compared to current law, net federal spending increases the most and net beneficiary spending decreases the most in 2018 when the deductible and cost-sharing limit are reduced (Option 2)
Option 3: Fully-subsidized Medicare cost sharing for certain low-income beneficiaries
Expected effects on out-of-pocket spending. Relative to the basic benefit redesign option, the low-income subsidies option (Option 3) compares favorably for lower-income beneficiaries in traditional Medicare, especially those with incomes between 100-150 percent of poverty. For this group of near-poor beneficiaries, providing a full subsidy for Medicare’s cost-sharing requirements would decrease the share expected to face a spending increase by 13 percentage points (from 36 percent under the basic benefit redesign option to 23 percent under the low-income subsidies option) and increase the share expected to face a reduction in spending by 15 percentage points (from 25 percent under the basic benefit redesign option to 40 percent under the low-income subsidies option) (Figure 9). The average out-of-pocket spending increase for beneficiaries in this group (among those facing an increase) would also be lower under the low-income subsidies option than under the basic benefit redesign option ($360 versus $430), and the average out-of-pocket spending reduction (among those facing a reduction) would be higher (-$690 versus -$500).
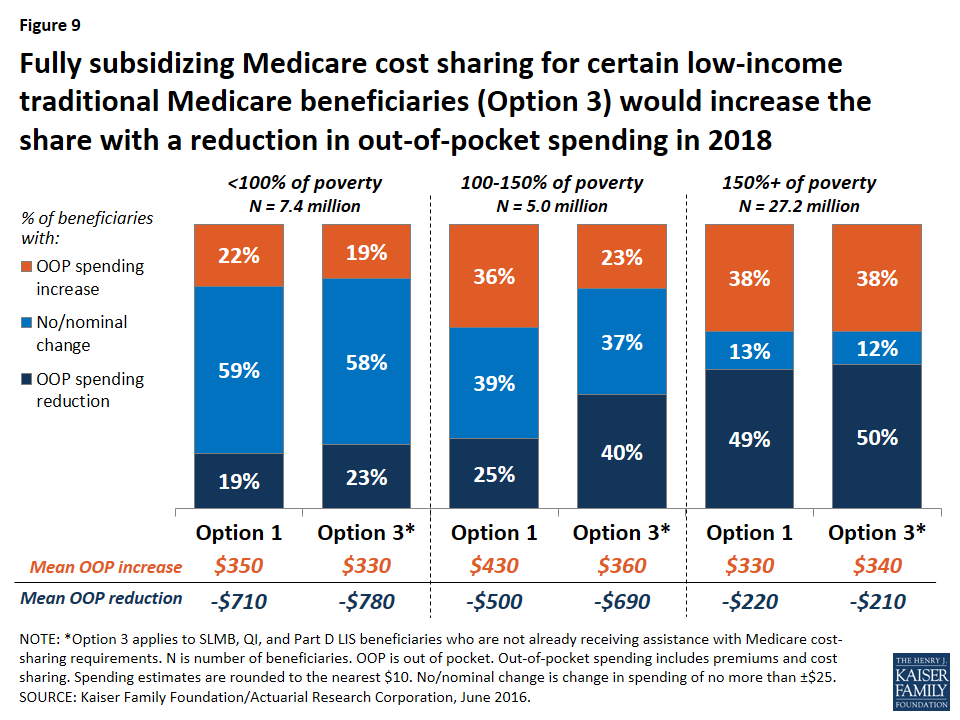
Figure 9: Fully subsidizing Medicare cost sharing for certain low-income traditional Medicare beneficiaries (Option 3) would increase the share with a reduction in out-of-pocket spending in 2018
Although “near poor” beneficiaries are the intended target group for the low-income subsidies option—specifically, beneficiaries enrolled in SLMB, QI, and Part D LIS, the vast majority of whom have incomes below 150 percent of poverty and limited assets—the analysis still shows that some low-income beneficiaries are expected to see higher costs under Option 3. This is because, as modeled, the option does not provide cost-sharing subsidies to all beneficiaries with incomes below 150 percent of poverty, such as those who are eligible for but not receiving SLMB, QI, or LIS, and those who are eligible for these programs based on their incomes but whose assets are too high to qualify. The model also assumes no woodwork effect and does not account for a potential increase in enrollment in SLMB, QI, or LIS from beneficiaries who are eligible but not currently enrolled. Providing full Medicare cost-sharing subsidies to more low-income beneficiaries would reduce the share of beneficiaries facing higher costs under this option, though it would also increase federal spending relative to the effects we observed (see the discussion of spending effects below).
Option 3, the low-income subsidies option, would lead to more modest improvements for those below 100 percent of poverty, because many (although not all) of these beneficiaries already receive assistance with Medicare’s cost-sharing requirements through Medicaid or Medicare Savings Programs. Not surprisingly, providing additional cost-sharing assistance to low-income beneficiaries would not substantially affect out-of-pocket spending changes among beneficiaries with incomes above 150 percent of poverty, relative to the basic benefit redesign option, because eligibility for SLMB, QI, and Part D LIS generally extends only to beneficiaries with incomes up to 150 percent of poverty.
Expected effects on aggregate spending. Adding low-income protections to the modified benefit design would increase aggregate beneficiary savings (from -$0.7 billion under the basic benefit redesign option to -$1.9 billion under the low-income subsidies option) but generate lower net federal savings (-$0.6 billion under the low-income subsidies option versus -$5.5 billion under the basic benefit redesign option) (see Table 2 above). In contrast to the basic benefit redesign option, total Medicare spending would increase under the low-income subsidies option (from a -$3.0 billion reduction under Option 1 to a $1.8 billion increase under Option 3)—and it would have increased by an even larger amount had we modeled the participation of a larger group of low-income beneficiaries beyond those receiving SLMB, QI, or Part D LIS.3 However, as modeled, it would still be the case that federal Medicaid spending would decrease under Option 3, more than offsetting the increase in aggregate Medicare spending. And with lower-income beneficiaries expected to use more services due to the new cost-sharing subsidies, net health care savings would be lower under the low-income subsidies option compared to the basic benefit redesign option (-$5.9 billion versus -$8.8 billion).
Option 4: Income-related deductible and cost-sharing limit
Expected effects on out-of-pocket spending. Compared to the basic benefit redesign option, Option 4, with income-related deductibles and cost-sharing limits, would decrease the share of traditional beneficiaries overall who are expected to face a spending reduction by nearly 20 percentage points (from 40 percent under the basic benefit redesign option to 21 percent under the income-related option) and increase the share expected to face no or a nominal change in spending by the same amount (from 25 percent to 44 percent), while having no effect on the share expected to face a spending increase (see Figure 6 above).
The effects of the income-related benefit design option would vary by income group, as designed. Option 4 would help a larger number of low-income beneficiaries than Option 3, the low-income subsidies option, because, as modeled, the lowest levels of the deductible and cost-sharing limit ($325/$3,350) under Option 4 would apply to all traditional Medicare beneficiaries with incomes less than 150 percent of poverty, regardless of assets or supplemental coverage status, as opposed to just a subset of low-income beneficiaries who would receive subsidies under Option 3. But those low-income beneficiaries who receive full Medicare cost-sharing subsidies under Option 3 would not benefit as much from the income-related benefit design (Option 4), since they would still face some cost-sharing responsibility under the income-related option.
Lower-income beneficiaries would be helped somewhat more under the income-related option than under the basic benefit redesign option (Table 5). This is due to the lower deductible and cost-sharing limit they would face relative to higher-income beneficiaries under the income-related option. In particular, a somewhat smaller share of beneficiaries with incomes below 100 percent of poverty and between 100-150 percent of poverty are expected to see an increase in out-of-pocket spending under the income-related option than under the basic benefit redesign option (18 percent versus 22 percent, and 30 percent versus 36 percent, for the two income groups respectively). But for beneficiaries with incomes between 100-150 percent of poverty, an even smaller share (23 percent) would face a spending increase under the low-income subsidies option (Option 3).
A smaller share of beneficiaries with incomes below 150 percent of poverty are expected to see a spending reduction under the income-related option compared to the basic benefit redesign option (although the average spending reduction would be larger), while a larger share of low-income beneficiaries would face no or a nominal change in spending. The reason for this is that the Part B premium would not fall as much under the income-related option than under the basic benefit redesign option (-$20 versus -$50) because aggregate Part B spending would be larger under the income-related option and premiums are set to cover a portion of total Part B spending. For some low-income beneficiaries, the benefit of having the lower deductible and cost-sharing limit under the income-related option compared to the basic benefit redesign option would more than offset the higher Part B premium. For others, such as those who use relatively few services, the higher Part B premium under the income-related option would be the more relevant factor in determining their change in cost sharing relative to current law.
| Table 5: Distribution of Traditional Medicare Beneficiaries by Poverty Level, by Change in Expected Annual Out-of-Pocket Spending and Average Change in Spending Under Four Medicare Benefit Design Options in 2018 | |||||||
| Percent of beneficiaries by change in OOP spending | % of poverty | Option 1 Basic benefit redesign option |
Option 2 Lower deductible/cost-sharing limit option |
Option 3 Low-income subsidies option |
Option 4 Income-related option |
||
| Reduction | <100% | 19% | 19% | 23% | 16% | ||
| 100-150% | 25% | 31% | 40% | 20% | |||
| 150%+ | 49% | 48% | 50% | 22% | |||
| No/nominal change1 | <100% | 59% | 64% | 58% | 66% | ||
| 100-150% | 39% | 43% | 37% | 50% | |||
| 150%+ | 13% | 26% | 12% | 37% | |||
| Increase (all >$25) | <100% | 22% | 18% | 19% | 18% | ||
| 100-150% | 36% | 26% | 23% | 30% | |||
| 150%+ | 38% | 27% | 38% | 41% | |||
| Average change in OOP spending | |||||||
| Reduction | <100% | -$710 | -$1,010 | -$780 | -$1,220 | ||
| 100-150% | -$500 | -$590 | -$690 | -$840 | |||
| 150%+ | -$220 | -$360 | -$210 | -$420 | |||
| Increase (all >$25) | <100% | $350 | $310 | $330 | $280 | ||
| 100-150% | $430 | $380 | $360 | $320 | |||
| 150%+ | $330 | $320 | $340 | $320 | |||
| NOTE: OOP is out of pocket. Out-of-pocket spending includes premiums and cost sharing. Spending estimates rounded to nearest $10. 1No/nominal change is change in spending of no more than ±$25. SOURCE: Kaiser Family Foundation/Actuarial Research Corporation, June 2016. |
|||||||
Expected effects on aggregate spending. Although aggregate beneficiary spending would be similar under the basic benefit redesign option and the income-related option (-$0.7 billion and -$0.9 billion, respectively), introducing an income-related deductible and cost-sharing limit would erase net federal savings (from a $5.5 billion reduction under the basic benefit redesign option to an increase of $0.3 billion under the income-related option). This is the result of Medicare paying for a much greater share of spending above the new cost-sharing limit for a subset of low-income beneficiaries. While this would help some low-income beneficiaries, it would simply displace Medicaid spending for certain dually eligible beneficiaries (with the reduction in Medicaid spending being divided between the states and the federal government). Finally, because aggregate beneficiary cost sharing would be lower under the income-related option relative to the basic benefit redesign option, it is expected that beneficiaries would use more services under the income-related option. The net effect would be to lower total health care savings (from -$8.8 billion under the basic benefit redesign option to -$6.1 billion under the income-related option), as was also the case under the lower deductible and cost-sharing limit option (Option 2) and the low-income subsidies option (Option 3).