Medicaid’s Role for Medicare Beneficiaries
Issue Brief
| Key Takeaways |
| This brief describes the role that Medicaid plays for 10 million Medicare beneficiaries to help inform upcoming debates about proposals to restructure Medicaid financing in ways that could reduce federal funding.
What is Medicaid’s Role for Medicare Beneficiaries?
Who are the Medicare Beneficiaries Who Receive Medicaid?
How Much Does Medicaid Spend on Medicare Beneficiaries?
|
Medicaid is an important source of coverage for many Medicare beneficiaries. As of 2011, there are 10 million seniors and younger people with disabilities who receive Medicaid in addition to Medicare. They include frail seniors, people with chronic conditions such as diabetes and heart disease, and those with a variety of disabilities, such as dementia, multiple sclerosis, and mental illness.
President Trump and other GOP leaders have called for fundamental changes in Medicaid financing that could limit federal funding through a block grant or per capita cap, which may affect Medicare beneficiaries who receive Medicaid. In exchange for limits on federal funding, states could be offered increased flexibility beyond what is available under current law but may look to cuts to Medicaid eligibility, benefits, and provider reimbursement as a result of federal funding reductions. Medicare beneficiaries who receive Medicaid could be affected by potential cuts, as many of them have higher Medicaid spending relative to other populations due to their more intensive needs. This issue brief describes the role that Medicaid plays for Medicare beneficiaries. Medicaid enrollment and spending for Medicare beneficiaries by state is detailed in the Appendix.
Who are the Medicare Beneficiaries Who Receive Medicaid?
Most Medicare beneficiaries who receive Medicaid are female (60%), over age 65 (61%), and white (56%) (Figure 1). Medicare beneficiaries who receive Medicaid have low incomes and few assets and are typically poorer than other Medicare beneficiaries. Medicare beneficiaries who receive Medicaid have a work history, or for those with childhood onset disabilities (before age 22), qualify for Social Security Disability Insurance (SSDI) and Medicare based on the work history of a retired, deceased, or disabled parent. For examples, see Wanda and Don’s stories below.
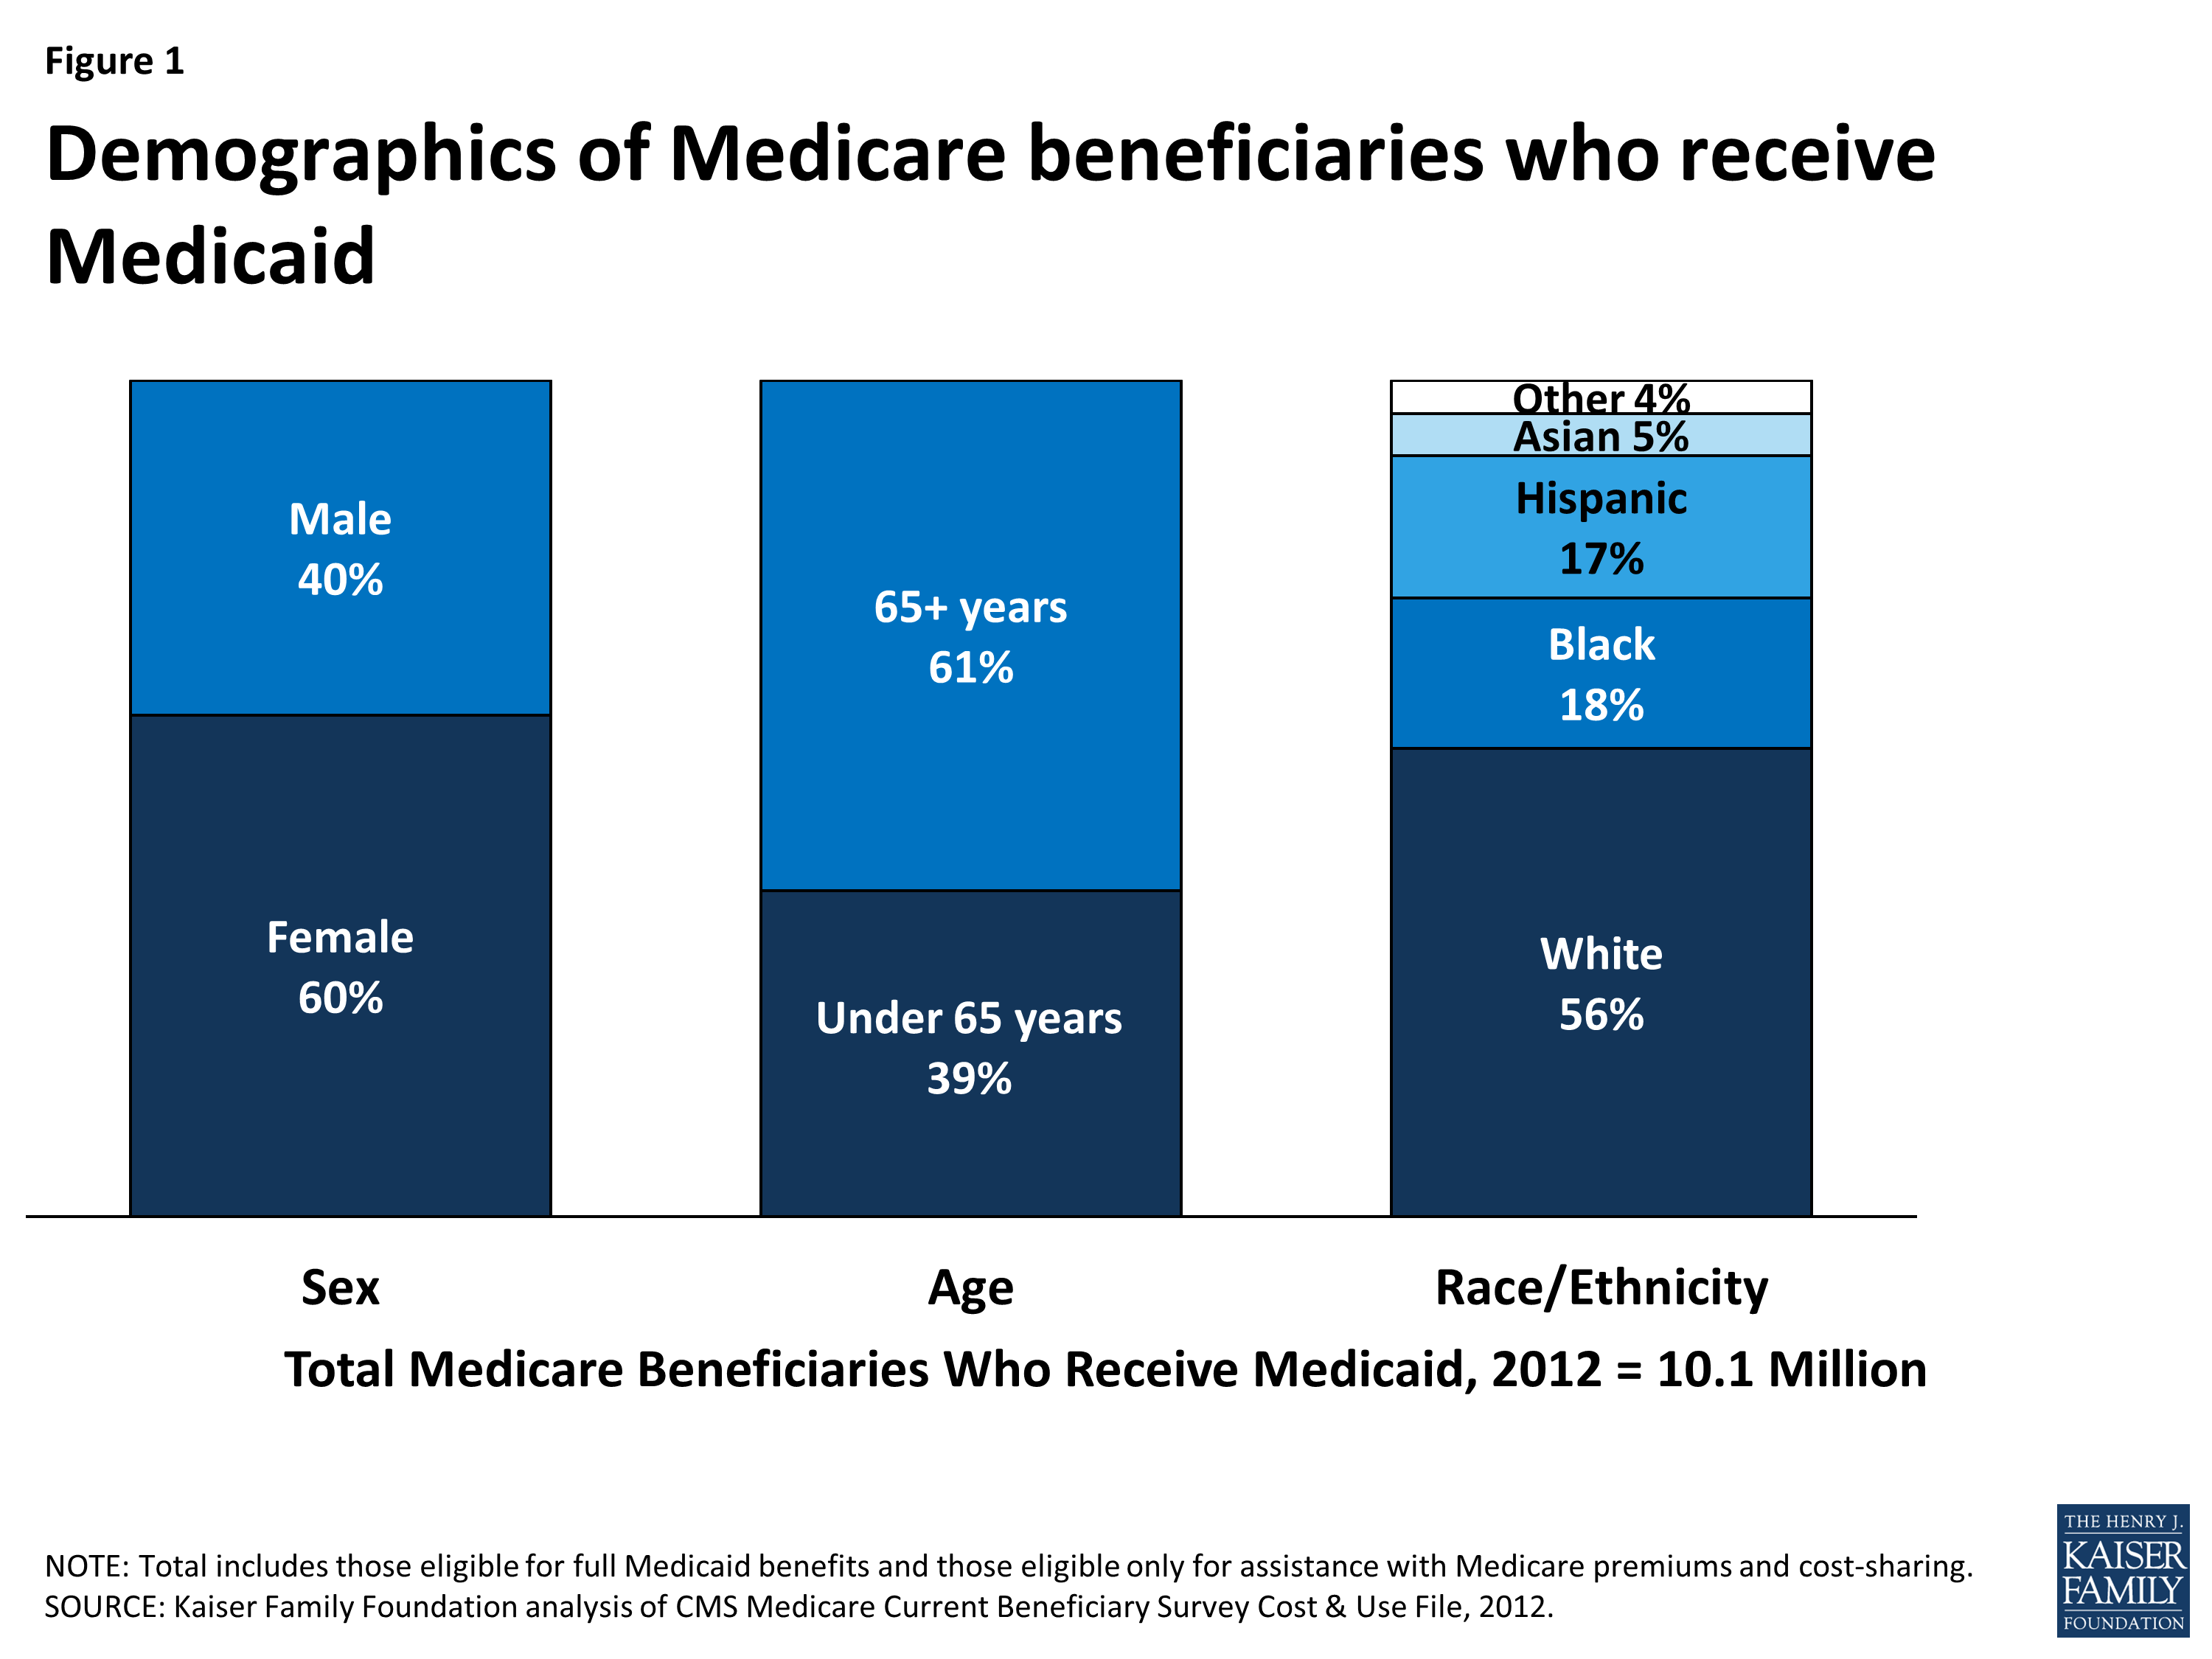
Figure 1: Demographics of Medicare beneficiaries who receive Medicaid
| Wanda, a senior living in Oklahoma | |
| Wanda grew up in the aftermath of the Great Depression and helped run her family’s farm. She worked past age 65, but eventually had to retire when she needed hip replacement surgery. After her surgery, she spent two years in a nursing home but was eager to return to living in the community. With the services she receives from Medicaid, such as an in-home aide and home-delivered groceries, she was able to move into an apartment in a senior living community. Medicaid also provides transportation to her medical appointments and a case manager to help arrange for services and make sense of confusing paperwork. Wanda has degenerative joint disease in her lower back and poor circulation in her legs and takes medication for thyroid and blood pressure issues. Before receiving Medicaid, she did not have regular doctor visits because her Medicare coinsurance was too expensive for her to afford based on her limited income. She now has a regular doctor whom she likes very much. She describes herself as “the life of the party” and is grateful for the supports Medicaid provides that enable her to live in what she describes as a real “community” where people look out for each other. |  |
| Don, age 41, Michigan | |
| Don was born with developmental disabilities and lived in group homes after his mother became too ill to care for him. He wanted more independence, and with the support of his sister who is his legal guardian, he was able to move into his own apartment. He receives SSDI based on his deceased mother’s work history as well as Medicare and Medicaid. Medicaid covers services that Medicare does not, such as dental and in-home caregivers who provide the support he needs to live safely and independently in the community. |  |
Medicare beneficiaries who receive Medicaid tend to have greater medical needs and functional limitations than other Medicare beneficiaries. Nearly three in four Medicare beneficiaries who receive Medicaid have three or more chronic conditions, such as diabetes or heart disease, which can require regular doctor appointments, medication, and/or medical tests. Over 60% of Medicare beneficiaries who receive Medicaid need help with daily self-care activities, such as eating, bathing, or dressing, which are important for independent living. Nearly six in 10 Medicare beneficiaries who receive Medicaid have a cognitive or mental impairment, such as dementia, which can create the need for supports to live safely at home. About half of Medicare beneficiaries who receive Medicaid describe their health as fair or poor, more than double the rate among other Medicare beneficiaries (Figure 2).
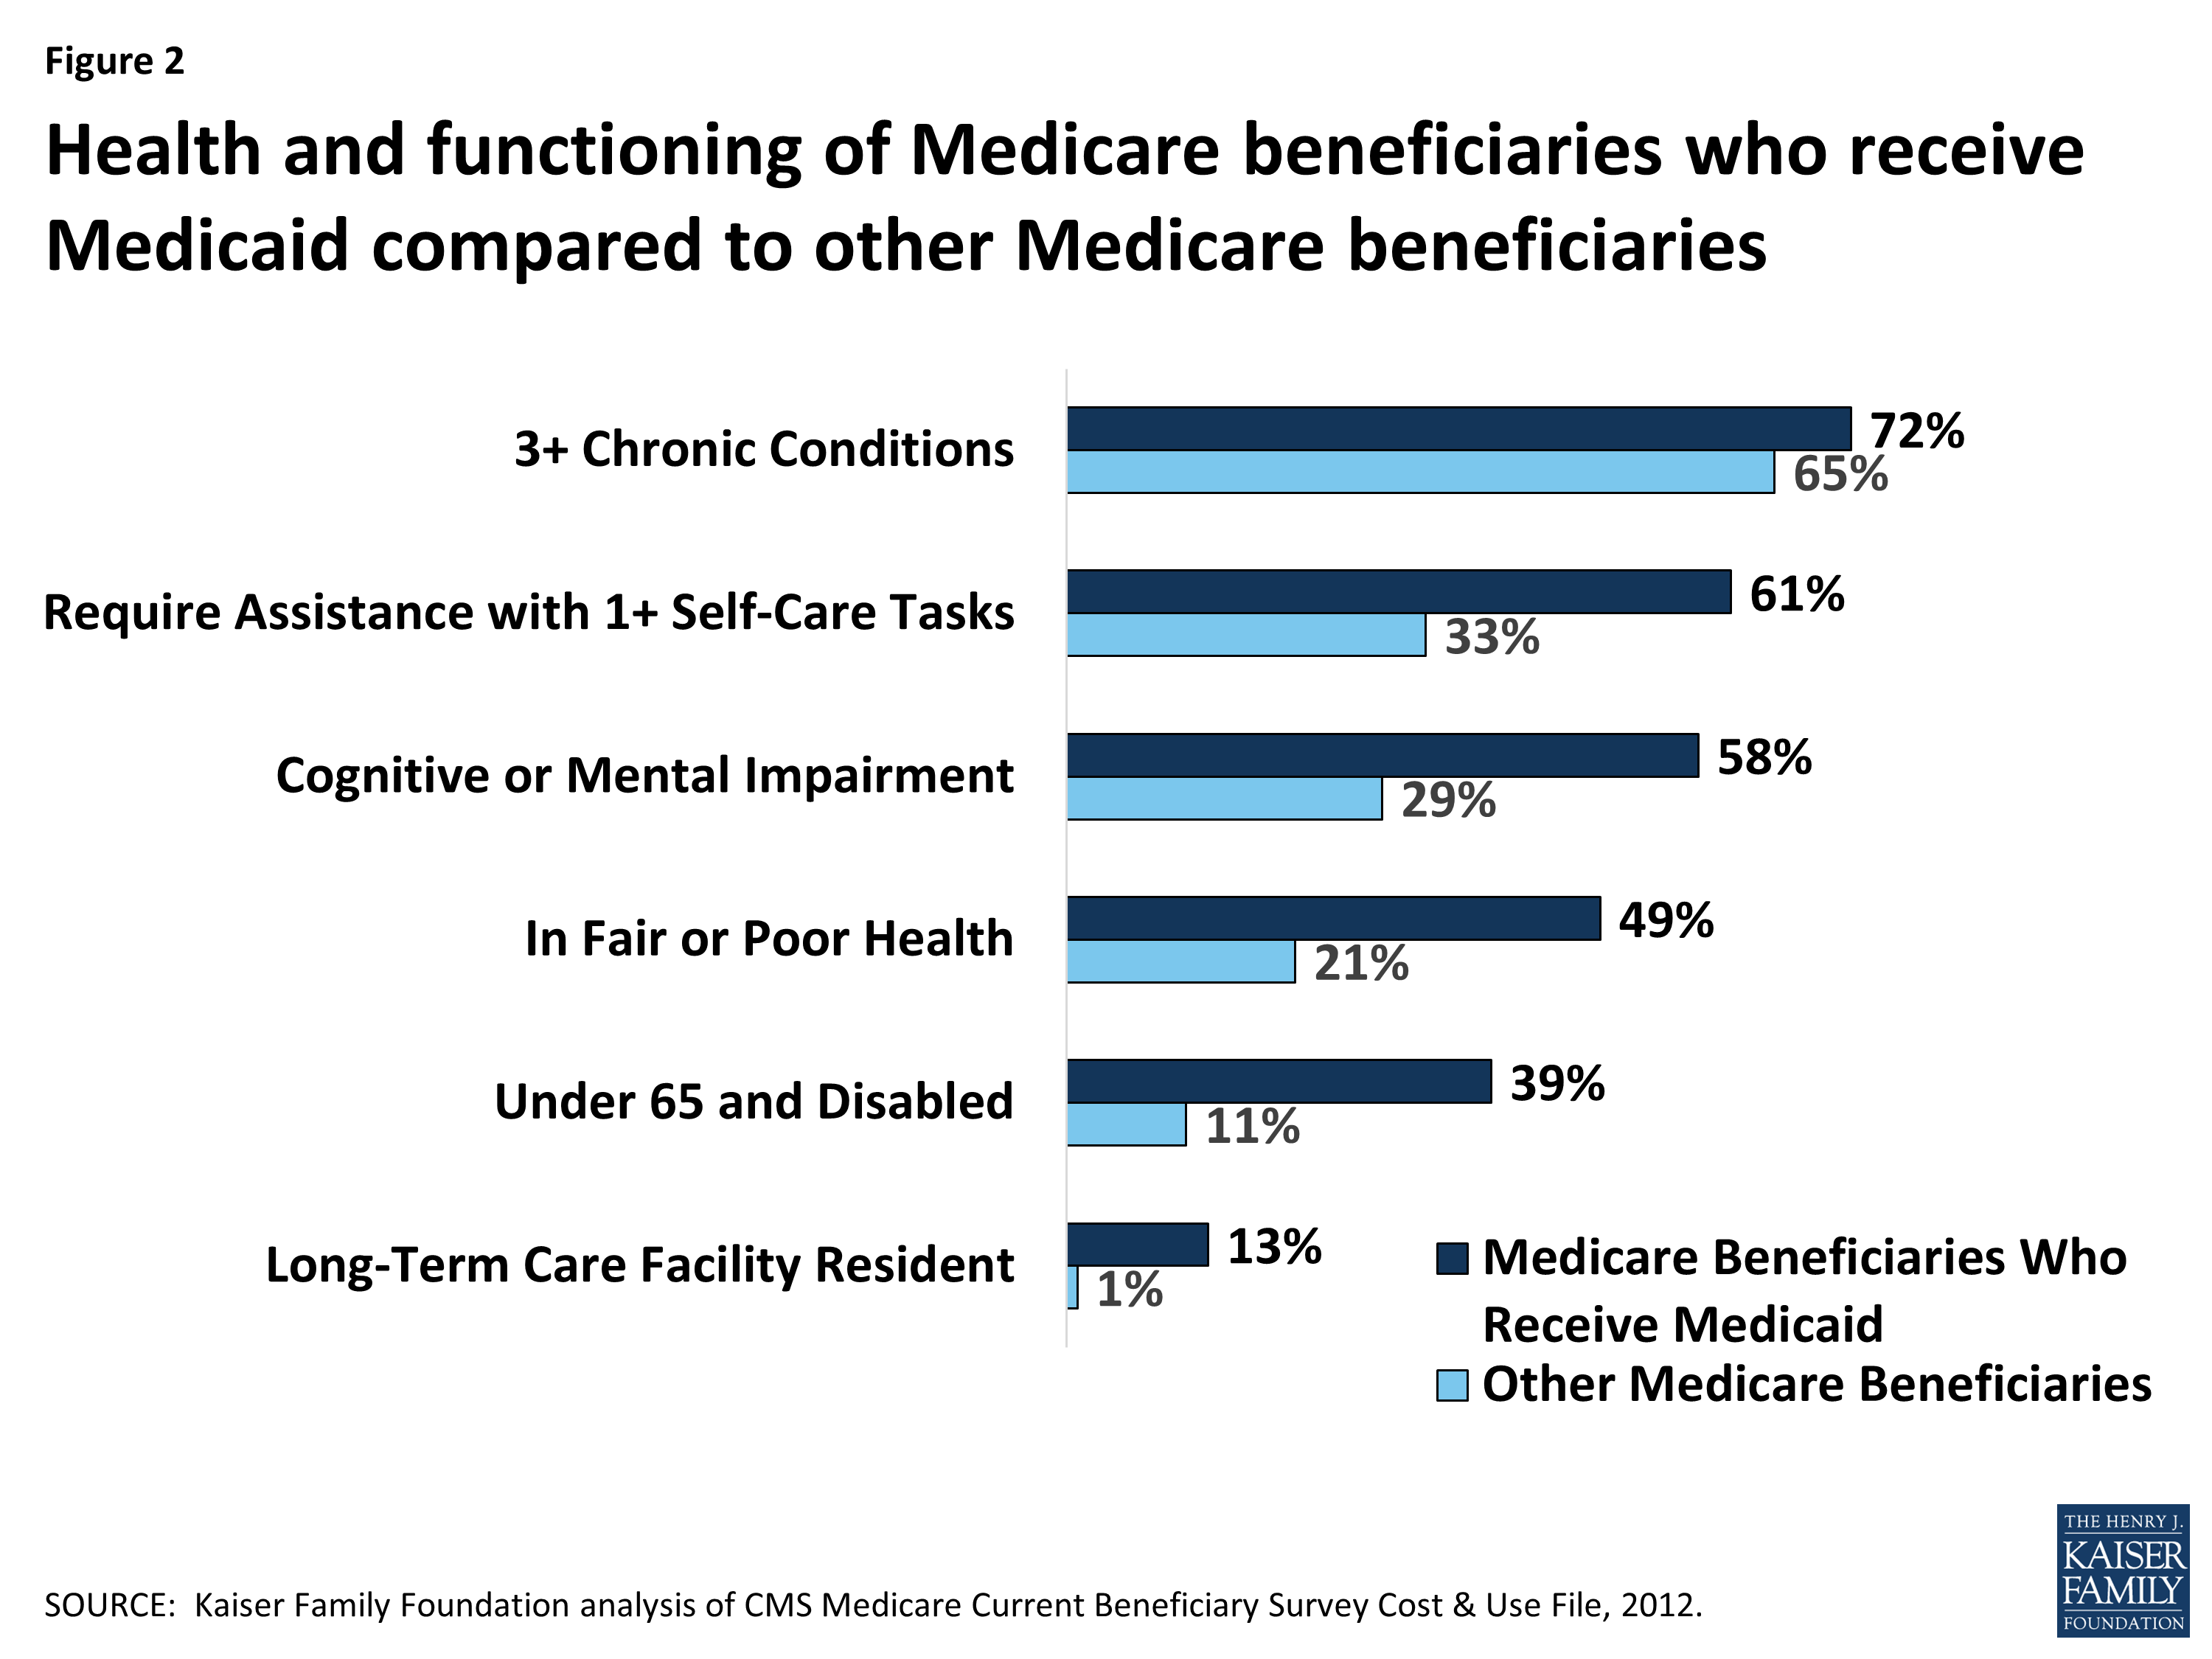
Figure 2: Health and functioning of Medicare beneficiaries who receive Medicaid compared to other Medicare beneficiaries
How Do Medicare Beneficiaries Qualify for Medicaid?
To receive Medicaid benefits, including long-term care, Medicare beneficiaries may qualify for Medicaid through various pathways based on their low-income and age and/or disability. Although there is no Medicaid eligibility pathway dedicated to Medicare beneficiaries, there are several pathways through which they typically qualify. For example, all states generally must provide Medicaid to Supplemental Security Income (SSI) beneficiaries, and states can extend Medicaid eligibility for other seniors and people with disabilities up to 100% of the federal poverty level (FPL, $12,060 for an individual in 2017) (Figure 3). In addition, states can expand financial eligibility for people who need long-term care services, in nursing homes and/or in the community, up to three times the SSI benefit rate (equivalent to 219% FPL or $26,460/year for an individual in 2017). These pathways also generally have asset limits set by the state, which typically are at the SSI level of $2,000.
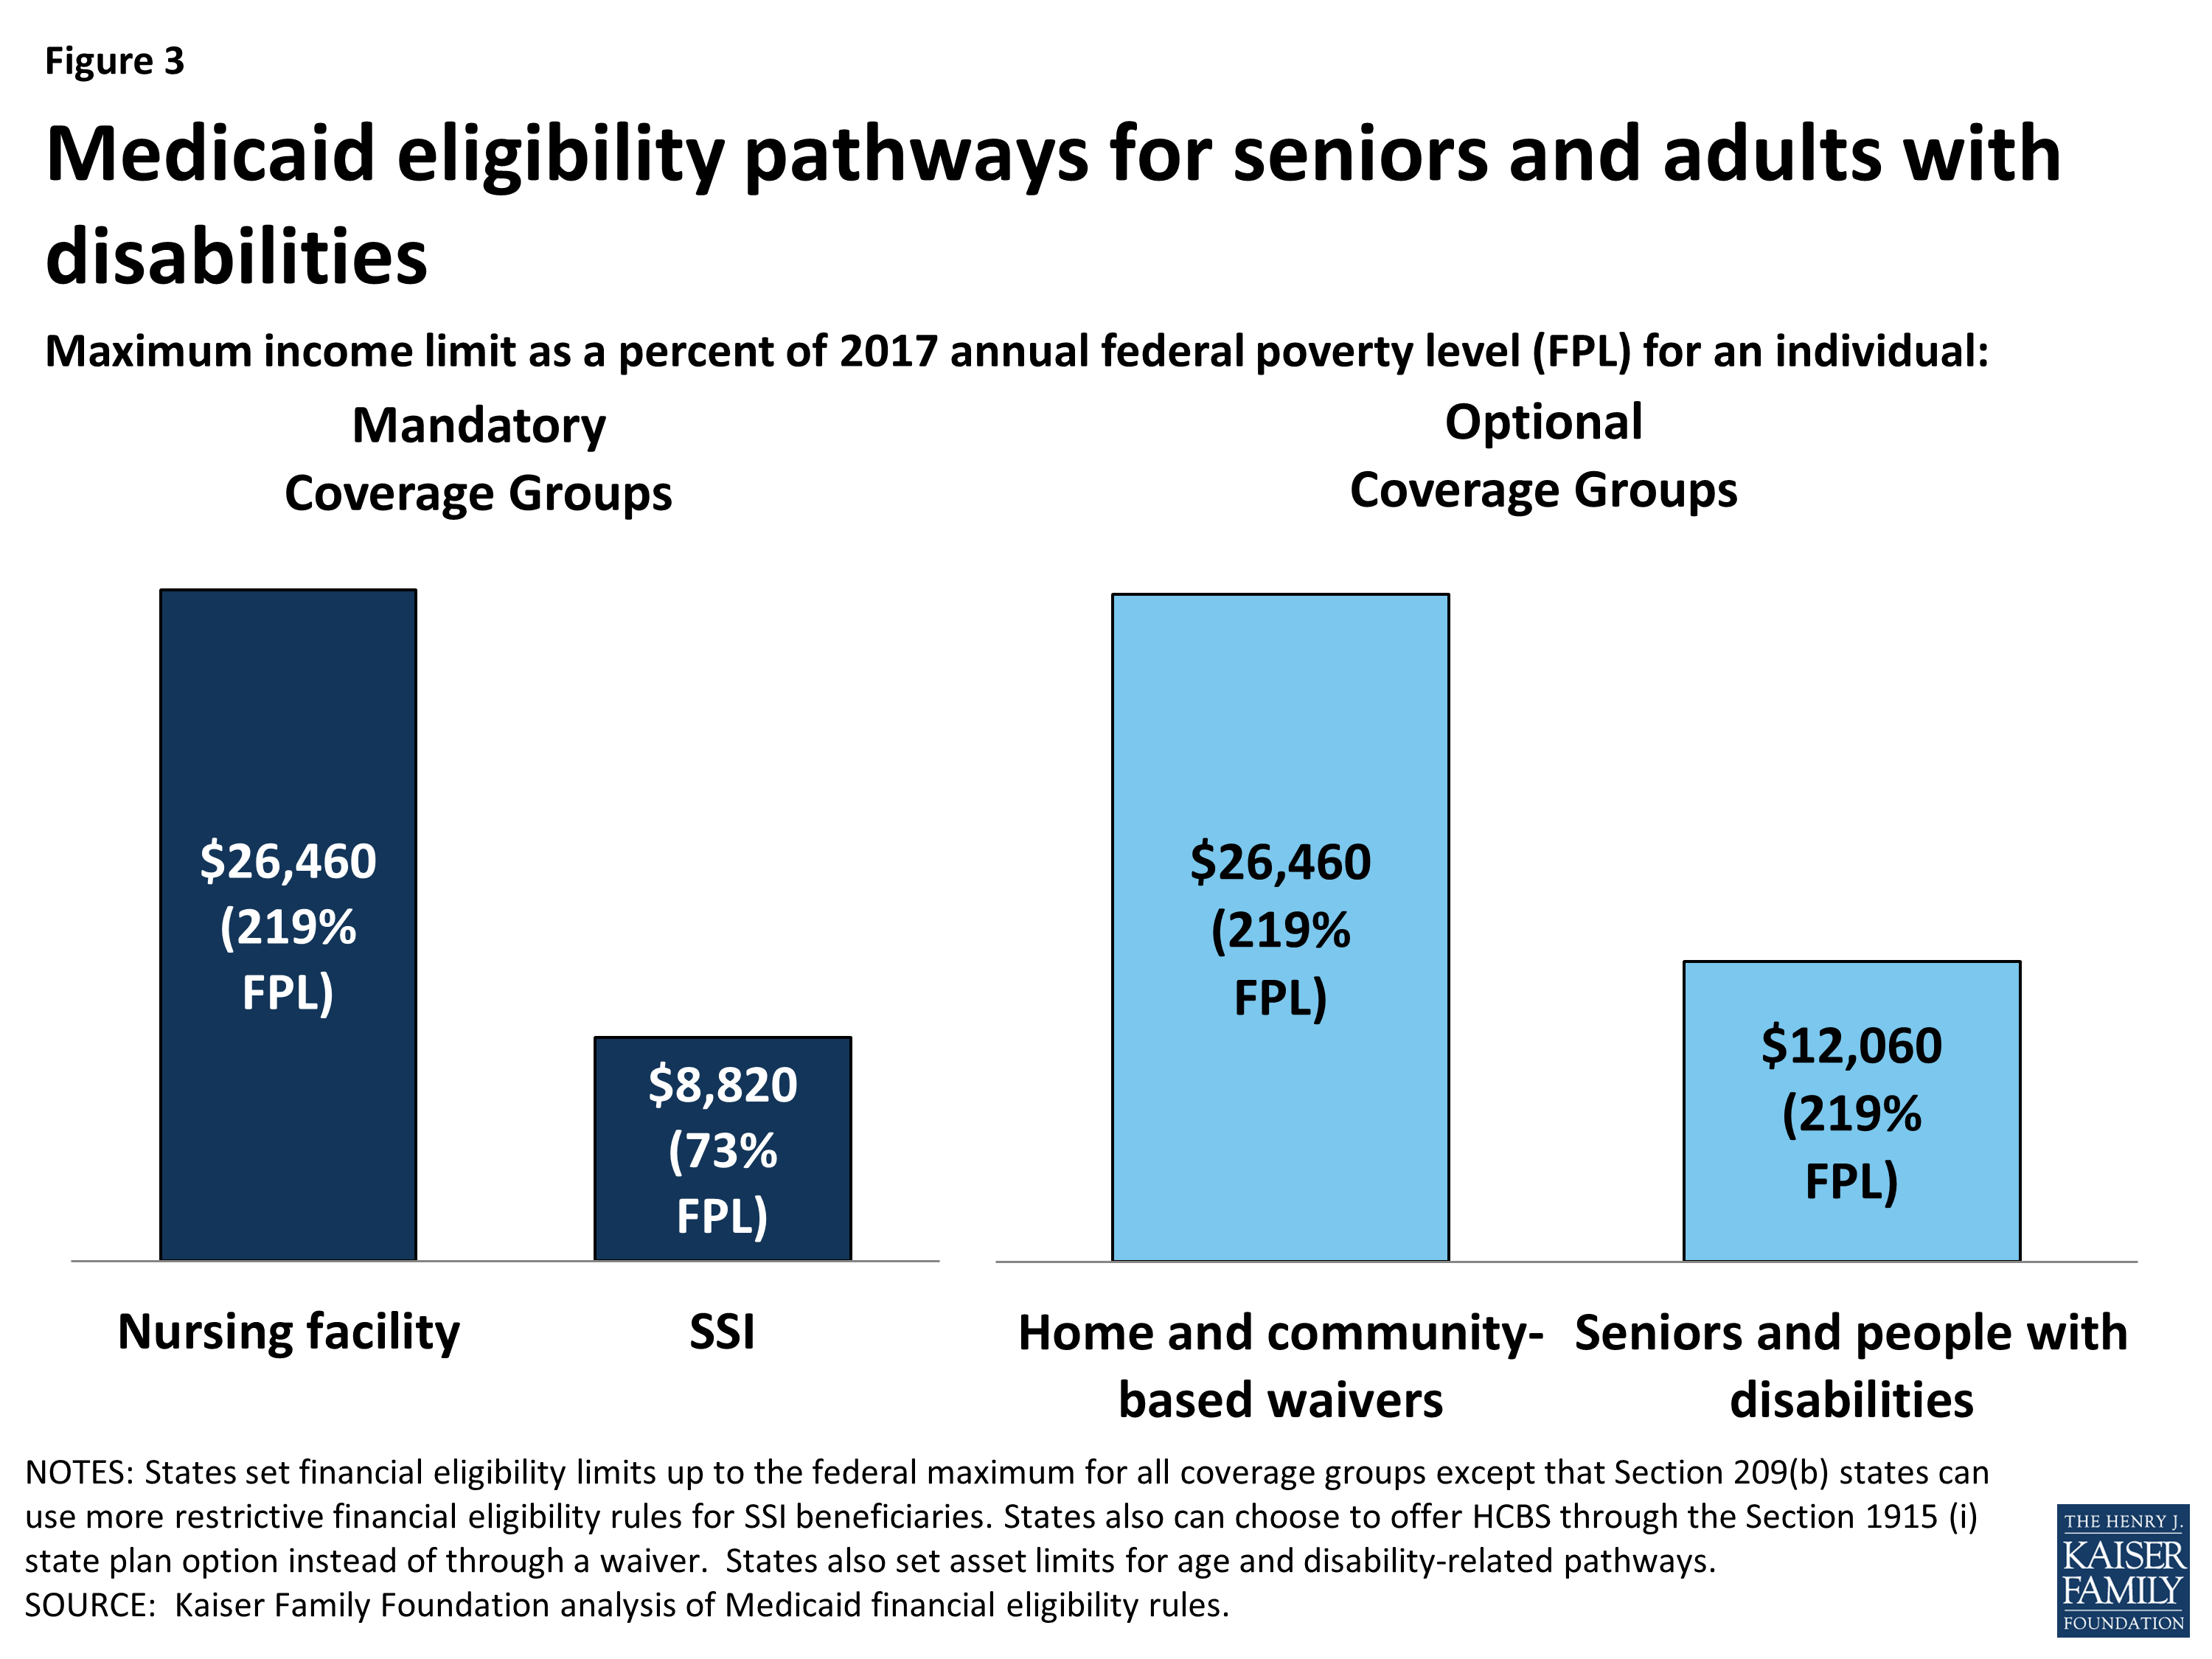
Figure 3: Medicaid eligibility pathways for seniors and adults with disabilities
Medicare beneficiaries who do not qualify for full Medicaid benefits may be eligible for Medicaid’s help with their financial obligations under Medicare. Through the Medicare Savings Programs, Medicaid covers Medicare premiums and/or cost-sharing for certain low-income Medicare beneficiaries. Specifically, Medicaid pays both Medicare premiums and cost-sharing for Qualified Medicare Beneficiaries (up to 100% FPL) and Medicare premiums for Specified Low-Income Medicare Beneficiaries (100-120% FPL, $12,060-$14,472/year for an individual in 2017) and Qualified Individuals (up to 135% FPL, $16,281/year for an individual in 2017). States also set asset limits for the Medicare Savings Programs, which are typically $7,280, although a few states have higher or no asset limits for their Medicare Savings Programs.
What Does Medicaid Provide for Medicare Beneficiaries?
Most Medicare beneficiaries who receive Medicaid (75%, or 7 million, in 2011) receive both full Medicaid benefits, including long-term care, and help with Medicare’s out-of-pocket costs. Medicare is their primary source of coverage for hospital and physician care, and Medicaid fills in gaps by covering services that Medicare does not, such as long-term care in the community and nursing homes. Long-term cares services are expensive, generally exceeding what people are able to afford out-of-pocket, and are the major benefit that Medicaid provides for these beneficiaries. State Medicaid programs also may cover other services that Medicare does not, such as vision, dental, or hearing, for adult Medicaid beneficiaries. In addition, Medicaid wraps around Medicare to cover Medicare’s out-of-pocket costs, such as premiums, deductibles, and co-payments, for acute care services, which can be high for people with low incomes.
Some Medicare beneficiaries do not qualify for full Medicaid benefits but receive Medicaid help with their Medicare premiums and cost-sharing. This group makes up the remaining 25% of the Medicare beneficiaries who receive Medicaid. Medicare’s out-of-pocket costs can be difficult to afford for people with low incomes. For example, in 2017, Medicare requires beneficiaries to pay a $1,316 deductible for inpatient hospital stays. Medicare beneficiaries also are responsible for 20% of Medicare-covered outpatient services after meeting a $183 deductible. In addition, the monthly premium for Medicare outpatient coverage is $134 per month in 2017, which alone is over 10% of monthly income for an individual at 100% FPL.
How Much Does Medicaid Spend on Medicare Beneficiaries?
As of 2011, Medicaid spent $147 billion on Medicare beneficiaries, with 62% of this spending devoted to long-term care services (Figure 4). Most long-term care spending for Medicare beneficiaries who receive Medicaid goes to institutions like nursing homes, with the remainder funding supports in the community. About one-quarter of Medicaid spending on Medicare beneficiaries went to acute care services. These include those for which Medicare is the primary payer, such as hospital, physician, lab, and x-ray services, and those that Medicaid covers but Medicare does not, such as vision, dental, and hearing services. Less than 10% of Medicaid spending for Medicare beneficiaries funded Medicare premiums.
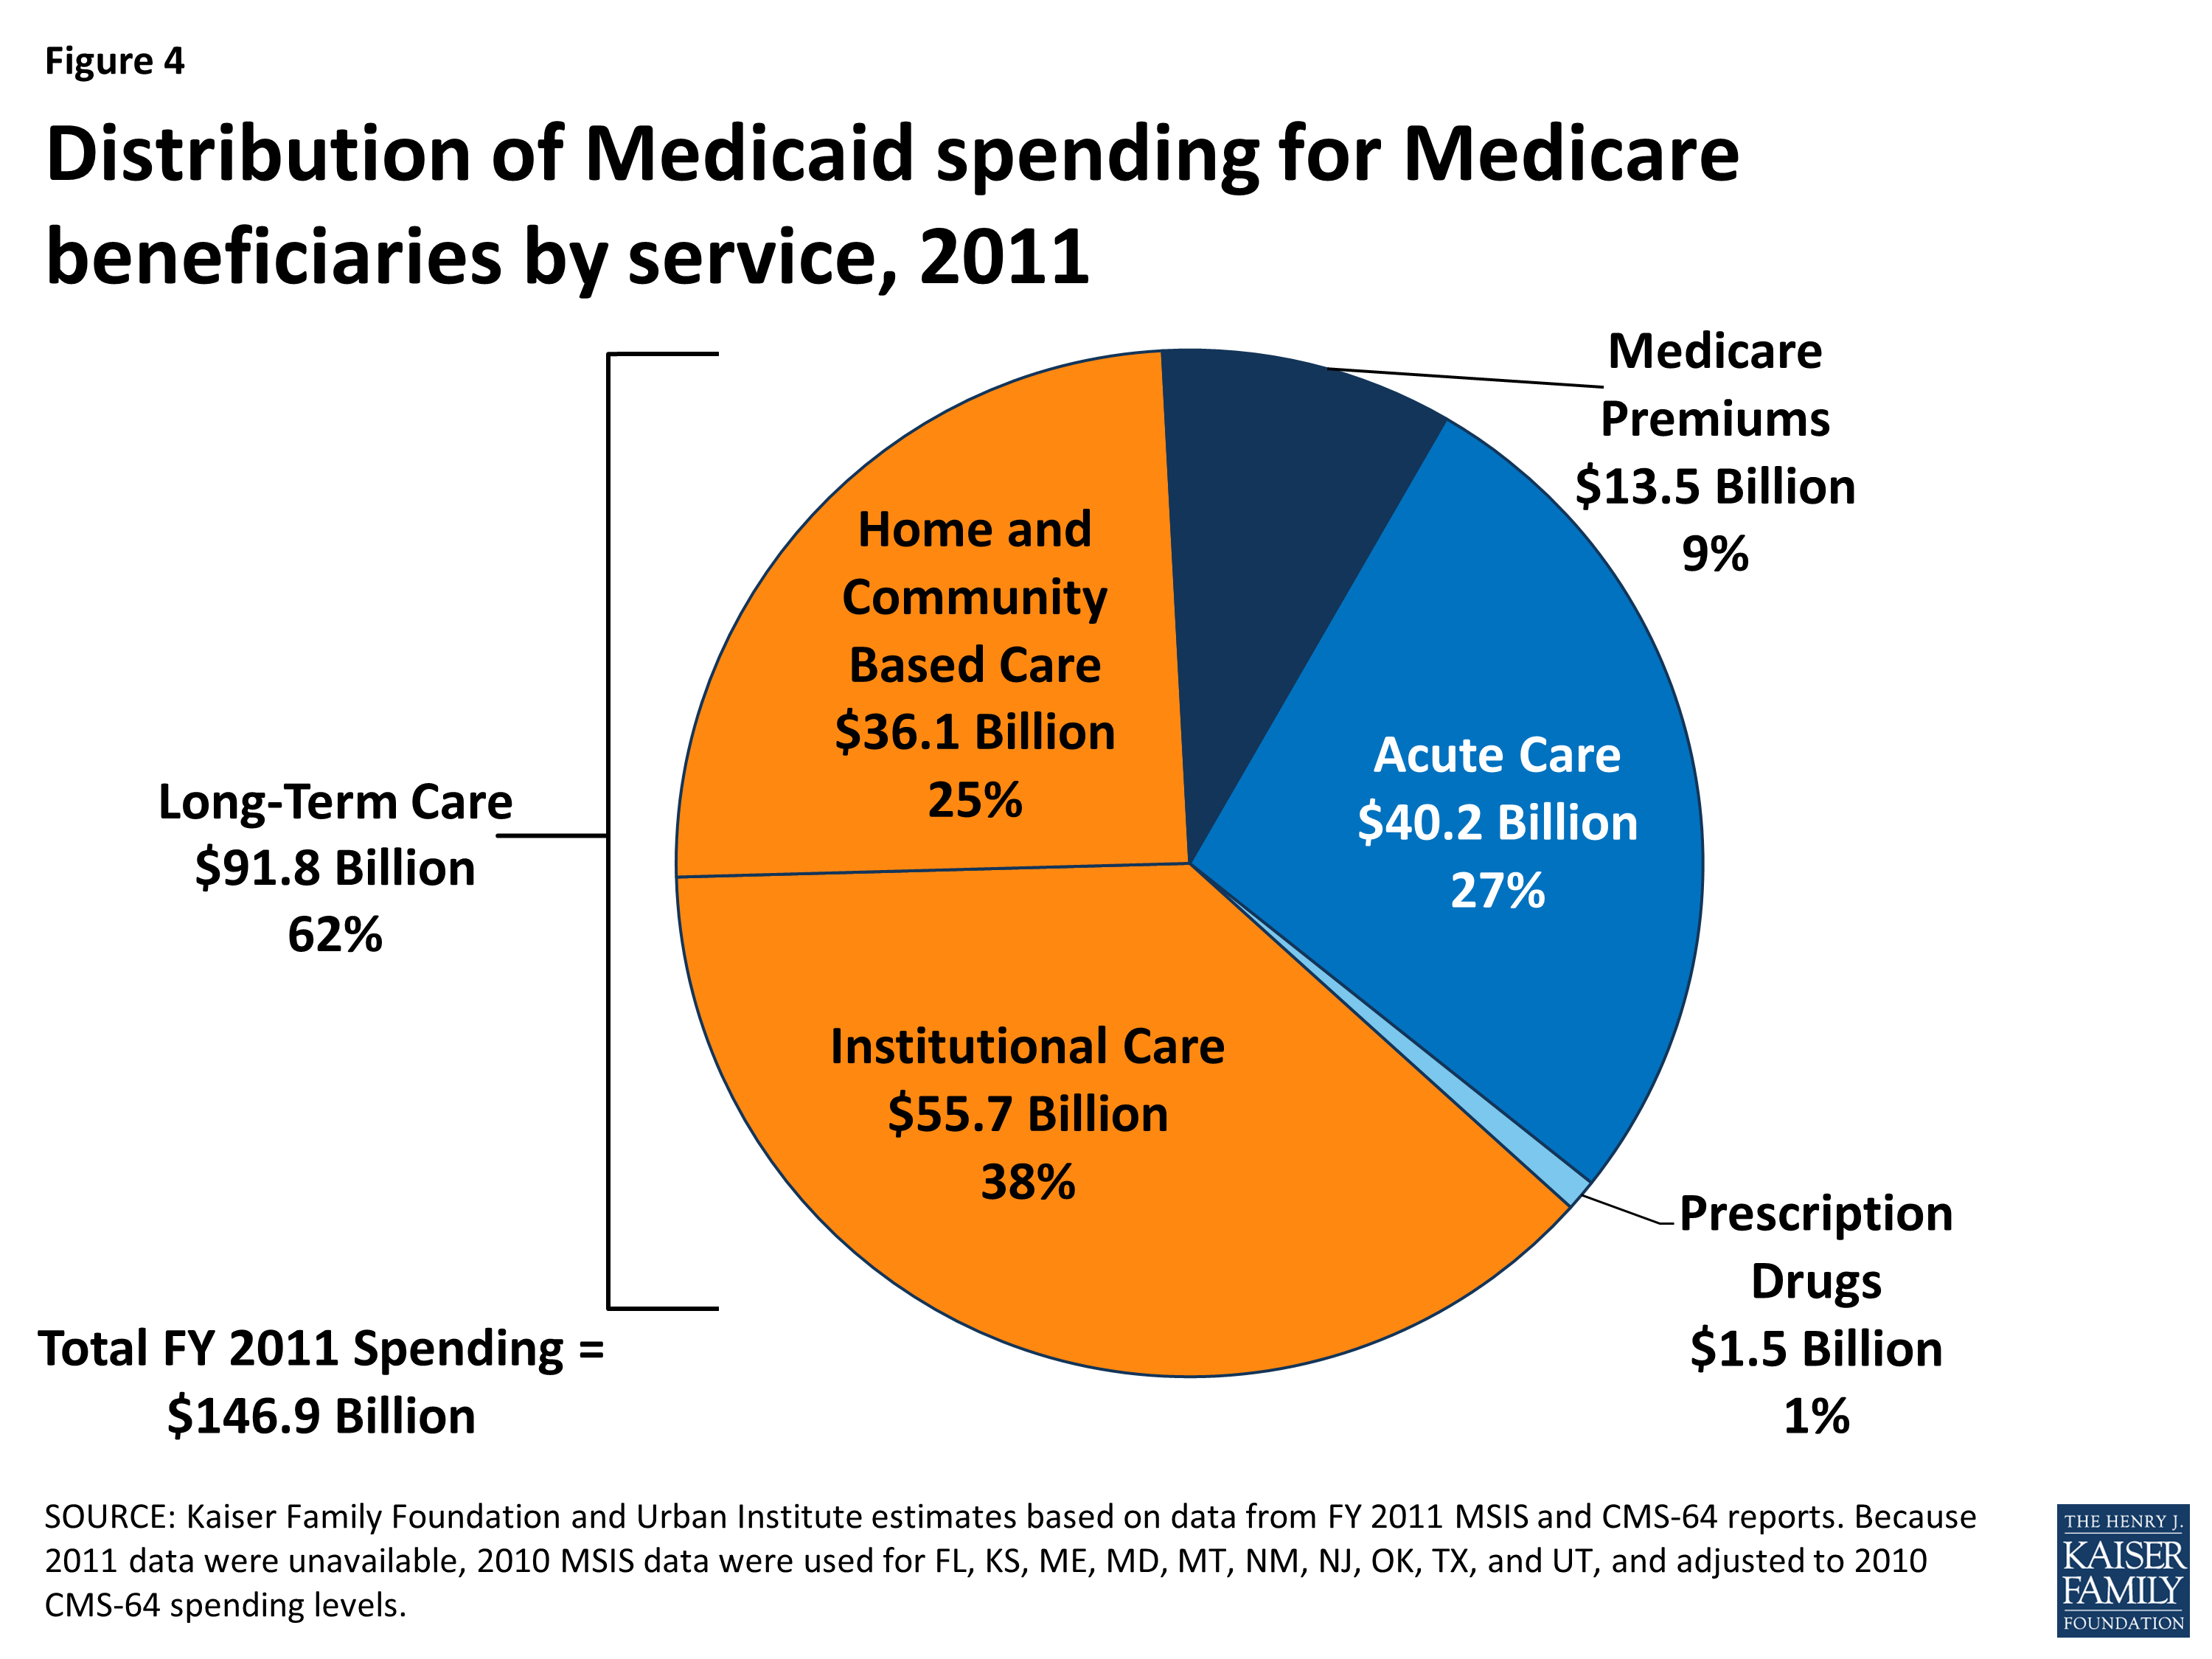
Figure 4: Distribution of Medicaid spending for Medicare beneficiaries by service, 2011
Medicare beneficiaries account for 15% of Medicaid enrollment but 36% of Medicaid spending (Figure 5). Medicaid spending for Medicare beneficiaries is disproportionate to their enrollment as a result of their more intensive health care needs and service use.
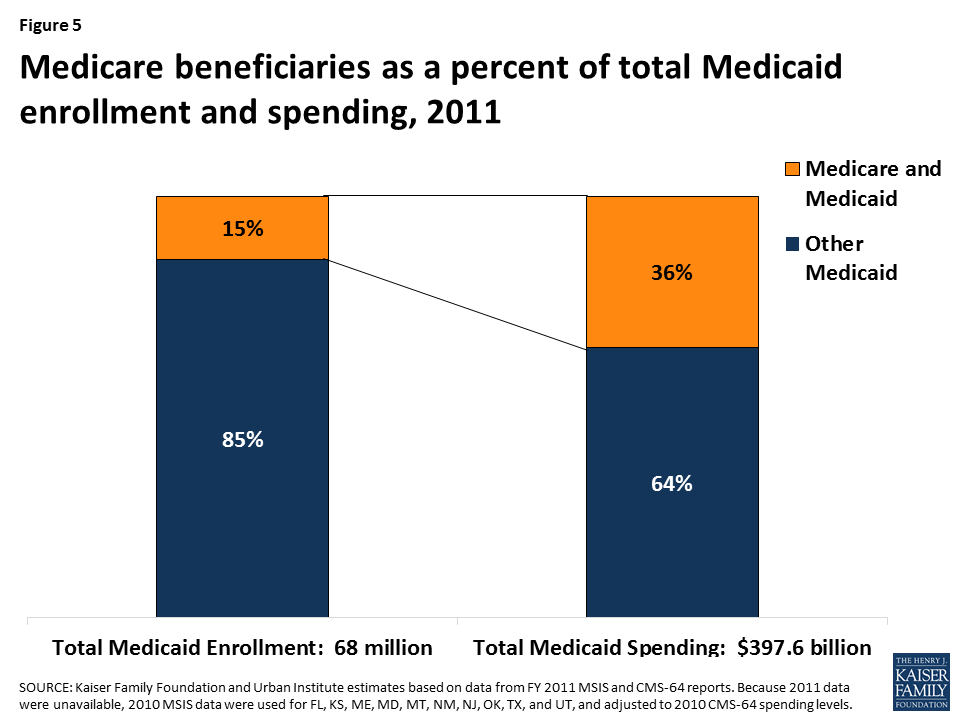
Figure 5: Medicare beneficiaries as a percent of total Medicaid enrollment and spending, 2011
Medicaid spending on Medicare beneficiaries as a share of total Medicaid spending varies by state (Figure 6). Nearly three-quarters of states devote more than 30% of their total Medicaid spending to Medicare beneficiaries, and spending for Medicare beneficiaries comprises more than 45% of Medicaid budgets in six states. This variation is due to population differences among the states as well as state choices about eligibility and services. In addition, because the most current available data are from 2011, they do not reflect any changes in total state spending as a result of state adoption of the Affordable Care Act’s Medicaid expansion.
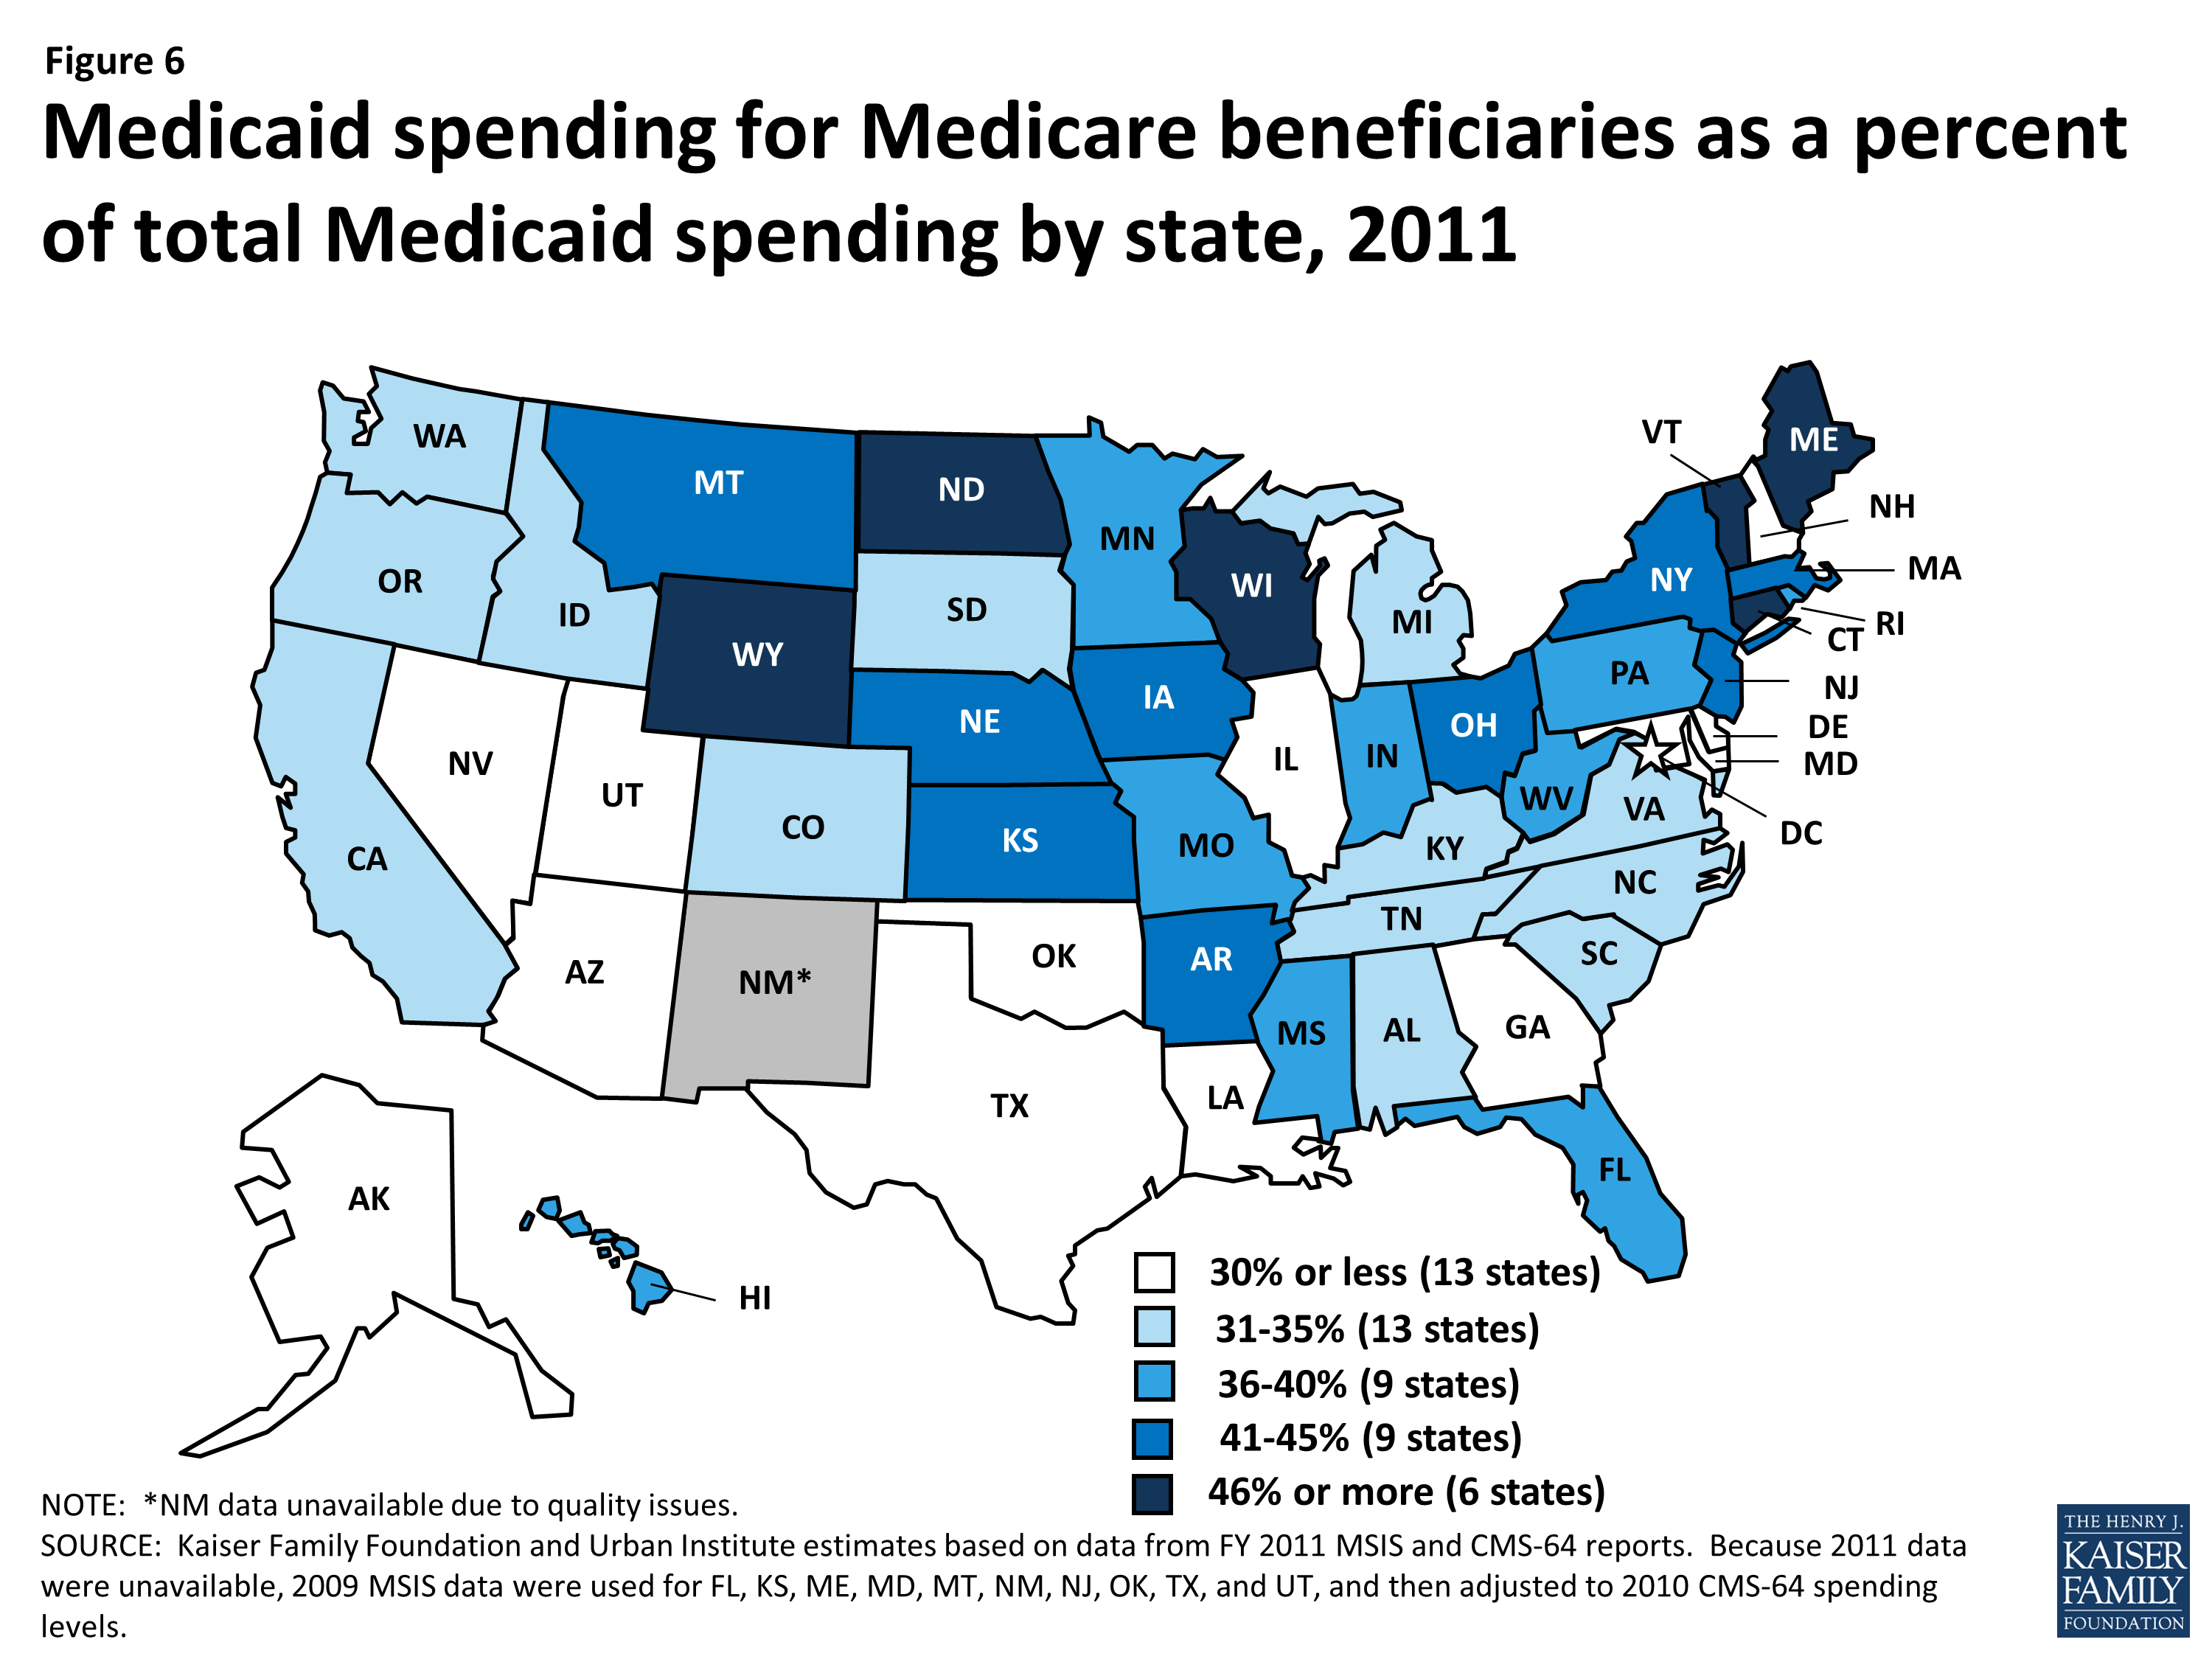
Figure 6: Medicaid spending for Medicare beneficiaries as a percent of total Medicaid spending by state, 2011
Looking Ahead
Because Medicaid spending for Medicare beneficiaries is disproportionate to their enrollment, policy changes that lead states to limit per enrollee Medicaid spending or cut costly services could especially affect these beneficiaries. Medicare beneficiaries who receive Medicaid are poorer than other Medicare beneficiaries, and many have intensive medical and long-term care needs as a result of old age, disability, and chronic illness. Medicare beneficiaries rely on Medicaid to cover expensive but necessary services, especially long-term care in the community and nursing homes, that are generally not available through Medicare or private insurance. They also depend on Medicaid to make Medicare affordable because Medicare’s out-of-pocket costs can be high for those with low incomes. In addition, because the share of state Medicaid budgets devoted to Medicare beneficiaries varies by state, any changes that limit federal Medicaid financing will impact individual states differently. Because changes to Medicaid’s financing structure could have significant consequences for enrollees and states, the potential implications warrant careful consideration for their impact on Medicare beneficiaries.
Appendix
Appendix
| Table 1: Enrollment and Spending for Medicare Beneficiaries Who Receive Medicaid By State, FY 2011 | ||||||||
| State | Total Medicare Beneficiaries Receiving Medicaid (in 100s) |
Medicare Beneficiaries Receiving Medicaid as a Share of: | Total Medicaid Spending on Medicare Beneficiaries (in millions) |
Distribution of Medicaid Spending for Medicare Beneficiaries by Type of Service (in millions): | Medicaid Spending on Medicare Beneficiaries as % of Total Medicaid Spending | |||
| All Medicare Enrollees | All Medicaid Enrollees | Medicare Premiums | Medical Care | Long-Term Care | ||||
| United States | 9,972,300 | 21% | 15% | $146,906 | $13,489 | $41,652 | $91,765 | 36% |
| Alabama | 212,100 | 24% | 20% | $1,633 | $250 | $258 | $1,125 | 35% |
| Alaska | 15,100 | 22% | 11% | $358 | $22 | $72 | $264 | 27% |
| Arizona | 146,400 | 15% | 12% | $1,990 | $203 | $1,757 | $31 | 22% |
| Arkansas | 128,300 | 24% | 18% | $1,703 | $159 | $652 | $892 | 42% |
| California | 1,294,400 | 26% | 11% | $18,677 | $2,248 | $7,480 | $8,949 | 34% |
| Colorado | 77,500 | 12% | 10% | $1,466 | $95 | $358 | $1,013 | 34% |
| Connecticut | 155,000 | 27% | 20% | $2,977 | $178 | $439 | $2,360 | 48% |
| Delaware | 27,100 | 18% | 11% | $369 | $33 | $67 | $270 | 25% |
| DC | 23,400 | 29% | 10% | $520 | $34 | $89 | $396 | 25% |
| Florida | 675,500 | 19% | 18% | $7,190 | $1,122 | $2,014 | $4,054 | 39% |
| Georgia | 303,900 | 24% | 16% | $2,283 | $295 | $392 | $1,596 | 29% |
| Hawaii | 36,500 | 17% | 13% | $606 | $57 | $491 | $58 | 38% |
| Idaho | 39,600 | 17% | 15% | $499 | $40 | $143 | $317 | 31% |
| Illinois | 364,600 | 19% | 12% | $3,997 | $379 | $902 | $2,716 | 30% |
| Indiana | 172,900 | 17% | 14% | $2,584 | $161 | $629 | $1,795 | 39% |
| Iowa | 88,500 | 17% | 15% | $1,532 | $104 | $351 | $1,077 | 45% |
| Kansas | 68,400 | 16% | 17% | $1,106 | $81 | $178 | $847 | 41% |
| Kentucky | 194,100 | 25% | 20% | $1,817 | $212 | $365 | $1,241 | 31% |
| Louisiana | 201,600 | 29% | 16% | $1,962 | $259 | $333 | $1,370 | 30% |
| Maine | 104,000 | 38% | 28% | $1,299 | $114 | $647 | $539 | 52% |
| Maryland | 119,800 | 15% | 12% | $2,221 | $186 | $485 | $1,549 | 29% |
| Massachusetts | 255,100 | 23% | 17% | $5,533 | $407 | $2,177 | $2,949 | 41% |
| Michigan | 290,700 | 17% | 12% | $3,956 | $389 | $1,410 | $2,157 | 32% |
| Minnesota | 149,300 | 19% | 14% | $3,397 | $172 | $1,103 | $2,121 | 40% |
| Mississippi | 162,200 | 32% | 21% | $1,602 | $201 | $386 | $1,014 | 37% |
| Missouri | 187,200 | 18% | 16% | $2,810 | $177 | $898 | $1,736 | 36% |
| Montana | 19,700 | 11% | 15% | $399 | $27 | $73 | $299 | 41% |
| Nebraska | 44,300 | 16% | 16% | $719 | $42 | $195 | $482 | 42% |
| Nevada | 50,500 | 14% | 13% | $434 | $72 | $115 | $247 | 28% |
| New Hampshire | 34,500 | 15% | 20% | $589 | $24 | $104 | $462 | 46% |
| New Jersey | 208,300 | 15% | 20% | $4,300 | $321 | $846 | $3,133 | 45% |
| New Mexico | 69,100 | 21% | 12% | N/A | $78 | N/A | N/A | N/A |
| New York | 839,300 | 28% | 14% | $22,838 | $1,278 | $4,658 | $16,902 | 43% |
| North Carolina | 335,100 | 22% | 17% | $3,346 | $414 | $784 | $2,148 | 31% |
| North Dakota | 16,300 | 15% | 19% | $402 | $11 | $44 | $348 | 56% |
| Ohio | 345,300 | 18% | 15% | $6,400 | $383 | $1,239 | $4,779 | 41% |
| Oklahoma | 119,700 | 19% | 14% | $1,304 | $133 | $296 | $875 | 30% |
| Oregon | 108,500 | 17% | 15% | $1,545 | $142 | $308 | $1,094 | 35% |
| Pennsylvania | 443,500 | 19% | 18% | $7,317 | $550 | $877 | $5,889 | 36% |
| Rhode Island | 41,100 | 22% | 19% | $760 | $40 | $434 | $286 | 38% |
| South Carolina | 160,200 | 20% | 17% | $1,633 | $172 | $513 | $948 | 34% |
| South Dakota | 22,100 | 16% | 16% | $264 | $27 | $46 | $191 | 34% |
| Tennessee | 279,100 | 26% | 18% | $2,582 | $335 | $1,583 | $663 | 31% |
| Texas | 642,900 | 21% | 13% | $7,438 | $1,016 | $2,255 | $4,166 | 27% |
| Utah | 30,200 | 10% | 9% | $465 | $33 | $173 | $259 | 25% |
| Vermont | 30,000 | 26% | 15% | $264 | $6 | $173 | $86 | 21% |
| Virginia | 191,700 | 16% | 18% | $2,325 | $223 | $403 | $1,700 | 34% |
| Washington | 180,600 | 18% | 13% | $2,271 | $308 | $278 | $1,685 | 31% |
| West Virginia | 87,200 | 23% | 20% | $1,037 | $107 | $119 | $812 | 36% |
| Wisconsin | 168,300 | 18% | 13% | $3,581 | $164 | $1,925 | $1,493 | 49% |
| Wyoming | 11,600 | 14% | 13% | $258 | $6 | $76 | $176 | 47% |
| NOTES: Medical care includes acute care and prescription drugs. New Mexico spending data, with the exception of Medicaid payments for Medicare premiums, is not reported due to data quality issues. Much of Arizona’s and Hawaii’s long-term care spending shows up as managed care spending, and cannot be separated out into acute care versus long-term care within managed care spending. As a result, not all long-term care spending in these states is being captured as long-term care spending. SOURCE: Kaiser Family Foundation and Urban Institute estimates based on data from FY 2011 MSIS and CMS‐64 reports. Because 2011 data were unavailable, 2010 MSIS data were used for Florida, Kansas, Maine, Maryland, Montana, New Mexico, New Jersey, Oklahoma, Texas, and Utah, and then adjusted to 2011 CMS‐64 spending levels. 2011 Medicare enrollment numbers from Centers for Medicare & Medicaid Services (CMS), CMS Program Statistics, accessed March 2016. |
||||||||