
Medicaid in an Era of Health & Delivery System Reform: Results from a 50-State Medicaid Budget Survey for State Fiscal Years 2014 and 2015
Executive Summary
Medicaid has long-played an important role in the US healthcare system, accounting for one in every six dollars of all US health care spending while providing health and long-term services and supports coverage to over 66 million low-income Americans. However, the years 2014 and 2015 will stand out as a time of significant change and transformation. With the economy improving from the lingering effects of the Great Recession, Medicaid programs across the country were focused primarily on: implementing a myriad of changes included in the Affordable Care Act (ACA); pursuing innovative delivery and payment system reforms to help assure access, improve quality and achieve budget certainty, and continuing to administer this increasingly complex program. (Figure 1)This report provides an in depth examination of the changes taking place in state Medicaid programs across the country. The findings in this report are drawn from the 14th annual budget survey of Medicaid officials in all 50 states and the District of Columbia conducted by the Kaiser Commission on Medicaid and the Uninsured and Health Management Associates (HMA), with the support of the National Association of Medicaid Directors. This report highlights policy changes implemented in state Medicaid programs in FY 2014 and those planned for implementation in FY 2015 based on information provided by the nation’s state Medicaid Directors.
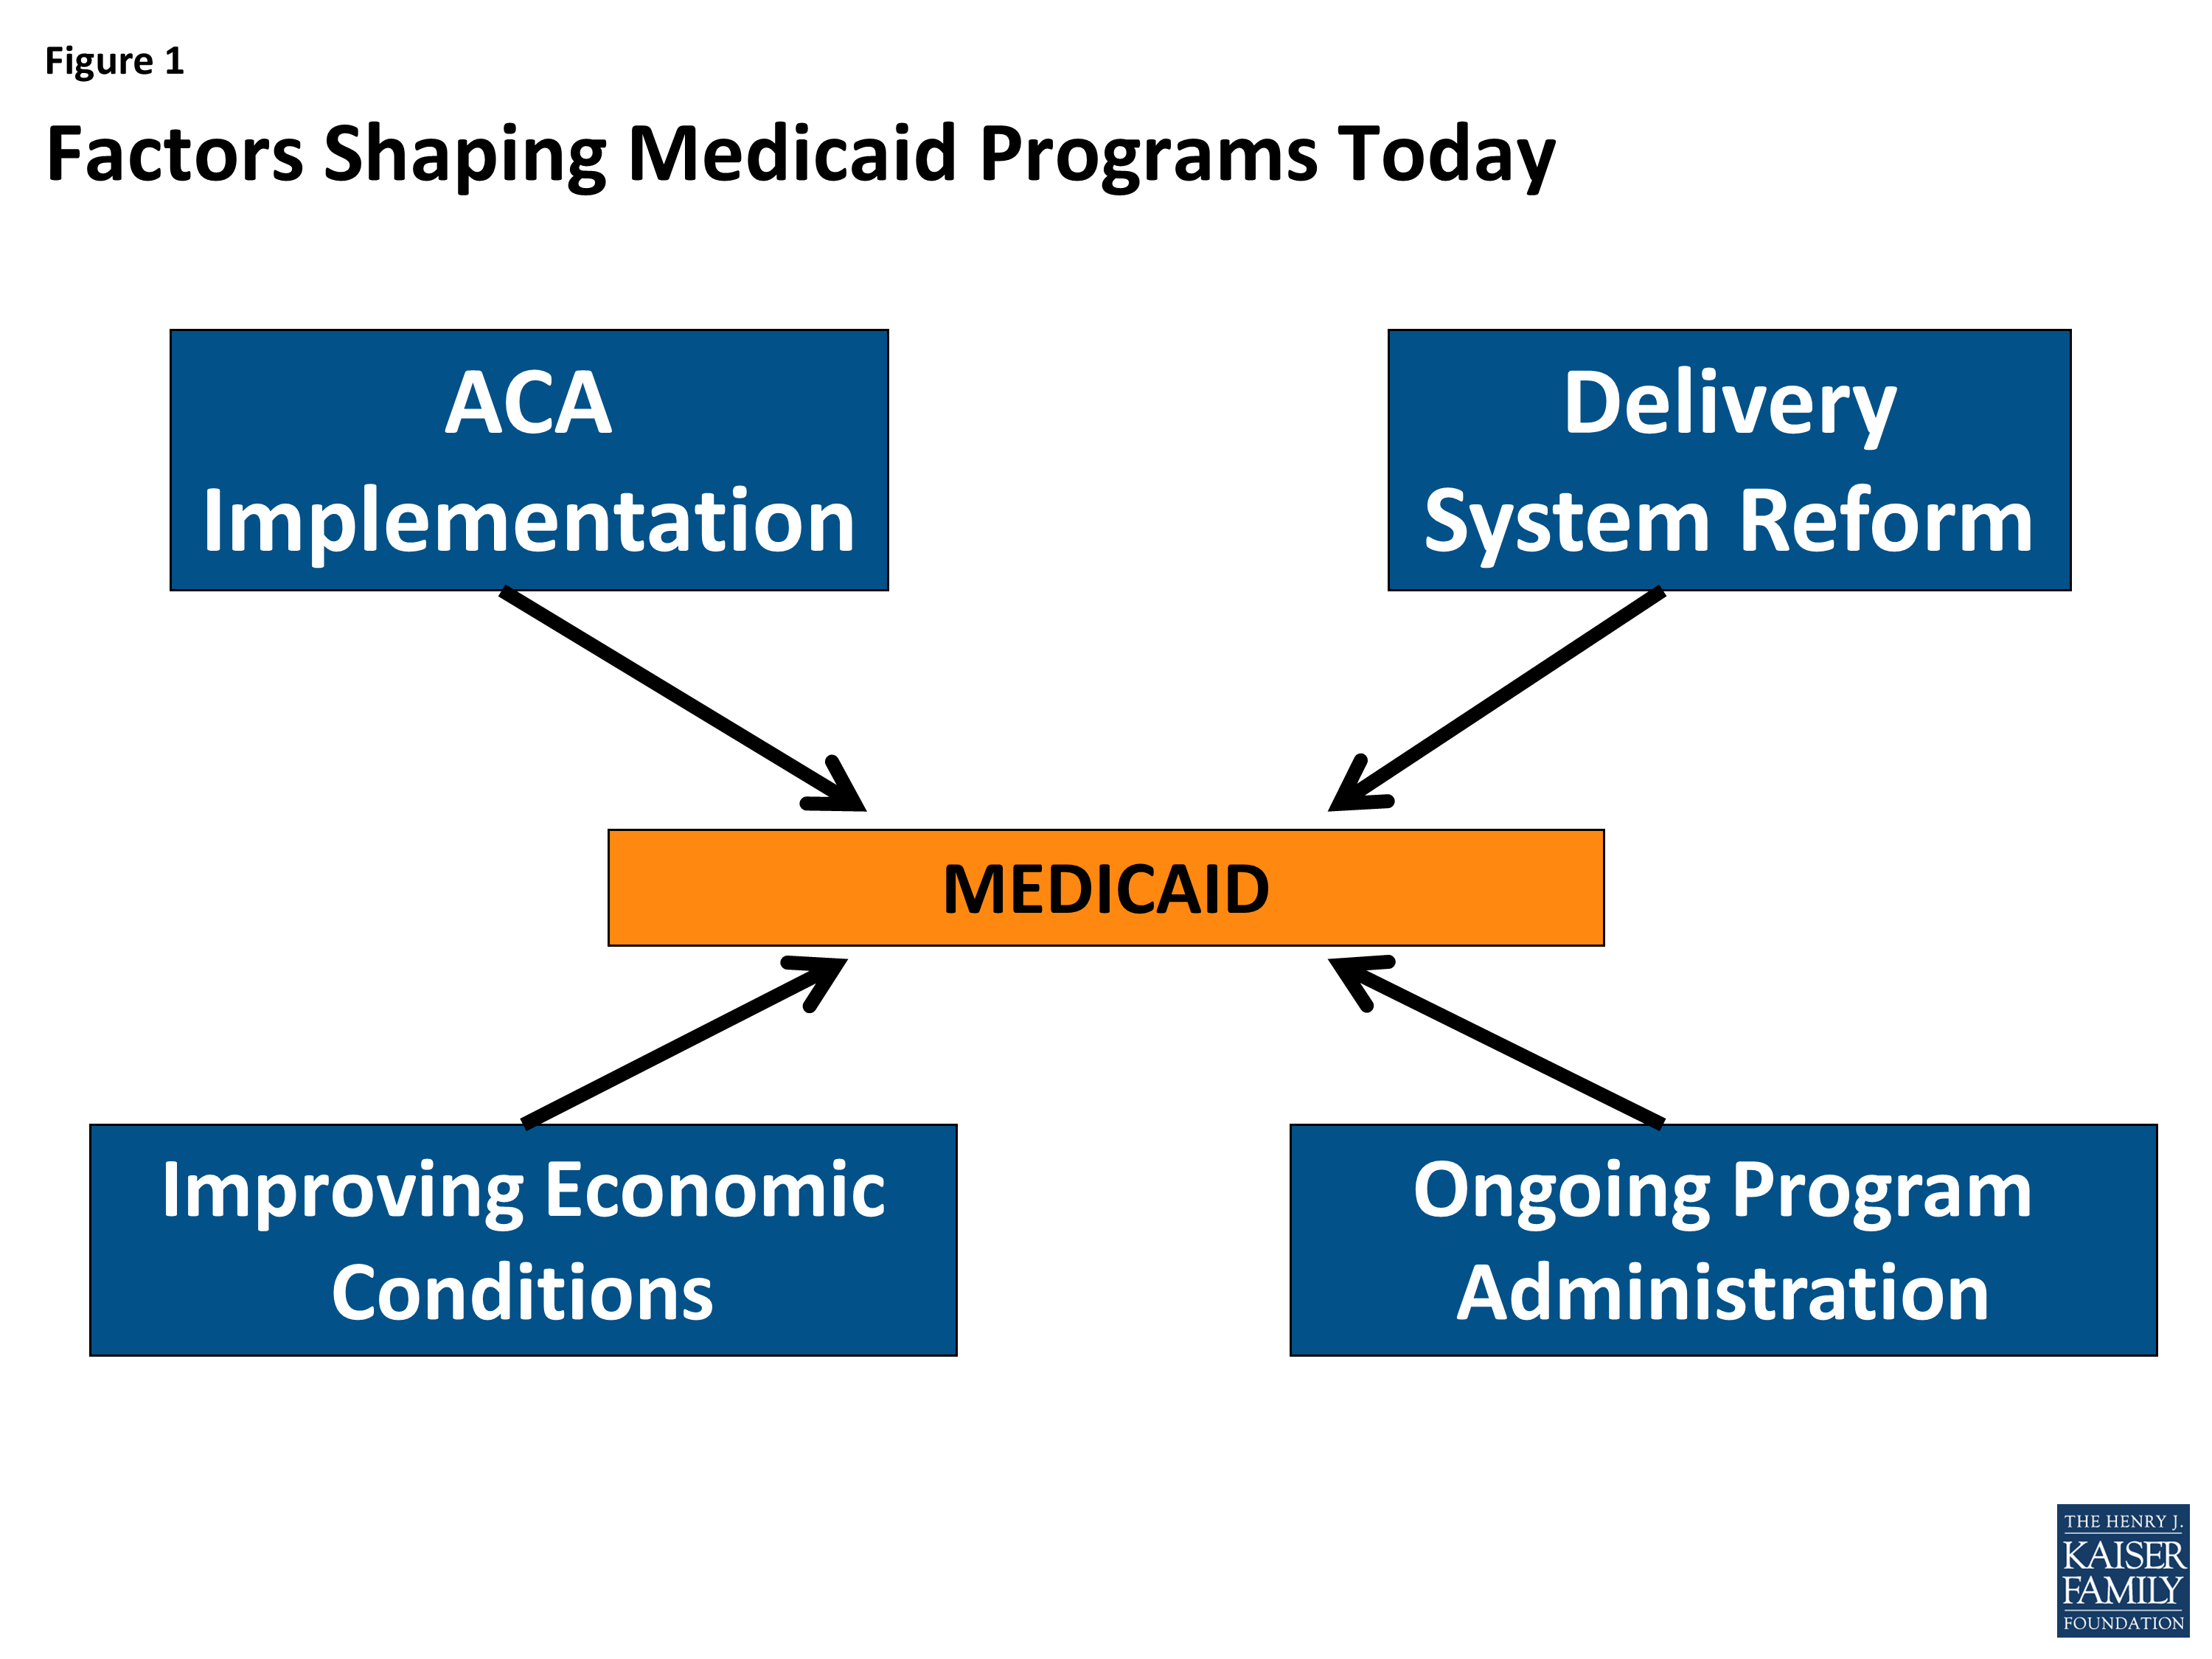
Figure 1: Factors Shaping Medicaid Programs Today
Key areas covered include changes in eligibility and enrollment, delivery systems, provider payments and taxes, benefits, pharmacy programs, program integrity and program administration.
In FY 2014 and FY 2015, states were implementing a host of ACA-related eligibility and enrollment changes in Medicaid.
Many of the Affordable Care Act’s provisions affecting Medicaid eligibility and enrollment went into effect during FY 2014, most significantly the Medicaid expansion. Medicaid’s role, as enacted under the ACA, was broadened to become the foundation of coverage for nearly all low-income Americans with incomes up to 138 percent of the federal poverty level (FPL); however, the Supreme Court ruling on the ACA effectively made the decision to implement the Medicaid expansion an option for states. As of September 2014, 28 states (including DC) are implementing the Medicaid expansion. Regardless of the expansion decision, all states were required to streamline Medicaid enrollment and renewal processes, transition to a uniform income eligibility standard (Modified Adjusted Gross Income or MAGI) and coordinate with new Marketplaces.
In addition to changes required by the ACA in all states to streamline Medicaid eligibility and enrollment processes,31 states made eligibility expansions in FY 2014, the most common being implementation of the Medicaid expansion. Twenty-six states implemented the Medicaid expansion in FY 2014. New Hampshire implemented the Medicaid expansion in July 2014 (FY 2015) and Pennsylvania received approval in August 2014 to implement the expansion in January 2015, bringing the total number of states moving forward with the Medicaid expansion to 28 states as of September 2014. Medicaid expansion is under consideration in additional states, notably Indiana which has submitted a request to expand Medicaid under a waiver and Utah which has a request under development. Other states reported that there will be discussion of Medicaid expansion in their next legislative session. (Figure 2)
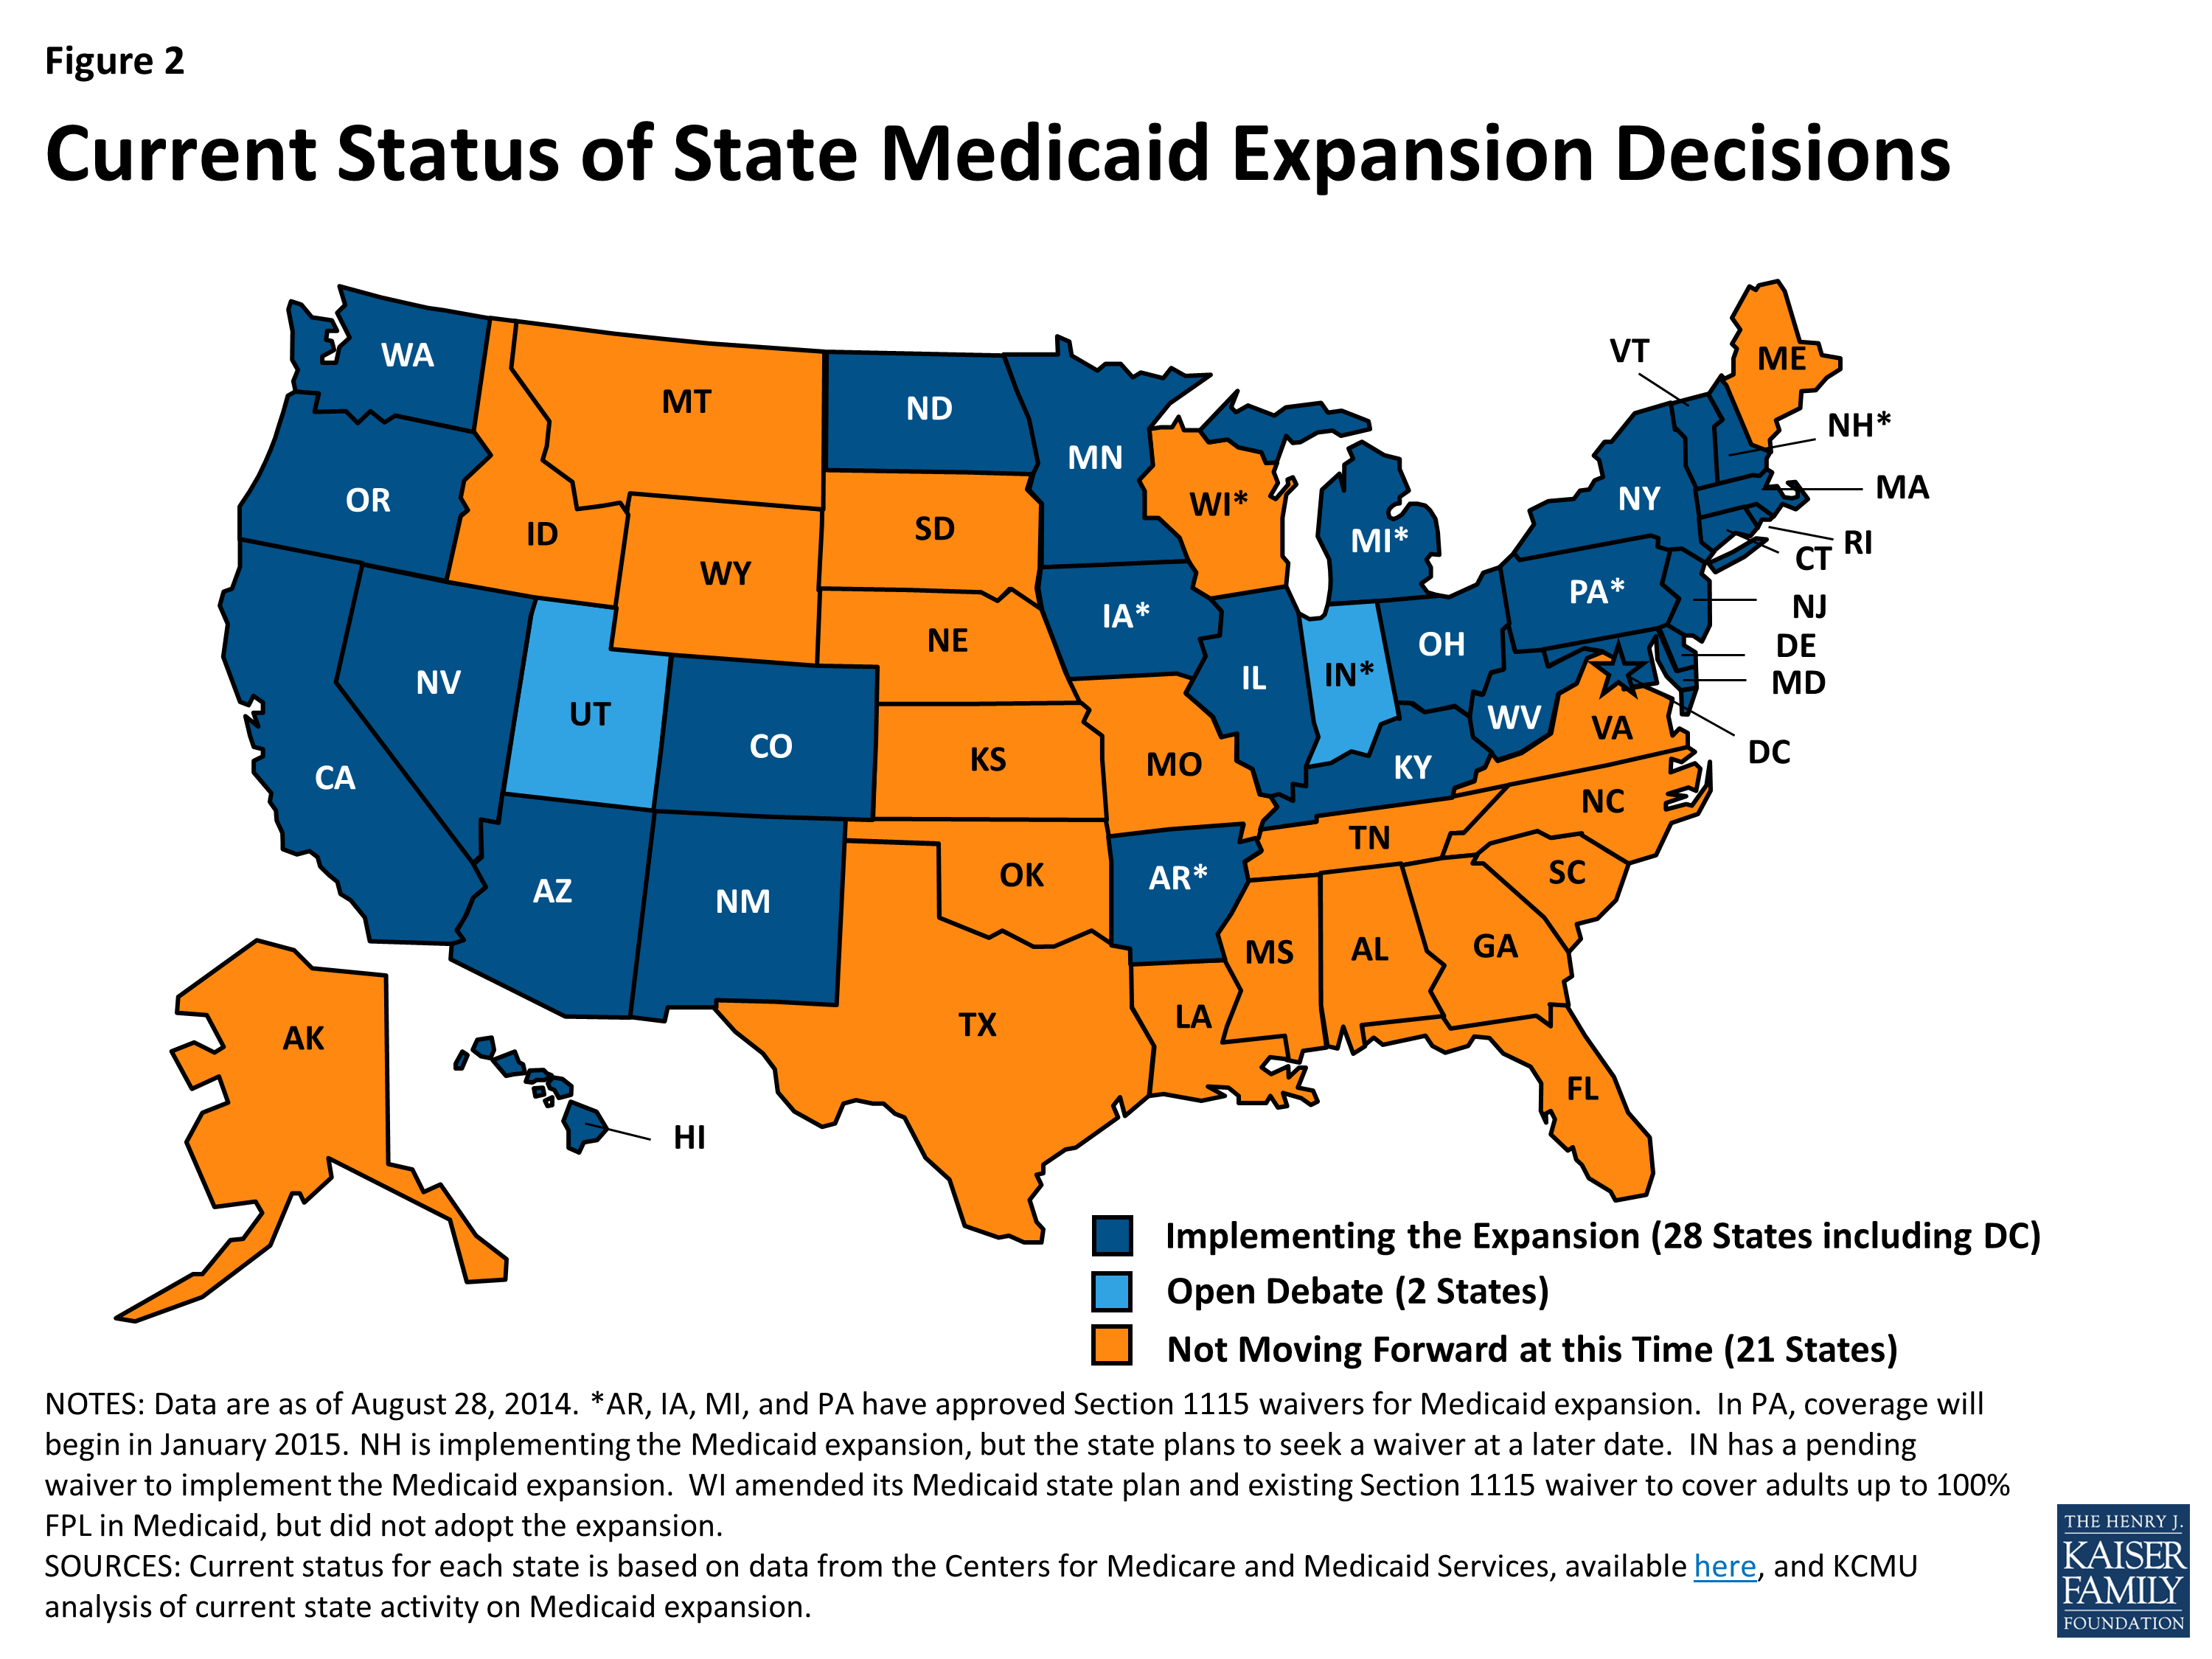
Figure 2: Current Status of State Medicaid Expansion Decisions
States reported a number of changes to better align new and pre-ACA coverage options. For example, some states that had previously expanded Medicaid coverage to adults with incomes above poverty are eliminating such coverage in light of new coverage options available through the Marketplaces. Four states reported Medicaid eligibility restrictions. Meanwhile, children’s coverage remains strong as maintenance of eligibility for Medicaid and CHIP children is in place through 2019.
Focus on delivery system reforms in Medicaid programs continued to build in FY 2014 and FY 2015. (Figure 3)
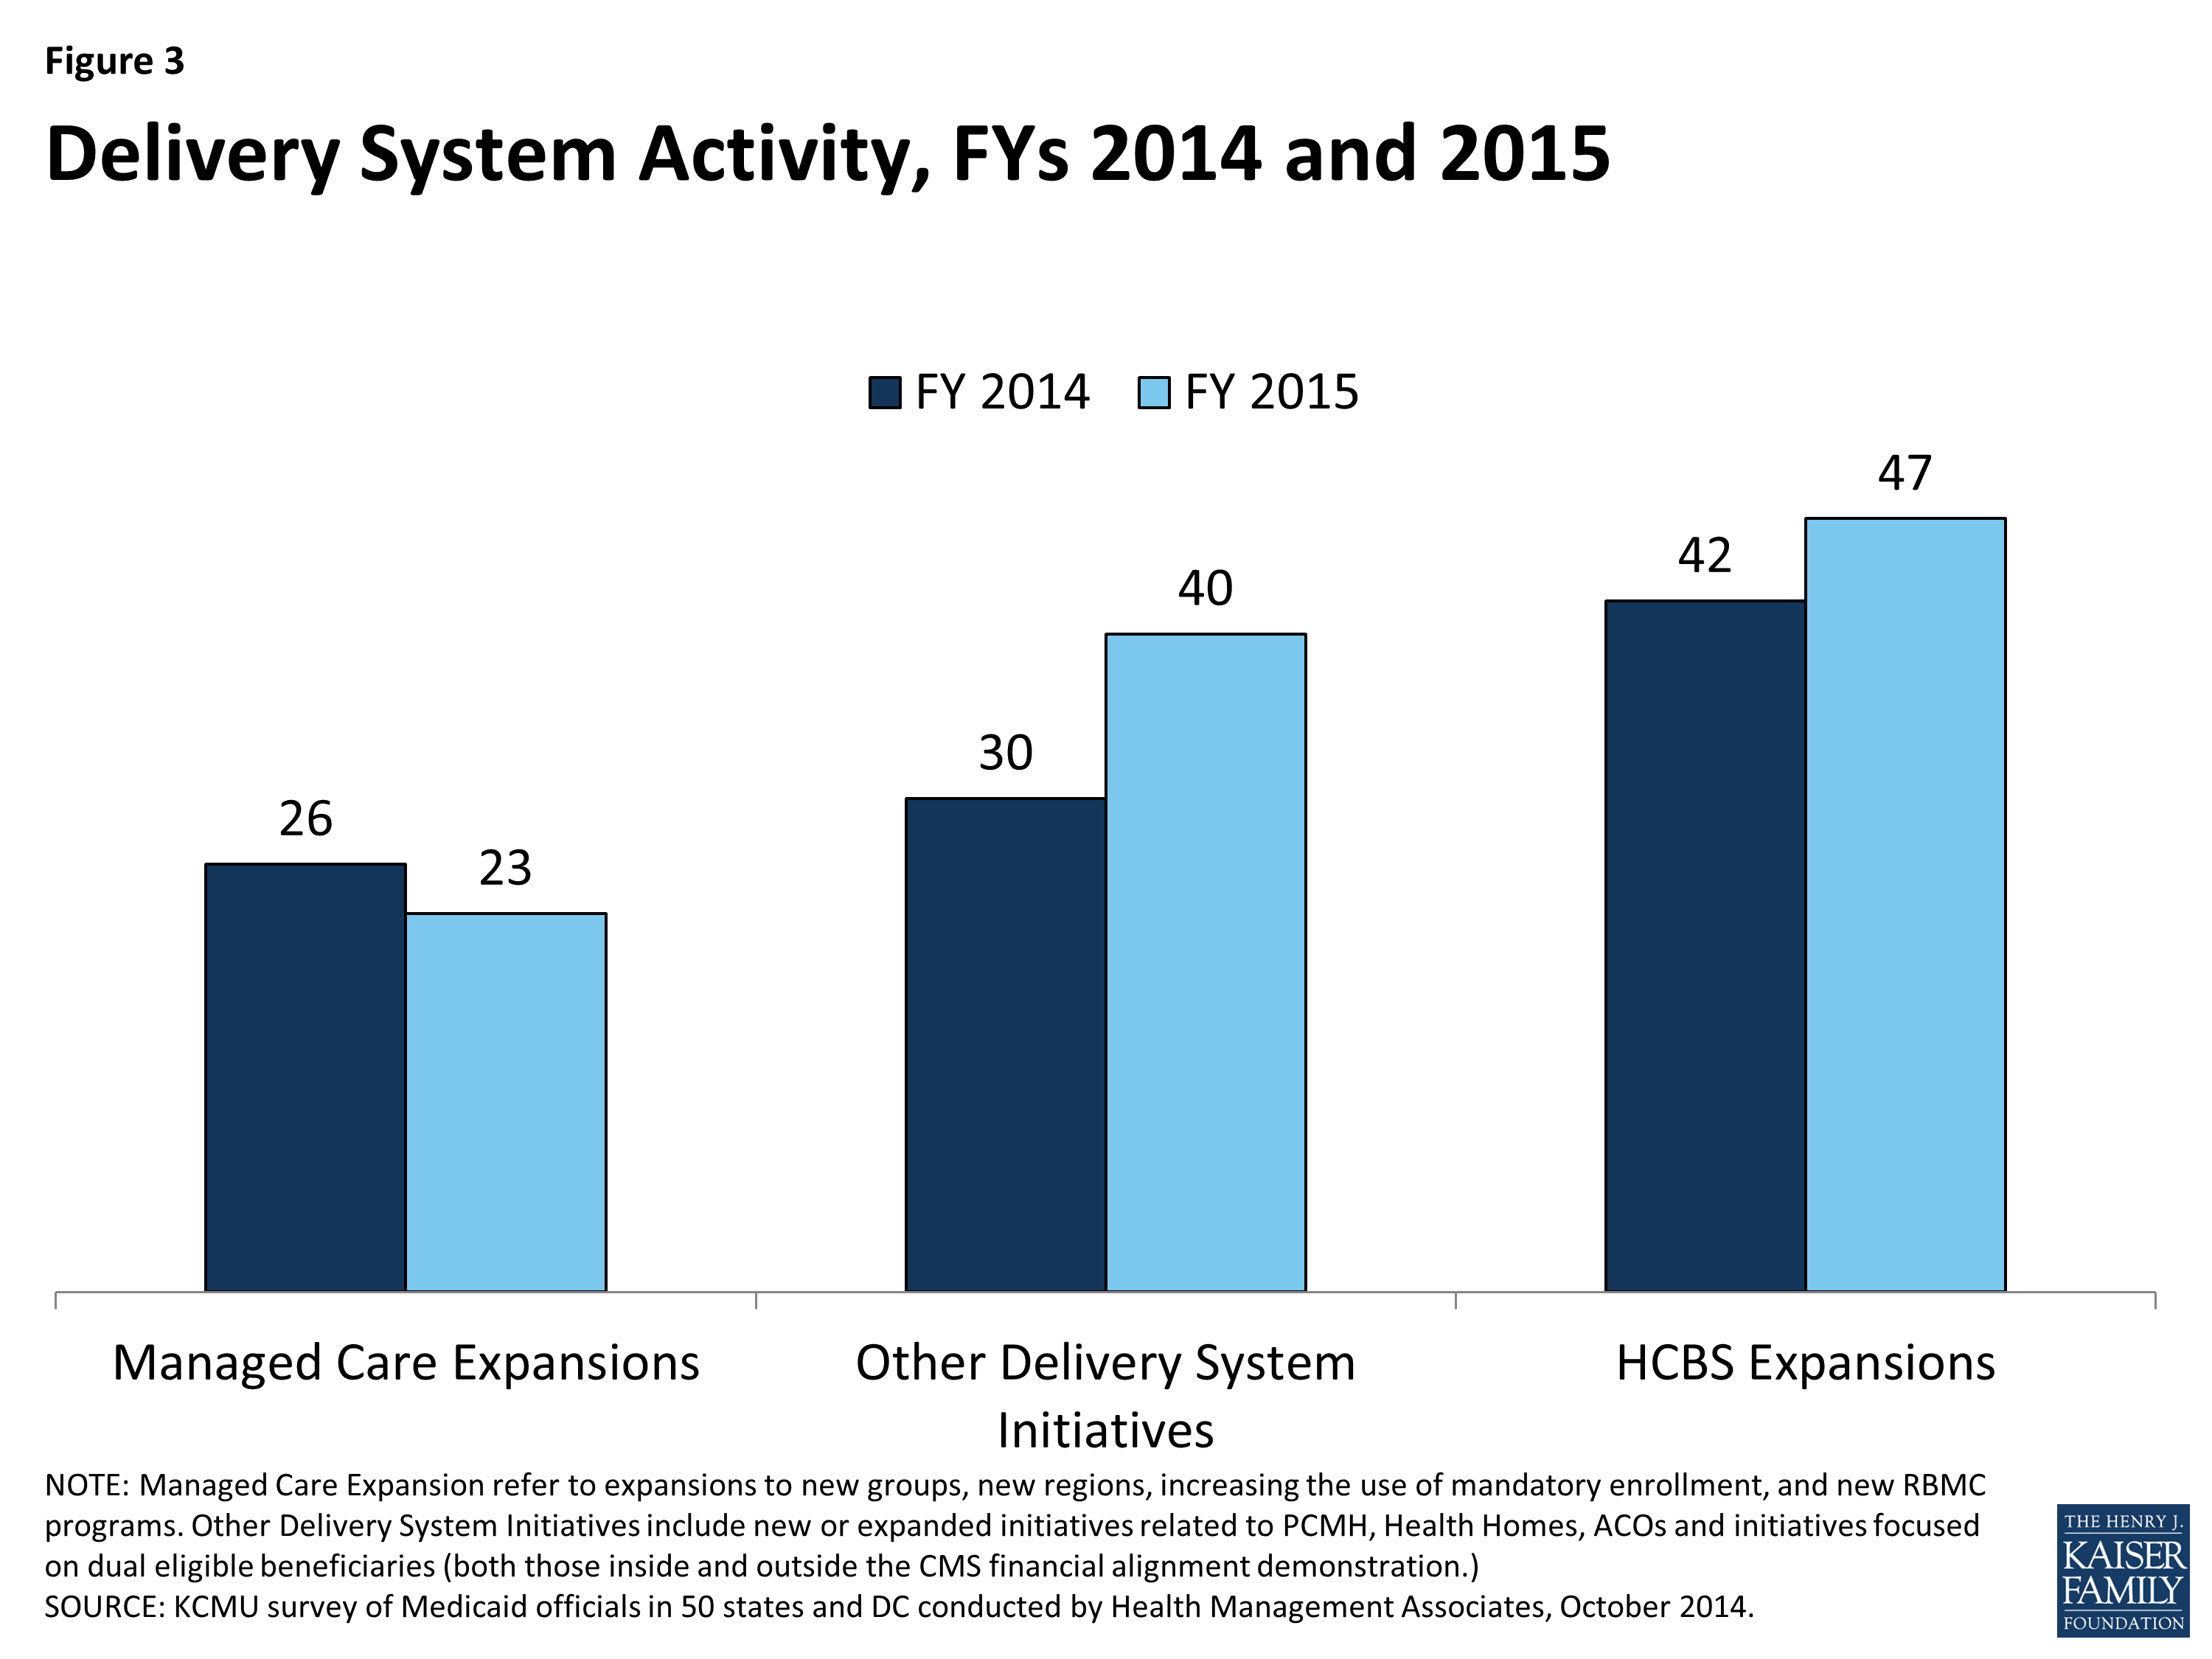
Figure 3: Delivery System Activity, FYs 2014 and 2015
Most Medicaid programs use managed care as a means to help assure access, improve quality and achieve budget certainty. As of July 2014, all states except three – Alaska, Connecticut and Wyoming – had in place some form of managed care including risk-based comprehensive managed care organizations (MCO), Primary Care Case Management (PCCM) programs or both. States continued to take actions to increase enrollment in managed care. Of the 39 states (including DC) with MCOs, over half in FY 2014 and FY 2015 reported specific policy changes to increase the number of enrollees in risk-based managed care by adding eligibility groups, making enrollment mandatory or expanding to new regions. In addition to expanding managed care, new quality improvement initiatives such as adding or enhancing pay-for-performance arrangements to their managed care contracts were implemented in 34 states in FYs 2014 or 2015.
Aside from managed care changes, well over half of states reported other delivery system reform initiatives underway (30 states in FY 2014 and 40 states in FY 2015.) Just over half the states (26) planned to implement or expand Medicaid health homes in FY 2015, up from 14 in FY 2014. Nearly half of states had patient centered medical homes in place in FY 2013; an additional 17 states in FY 2014 and 20 in FY 2015 were implementing or expanding such initiatives. Over a third of states (19) plan to implement initiatives focused on coordinating care for those dually eligible for Medicare and Medicaid in FY 2015, up from 10 states in FY 2014 and 5 states in FY 2013. A smaller number of states reported delivery system and payment reforms related to Accountable Care Organizations (ACO), episode of care initiatives, and hospital Delivery System Reform Incentive Payment (DSRIP) programs.
In FY 2014 and FY 2015, 42 and 47 states, respectively, took actions that expanded the number of persons served in a home and community-based services (HCBS) setting, notably higher than the number of states taking such action in FY 2012 (26) and FY 2013 (33). While most states reported using Section 1915(c) waiver authority to expand HCBS, a significant number of states (13 in FY 2014 and 16 in FY 2015) reported that the incentives built into their managed long-term services and support (LTSS) programs were expected to increase the number of people served in community settings. Nineteen states had at least one of the new ACA long-term services and supports options in place in FY 2013; an additional 12 states in FY 2014 and 15 states in FY 2014 plan to implement one or more of these options.
States also reported activity in other areas including provider rates and taxes, premiums and cost sharing, prescription drugs, and program integrity.
Provider Rates. As economic conditions have continued to improve, states have been able to implement program restorations or increases in provider rates. More states implemented provider rate increases across most major provider types (physicians, nursing homes and managed care) in FY 2014 and FY 2015, inpatient hospital rates being the exception. This survey also asked states about plans to extend the primary care physician fee increase beyond December 31, 2014 (at regular FMAP rates); 24 states indicated that they would not be continuing the rate increase while 15 states indicated that they will continue the higher rates at least partially. Some had not decided at the time of the survey. Other states have Medicaid physician rates that are already close to 100 percent of Medicare rates, making the issue less significant in these states.
Benefits. The number of states reporting benefit cuts or restrictions – four in FY 2014 and two in FY 2015 – fell to the lowest level since 2008. A far larger number (21 states in FY 2014 and 22 in FY 2015), reported expanding benefits, most commonly behavioral health, dental and home and community-based services.
Pharmacy. A little over half of the states continue to take steps to refine their pharmacy programs, and almost all states are concerned about the potential future fiscal impact of new and emerging specialty drug therapies. Many states (22) reported that new clinical prior authorization criteria were already in place or under development to help address such concerns.
Cost-Sharing. There was a modest increase in the number states reporting actual or planned cost-sharing increases compared to earlier years. About half of these increases were for higher income expansion groups.
Program Integrity. States continue to implement new or enhanced program integrity initiatives including the use of advanced data analytics and predictive modeling, efforts focused on managed care, enhanced provider screening, and public/private data sharing initiatives.
Looking ahead, states plan to focus on implementing the ACA, putting into place innovative delivery system reforms and continuing to manage a complex program with limited staff and resources.
In the history of Medicaid, the years 2014 and 2015 will stand out as a time of significant change. For most states, implementation of the Medicaid changes under the ACA was transformative for Medicaid from policy, operations and systems perspectives. At the same time, Medicaid programs across states have continued to increase their focus on delivery system and payment reform with the goals of improving quality of care and controlling costs. States are expanding their reliance on managed care but also implementing new innovative delivery system and care coordination arrangements, some of which are new options made available by the ACA. In coordination with these efforts, Medicaid programs are also focused on better ways to deliver long-term care services and supports by expanding home and community-based service programs. More states have been able to implement provider rate increases as well as benefit increases as the economy has continued to slowly recovery. Most Directors reported staffing and resource constraints in the face of the magnitude of changes occurring in the program today. Despite these challenges, Medicaid continues to evolve to meet the needs of the growing number of people it serves and to play a larger role in the broader health care delivery system.
Acknowledgements
We thank the Medicaid directors and Medicaid staff in all 50 states and the District of Columbia who completed the survey on which this study is based. Especially in this time of limited resources and challenging workloads, we truly appreciate the time and effort provided by these public servants to complete the survey, to participate in structured interviews and to respond to our follow-up questions. It is their work that made this report possible.
We offer special thanks to two of our colleagues at Health Management Associates. Dennis Roberts developed and managed the database, and his work is invaluable to us. Jenna Walls assisted with writing the case studies and we thank her for her excellent work.
Report
Introduction
This report provides an in depth examination of the changes taking place in state Medicaid programs across the country. The findings in this report are drawn from the 14th annual budget survey of Medicaid officials in all 50 states and the District of Columbia conducted by the Kaiser Commission on Medicaid and the Uninsured and Health Management Associates (HMA), with the support of the National Association of Medicaid Directors. This was the fourteenth annual survey, conducted at the beginning of each state fiscal year from FY 2002 through FY 2015.
The KCMU/HMA Medicaid survey on which this report is based was conducted from June through August 2014. Medicaid directors and staff provided data for this report in response to a written survey and a follow-up telephone interview. All 50 states and DC completed surveys and participated in telephone interview discussions between June and August 2014. The survey asked state officials to describe policy changes that occurred in FY 2014 and those adopted for implementation for FY 2015 (which began for most states on July 1, 2014.1) The survey does not attempt to catalog all Medicaid policies. Experience has shown that adopted policies are sometimes delayed or not implemented, for reasons related to legal, fiscal, administrative, systems or political considerations, or due to delays in approval from CMS. Policy changes under consideration are not included in the survey. A copy of the survey instrument is located in the appendix of this report.
Key findings of this survey, along with 50-state tables providing more detailed information, are described in the following sections of this report:
- Eligibility and Enrollment
- Delivery System Reforms
- Managed Care
- Other Delivery System Reforms
- Balancing Institutional and Community-Based Long-Term Services and Supports
- Provider Rates and Taxes or Fees
- Benefits Changes
- Premiums and Cost-Sharing
- Prescription Drug Utilization and Cost Control Initiatives
- Program Integrity Initiatives
- Medicaid Administration and Priorities
Eligibility and Enrollment
The ACA included a number of significant changes for Medicaid eligibility and enrollment. One of the most significant changes extends Medicaid coverage to nearly all non-elderly low-income adults with incomes up to 138 percent of the federal poverty level (FPL) ($16,104 per year for an individual in 2014), ending the Medicaid eligibility exclusion for adults without dependent children or childless adults regardless of their income. However, the June 2012 Supreme Court ruling on the ACA effectively made the decision to implement the Medicaid expansion optional for states. The ACA also required states to transition to the use of Modified Adjusted Gross Income (MAGI) to determine Medicaid financial eligibility for children, pregnant women, parents and low income adults; eliminate asset limits for these same groups; transition children with income between 100 and 133 percent FPL from the Children’s Health Insurance Program (CHIP) to Medicaid; and to use new streamlined application, enrollment, and renewal processes. In addition, Medicaid agencies were required to coordinate enrollment processes with the new Marketplaces. Altogether, the eligibility changes in 2014 represent historic program changes.
Eligibility Standards
A total of 31 states reported at least one eligibility expansion in FY 2014 and eight states reported planned eligibility expansions in FY 2015; the ACA Medicaid expansion was the most commonly reported change. In contrast, four states made eligibility restrictions in FY 2014; no states reported restrictions in FY 2015. However, many states (24 in FY 2014, 6 in FY 2015) made changes to existing Medicaid eligibility pathways due to the availability of new coverage through the Marketplace; these changes are not counted as restrictions or expansions in this report.
Adult Coverage Changes Under the ACA
In FY 2014, 26 states including the District of Columbia expanded Medicaid for low-income adults, either under the direct provisions of the ACA or through waivers (Arkansas, Iowa, and Michigan). For FY 2015, New Hampshire implemented the Medicaid expansion in July 2014, and Pennsylvania received CMS approval of the Healthy Pennsylvania waiver that will expand Medicaid eligibility for low-income adults as of January 1, 2015. As of September 2014, the total number of states implementing the Medicaid expansion is 28 (including DC.) (Figure 4) Two states (Indiana and Utah) continue discussions about implementing the Medicaid expansion. Indiana has submitted a formal waiver application that is under review at CMS; elements of this waiver proposal are discussed throughout the report in relevant sections. Utah’s Governor continues to negotiate with CMS but has not yet made a formal submission. Medicaid officials in several states noted that expanding Medicaid to more low-income adults would be discussed in the next legislative session.

Figure 4: Current Status of State Medicaid Expansion Decisions
With more coverage options available across the income spectrum, some states made changes to existing Medicaid eligibility pathways to better conform to those options. These changes are included in Tables 1 and 2, but are not regarded as restrictions unless individuals previously covered through these pathways would not be expected to have access to coverage through these new options. States making these changes largely fall into three groups: 1) Medicaid expansion states changing Medicaid waiver coverage over 138 percent FPL; 2) States that have not adopted the expansion reducing Medicaid coverage over 100 percent FPL; and 3) States reducing or eliminating certain optional eligibility groups.
Medicaid expansion states changing Medicaid waiver coverage over 138 percent FPL
A few states had expanded eligibility to adults above 138 percent FPL prior to the ACA under waiver authority. With the availability of new coverage options in the Marketplace, seven states (California, Iowa, Massachusetts, New Mexico, New York, Rhode Island and Vermont) eliminated Medicaid coverage in their waivers for adults with incomes over 138 percent FPL. Three of these states (Massachusetts, New York and Vermont) have received or are seeking approval under a Medicaid waiver to use Medicaid funds to provide premium assistance that further subsidizes Marketplace coverage for individuals previously covered under their waiver.
In contrast, three states (Connecticut, DC and Minnesota) maintained coverage of adults with incomes over 138 percent FPL at the state’s regular match (FMAP.) Connecticut is maintaining its eligibility level for parents at 201 percent FPL.1 The District of Columbia is shifting its waiver for adults with income between 138 and 200 percent FPL to its state plan. Minnesota, which previously covered adults up to 275 percent FPL in MinnesotaCare, is maintaining waiver coverage for those up to 200 percent FPL and plans to shift this group to the new Basic Health Plan option in 2015.
| Basic Health Plan |
| At least two states, New York and Minnesota, plan to implement a Basic Health Plan (BHP.) Under the BHP provisions of the ACA, a state receives 95 percent of what the federal government would have spent on premium and cost-sharing subsidies in the Marketplace for the eligible population. The state then provides coverage through a state-managed BHP. While the BHP is not part of Medicaid, it could affect Medicaid in these states. For example, Minnesota currently provides Medicaid to adults with incomes between 138 and 200 percent FPL who would likely be eligible for Marketplace subsidies; the state plans to move these adults to a BHP in 2015. New York plans to implement a BHP starting with immigrants under 200 percent FPL that currently receive coverage funded solely by the state; the BHP would then expand to another 200,000 adults between 138 and 200 percent FPL. |
States that have not adopted the expansion reducing Medicaid coverage over 100 percent FPL
A few states that have not adopted the Medicaid expansion covered adults above 100 percent FPL before the ACA was enacted, largely through waivers. Some of these states made eligibility changes in response to the availability of new Marketplace coverage options in 2014. In states not adopting the Medicaid expansion in 2014, those with incomes above 100 percent FPL in most cases will be eligible for subsidies to purchase coverage in the Marketplace.
- Indiana2 and Oklahoma reduced existing adult eligibility from 200 to 100 percent FPL in waiver renewals.
- Wisconsin reduced eligibility levels for its existing waiver for adults from 200 to 100 percent FPL and expanded coverage to childless adults by eliminating the waiting list for coverage under its existing waiver.
- Maine reduced state plan coverage for parents and caretakers from 133 to 105 percent FPL.
States reducing or eliminating certain optional eligibility groups
The availability of subsidized Marketplace coverage and expanded Medicaid coverage (in 28 states) provides new options for states to reconsider coverage policies for certain optional, limited benefit eligibility groups, such as the family planning group, some spend-down programs, and the Breast and Cervical Cancer Treatment (BCCT) program.3 While most states reported no current plans to change these eligibility pathways; a few states did report eliminations or reductions:
- Nine states reported ending family-planning only coverage (Arizona, Arkansas, Delaware, Michigan, and Oklahoma in FY 2014; Illinois, Louisiana4, New Mexico and Pennsylvania in FY 2015.) Virginia also reduced eligibility for this group to 100 percent FPL in 2014 but plans to restore coverage to 200 percent FPL in 2015.
- Five states (Hawaii, Illinois, and North Dakota in FY 2014 and Kentucky and Pennsylvania in FY 2015) reduced or eliminated eligibility for their medically needy programs for non-elderly non-disabled adults. In contrast, Minnesota increased the medically needy income limit for parents, children, and pregnant women.
- Three states (Arkansas, Maryland in FY 2014; Kentucky in FY 2015) ended or plan to end the BCCT program.
Other Eligibility Changes for Adults
Two states made additional changes to Medicaid eligibility levels for adults aside from the changes made in response to the ACA. Montana increased the cap on enrollment in its Mental Health Services Plan (MHSP) waiver from 800 individuals to 2,000 individuals in FY 2014 and to 6,000 in FY 2015. Maine allowed its existing waiver that covered childless adults up to 100 percent FPL to expire, leaving most of the 9,000 individuals affected by this change without a coverage option, since eligibility for subsidies through the Marketplaces is limited to individuals with incomes above 100 percent FPL.
Eligibility Changes for Elderly Individuals and Those with Disabilities
Few states reported eligibility expansions or restrictions for this group. Two states (Florida in FY 2014 and New Jersey in FY 2015) reported expanding eligibility by increasing income and asset limits while two states (Arkansas and Louisiana) reported reducing or eliminating buy-in programs that allow working individuals with disabilities with higher amounts of income and assets than other elderly or disabled individuals to obtain Medicaid coverage. Two additional states reported more complex changes:
- Indiana’s spend-down program was eliminated as a result of changing its methods for determining disability for Medicaid coverage.5 The spend-down program allowed those that otherwise qualified except for their income/assets to qualify after taking into account their medical expenses. Some of the 31,500 individuals affected by this decision obtained coverage in the Marketplace but some lost coverage. Some of the 31,500 that lost coverage also got assistance from the Medicare Savings Program (which provides Medicaid assistance with Medicare premiums and cost-sharing); the state increased the income limit for this program. Indiana also implemented a 1915(i) HCBS state plan amendment that will result in full Medicaid coverage for those with income up to 300 percent FPL and severe mental health conditions which will also cover some of those that lost spend-down coverage.
- Louisiana eliminated optional coverage for aged and disabled individuals with incomes up to 100 percent FPL. Those that qualify for Supplemental Security Income (SSI, about 74 percent FPL) remain eligible for Medicaid, but approximately 8,000 Medicaid cases were closed as a result of the decision. The state also added an optional coverage group which will provide interim Medicaid-only benefits for those awaiting an SSI determination. Separately, the state implemented spend-down eligibility for four HCBS waivers.
Eligibility Changes for Pregnant Women and Children
Two states (Oklahoma and Louisiana) reduced eligibility for pregnant women to 138 percent FPL in FY 2014. Pregnant women losing eligibility in both states are likely eligible for coverage either through the Marketplace or CHIP in Louisiana. (As such, neither of these changes is counted here as a restriction.) Additionally, California and Rhode Island are working on initiatives to assist pregnant women with incomes above 138 percent FPL to purchase Marketplace coverage using Medicaid funding.
For children, the ACA implemented new policies across all states to help strengthen children’s coverage, such as providing Medicaid coverage to children aging out of foster care up to age 26 and requiring states to maintain eligibility thresholds for children that are at least equal to those in place at the time the ACA was enacted through September 30, 2019. In addition, the law established a minimum Medicaid eligibility level of 138 percent FPL for all children up to age 19. Prior to the ACA, the federal minimum eligibility levels for children varied by age, and the federal minimum for older children ages 6 to 18 was 100 percent FPL. As a result of the law, 21 states needed to transition children from CHIP to Medicaid in 2014; states still receive the enhanced CHIP federal matching rate for coverage of these children. (This change was not included in this report as an eligibility change since coverage for these children continues to be financed with Title XXI funds.)
See Tables 1 and 2 for more information on eligibility changes in FY 2014 and FY 2015.
Enrollment Procedures
In addition to changes in eligibility standards, some states were adopting options to further streamline application and renewal processes beyond those required by the ACA. States were also asked to report on implementation of hospital presumptive eligibility, efforts to coordinate with the Marketplaces, status of application backlogs, and plans for the next open enrollment period for Marketplace coverage.
Streamlining Options
Beyond changes required by the ACA, CMS offered states (in a letter dated May 17, 2013) the opportunity for expedited waivers for several new options that would further streamline application and renewal processes and facilitate enrollment. A majority of states implemented one of these options, namely to delay the annual Medicaid eligibility redeterminations that would normally have occurred during the first quarter of calendar 2014. For individuals scheduled for eligibility redetermination during this period, this waiver allowed Medicaid coverage to continue while staff were adjusting to the new MAGI income counting rules in all states and were focused on implementing the ACA Medicaid expansion in about half of states. Several states asked for and received extensions beyond March 31st that further delayed renewals for Medicaid enrollees. Also, as reported last year, about one third of states adopted an option to implement the MAGI rules before January 1, 2014. As of August 2014, CMS had approved the following states to use the remaining streamlining options:
- Seven states (Arkansas, California, Illinois, Michigan, New Jersey, Oregon, and West Virginia) were approved to facilitate enrollment into Medicaid through administrative data transfer using Supplemental Nutrition Assistance Program (SNAP) data.
- Four states (California, New Jersey, Oregon, and West Virginia) were approved to enroll parents based on income data available from their children’s eligibility application.
- No state had an approved waiver to adopt 12 month continuous eligibility for adults under this option.
States were asked about their plans to adopt these options in FY 2015. Washington reported plans to adopt the administrative data transfer option, and Kansas planned to implement 12 month continuous eligibility for adults. Several states noted that they have adopted strategies (e.g. express lane eligibility) that use SNAP data to facilitate Medicaid enrollment or target outreach. New York also reported having adopted 12 month continuous eligibility for adults, but under their existing 1115 waiver.6
Hospital Presumptive Eligibility (HPE)
Starting in January 2014, the ACA allows qualified hospitals to make Medicaid presumptive eligibility determinations in accordance with an approved State Plan Amendment. CMS issued HPE rules governing the state implementation of HPE on January 24, 2014, which delayed adoption in many states.7 Only 11 states reported implementing HPE in January (with later CMS approval). At the time of the survey, an additional 18 states had implemented HPE and three other states with approved plans expected to implement in the fall. Another 17 states reported that they had submitted state plan amendments to CMS but had not yet received approval; these states were in various stages of discussions with CMS and were also developing training materials. Four states indicated that their HPE plans were still under development. States reported a great deal of variation in hospital participation levels and in the volume of applications received through HPE. Among states that implemented HPE early, hospital participation ranged from only a few in some states to the majority of Medicaid hospitals. Some states indicated that hospitals were not interested in participating because it was easy to enroll individuals in Medicaid using “real time” on-line eligibility systems.
| Other Key Enrollment Issues Related to the Marketplace |
|
Marketplace Interface. Almost all states experienced challenges in establishing a smooth interface between Medicaid and the Marketplace, whether the Marketplace was a Federally Facilitated Marketplace (FFM), State-Based Marketplace (SBM), or a Federal Partnership Marketplace (FPM). This interface required an unprecedented level of cooperation across agencies (within state government, and/or between states and federal agencies) and across IT systems. Medicaid programs with fully operational SBMs reported the fewest interface issues. In at least six states (Kentucky, Minnesota, New York, Rhode Island, Vermont, and Washington) the eligibility system is shared by Medicaid and the Marketplace, resulting in an absence of file transfer issues. Most states that relied on healthcare.gov for Marketplace enrollment (including all FFM and FPM states, as well as two Federally-supported SBM states) indicated that initial file transfers, which were “flat files”, were unusable. Most of these states report that they began receiving usable account transfers (rather than the flat files) sometime between March and June of 2014 and most states have adopted system modifications or other solutions to process applications. At the time of the survey, a limited number of states reported that they were still unable to interface with the FFM. All but one of the SBM states indicated that the Medicaid agency was able to transfer files to the SBM and most of the states relying on the Federal Marketplace website (30 of the 36) also indicated that they were able to send files to the Marketplace. Others indicated that this functionality was being developed.
–
Application Processing Backlogs. The majority of states (31) reported that as of June 1, 2014 they had a backlog of Medicaid applications; the relative size of the backlog, while not collected across all states, varied substantially. States reported a variety of reasons for the backlogs including the sheer volume of applications; limited administrative capacity; large influx of applications from the FFM between March and June; pending verifications for income, citizenship and identity; incompatible data transferred from the FFM; and duplicate applications. Some states indicated that as of the date of the survey the backlog had been eliminated. Most states were seeing significant reductions in the backlogs and hoped to eliminate them with the exception of unresolved system or data issues. Thirteen states were asked by CMS to update their mitigation plans over the summer. As states worked through these backlogs, a number of them noted that a sizeable share of the applications yet to be processed were due to duplicate applications or applications from individuals who had started an application in one place but had completed a separate application in another way (e.g. started with an application at healthcare.gov but then applied again through the state Medicaid office.)
–
Preparation for Next Open Enrollment Period. States were asked to describe any issues on which they were focusing in preparation for the next Marketplace open enrollment period (beginning November 15, 2014, for coverage in January 2015). Many states have made or are making systems modifications to create a more seamless transition of applications from the Marketplace to the Medicaid agency. At least one state (North Dakota) changed from an assessment state to a “determination state” in which the Marketplace will make Medicaid eligibility determinations. Some states will be increasing staff resources and adding training for eligibility staff and for Marketplace navigators and other assisters. A few states are changing their Marketplace model: Nevada and Oregon are moving from SBMs to “Federally-supported SBMs” and will use healthcare.gov for Marketplace applications and enrollment; Idaho and New Mexico are working on efforts to move from Federally-supported SBMs to fully State-based Marketplaces; Idaho reported plans to make this transition for the next open enrollment period while New Mexico is planning to make this transition at a later date. A number of states mentioned developing policies and notices related to renewal (of Medicaid and Marketplace coverage) was also a focus; many states noted that this will be the first year handling both renewals and new enrollments since the ACA was implemented (as noted earlier, a number of states obtained waivers from CMS last year to delay renewals that would have otherwise occurred during the open enrollment period last year.) Several states were concerned about having adequate time to make the necessary adjustments to their systems, procedures or policies if the federal government makes changes.
|
TABLE 1: CHANGES TO ELIGIBILITY STANDARDS IN ALL 50 STATES AND DC, FY 2014 and 2015 |
||||||
| Eligibility Standard Changes | ||||||
| STATES | FY 2014 | FY 2015 | ||||
| (+) | (-) | (#) | (+) | (-) | (#) | |
| Alabama | ||||||
| Alaska | ||||||
| Arizona | X | X | ||||
| Arkansas | X | X | X | |||
| California | X | X | X | |||
| Colorado | X | X | ||||
| Connecticut | X | |||||
| Delaware | X | X | ||||
| DC | X | |||||
| Florida | X | |||||
| Georgia | ||||||
| Hawaii | X | X | ||||
| Idaho | ||||||
| Illinois | X | X | X | |||
| Indiana | X | X | X | |||
| Iowa | X | X | ||||
| Kansas | ||||||
| Kentucky | X | X | ||||
| Louisiana | X | X | X | X | ||
| Maine | X | X | ||||
| Maryland | X | X | ||||
| Massachusetts | X | X | ||||
| Michigan | X | X | ||||
| Minnesota | X | X | ||||
| Mississippi | ||||||
| Missouri | ||||||
| Montana | X | X | ||||
| Nebraska | ||||||
| Nevada | X | |||||
| New Hampshire | X | |||||
| New Jersey | X | X | ||||
| New Mexico | X | X | ||||
| New York | X | X | ||||
| North Carolina | ||||||
| North Dakota | X | X | ||||
| Ohio | X | |||||
| Oklahoma | X | |||||
| Oregon | X | X | ||||
| Pennsylvania | X | X | ||||
| Rhode Island | X | X | X | |||
| South Carolina | ||||||
| South Dakota | ||||||
| Tennessee | ||||||
| Texas | ||||||
| Utah | X | |||||
| Vermont | X | X | ||||
| Virginia | X | X | X | |||
| Washington | X | |||||
| West Virginia | X | |||||
| Wisconsin | X | X | ||||
| Wyoming | ||||||
| Totals | 31 | 4 | 24 | 8 | 0 | 6 |
|
NOTES: DC, HI, MA, and VT are counted as expanding coverage through the adoption of the ACA Medicaid expansion even though these states had expanded full coverage to both adults and parents previously. |
||||||
Table 2: Eligibility Changes in the 50 States and the District of Columbia, FY 2014 and FY 20158 |
||
|
State |
Fiscal Year | Eligibility Changes |
| Alabama | 2014 | |
| 2015 | ||
| Alaska | 2014 | |
| 2015 | ||
| Arizona | 2014 | Adults (+): Implemented the Medicaid expansion as of Jan. 2014, increasing eligibility for adults up to 138% FPL. As part of the expansion, the state lifted the enrollment cap for childless adults in its existing 1115 waiver program and transitioned this group to the new Medicaid expansion adult group. (affected 208,000 individuals) Adults (#): Eliminated Family Planning–only group in FY 2014. (affected 5,105 individuals) |
| 2015 | ||
| Arkansas | 2014 | Adults (+): Implemented Medicaid expansion through an 1115 waiver as of Jan. 2014, increasing eligibility for adults up to 138% FPL. (affected 250,000 individuals) Elderly and Disabled Adults (-): Eliminated the Buy-in for Workers with Disabilities program December 31, 2013. Adults (#): Eliminated the Breast and Cervical Cancer Treatment Program in FY 2014. (affected 855 individuals) Adults (#): Eliminated Family Planning–only group in FY 2014. (affected 57,877 individuals) |
| 2015 | ||
| California | 2014 | Adults (+): Implemented Medicaid expansion as of Jan. 2014, increasing eligibility for adults up to 138% FPL. This includes transitioning adults covered under its existing 1115 waiver program to the new Medicaid expansion adult group. Adults (#): Coverage of adults under the Health Care Coverage Initiative, a program that used Medicaid funds to cover adults with incomes between 133% and 200% FPL on a county-by-county basis under the state’s 1115 Bridge to Reform waiver, ended December 31, 2013. Children (+): Maintained eligibility for former foster care youth who age out of Medi-Cal at age 21 six months ahead of the ACA requirement. (affected approx. 166 individuals per month) |
| 2015 | Pregnant Women (+): Plan to implement a new affordability and benefit wrap program using Medicaid funding for pregnant women over 133% FPL. | |
| Colorado | 2014 | Adults (+): Implemented Medicaid expansion as of Jan. 2014, increasing eligibility for adults up to 138% FPL. This includes lifting the enrollment cap in their existing 1115 waiver and transitioning those covered under this program to the new Medicaid expansion adult group. Children (+): Implemented continuous eligibility for children. (affected 4,286 individuals) |
| 2015 | Children (+): Implement the option to eliminate the 5-year bar on eligibility for legally-residing immigrant children. (estimated to affect 1,699 individuals) | |
| Connecticut | 2014 | Adults (+): Implemented Medicaid expansion as of Jan. 2014, increasing eligibility for adults up to 138% FPL. This includes transitioning adults covered under their Low-Income Adult waiver program to the new Medicaid expansion adult group. Adults (nc): Coverage for parents up to 201% FPL was maintained. |
| 2015 | ||
| Delaware | 2014 | Adults (+): Implemented Medicaid expansion as of Jan. 2014, increasing eligibility for adults up to 138% FPL. This includes transitioning adults covered under their existing 1115 waiver to the new Medicaid expansion adult group. (affected 6,500 individuals) Adults (#): Eliminated Family Planning–only group. (affected 2,072 individuals) |
| 2015 | ||
| District of Columbia | 2014 | Adults (+): Implemented the Medicaid expansion as of Jan. 2014, increasing eligibility for adults up to 138% FPL. This includes transitioning adults covered under their existing early expansion state plan group to the new Medicaid expansion adult group. Adults (nc): Coverage for its existing 1115 waiver for adults above 138% FPL was maintained. Adults (nc): Implemented Medicaid enrollment suspension for incarcerated adults. |
| 2015 | Adults (nc): Plan to transition adults with incomes above 138% FPL from a Medicaid waiver to Medicaid state plan. (estimated to affect 6,258 individuals) | |
| Florida | 2014 | Elderly and Disabled (+): Increased the minimum monthly maintenance income allowance and excess standard for community spouses of institutionalized people. (The number of nursing home residents eligible for Medicaid is also affected by 2014 cost of living adjustments and increases in the average private pay nursing home rate.) |
| 2015 | ||
| Georgia | 2014 | |
| 2015 | ||
| Hawaii | 2014 | Adults (+): Implemented Medicaid expansion as of Jan. 2014, for adults up to 138% FPL and transferred some existing waiver populations to Medicaid expansion. Adults (#): Eliminated Medically Needy Spend-down coverage for non-elderly non-disabled adults in FY 2014. |
| 2015 | ||
| Idaho | 2014 | |
| 2015 | ||
| Illinois | 2014 | Adults (+): Implemented Medicaid expansion as of Jan. 2014, increasing eligibility for adults up to 138% FPL. (affected 385,000 individuals) Adults (#): Medically Needy Spend-down coverage for parents was eliminated. (affected10,800 individuals) |
| 2015 | Adults (nc): Plan to transition The state’s existing 1115 waiver (Cook County Care) was extended through June 2014; adults will be transitioned to the new Medicaid expansion adult group July 2014. Adults (#): Illinois is in the final year of operating its Family Planning waiver, which is being phased out. (estimated to affect 65,000 individuals) |
|
| Indiana | 2014 | Adults (#): Reduced income levels for the state’s existing 1115 waiver (HIP), for adults from 200% to 100% FPL per waiver renewal. (affected 11,900 individuals) Adults (+): HIP enrollment cap for childless adults under the Healthy Indiana Plan was increased per waiver renewal. Elderly and Disabled (-): Converted from 209(b) to 1634 for aged, blind and disabled. As a result 209(b) related spend-down is no longer available. Some of these individuals with income above 100% FPL are expected to have other coverage options in the Marketplace, under Medicaid through the Medicare Savings Program, or under the new BPHC Medicaid program (described below), but some are expected to lose coverage. (affected 31,500 individuals) Elderly and Disabled (+): Increased the income eligibility level for the Medicare Savings Program. (affected 47,000 individuals) Elderly and Disabled (+): Implemented a new program, Behavioral and Primary Healthcare Coordination (BPHC) under a 1915i state plan option. Adults with serious mental illness with income up to 300% FPL that do not otherwise qualify for Medicaid coverage or other third party coverage will qualify for full Medicaid benefits. |
| 2015 | Adults (Proposed): The state has submitted a waiver proposal, HIP 2.0, which would use the state’s existing HIP program as a platform for an alternative Medicaid expansion, increasing eligibility for adults up to 138% FPL. The waiver has not been approved by CMS at the time of this report. | |
| Iowa | 2014 | Adults (+): Implemented the Medicaid expansion as of Jan. 2014, through an 1115 waiver (Iowa Health and Wellness Plan), increasing eligibility for adults up to 138% FPL. This includes transitioning adults covered under their existing 1115 waiver (IowaCare) to the new Medicaid expansion adult group. Adults (#): The state’s existing 1115 waiver (IowaCare) which covered adults up to 200% FPL expired December 31, 2013. |
| 2015 | ||
| Kansas | 2014 | |
| 2015 | ||
| Kentucky | 2014 | Adults (+): Implemented the Medicaid expansion as of Jan. 2014, increasing eligibility for adults up to 138% FPL. |
| 2015 | Adults (#): Plan to eliminate Medically Needy Spend-down coverage for non-elderly non-disabled adults and optional Breast and Cervical Cancer Treatment Program in Jan. 2015. (estimated to affect 4,400 individuals and 480 individuals respectively) | |
| Louisiana | 2014 | Elderly and Disabled (+): Implemented spend-down eligibility for four HCBS waivers (allows individuals to spend down to 300% federal SSI waiver eligibility level). Elderly and Disabled (-): No longer determine eligibility for the optional coverage of aged and disabled individuals under 100% FPL. They are referred to SSA for determination under our 1634 agreement. (Closed 8,000 cases) Elderly and Disabled (-): Reduced the income and resource standards for TWWIIA Basic coverage group (Medicaid Purchase Plan). Elderly and Disabled (+): Added optional coverage group to implement the State Provisional Medicaid Program which will provide interim Medicaid-only benefits to eligible individuals until such time that a decision has been rendered on their SSI cash assistance application pending with the Social Security Administration. Pregnant Women (#): Eliminated optional coverage of pregnant women with incomes between 133% and 200% FPL. Pregnant women over 133% moved to CHIP. |
| 2015 | Adults (#): Plan to eliminate Family Planning waiver for those over 138% FPL. Those with income below 133% FPL will move from waiver to state plan. (7,200 individuals) | |
| Maine | 2014 | Adults (#): Reduced parent/caretaker income levels from 133% to 100% FPL. (affected 14,000 individuals) Adults (-): Maine’s 1115 waiver that covered adults without dependent children up to 100% FPL expired. (affected 9,000 individuals) |
| 2015 | ||
| Maryland | 2014 | Adults (+): Implemented Medicaid expansion as of Jan. 2014, increasing eligibility for adults up to 138% FPL. This includes transitioning adults covered under their existing 1115 waiver to the new Medicaid expansion coverage group. Adults (#): Eliminated Breast and Cervical Cancer Treatment Program in FY 2014. |
| 2015 | ||
| Massachusetts | 2014 | Adults (+): Implemented the Medicaid expansion as of Jan. 2014, which covers adults up to 138% FPL. This includes transitioning approximately 256,207 adults covered under their existing 1115 waiver program to the new adult expansion group. Adults (#): The state eliminated Medicaid waiver coverage for some adults with income over 138% FPL. Adults (+): The state is using Medicaid funds to provide premium assistance to those previously covered under the state’s Medicaid waiver with incomes between 138% FPL and 300% FPL using Medicaid dollars. Other (+): Cover adults 19 and 20 up to 150% FPL in MassHealth Standard. (27,300) |
| 2015 | ||
| Michigan | 2014 | Adults (+): Implemented the Medicaid expansion as of April 1, 2014, through an 1115 waiver, increasing eligibility for adults up to 138% FPL. This includes transitioning adults covered under an existing 1115 waiver program to the new adult expansion group. (350,000; 50,000 of whom were eligible for the state’s existing 1115 waiver) Adults (#): Eliminated Family Planning –only group in FY 2014. (30,000) |
| 2015 | ||
| Minnesota | 2014 | Adults (+): Implemented the Medicaid expansion as of Jan. 2014, which covers individuals up to 138% FPL. This includes transitioning some individuals from their existing MinnesotaCare 1115 waiver program to the new adult expansion group as well as those covered by their early expansion Medicaid state plan option. Other (+): Medically needy income level for parents/caretakers, children and pregnant women increased to 133% FPL. Adults (nc): Waiver renewal maintains MinnesotaCare coverage for 138 to 200% FPL group. Adults (#): Reduced income level for MinnesotaCare adults from 275% to 200% FPL. |
| 2015 | Other (not Medicaid): Minnesota expects to transition to a Basic Health Plan for 2015. | |
| Mississippi | 2014 | |
| 2015 | ||
| Missouri | 2014 | |
| 2015 | ||
| Montana | 2014 | Other (+): Raised cap on 1115 MHSP waiver from 800 to 2000 adults with SMI. |
| 2015 | Other (+): Raised cap on 1115 MHSP waiver from 2000 to 6000 adults with SMI. | |
| Nebraska | 2014 | |
| 2015 | ||
| Nevada | 2014 | Adults (+): Implemented the Medicaid expansion as of Jan. 2014, increasing eligibility for adults up to 138% FPL. (88,407 childless adults and 36,202 parents/caretakers) |
| 2015 | ||
| New Hampshire | 2014 | |
| 2015 | Adults (+): Implemented the Medicaid expansion as of July 1, 2014, through an 1115 waiver (New Hampshire Health Protection Program), increasing eligibility for adults up to 138% FPL. (estimated to affect 50,000 individuals) | |
| New Jersey | 2014 | Adults (+): Implemented Medicaid expansion as of Jan. 2014, increasing eligibility for adults up to 138% FPL. This includes transitioning adults covered under their existing 1115 waiver to the new Medicaid expansion coverage group. (affected 100,000 individuals) |
| 2015 | Medically Needy (+): New Jersey will be implementing the “Miller Trust” option to enable additional individuals to qualify for community-based Long Term Supports and Services.9 | |
| New Mexico | 2014 | Adults (+): Implemented Medicaid expansion as of Jan. 2014, increasing eligibility for adults up to 138% FPL. This includes transitioning some adults covered under their existing 1115 waiver (State Coverage Initiative) to the new Medicaid expansion coverage group. (affected 31,500 individuals) Adults (#): Eliminated 1115 waiver coverage (State Coverage Initiative) between 138% FPL and 200% FPL. |
| 2015 | Adults (#): Plan to eliminate Family Planning–only group in FY 2015. (estimated to affect 37,400 individuals) | |
| New York | 2014 | Adults (+): Implemented the Medicaid expansion as of Jan. 2014, increasing eligibility for adults up to 138% FPL. As part of implementing the Medicaid expansion, the state transitioned some of adults covered under their existing 1115 waiver (Family Health Plus) to the new Medicaid expansion coverage group. Adults (#): Eliminated 1115 waiver coverage (Family Health Plus) for adults with incomes above 138% FPL. Adults (+): The state is pursuing waiver authority to establish the Qualified Health Plans Premium Assistance Program, which would provide premium assistance to those previously covered under the state’s Medicaid waiver with income between 138% FPL and 150% FPL using Medicaid dollars. (affected approx. 35,000 individuals) |
| 2015 | Other (Not Medicaid): Plans to start the Basic Health Plan with certain immigrants, who are currently paid for with state-only funds, with income up to 200% FPL. New York will then expand to an estimated 200,000 more people with incomes between 138% – 200% FPL. | |
| North Carolina | 2014 | |
| 2015 | ||
| North Dakota | 2014 | Adults (+): Implemented the Medicaid expansion as of Jan. 2014, increasing eligibility for adults up to 138% FPL. (affected 10,000 individuals) Adults (#): Eliminated Medically Needy Spend-down coverage for non-elderly non-disabled adults in FY 2014. |
| 2015 | ||
| Ohio | 2014 | Adults (+): Implemented Medicaid expansion as of Jan. 2014, increasing eligibility for adults up to 138% FPL. This includes transitioning some adults covered under their existing 1115 waiver (Cuyahoga County MetroHealth) to the new Medicaid expansion coverage group. |
| 2015 | ||
| Oklahoma | 2014 | Adults (#): As part of a one-year extension, eligibility for individuals under the Individual Plan will be reduced from 200% FPL to 100% FPL. (affected 8,000 individuals) Pregnant Women (#): Reduced eligibility level for pregnant women down to 138% FPL. (affected 4,731 individuals) Adults (#): Reduced family planning waiver from 185% to 138% FPL. (affected 8,762 individuals) |
| 2015 | ||
| Oregon | 2014 | Adults (+): Implemented the Medicaid expansion as of Jan. 2014, increasing eligibility for adults up to 138% FPL. As part of implementing the Medicaid expansion, the state transitioned adults covered under their existing 1115 waiver to the new Medicaid expansion coverage group. (affected 60,000 individuals) Adults & Children (#): Eliminated Medicaid Premium Assistance programs for adults and children with incomes below 200% FPL. (affected 5000 adults and 12,400 children) |
| 2015 | ||
| Pennsylvania | 2014 | |
| 2015 | Adults (+): Implementing the Healthy PA Section 1115 waiver January 1, 2015,which increases Medicaid eligibility for adults up to 138% FPL. (estimated to affect 600,000 individuals) Adults (#): Plan to eliminate Medically Needy Spend-down coverage for non-elderly non-disabled adults. (estimated to affect 3,119 individuals) Adults (#): Plan to eliminate Family Planning–only group. (estimated to affect 90,000 individuals) |
|
| Rhode Island | 2014 | Adults (+): Implemented the Medicaid expansion as of Jan. 2014, increasing eligibility for adults up to 138% FPL. This includes transitioning adults covered under their existing 1115 waiver to the new Medicaid expansion coverage group. (affected 50,000 individuals) Parents (#): Eliminated Medicaid coverage for parents from 138% to 175% FPL. (affected 4,000 individuals) |
| 2015 | Pregnant Women (+): State will be exploring a Premium Assistance Program for Pregnant women over 133% FPL who wish to enroll in a qualified health plan. | |
| South Carolina | 2014 | |
| 2015 | ||
| South Dakota | 2014 | |
| 2015 | ||
| Tennessee | 2014 | |
| 2015 | ||
| Texas | 2014 | |
| 2015 | ||
| Utah | 2014 | Adults (#): Reduced eligibility for the state’s existing 1115 waiver (PCN) from 150% to 100% FPL. Enrollment cap remains in place. |
| 2015 | ||
| Vermont | 2014 | Adults (+): Implemented the Medicaid expansion as of Jan. 2014, covering adults up to 138% FPL. This includes transitioning some of the adults covered under their existing 1115 waiver to the new Medicaid expansion coverage group. Adults (#): Reduced Medicaid eligibility levels to 138% FPL. Adults (+): Implementing Vermont Premium Assistance which uses Medicaid funds to provide subsidies for Marketplace coverage in addition to marketplace subsidies. Also implementing the Vermont cost sharing reduction subsidies that reduce copays and deductibles for Marketplace products for individuals and families with incomes below 300% FPL.Children (nc); Increased income standard for children in Medicaid state plan to incorporate waiver expansion group. |
| 2015 | Other (nc): Submitted SPA to disregard asset tests for non-ABD medically needy. | |
| Virginia | 2014 | Adults (#): Reduced income eligibility for Family Planning waiver to 100% FPL. |
| 2015 | Adults (#): Plan to restore income eligibility for Family Planning waiver to 200% FPL.Adults (+): Plan to implement 1115 waiver with limited benefits to extend coverage to adults with incomes below 100% FPL with severe mental illness. | |
| Washington | 2014 | Adults (+): Implemented the Medicaid expansion as of Jan. 2014, increasing eligibility for adults up to 138% FPL. This includes transitioning adults covered under their existing 1115 waiver to the new Medicaid expansion coverage group.(affected 390,000 individuals) |
| 2015 | ||
| West Virginia | 2014 | Adults (+): Implemented the Medicaid expansion as of Jan. 2014, increasing eligibility for adults up to 138% FPL. |
| 2015 | ||
| Wisconsin | 2014 | Adults (+): Eliminated the enrollment cap that was part of the previous waiver for Childless Adults up to 100% FPL. (affecting 93,000 individuals) Adults (#): Reduced the income limit for parents/caretakers and childless adults from 200% FPL to 100% FPL. (affecting 55,000 individuals) |
| 2015 | ||
| Wyoming | 2014 | |
| 2015 | ||
Delivery System Reforms
Use of Managed Care
Managed care has become the main delivery system for Medicaid in most states, as Medicaid programs increasingly have turned to managed care as a means to help assure access, improve quality and achieve budget certainty. As of July 2014, all states except three – Alaska, Connecticut and Wyoming – had in place some form of managed care. Across the 48 states with some form of managed care, a total of 39 states including DC had contracts with comprehensive risk-based managed care organizations (MCOs); 22 states administered a Primary Care Case Management (PCCM) program, a managed fee-for-service based system in which beneficiaries are enrolled with a primary care providers who are paid a small fee to provide case management services in addition to primary care. Of the 48 states that operate some form of managed care, a total of 13 states operate both MCOs and a PCCM program while 26 states (including DC) operate MCOs only and nine states operate PCCM programs only.1 (Figure 5) In addition, 20 states contracted with one or more limited-benefit risk-based prepaid health plans to provide behavioral health, dental care, maternity care, non-emergency medical transportation, or other benefits.
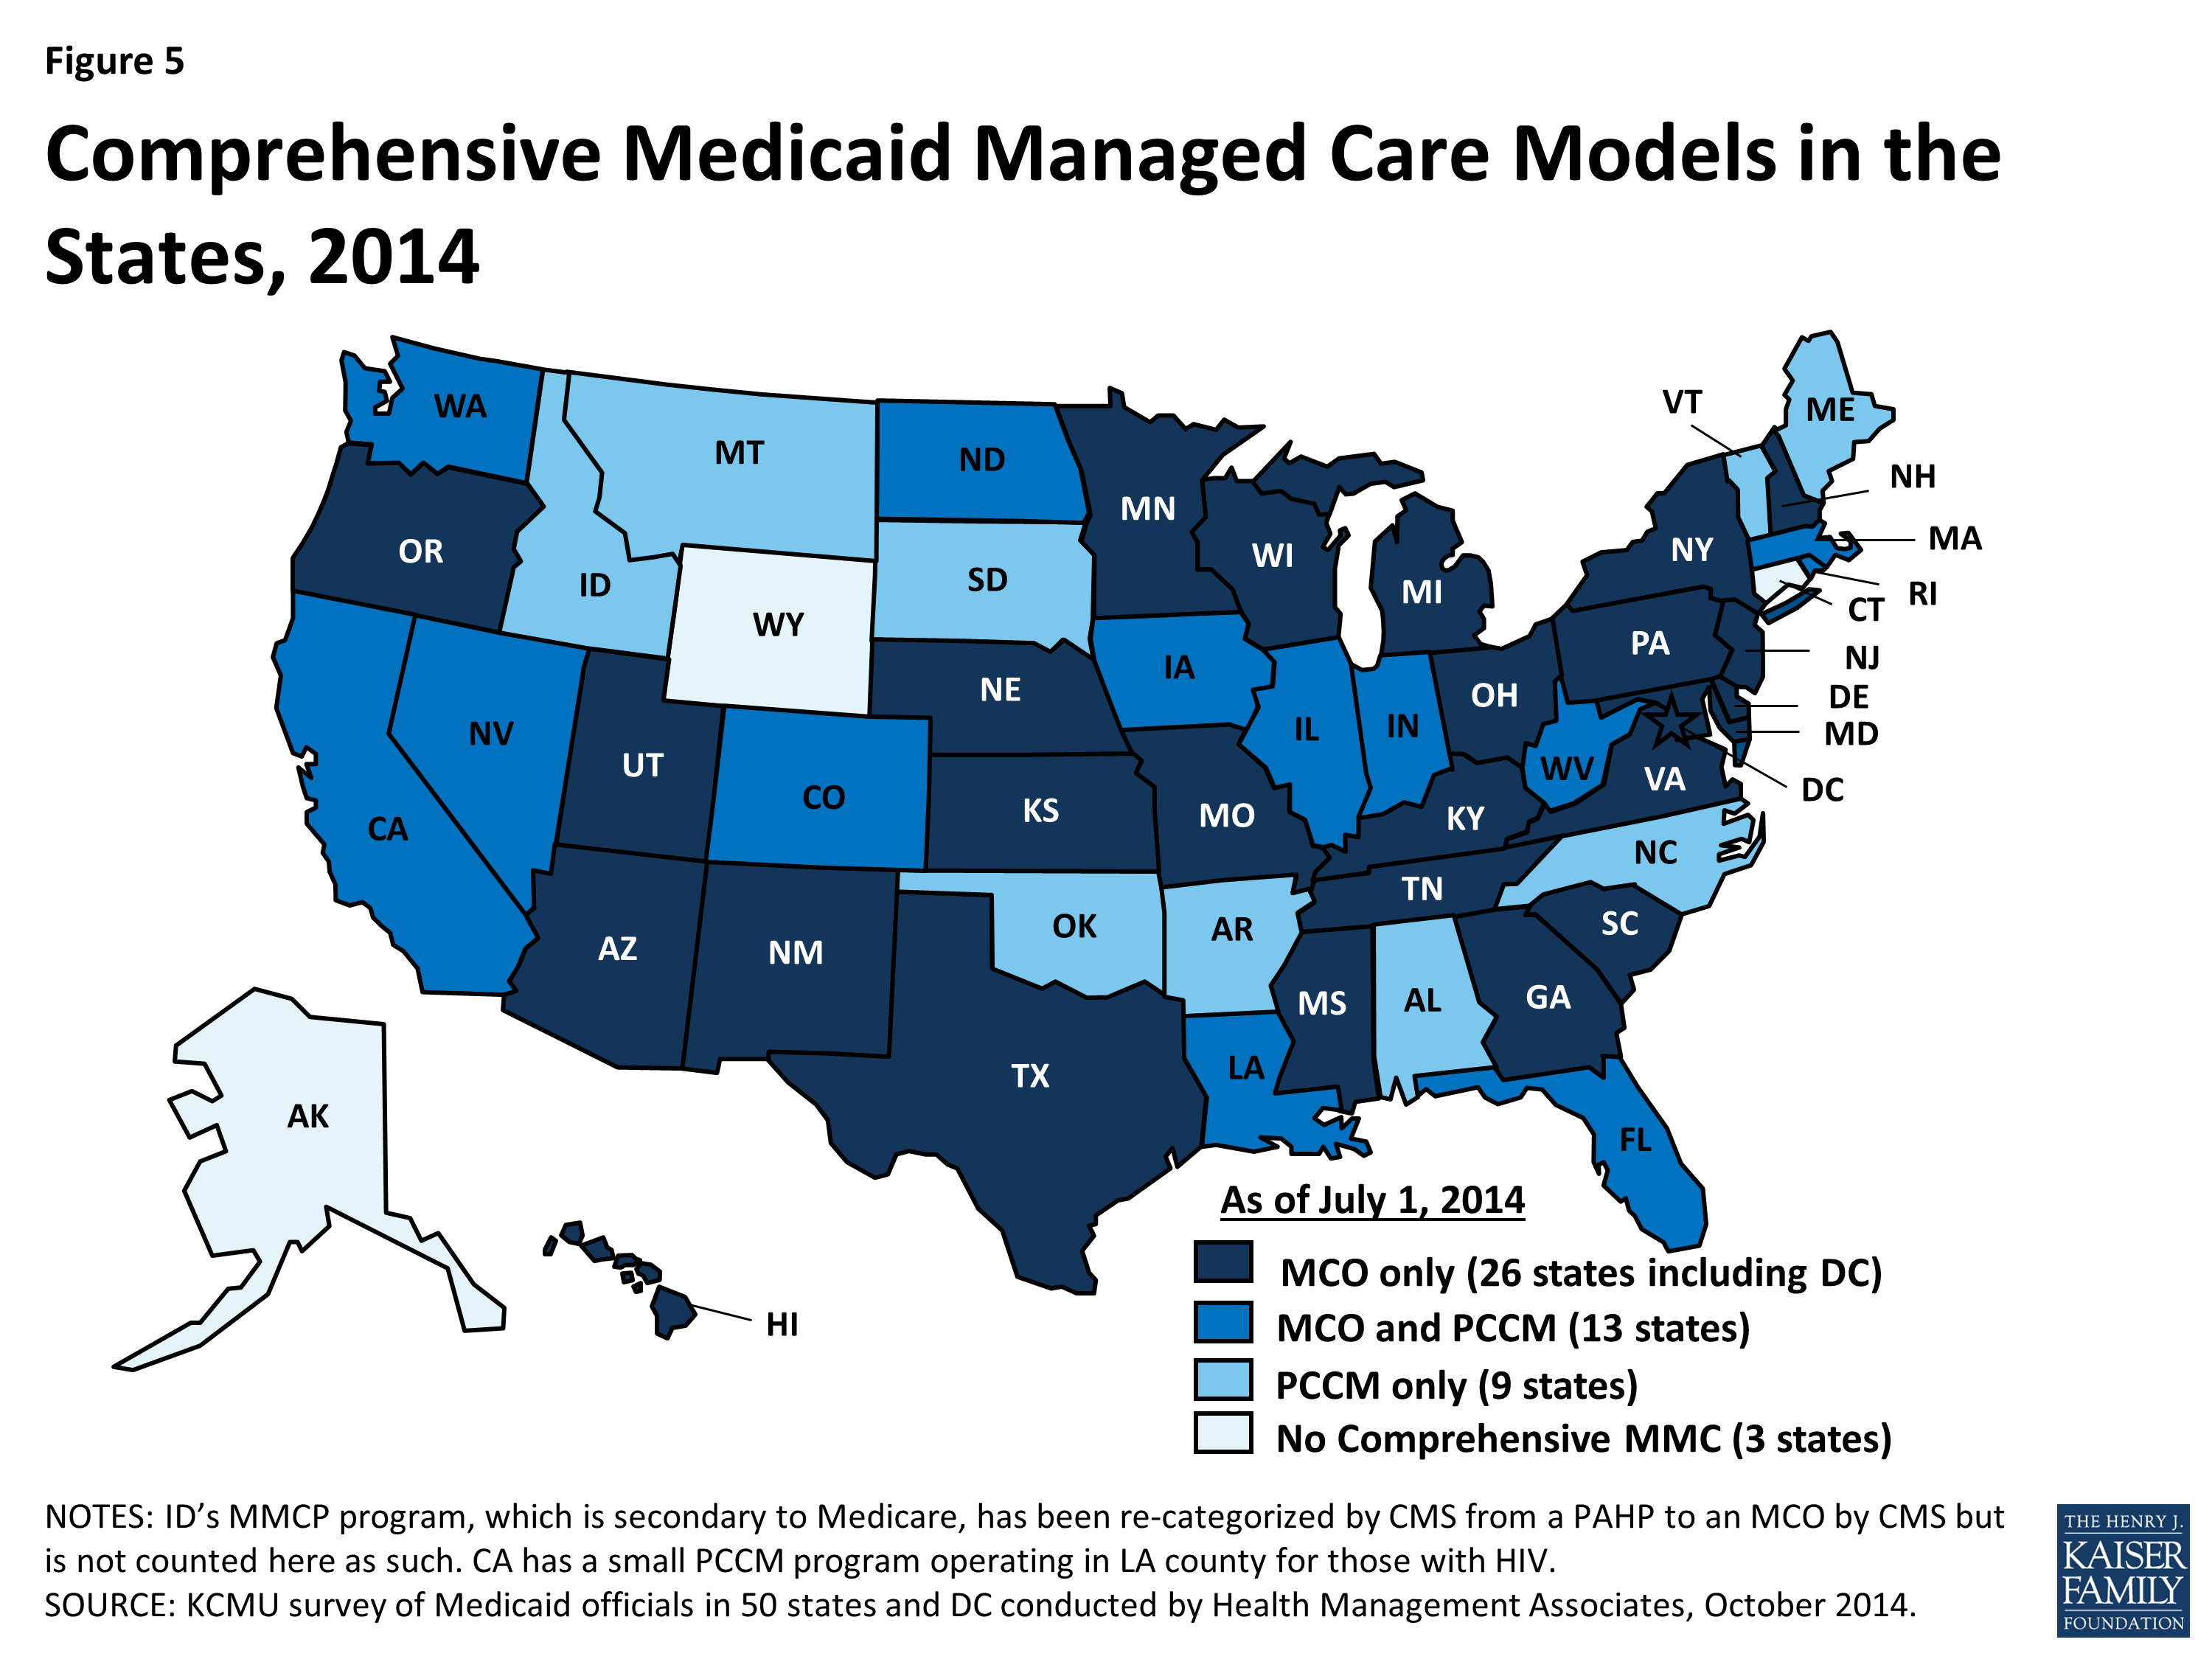
Figure 5: Comprehensive Medicaid Managed Care Models in the States, 2014
The share of Medicaid beneficiaries enrolled in MCOs, PCCM programs or remaining in fee-for-service varies widely by state. The share enrolled in MCOs, however, has steadily increased as states have expanded their managed care programs to new regions, to new populations and made MCO enrollment mandatory for additional eligibility groups. Among the 39 states (including DC) with MCOs, 16 states reported that over 75 percent of their beneficiaries were enrolled in MCOs as of July 1, 2014.
Notable shifts to increase the use of risk-based managed care during FY 2014 and FY 2015 include two states (New Hampshire and North Dakota) that implemented new risk-based managed care programs. In addition, states like Florida and New Mexico, which have many years of experience with managed care, implemented new expansive statewide managed care programs in FY 2014. Six states (Florida, Indiana, Louisiana, Oregon, South Carolina, and Utah) have ended or plan to end their PCCM programs in FY 2014 or FY 2015 and are transitioning these groups to risk-based managed care organizations. However, not every state has moved in this direction. For example, Vermont currently operates an enhanced-PCCM program and is expanding its use of ACOs as part of its State Innovation Model (SIM) grant.2 Connecticut terminated its MCO contracts in 2012 and now operates its program on a fee-for-service basis using four administrative services only (ASO) entities to manage medical, behavioral health, dental and non-emergency transportation services. The ASOs are accountable for specific performance metrics common to managed care, but the state does not describe its system as managed care.
Risk Based Managed Care Expansions
In both FY 2014 and in FY 2015, states continued to take actions to increase enrollment in managed care. Of the 39 states (including DC) with MCOs, a total of 34 states indicated that they made specific policy changes to increase the number of enrollees in MCOs; no states with MCOs took any action designed to restrict MCO enrollment. The most common strategy was to expand voluntary or mandatory enrollment to additional eligibility groups (25 states in FY 2014 and 19 states in FY 2015.) The eligibility group most commonly added to MCOs was the newly eligible adult group in states adopting the ACA Medicaid expansion.
Other commonly noted eligibility groups added to managed care included children (such as those in foster care, adoption subsidy or juvenile justice systems in Florida, Georgia, Nebraska, Texas, and Virginia as well as other groups of children in California, Florida, and Mississippi); those dually eligible for Medicare and Medicaid (California, Florida, Illinois, New York, Ohio, Rhode Island, South Carolina and Virginia); and other elderly individuals or those with disabilities (Indiana, Louisiana, Nebraska, New York, New Jersey, Ohio, South Carolina, Texas, and Virginia). In addition, six states made enrollment mandatory for specific eligibility groups in FY 2014, and nine states are doing so in FY 2015. Geographic expansions for MCO service areas occurred in eight states in FY 2014, and in six states in FY 2015. (Figure 6)
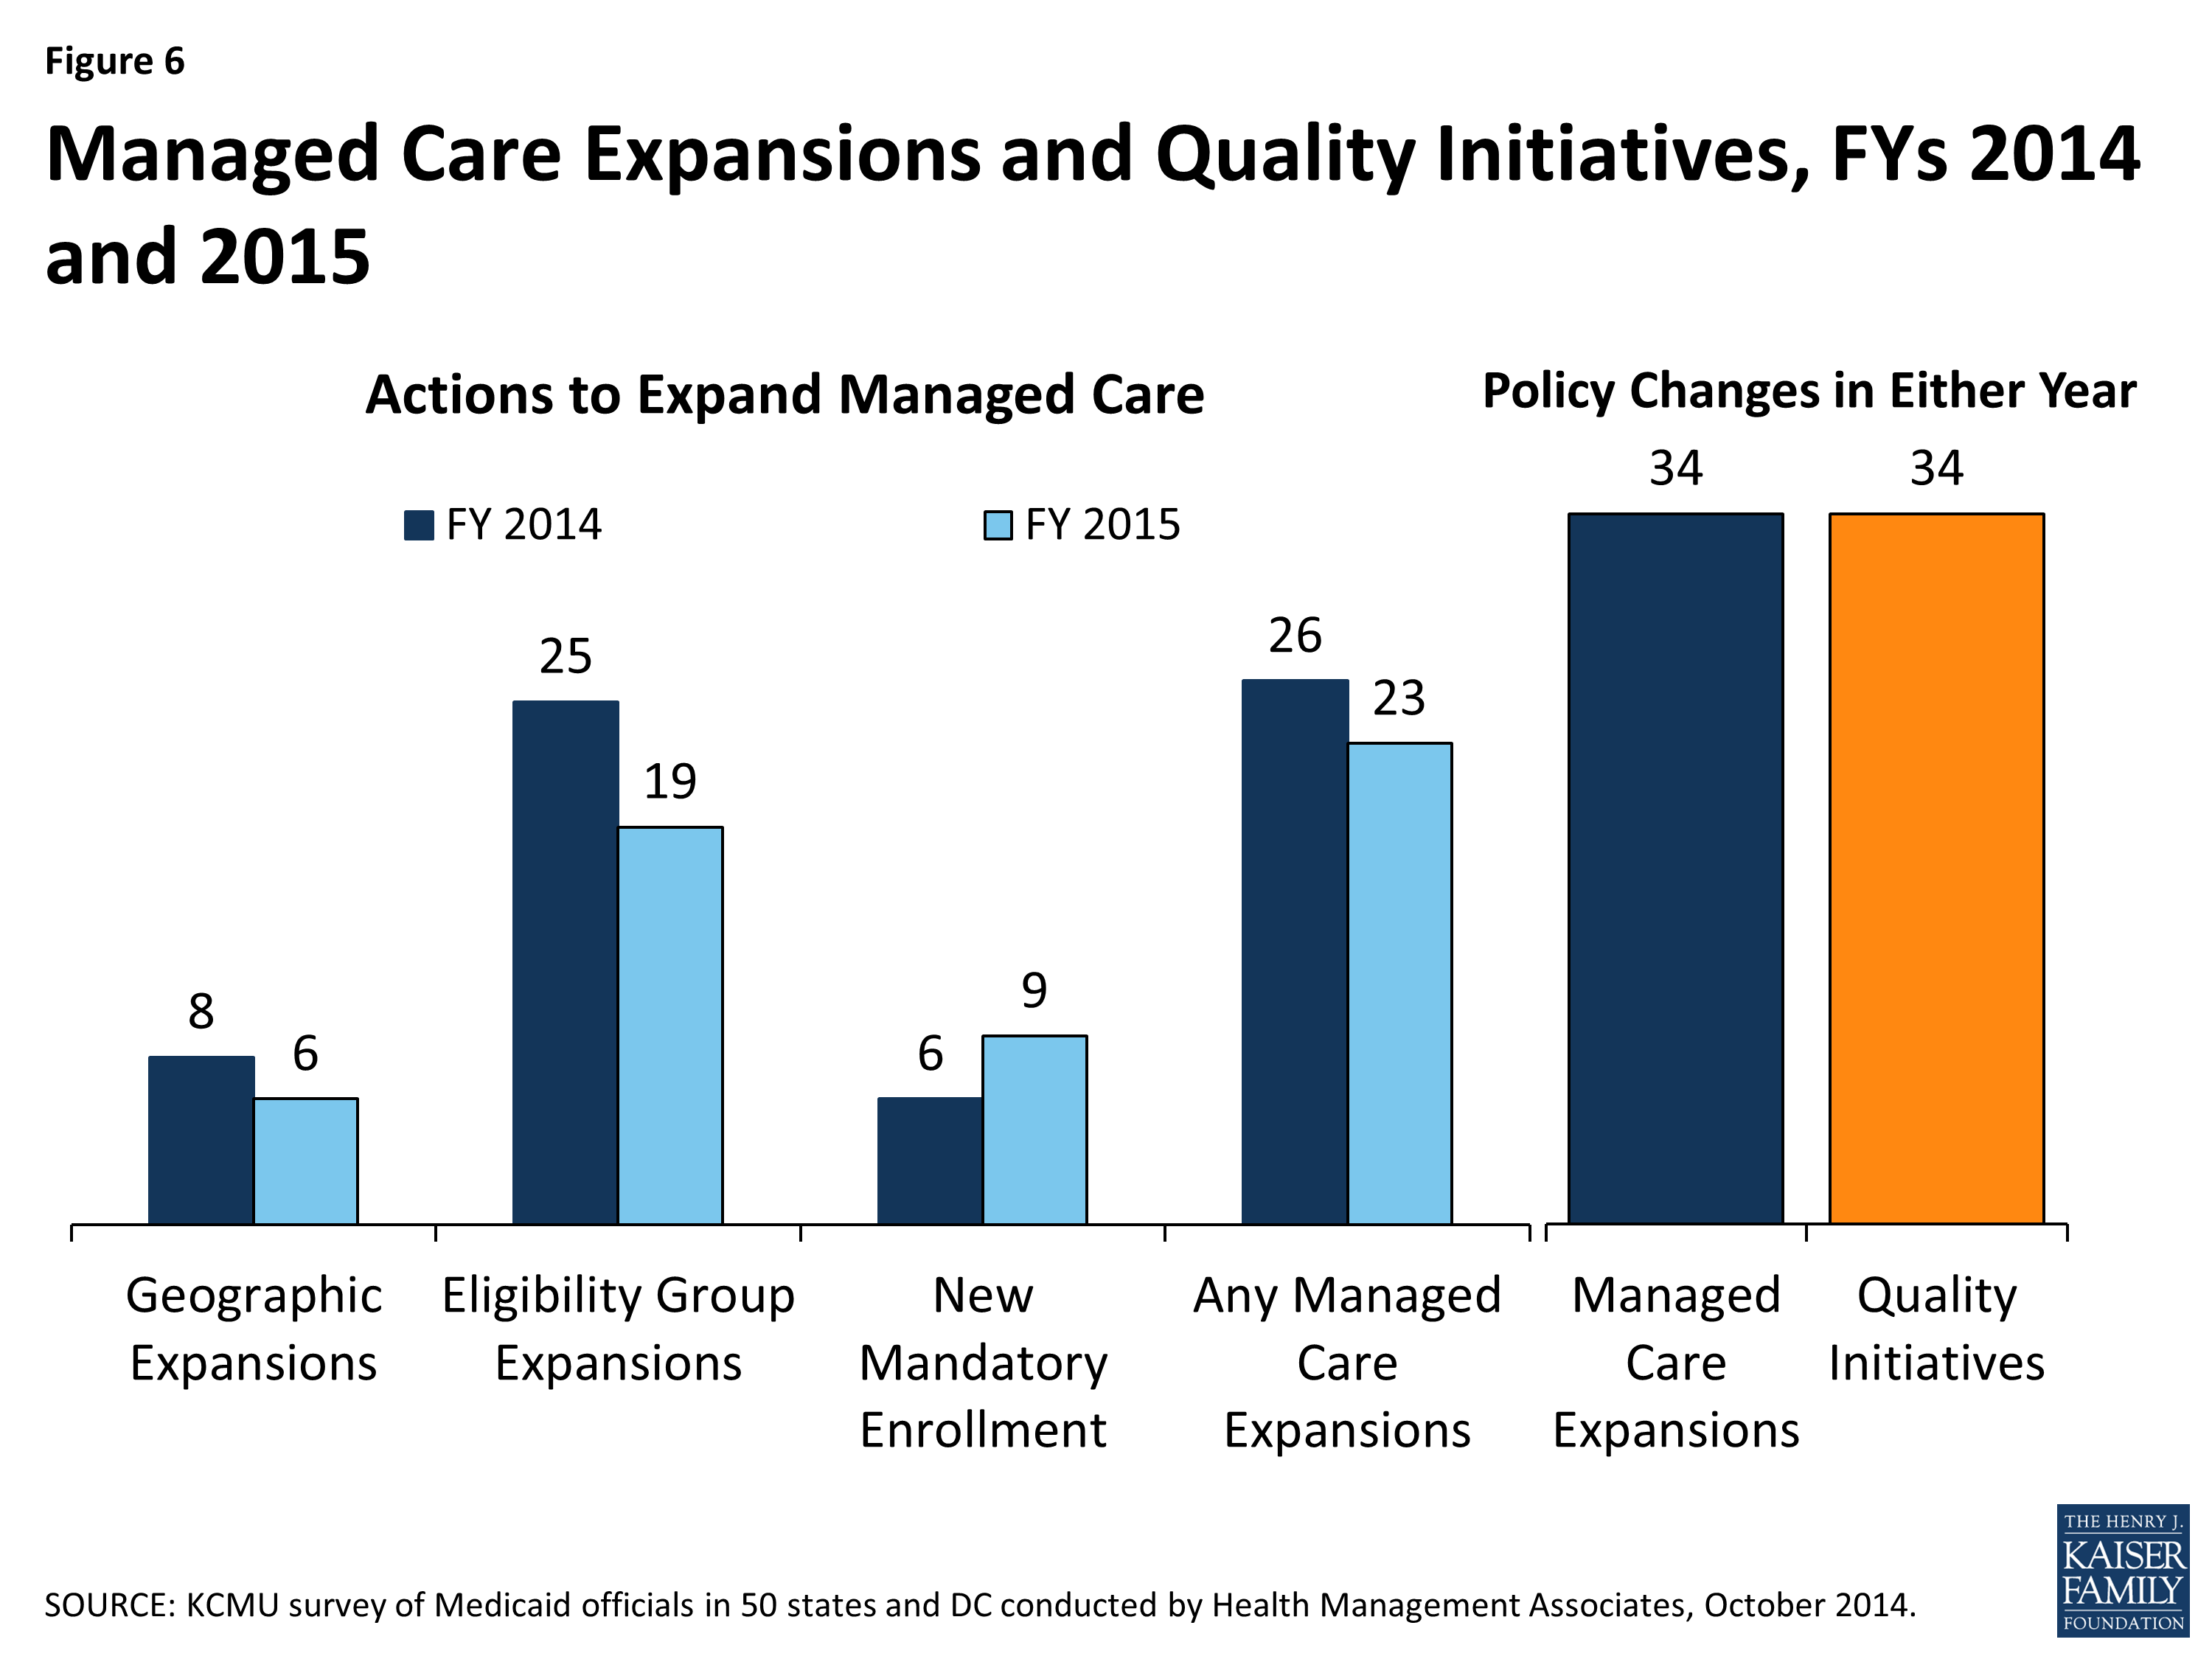
Figure 6: Managed Care Expansions and Quality Initiatives, FYs 2014 and 2015
Managed Care Quality. As states expand risk-based managed care, they continue to undertake efforts to improve managed care quality and outcomes. New quality improvement initiatives were implemented in 34 states in either FY 2014 or FY 2015. These initiatives include the use of new quality metrics focused on specific conditions (e.g., behavioral health conditions, childhood obesity, hypertension, asthma, and diabetes) and the addition or enhancement of pay-for-performance arrangements, including changes in amounts withheld from monthly capitation payments that are at risk based on each MCO’s performance on specified quality measures. In addition, some states are introducing or expanding public reporting of quality metrics.
Additional information on states that reported managed care changes implemented in FY 2014 or planned for FY 2015 can be found in Table 3.
Primary Care Case Management Programs
Of the 22 states with PCCM programs, six indicated they enacted policies to increase PCCM enrollment in FY 2014 or FY 2015. The state actions include: Arkansas implemented the Delta Pilot Program, an enhanced PCCM. Colorado and Rhode Island are expanding enrollment in their PCCM programs as part of integrated care initiatives for those dually eligible for Medicare and Medicaid; Rhode Island is also expanding enrollment in their PCCM program for other populations who are elderly or disabled. Iowa is using the PCCM for the expansion of the Wellness Plan, part of their ACA Medicaid expansion waiver. Nevada has launched a new PCCM model targeted to those currently in fee-for-service with co-morbid conditions (about 39,000 members.)
In contrast, eight states (Florida, Illinois, Indiana, Louisiana, Oklahoma, Oregon, Utah and South Carolina) have taken actions that decreased enrollment in their PCCM programs.3 Six of these states (Florida, Indiana, Louisiana, Oregon, South Carolina, and Utah) have ended or plan to end their PCCM programs and transition PCCM enrollees to risk-based managed care. In June 2014, Illinois began transitioning 1.5 million PCCM enrollees to “managed care entities” in the five mandatory enrollment regions. In Oklahoma, effective July 2014 individuals with creditable primary coverage are no longer eligible for the SoonerCare Choice PCCM program.
| Managed Care Administrative Policies |
|
MCO Rate-Setting. Federal law requires that state Medicaid programs pay MCOs actuarially sound capitation rates. As the role of capitated managed care has increased, states have paid greater attention to the rate-setting process. States indicated a range of approaches to setting rates for MCOs to achieve actuarially sound rates, often involving a combination of strategies. As of July 2014, the 39 states with MCOs reported using one or more of the following methods in setting actuarially sound rates – administrative-rate setting (29 states), negotiation (12 states), competitive bidding with an actuarially defined range (11 states.) Increasingly, states are contracting with actuarial firms to assist in the rate-setting process as the state administratively sets, bids or negotiates the rates.–
–
Minimum Loss Ratios. For an MCO, the proportion of total per member per month capitation payments that is spent on clinical services and for quality improvement is known as the Medical Loss Ratio (MLR). Thus, the MLR represents the share of dollars that MCOs spend on providing and improving patient care compared to administrative costs, which include executive salaries, overhead, and marketing, and on profits. State insurance regulators commonly set a minimum MLR for commercial health plans, and the ACA mandates a minimum MLR for Medicare Advantage plans and for qualified health plans (QHPs) participating in the health insurance Marketplaces. State Medicaid programs are allowed to set a MLR for Medicaid health plans. As of July 2014, 27 of the 39 states that contracted with comprehensive risk-based MCOs specified a minimum MLR for all or some plans, and 12 states did not have an MLR requirement. Twenty-two of the 27 states with a MLR requirement always applied it and five states applied it on a limited basis (e.g., for the new ACA Medicaid expansion population.) State Medicaid MLRs vary, though most commonly are set at 85 percent. Some states noted that MLRs varied by type of plan or population.–
–
Auto-enrollment. Beneficiaries who are required to enroll in MCOs must be offered a choice of at least two plans. Those who do not select a plan are auto-enrolled in a plan. Of the 39 states with comprehensive risk-based MCOs, all except one required that some or all beneficiaries to enroll in an MCO. (The exception is North Dakota, which has only one health plan.) The proportion of beneficiaries who are auto-enrolled varies widely across states. Five states had auto-enrollment rates of 10 percent or less, while six states auto-enrolled between 70 percent and 80 percent of new MCO enrollees.4 State’s auto-enrollment algorithms also vary, with about half rotating enrollments randomly across plans, and others incorporating a range of factors, including previous connection of the beneficiary or family members to a primary care provider or total plan enrollment. Some states use or plan to use MCO performance on specified quality measures in auto-assigning new enrollees, with higher performing plans receiving some or all auto-enrollments.
|
TABLE 3: MANAGED CARE INITIATIVES TAKEN IN ALL 50 STATES AND DC, FY 2014 and 2015 |
||||||||||
| States | Geographic Expansions | Add Eligibility Groups | New Mandatory Enrollment | Expansions of Managed Care | Quality Initiatives in Managed Care | |||||
| 2014 | 2015 | 2014 | 2015 | 2014 | 2015 | 2014 | 2015 | Either Year | Either Year | |
| Alabama | ||||||||||
| Alaska | ||||||||||
| Arizona | X | X | X | X | X | X | ||||
| Arkansas | ||||||||||
| California | X | X | X | X | X | X | ||||
| Colorado | X | X | X | X | X | X | ||||
| Connecticut | ||||||||||
| Delaware | X | X | X | X | ||||||
| DC | X | |||||||||
| Florida | X | X | X | X | X | X | X | X | X | |
| Georgia | X | X | X | X | ||||||
| Hawaii | X | X | X | X | ||||||
| Idaho | X | |||||||||
| Illinois | X | X | X | X | X | X | X | X | X | |
| Indiana | X | X | X | X | X | |||||
| Iowa | X | X | X | X | X | X | X | |||
| Kansas | ||||||||||
| Kentucky | X | X | X | |||||||
| Louisiana | X | X | X | X | ||||||
| Maine | ||||||||||
| Maryland | X | |||||||||
| Massachusetts | X | X | X | X | X | |||||
| Michigan | X | X | X | X | X | X | ||||
| Minnesota | X | X | X | X | X | |||||
| Mississippi | X | X | X | X | ||||||
| Missouri | ||||||||||
| Montana | ||||||||||
| Nebraska | X | X | X | X | ||||||
| Nevada | X | X | X | X | ||||||
| New Hampshire | X | X | X | X | X | X | X | X | ||
| New Jersey | X | X | X | X | ||||||
| New Mexico | X | X | X | X | X | |||||
| New York | X | X | X | X | X | X | X | X | X | X |
| North Carolina | ||||||||||
| North Dakota | X | X | X | X | X | |||||
| Ohio | X | X | X | X | ||||||
| Oklahoma | ||||||||||
| Oregon | X | X | X | X | ||||||
| Pennsylvania | X | X | X | X | ||||||
| Rhode Island | X | X | X | X | X | X | ||||
| South Carolina | X | X | X | X | X | |||||
| South Dakota | ||||||||||
| Tennessee | X | |||||||||
| Texas | X | X | X | X | X | X | X | |||
| Utah | X | X | X | X | X | X | ||||
| Vermont | ||||||||||
| Virginia | X | X | X | X | X | X | ||||
| Washington | X | X | X | X | X | X | ||||
| West Virginia | X | X | X | X | ||||||
| Wisconsin | X | X | X | X | X | X | X | |||
| Wyoming | ||||||||||
| Totals | 8 | 6 | 25 | 19 | 6 | 9 | 26 | 23 | 34 | 34 |
| NOTES: States were asked if they expanded managed care (comprehensive risk-based managed care) to new regions, new populations, increasing the use of mandatory enrollment or the implementation of new managed care plans. States reported separately if they implemented new quality initiatives in managed care plans as well. SOURCE: Kaiser Commission on Medicaid and the Uninsured Survey of Medicaid Officials in 50 states and DC conducted by Health Management Associates, October 2014. |
||||||||||
Other Delivery System and Payment Reform
States are increasingly interested in new approaches that hold the promise of improving health outcomes and constraining costs by redesigning the way that care is delivered and paid for. These emerging models which seek to align payment and delivery systems to reward quality and promote more integrated care include initiatives to coordinate physical and behavioral health care, efforts to coordinate acute and long-term care and care management approaches that target persons with multiple chronic conditions. These delivery system and payment reform approaches are sometimes implemented outside of managed care and sometimes within it. This year’s survey asked states which delivery system and payment reform models were in place in FY 2013, or if they had adopted or were enhancing such models in FY 2014 or FY 2015. (Figure 7)
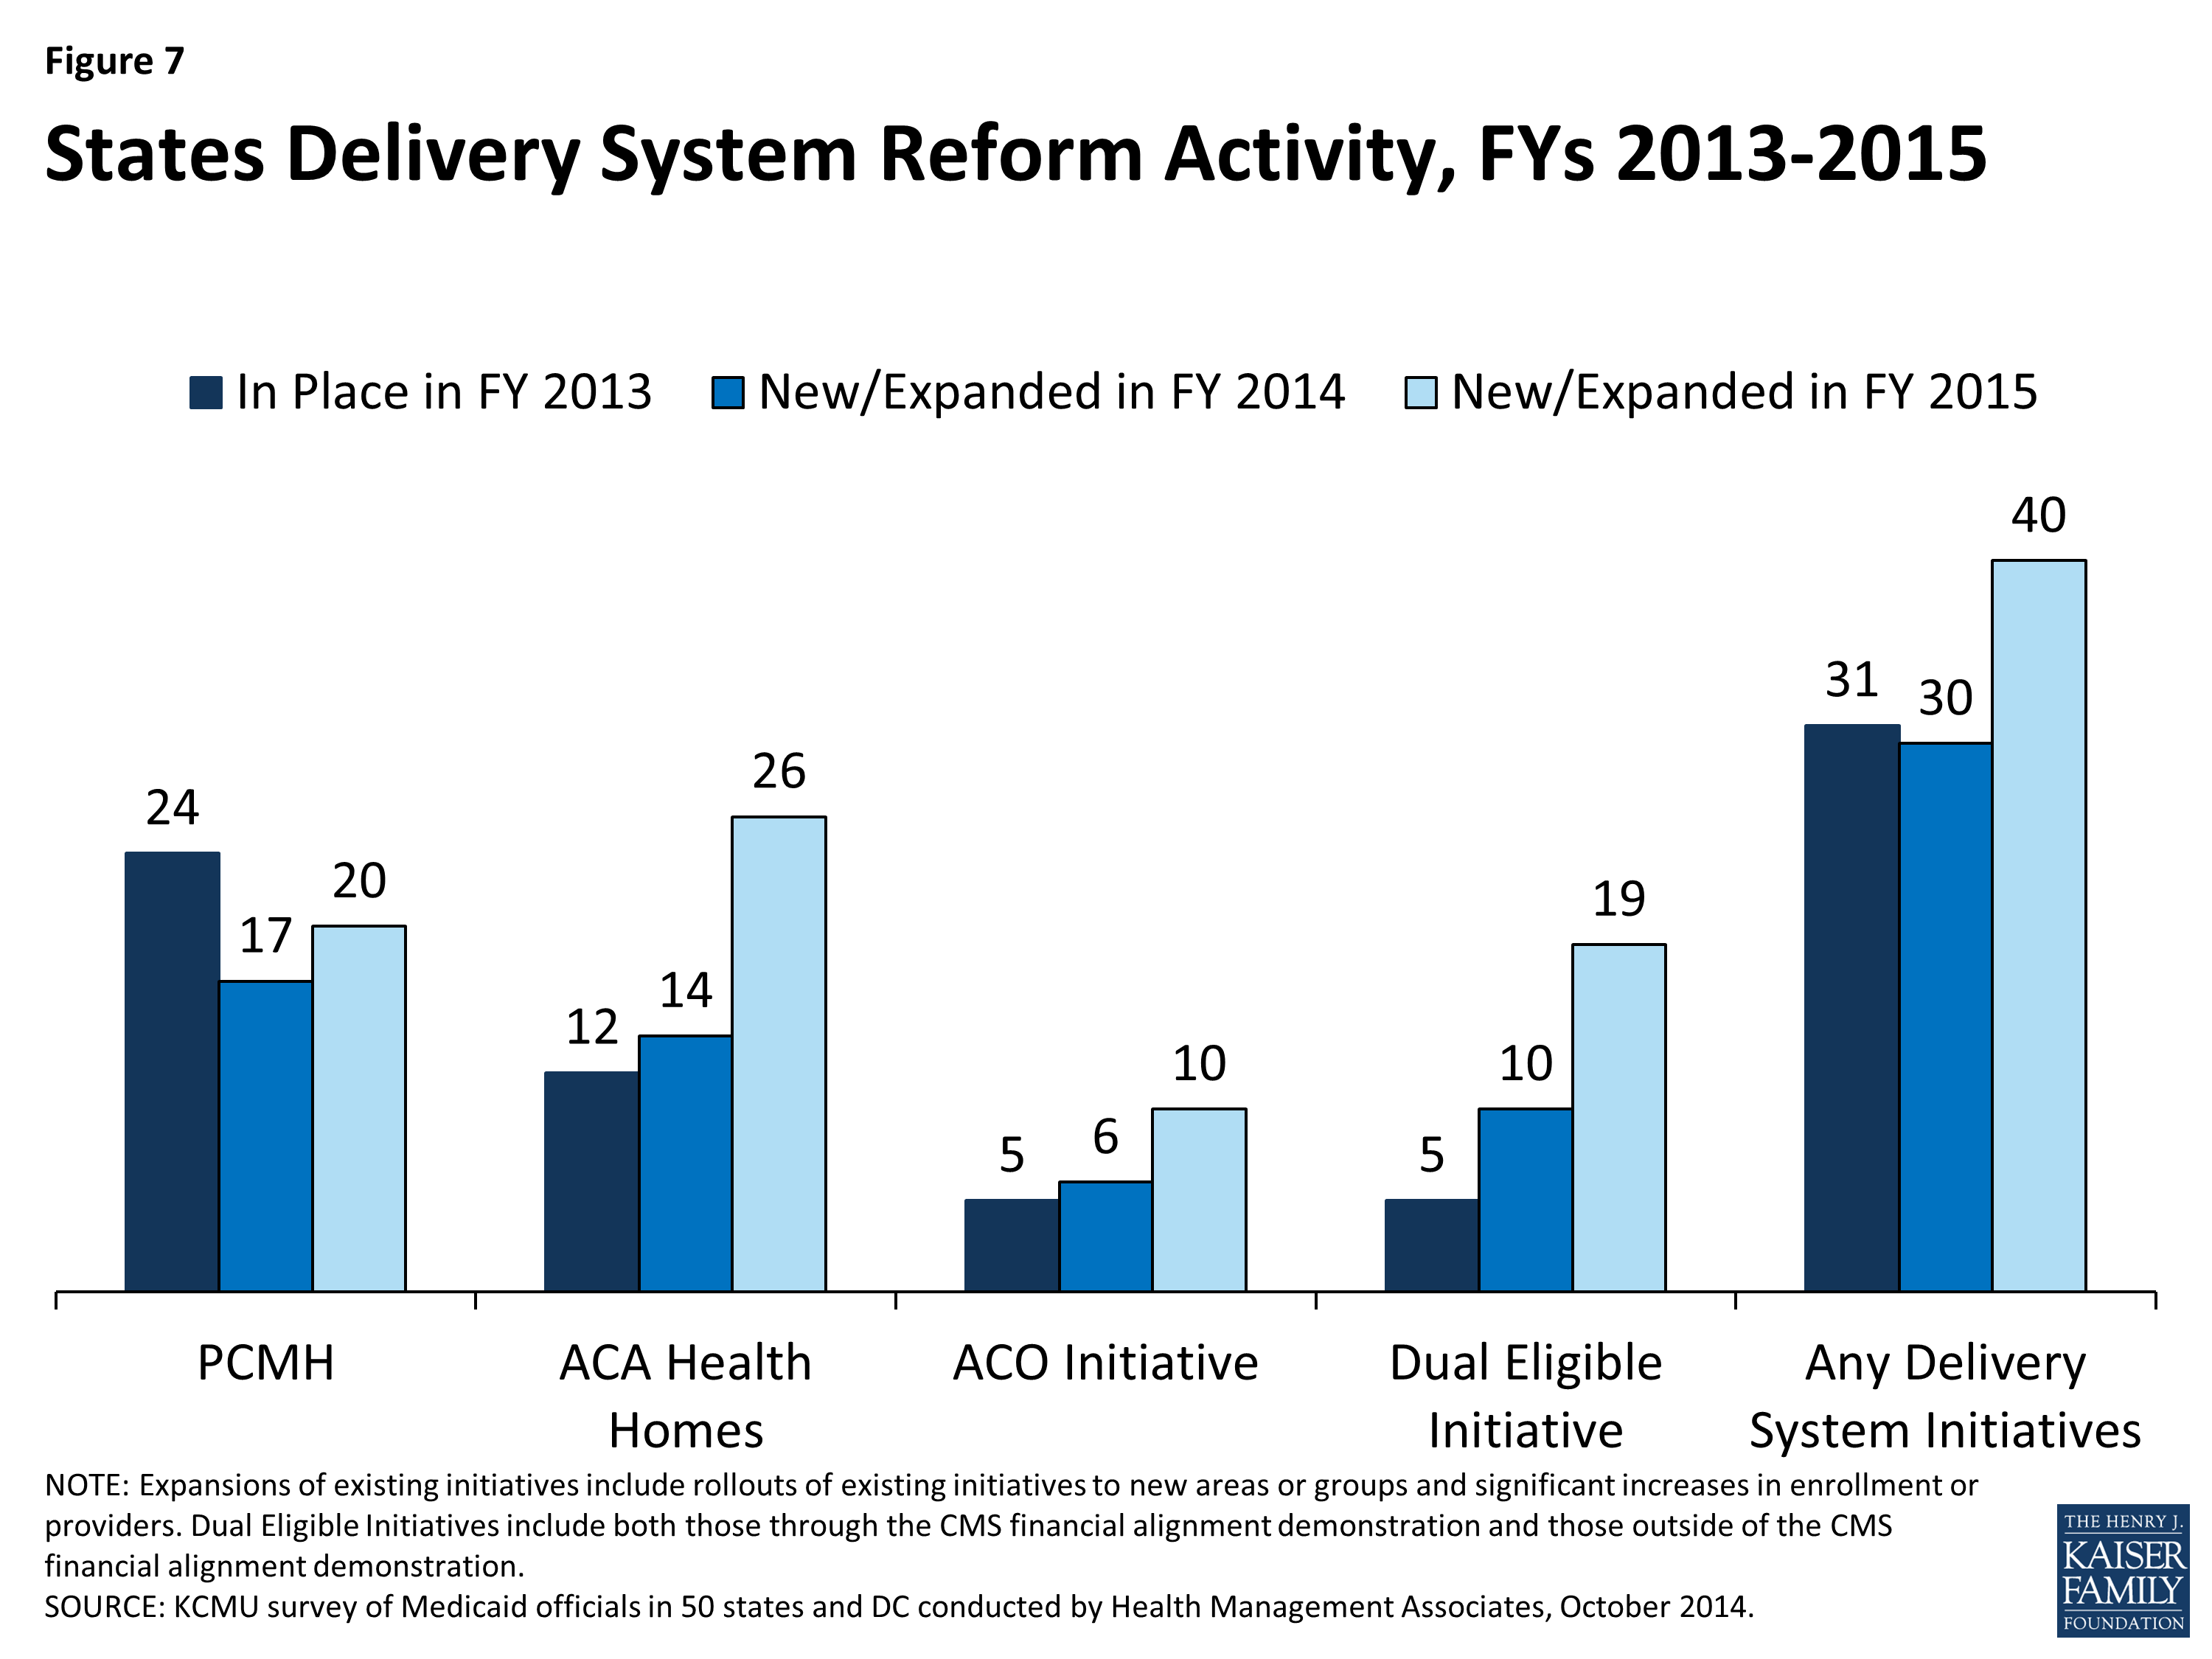
Figure 7: States Delivery System Reform Activity, FYs 2013-2015
Patient-Centered Medicaid Homes (PCMH). In 2007, four leading physician groups released key principles that define a PCMH: (1) the personal physician leads a team that is collectively responsible for the patient’s ongoing care; (2) the physician is responsible for the whole person in all stages of life; (3) care is coordinated and/or integrated; (4) quality and safety are hallmarks of a medical home; (5) enhanced access to care is available through all systems; and (6) payment appropriately recognizes the added value to the patient. In addition, the National Committee for Quality Assurance (NCQA) has issued specific standards to be recognized as a PCMH.5 In this survey, 24 states said that PCMHs were “in place” in FY 2013, 17 states reported having adopted or expanding PCMHs in FY 2014 and 20 states indicated plans to do so in FY 2015.
| Patient-Centered Medical Home Initiatives |
|
Connecticut PCMH Initiative: The Connecticut Department of Social Services is investing significant resources to help primary care practices obtain PCMH recognition from the National Committee for Quality Assurance (NCQA). Practices on the “glide path” toward recognition receive technical assistance from Community Health Network of Connecticut, Inc. (CHNCT). Practices that have received recognition are eligible for financial incentives including enhanced fee-for-service payments and retrospective payments for meeting benchmarks on identified quality measures; practices on the glide path receive prorated enhanced fee for service payments based upon their progress on the glide path but are not eligible for quality payments at this time. In this year’s survey, the state reported that approximately one-third of Connecticut’s Medicaid population was assigned to a PCMH with a plan to expand to all enrollees in the future.
–
Virginia’s PCMH Requirement for MCOs: Virginia modified its PCMH requirement in the FY 2014 Medallion II managed care contract (2013-2014) by implementing instead the Medallion Care Systems Partnership. This initiative allows MCOs opportunities to expand and test different methodologies of payment and incentives within the medical home model to advance quality and member outcomes while allowing for small scale pilots of innovative payment reform models.
|
Health Homes. Section 2703 of the ACA provides a new state plan option for Medicaid programs to establish “health homes,” designed to be person-centered systems of care that facilitate access to and coordination of the full array of primary and acute physical health services, behavioral health care, and community-based long-term services and supports, for beneficiaries who have at least two chronic conditions, or one and at risk of a second or a serious and persistent mental health condition. To implement a health home program, a state must obtain CMS approval of a state plan amendment (SPA). A 90 percent federal match rate is available for qualified expenditures for health home services for the first eight quarters of a state’s program.6 The ACA defines health home services to include: comprehensive care management; care coordination and health promotion; transitional care from inpatient to other settings; support for patients and families; referral to community and social support services; and use of Health Information Technology (HIT) to link services.7 In this survey, 12 states said that health homes were “in place” in FY 2013, 14 states reported having adopted or expanded health homes in FY 2014 and 26 states reported plans to do so in FY 2015. Many states noted that they were focusing their health home programs on populations with behavioral health conditions as well as populations with multiple chronic conditions.
Accountable Care Organizations (ACOs). An ACO is a provider-led group of health care providers that agree to share responsibility for the delivery of care to and health outcomes of a defined group of people and the cost of their care. The organizational structure of ACOs varies, but all ACOs include primary and specialty care physicians and at least one hospital. Providers in an ACO are expected to coordinate care for their shared patients to enhance quality and efficiency, and the ACO as an entity is accountable for that care. An ACO that meets quality performance standards that have been set by the payer and achieves savings relative to a benchmark can share savings with the payer and distribute them among its providers. Some states that are pursuing ACOs for Medicaid beneficiaries are building on existing care delivery programs (e.g., PCCM, medical homes, MCOs) which already involve some degree of coordination among providers and may have some of the infrastructure (e.g., electronic medical records) necessary to support coordination among ACO providers. States use different terms for their Medicaid ACO initiatives, such as Coordinated Care Organizations (CCOs) in Oregon and Accountable Care Collaboratives (ACCs) in Colorado.8
In this survey, five states reported that ACOs were “in place” in FY 2013, six states reported adopting or expanding ACOs in FY 2014 and ten states reported such activity in FY 2015. Some states have sought or are seeking to reorganize some or all of their Medicaid delivery system into ACOs (Colorado, Illinois, Iowa, Minnesota, Oregon, Utah, and Vermont,) while ACO efforts in other states have been more provider-driven (California, New Jersey, and South Carolina.) Also, a number of states noted that their ACO initiatives are part of larger State Innovation Model (SIM) grants that involve multiple payers.
Care Coordination and Integration of Care for Dual Eligible Beneficiaries. Coordinating care for those dually-eligible for Medicare and Medicaid (dual eligible beneficiaries) is a significant issue for Medicaid programs. Dual eligible beneficiaries comprise just 14 percent of Medicaid enrollees but accounted for 36 percent of Medicaid spending in 2010. For Medicare, dual eligible beneficiaries accounted for 20 percent of all enrollees but 33 percent of all spending in 2009.9 About 65 percent of all spending for dual eligible individuals is for long-term services and supports, covered largely by Medicaid, and about 25 percent is for acute care services, primarily covered by Medicare.10 These individuals tend to have significant health needs, a high prevalence of chronic conditions and substantial use of long-term services and supports.
Prior to the ACA, coordination of care for individuals with dual enrollment in Medicaid and Medicare had been difficult to pursue for states in part because of misalignment between Medicare and Medicaid laws. In addition, when states did develop approaches to better coordinate care, any resulting savings from improvements in acute care (such as reduced inpatient admissions, re-admissions and emergency room visits) most often accrued to Medicare and were not shared with state Medicaid programs. Under Section 2602 of the ACA, CMS established the Medicare-Medicaid Coordination Office (MMCO) and initiated financial alignment demonstrations with interested states seeking to coordinate and improve care and control costs for those dually eligible for Medicare and Medicaid.
In this survey, five states indicated that initiatives to coordinate care for dual eligible beneficiaries were in place in FY 2013; all of these initiatives were outside the CMS financial alignment demonstration and centered on enrolling this population in comprehensive MCOs or in managed long-term care plans. In FY 2014, ten states noted new or expanded initiatives for dual eligible beneficiaries, five of which related to the implementation of a financial alignment demonstration. In FY 2015, 19 states noted plans to implement an initiative focused on this population, of which 13 planned to implement a financial alignment demonstration.11 Initiatives outside of the financial alignment demonstrations included alignment of Medicare Advantage Special Needs Plans for dual eligible beneficiaries (D-SNPs) with Medicaid MCOs and enrollment of dual eligible beneficiaries in comprehensive Medicaid MCOs (for acute care services) or managed long-term care.
Additional information on states that reported delivery system and payment reform initiatives implemented in FY 2014 or planned for FY 2015 can be found in Table 4.
| Other Emerging Delivery System and Payment Reforms |
|
This year’s survey asked states about two emerging delivery system and payment reform initiatives: Episode of Care Payments and DSRIP programs, described below. Aside from these two initiatives, states also commonly mentioned payment reforms that focused on reducing preventable admissions and readmissions, hospital acquired conditions, and elective early deliveries.
–
Episode-of-Care Initiative. Unlike fee-for-service (FFS) reimbursement where providers are paid separately for each service, or capitation where a health plan receives a per member per month payment intended to cover the costs for all covered services, an episode-of-care payment is linked to the care that a patient receives in the course of treatment for a specific illness, condition or medical event (e.g., knee replacement, pregnancy and delivery, or heart attack). Episode-based payments create a financial incentive for physicians, hospitals and other providers to work together to improve patient care related to an episode of illness or a chronic condition. In this survey, two states (Arkansas and Tennessee) said that an episode-of-care initiative was in place in FY 2013; both of these states indicated that they had adopted or expanded their episode-of-care initiative in FY 2014 while seven states (Arizona, Arkansas, New Mexico, Ohio, Pennsylvania, South Carolina, and Tennessee) planned to implement or expand their episode-of-care initiative in FY 2015. A number of these states noted that episodes of care were part of their State Innovation Model (SIM) grant proposals.–
–
Arkansas, for example, reported that its Payment Improvement Program (PIP) is designed to promote efficiency, economy and quality of care by rewarding high-quality care and outcomes, encouraging clinical effectiveness, promoting early intervention and coordination to reduce complications and associated costs, and, when provider referrals are necessary, encouraging referral to efficient and economic providers who furnish high-quality care. The PIP uses episode-based data to evaluate the quality, efficiency and economy of care delivered in the course of an episode and to apply payment incentives. The PIP is separate from, and does not alter, current methods for reimbursement. Instead, at the conclusion of each performance period, the average cost of the episode for a “Principal Accountable Provider” (PAP) is calculated and evaluated against predetermined cost thresholds to determine whether there will be risk or gain sharing payments for the PAP.
–
Hospital Delivery System Reform Incentive Payment (DSRIP) Program. Delivery System Reform Incentive Payment or DSRIP programs are another piece of the dynamic and evolving Medicaid delivery system reform landscape. DSRIP initiatives are part of broader Section 1115 waiver programs and provide states with significant funding that can be used to support hospitals and other providers in changing how they provide care to Medicaid beneficiaries. Originally, DSRIP initiatives were more narrowly focused on funding for safety-net hospitals and often grew out of negotiations between states and HHS over the appropriate way to finance hospital care. Now, however, they increasingly are being used to promote a far more sweeping set of payment and delivery system reforms. The first DSRIP initiatives were approved and implemented in California and Texas in 2010 and 2011, followed by New Jersey, Kansas and Massachusetts in 2012 and 2013 and most recently New York which was approved in 2014 and will be implemented in 2015. Under DSRIP initiatives, funds to providers are tied to meeting performance metrics. In this year’s survey, nine states (California, Illinois, Kansas, Massachusetts, New Hampshire, New Jersey, New Mexico, New York, and Texas) indicated that they plan to implement or expand DSRIP programs in FY 2015.
|
TABLE 4: DELIVERY SYSTEM INITIATIVES IN PLACE IN FY 2013 AND ACTIONS TAKEN IN FY 2014 AND FY 2015 IN ALL 50 STATES AND DC |
|||||||||||||||
| States | Patient Centered Medical Homes | Health Homes | Accountable Care Organizations | Initiatives for Dually-Eligible Individuals | Delivery System Initiatives | ||||||||||
| In Place 2013 | New or Expansions in: | In Place 2013 | New or Expansions in: | In Place 2013 | New or Expansions in: | In Place 2013 | New or Expansions in: | In Place 2013 | New or Expansions in: | ||||||
| 2014 | 2015 | 2014 | 2015 | 2014 | 2015 | 2014 | 2015 | 2014 | 2015 | ||||||
| Alabama | X | X | X | X | X | X | X | X | X | ||||||
| Alaska | X | X | X | X | |||||||||||
| Arizona | X | X | X | X | X | X | X | ||||||||
| Arkansas | X | X | X | X | X | ||||||||||
| California | X | X | X* | X* | X | X | |||||||||
| Colorado | X | X | X* | X | X | ||||||||||
| Connecticut | X | X | X | X | X* | X | X | X | |||||||
| Delaware | X | X | X | X | |||||||||||
| DC | X | X | |||||||||||||
| Florida | X | X | |||||||||||||
| Georgia | X | X | |||||||||||||
| Hawaii | X | X | X | X | X | ||||||||||
| Idaho | X | X | X | X | X | X | |||||||||
| Illinois | X | X | X | X | X* | X* | X | X | |||||||
| Indiana | |||||||||||||||
| Iowa | X | X | X | X | X | X | X | X | |||||||
| Kansas | X | X | |||||||||||||
| Kentucky | |||||||||||||||
| Louisiana | X | X | X | X | X | X | |||||||||
| Maine | X | X | X | X | X | X | X | ||||||||
| Maryland | X | X | X | X | X | X | |||||||||
| Massachusetts | X | X | X* | X* | X | X | X | ||||||||
| Michigan | X | X | X* | X | X | X | |||||||||
| Minnesota | X | X | X | X | X | X | X | X | X | X | X | ||||
| Mississippi | X | X | |||||||||||||
| Missouri | X | X | X | X | X | X | |||||||||
| Montana | X | X | |||||||||||||
| Nebraska | X | X | |||||||||||||
| Nevada | |||||||||||||||
| New Hampshire | |||||||||||||||
| New Jersey | X | X | X | X | X | X | |||||||||
| New Mexico | X | X | X | X | X | X | X | ||||||||
| New York | X | X | X | X | X | X | X* | X | X | X | |||||
| North Carolina | X | X | X | ||||||||||||
| North Dakota | |||||||||||||||
| Ohio | X | X | X* | X | X | ||||||||||
| Oklahoma | X | X | X | X* | X | X | X | ||||||||
| Oregon | X | X | X | X | X | X | X | X | X | X | X | X | X | ||
| Pennsylvania | X | X | X | X | X | X | |||||||||
| Rhode Island | X | X | X | X | X | X | X | X | X* | X | X | X | |||
| South Carolina | X | X | X | X | X* | X | X | X | |||||||
| South Dakota | X | X | |||||||||||||
| Tennessee | X | X | X | X | X | X | X | X | X | ||||||
| Texas | X | X | X* | X | X | ||||||||||
| Utah | X | X | |||||||||||||
| Vermont | X | X | X | X | X | X | X | X | X | X | X | ||||
| Virginia | X | X | X | X | X* | X* | X | X | X | ||||||
| Washington | X | X | X* | X | X | ||||||||||
| West Virginia | X | X | |||||||||||||
| Wisconsin | X | X | X | X | X | X | |||||||||
| Wyoming | X | X | X | ||||||||||||
| Totals | 24 | 17 | 20 | 12 | 14 | 26 | 5 | 6 | 10 | 5 | 10 | 19 | 31 | 30 | 40 |
| NOTES: Expansions of existing initiatives include rollouts of existing initiatives to new areas or groups and significant increases in enrollment or providers. Health Homes: All states noted as either in place in FY 2013 or implementing new/expanded initiatives in FY 2014 have at least one approved SPA except for Michigan and Maine (both states have state legislation in place.) Dually-Eligible Initiatives: X* = state is pursuing the financial alignment demonstrations; all but three states (CT, OK, and RI) had a signed MOU with CMS to implement a financial alignment demonstration in place at the time of the survey while the others had proposals pending. Minnesota has a signed MOU with CMS for an administrative alignment demonstration. CA (FYs 2014 and 2015) and NY (FY 2015) reported other initiatives outside of the demonstration.SOURCE: Kaiser Commission on Medicaid and the Uninsured Survey of Medicaid Officials in 50 states and DC conducted by Health Management Associates, October 2014. |
|||||||||||||||
Balancing Institutional and Community Based Long-term services and supports
Medicaid is the nation’s primary payer for long-term services and supports (LTSS) covering a continuum of services ranging from home and community-based services (HCBS) that allow persons to live independently in their own homes or in the community, to institutional care provided in nursing facilities and intermediate care facilities for individuals with intellectual disabilities (ICF-ID). LTSS consumes nearly one-third of total Medicaid spending and therefore remain an important focus for state policymakers.12 This year’s survey shows that the long-term trend of expanding HCBS has accelerated with states employing a variety of tools and strategies including traditional Section 1915(c) HCBS waivers, PACE programs13, and managed LTSS.
The number of states taking actions to expand the number of persons served in community settings increased substantially in FY 2014 (42 states) and again in FY2015 (47 states) compared to earlier years (26 states in FY 2012 and 33 in FY 2013.) While most states reported using Section 1915(c) waiver or Section 1915(i) state plan authority to expand HCBS, a significant number of states (13 in FY 2014 and 16 in FY 2015) reported that the incentives built into their managed care programs were expected to increase the availability of HCBS. Also, 15 states in FY 2014 and 21 states in FY 2015 reported implementing or expanding PACE programs.14 (Figure 8) A number of states (10 states in FY 2014; 14 in FY 2015) reported closing or downsizing institutions that led to more community placements. States also reported increased take up of the ACA options to expand community-based LTSS (discussed below.)
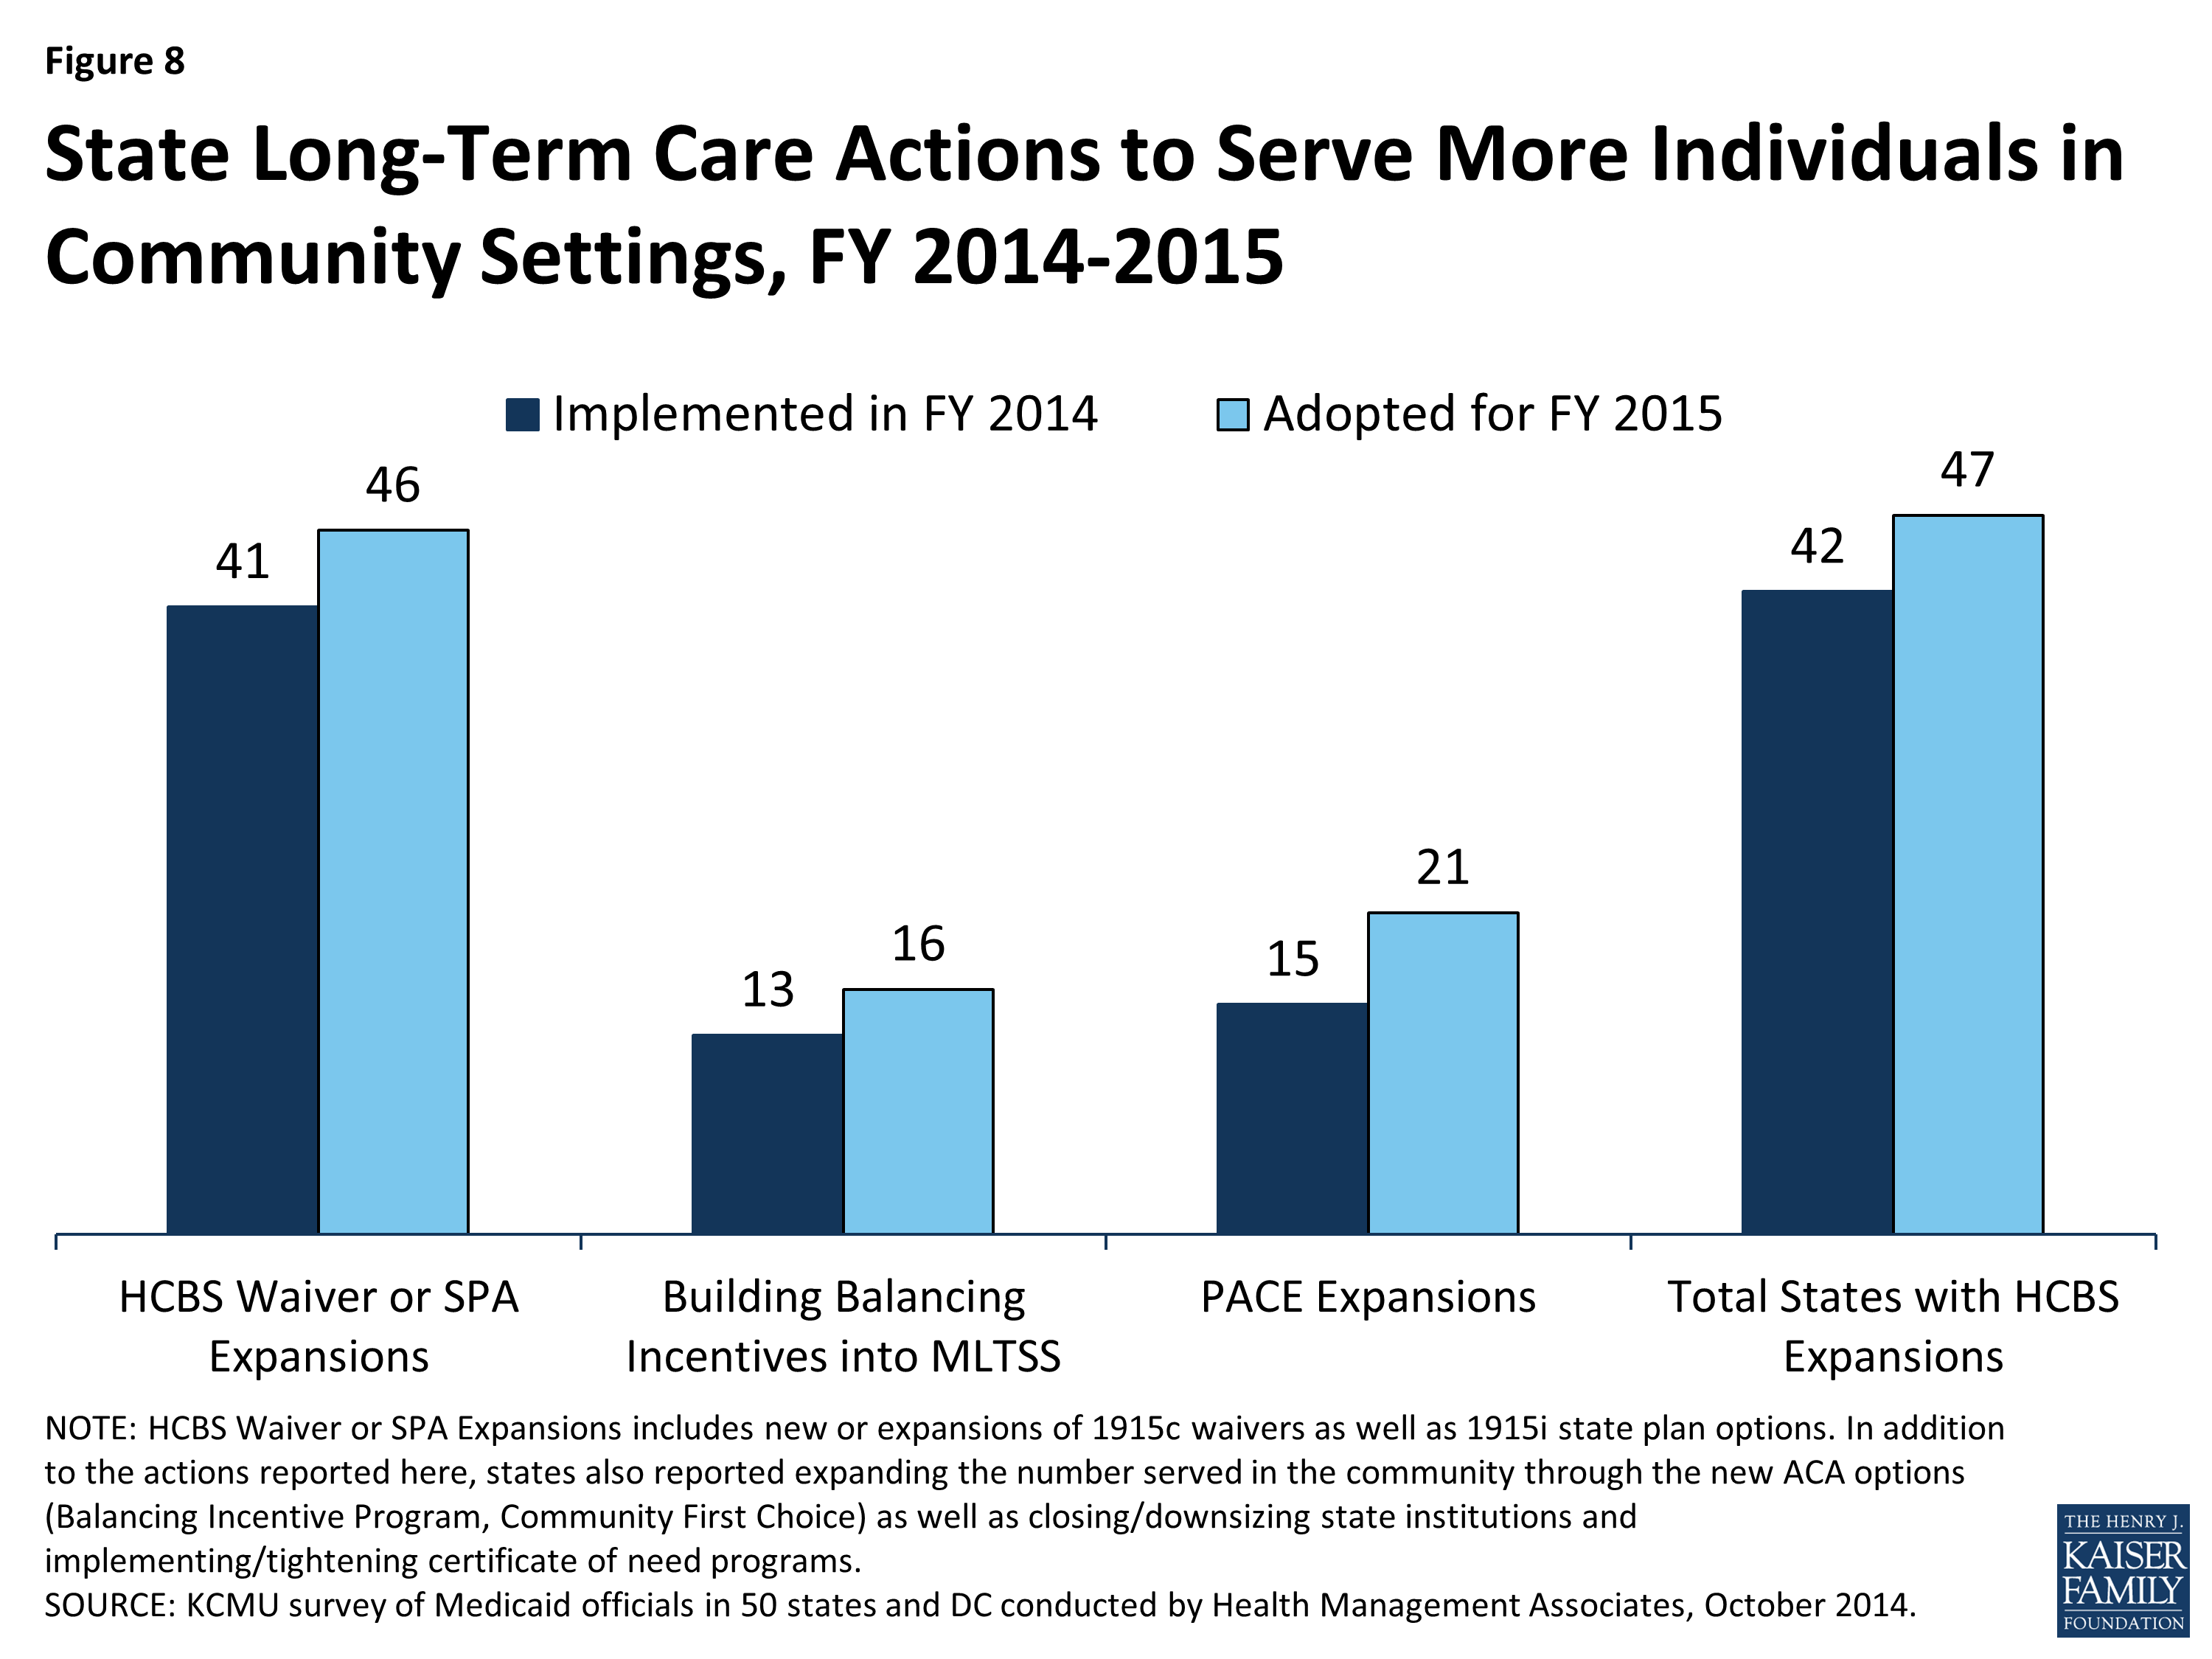
Figure 8: State Long-Term Care Actions to Serve More Individuals in Community Settings, FY 2014-2015
Several states reported a number of other rebalancing initiatives. Connecticut reported implementing a first of its kind balancing bond funding program to help the state’s nursing home industry diversify services to meet the changing needs of older adults and other people with disabilities. Governor Malloy announced the first round of awards (a total of $9 million for seven proposals) in March 2014 as part of the state’s strategic plan to rebalance its LTSS system.15 Georgia reported that it is working to design a quality incentive payment program that would incent shifts toward person-centered care in some HCBS waivers. Hawaii reported implementing an LTSS program in FY 2014 that allows those who meet “at-risk” criteria to receive several home and community-based services. Several states also noted the implementation of conflict-free case management and single points of entry.16 No state reported new HCBS restrictions or limitations in FY 2014 or FY 2015.17 Two states reported other policy changes affecting institutional LTSS. Indiana liberalized its Certificate of Need statute effective in FY 2015 and Rhode Island reported that in FY 2014 it accepted applications to authorize new nursing home beds as “Resident-directed homes,” which are defined as nursing facilities that include programs and physical structures that adhere to the “Eden Alternative™”, “Green House™”, “Small House”, or any other resident-directed operational model where residents and their family members participate in making decisions that may be directly influenced by residents’ individual preferences and that involve the day-to-day activities and operations of the nursing facility.
Long-Term Services and Supports Options in the ACA
The ACA created and expanded several LTSS-related options intended to promote LTSS rebalancing. Nineteen states reported having at least one of the options discussed below in place in FY 2013; an additional 12 states reported implementing at least one of the these options in FY 2014 and 15 reported plans to do so in FY 2015. (Figure 9) State utilization of each of these options is discussed below.
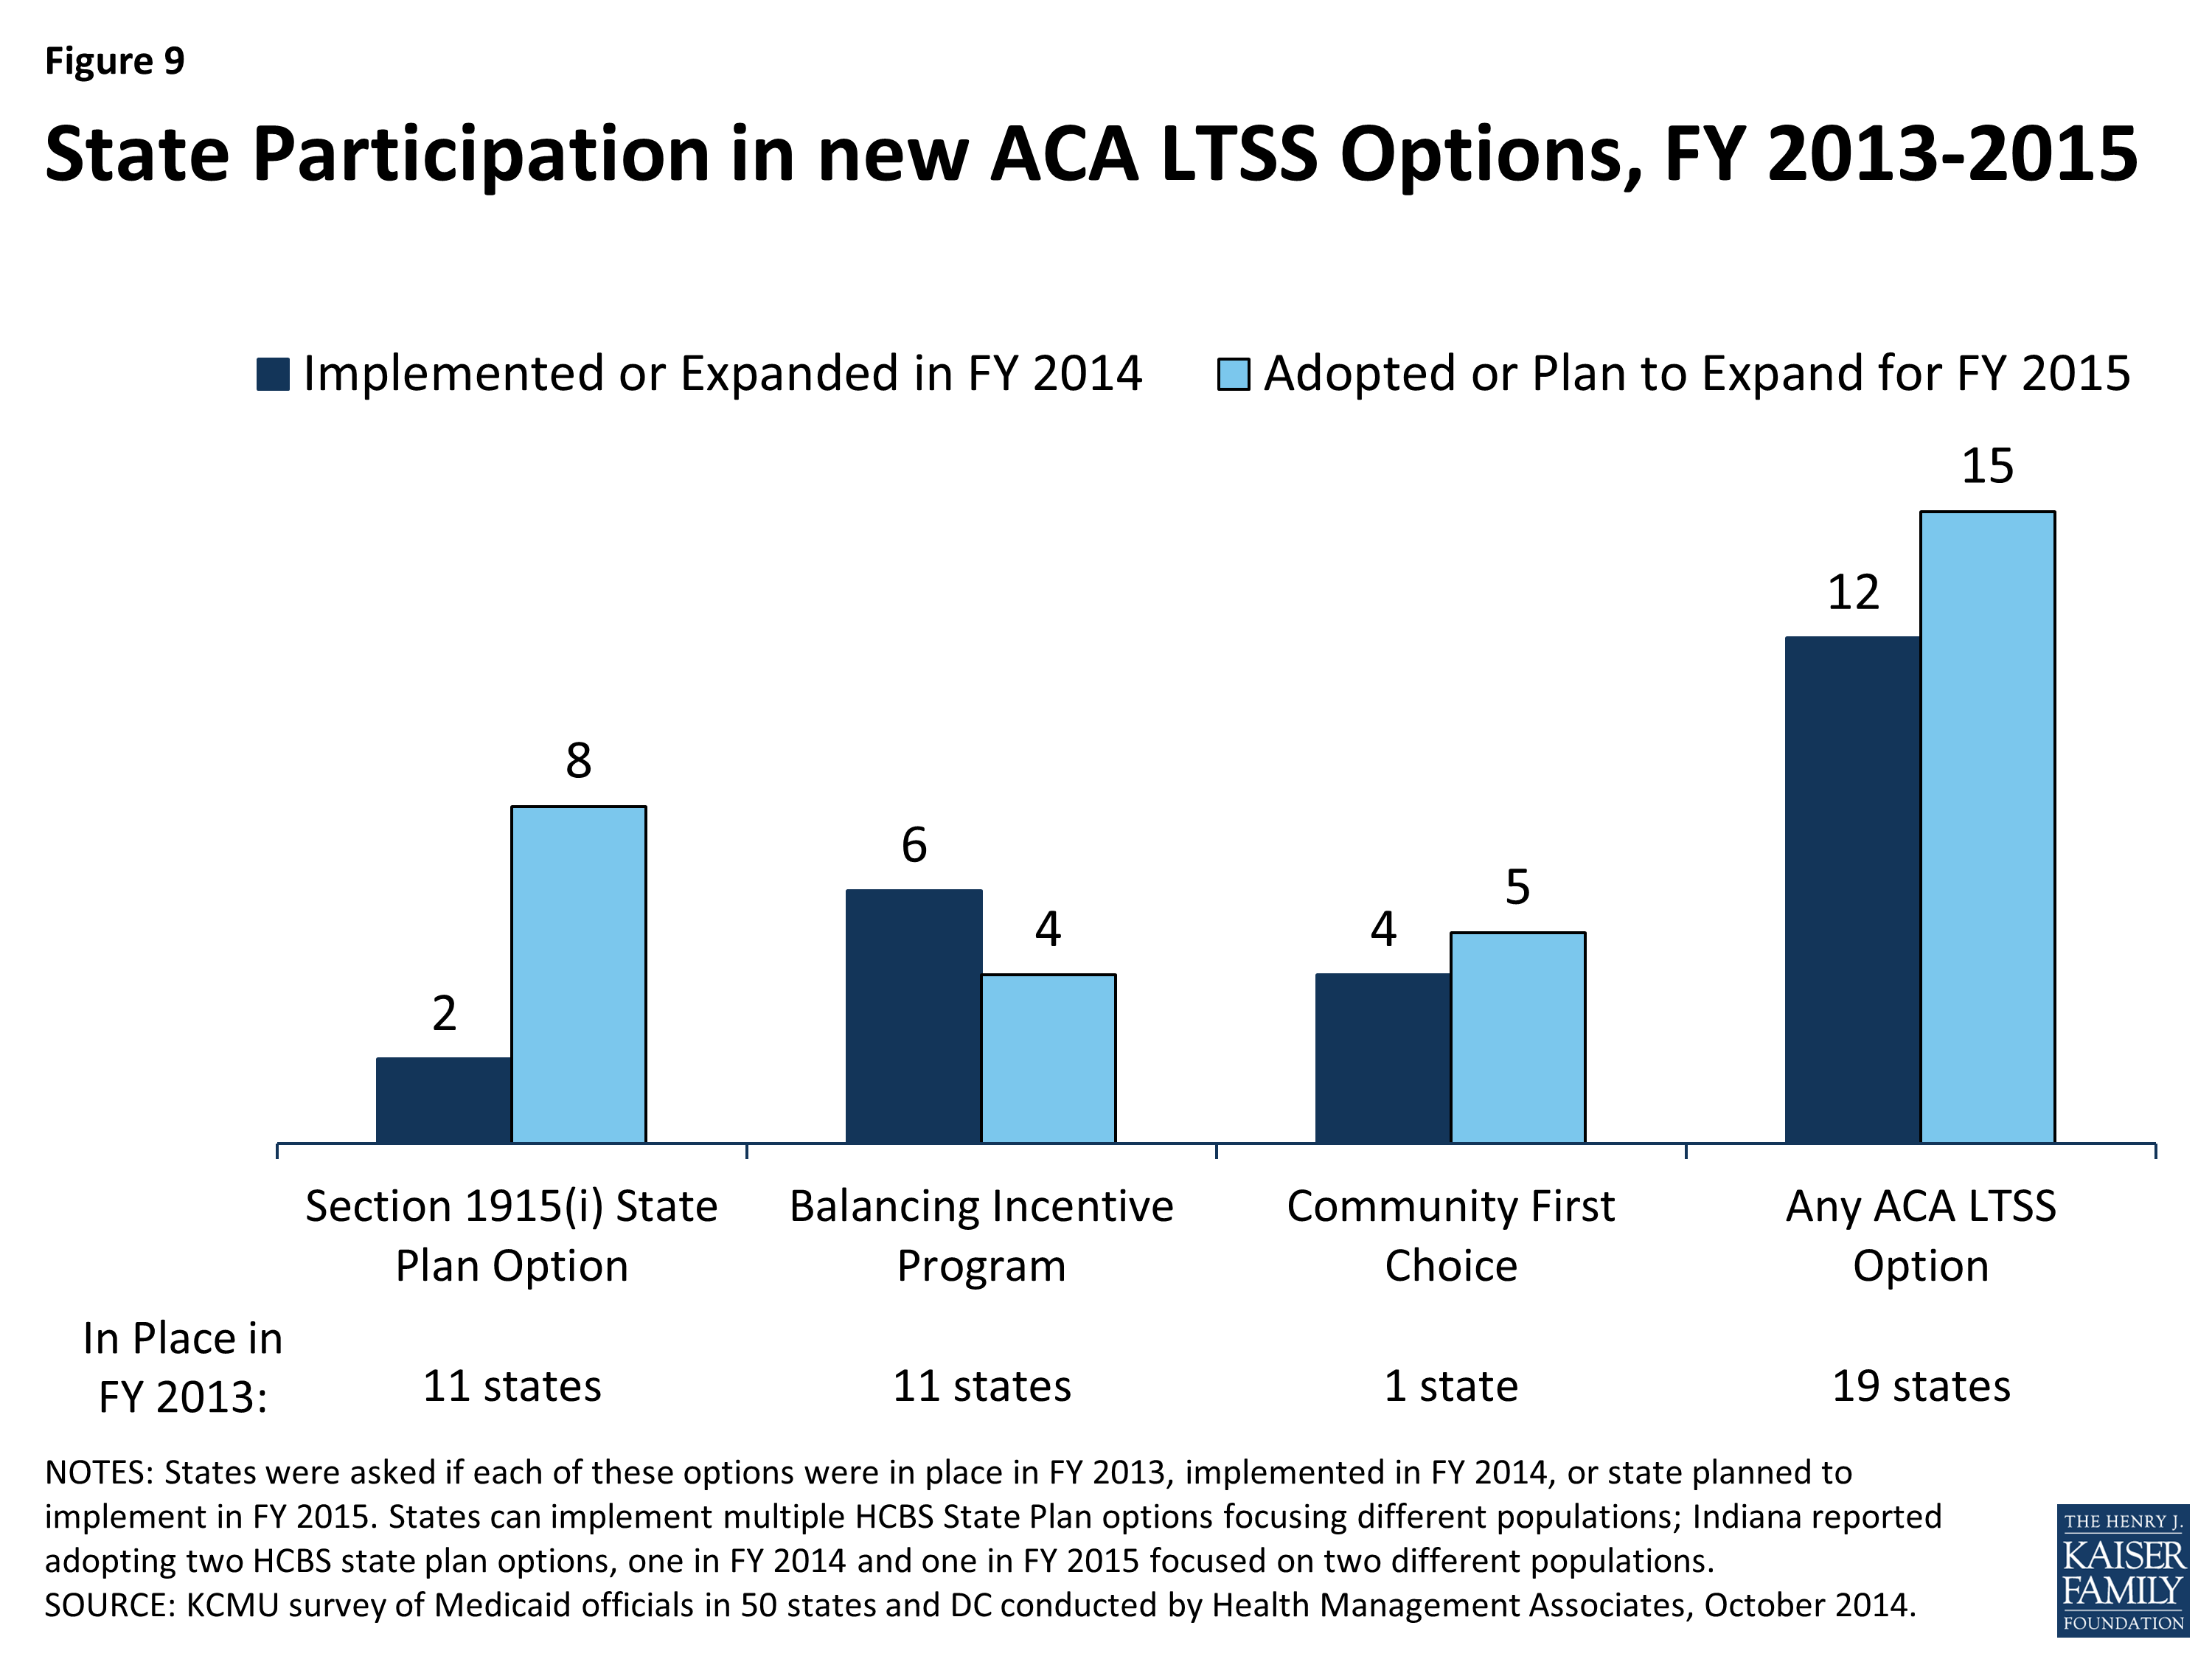
Figure 9: State Participation in new ACA LTSS Options, FY 2013-2015
Section 1915(i) HCBS State Plan Option. This option allows states to offer HCBS through a Medicaid state plan amendment rather than through a Section 1915(c) waiver. As a result of changes made in the ACA, income eligibility for this option was extended up to 300 percent of the maximum SSI federal benefit rate and states were permitted to target benefits to specific populations and offer the same range of HCBS under Section 1915(i) as are available under Section 1915(c) waivers. Unlike Section 1915(c) waivers, however, states are not permitted to cap enrollment or maintain a waiting list and, if offered, the benefit must be available statewide. If enrollment exceeds the state’s projections, the state may tighten their Section 1915(i) needs-based eligibility criteria, subject to advance notice and grandfathering of existing beneficiaries. Eleven states reported having an HCBS state plan option in place in FY 2013. Two states (Indiana and Mississippi) reported implementing in FY 2014, seven states (District of Columbia, Delaware, Maryland, Minnesota, Texas, South Carolina and Washington) reported plans to implement in FY 2015, and one state (Indiana) reported plans to implement a second HCBS state plan option amendment in FY 2015.
Balancing Incentive Program (BIP). Beginning in October 2011, BIP makes enhanced Medicaid matching funds available to certain states that meet requirements for expanding the share of LTSS spending for HCBS (and reducing the share of LTSS spending for institutional services). Funding is available through September 2015.18 To qualify, states must have devoted less than 50 percent of their LTSS spending to HCBS in FFY 2009, develop a “no wrong door/single entry point” system for all LTSS, create conflict-free case management services, and develop core standardized assessment instruments to determine eligibility for non-institutionally based LTSS. In this year’s survey, 11 states reported having BIP in place in FY 2013, six states reported implementing in FY 2014 (Connecticut, Kentucky, Massachusetts, Maine, Nevada, and New York), and four states reported plans to implement in FY 2015 (Nebraska, New Hampshire, Ohio and Pennsylvania.19)
Community First Choice (CFC) State Plan Option. Beginning in October 2011, states electing this state plan option to provide Medicaid-funded home and community-based attendant services and supports will receive an FMAP increase of six percentage points for CFC services. However, the final federal rule implementing this option was not released by CMS until May 201220, inhibiting state take-up of this option prior to FY 2013. In this year’s survey, California was the only state to report having CFC in place in FY 2013.21 Four states reported implementing this option in FY 2014 (Maryland, Minnesota, Montana and Oregon) and five states reported plans to implement in FY 2015 (Arkansas, Connecticut, New York, Texas and Washington).
Additional information on LTSS expansions implemented in FY 2014 or planned for FY 2015 can be found in Tables 5 and 6.
| New Rules Impacting HCBS Services |
|
In this year’s survey, states were asked to comment on the top issues, concerns or opportunities related to two recently released rules affecting HCBS services.
–
HCBS Rule. In January 2014, CMS issued a new HCBS regulation (the “HCBS Rule”) making a number of significant program changes including defining person-centered planning requirements for persons in HCBS settings, providing the option to combine multiple target populations into one § 1915(c) waiver, and establishing a five-year renewal cycle for § 1915(c) waivers. Perhaps most significant, however, are new requirements that define the qualities of settings that are eligible for Medicaid reimbursement under § 1915(c) waivers, the § 1915(i) HCBS State Plan Option and the Community First Choice Option.22 Almost half of the states cited concerns with the new HCBS settings requirements. Concerns were raised that the new settings requirement was “not sensitive to different needs of various LTSS populations (e.g., beneficiaries who have an intellectual disability, Alzheimer’s or other dementia or behavior issues)” and that the “emphasis on integration discounts to some extent personal choices (i.e., the choice to attend a Senior Day Center.)” A number of states expressed concerns with Transition Plan requirements, particularly the limited time provided to complete the planning process. Additional concerns were raised about the difficulty that providers, particularly those in rural areas, might face in complying with the new rules (both in terms of cost and physical plant changes). One state noted that complying with the settings requirements in assisted living and adult family care home settings was their top concern. On the other hand, a number of states noted that the new ability to consolidate multiple waivers into one combined § 1915(c) waiver and to apply common standards across waivers would be helpful. One state commented that the new rule would help the state comply with aspects of the Olmstead decision.23
–
Fair Labor Standards Act Extension to Home Care Workers. In a final rule published on October 1, 2013 (the “DOL Rule”), the U.S. Department of Labor revised the long-standing Fair Labor Standards Act (FLSA) exemptions for “companionship services” and “live-in domestic service workers.” As a result, many direct care workers (including home health aides and personal care assistants) providing essential home care assistance to persons with disabilities and older adults will become entitled to receive the FLSA minimum wage and overtime pay protections beginning in January 2015 with significant implications for many Medicaid HCBS programs. Home care agencies as well as states could be held responsible for complying with the FLSA minimum wage and overtime provisions depending on who is considered to be the home care worker’s employer. In this year’s survey, 20 states indicated that they were still assessing the impact of the rule. Eight states believed the rule would have only a minimal impact on their HCBS programs; some of these states had already applied state minimum wage and other labor requirements to their home health agencies and personal care workers.
–
Many states cited a number of concerns with the rule; most commonly noted was the negative state fiscal impact the rule was estimated to have. Oregon, for example, said that due to its robust in-home program, the fiscal impact during the state’s next budget cycle was estimated at $242 million ($74.2 million in state funds). California indicated it had the nation’s largest self-directed home care program and that in response to the rule, $172 million in state funding was added to the budget for FY 2015 and that $354.4 million annually would be needed on an ongoing basis. Other challenges of administering the rule raised by states included the need to track travel time and hours worked for multiple clients. Several states were concerned that individuals would experience service reductions or fragmented care due to the need for the state to cap service hours or otherwise reduce consumer-directed programs.
–
On October 7, the Department of Labor released a statement saying “[the] department decided to adopt a time-limited non-enforcement policy…[F]rom January 1, 2015 to June 30, 2015, the department will not bring enforcement actions against any employer who fails to comply with a [FLSA] obligation newly imposed by the rule….[F]rom July 1, 2015 to December 31, 2015, the department will exercise its discretion in determining whether to bring enforcement actions, giving strong consideration to the extent to which states and other entities have made good faith efforts to bring their home care programs into FLSA compliance.”
|
TABLE 5: LONG TERM CARE EXPANSIONS IN ALL 50 STATES AND DC, FY 2014 and 2015 |
||||||||
| States | Long Term Care Expansions | |||||||
| HCBS Expansions | Buidling Balancing Incentives in MLTSS | PACE Expansions | Total | |||||
| 2014 | 2015 | 2014 | 2015 | 2014 | 2015 | 2014 | 2015 | |
| Alabama | X | X | X | X | ||||
| Alaska | ||||||||
| Arizona | ||||||||
| Arkansas | ||||||||
| California | X | X | X | X | X | X | X | X |
| Colorado | X | X | X | X | X | |||
| Connecticut | X | X | X | X | ||||
| Delaware | X | X | X | X | X | X | X | X |
| DC | X | X | X | X | ||||
| Florida | X | X | X | X | X | X | X | X |
| Georgia | X | X | X | X | ||||
| Hawaii | X | X | X | X | ||||
| Idaho | X | X | X | X | X | |||
| Illinois | X | X | X | X | X | X | ||
| Indiana | X | X | X | X | X | X | ||
| Iowa | X | X | X | |||||
| Kansas | X | X | X | X | X | X | ||
| Kentucky | X | X | X | X | ||||
| Louisiana | X | X | ||||||
| Maine | X | X | X | X | ||||
| Maryland | X | X | X | X | ||||
| Massachusetts | X | X | X | X | X | X | X | |
| Michigan | X | X | X | X | X | X | X | |
| Minnesota | X | X | X | X | ||||
| Mississippi | X | X | ||||||
| Missouri | X | X | X | X | ||||
| Montana | X | X | ||||||
| Nebraska | X | X | X | X | X | |||
| Nevada | X | X | X | X | ||||
| New Hampshire | ||||||||
| New Jersey | X | X | X | X | X | X | X | |
| New Mexico | X | X | X | X | X | X | ||
| New York | X | X | X | X | X | X | X | X |
| North Carolina | X | X | X | X | X | |||
| North Dakota | X | X | X | X | X | |||
| Ohio | X | X | X | X | X | X | ||
| Oklahoma | X | X | X | X | X | X | ||
| Oregon | X | X | X | X | X | X | ||
| Pennsylvania | X | X | X | X | X | X | ||
| Rhode Island | X | X | X | X | X | X | X | X |
| South Carolina | X | X | X | X | X | |||
| South Dakota | X | X | X | X | ||||
| Tennessee | X | X | X | X | X | X | ||
| Texas | X | X | X | X | X | X | X | X |
| Utah | X | X | X | X | ||||
| Vermont | X | X | X | X | ||||
| Virginia | X | X | X | X | X | X | ||
| Washington | X | X | X | X | ||||
| West Virginia | X | X | X | X | ||||
| Wisconsin | X | X | X | X | X | X | ||
| Wyoming | X | X | X | |||||
| Totals | 41 | 46 | 13 | 16 | 15 | 21 | 42 | 47 |
| NOTES: HCBS Waiver or SPA Expansions includes new or expansions of 1915c waivers as well as 1915i state plan options. Minnesota reported covering more individuals under their Community First Services and Supports Program which operates through a Section 1115 waiver; this change is counted under HCBS waiver or SPA expansions. In addition to the actions reported here, states also reported expanding the number served in the community through the new ACA options (Balancing Incentive Program, Community First Choice) as well as closing/downsizing state institutions and implementing/tightening certificate of need programs. SOURCE: Kaiser Commission on Medicaid and the Uninsured Survey of Medicaid Officials in 50 states and DC conducted by Health Management Associates, October 2014. |
||||||||
TABLE 6: STATE ADOPTION OF ACA LTSS OPTIONS IN ALL 50 STATES AND DC, FY 2013 – 2015 |
||||||||||||
| 1915(i) State Plan Option | Balancing Incentives Program | Community First Choice | Any ACA LTC Option | |||||||||
| In Place | New in: | In Place | New in: | In Place | New in: | In Place | New in: | |||||
| 2013 | 2014 | 2015 | 2013 | 2014 | 2015 | 2013 | 2014 | 2015 | 2013 | 2014 | 2015 | |
| Alabama | ||||||||||||
| Alaska | ||||||||||||
| Arizona | ||||||||||||
| Arkansas | X | X | X | X | X | |||||||
| California | X | X | X | |||||||||
| Colorado | ||||||||||||
| Connecticut | X | X | X | X | X | X | ||||||
| Delaware | X | X | ||||||||||
| DC | X | X | ||||||||||
| Florida | X | X | ||||||||||
| Georgia | X | X | ||||||||||
| Hawaii | ||||||||||||
| Idaho | X | X | ||||||||||
| Illinois | X | X | ||||||||||
| Indiana | X | X | X | X | X | X | ||||||
| Iowa | X | X | X | |||||||||
| Kansas | ||||||||||||
| Kentucky | X | X | ||||||||||
| Louisiana | X | X | X | |||||||||
| Maine | X | X | ||||||||||
| Maryland | X | X | X | X | X | X | ||||||
| Massachusetts | X | X | ||||||||||
| Michigan | ||||||||||||
| Minnesota | X | X | X | X | ||||||||
| Mississippi | X | X | X | X | ||||||||
| Missouri | X | X | ||||||||||
| Montana | X | X | X | X | ||||||||
| Nebraska | X | X | ||||||||||
| Nevada | X | X | X | X | ||||||||
| New Hampshire | X | X | ||||||||||
| New Jersey | X | X | ||||||||||
| New Mexico | ||||||||||||
| New York | X | X | X | X | ||||||||
| North Carolina | ||||||||||||
| North Dakota | ||||||||||||
| Ohio | X | X | ||||||||||
| Oklahoma | ||||||||||||
| Oregon | X | X | X | X | ||||||||
| Pennsylvania | X | X | ||||||||||
| Rhode Island | ||||||||||||
| South Carolina | X | X | ||||||||||
| South Dakota | ||||||||||||
| Tennessee | ||||||||||||
| Texas | X | X | X | X | X | |||||||
| Utah | ||||||||||||
| Vermont | ||||||||||||
| Virginia | ||||||||||||
| Washington | X | X | X | |||||||||
| West Virginia | ||||||||||||
| Wisconsin | X | X | ||||||||||
| Wyoming | ||||||||||||
| Totals | 11 | 2 | 8 | 11 | 6 | 4 | 1 | 4 | 5 | 19 | 12 | 15 |
| NOTES: States were asked if each of these options were in place in FY 2013, implemented in FY 2014, or state planned to implement in FY 2015. States can implement multiple HCBS State Plan options focusing different populations; Indiana reported adopting two HCBS state plan options, one in FY 2014 and one in FY 2015 focused on two different populations.SOURCE: Kaiser Commission on Medicaid and the Uninsured Survey of Medicaid Officials in 50 states and DC conducted by Health Management Associates, October 2014. | ||||||||||||
Provider Rates and Taxes or Fees
Provider Rates
Medicaid provider rates are affected by state fiscal conditions. During economic downturns, states often turn to provider rate cuts to control costs. This was the case during the Great Recession and during the economic downturn from 2001 to 2004. Improving state finances in recent years have resulted in more states enhancing rates than restricting rates overall. In FY 2014, 34 states reported one or more rate restrictions across provider types and 46 states reported one or more rate increases. For FY 2015, 33 states have planned at least one provider rate restriction while 45 states are planning at least one rate increase. Reflecting improvements in the economy, there were more rate increases in FY 2014 and FY 2015 across all major categories of providers (physicians, MCOs and nursing homes) except for inpatient rates for hospitals than in previous years.1 (Figure 10) Twelve states (Colorado, Hawaii, Idaho, Kentucky, Massachusetts, Nebraska, New Jersey, North Dakota, South Carolina, Vermont, Wisconsin, and West Virginia) reported no rate restrictions either year. In addition to these 12, five states had no restrictions in FY 2014, and six states reported no restrictions in FY 2015.
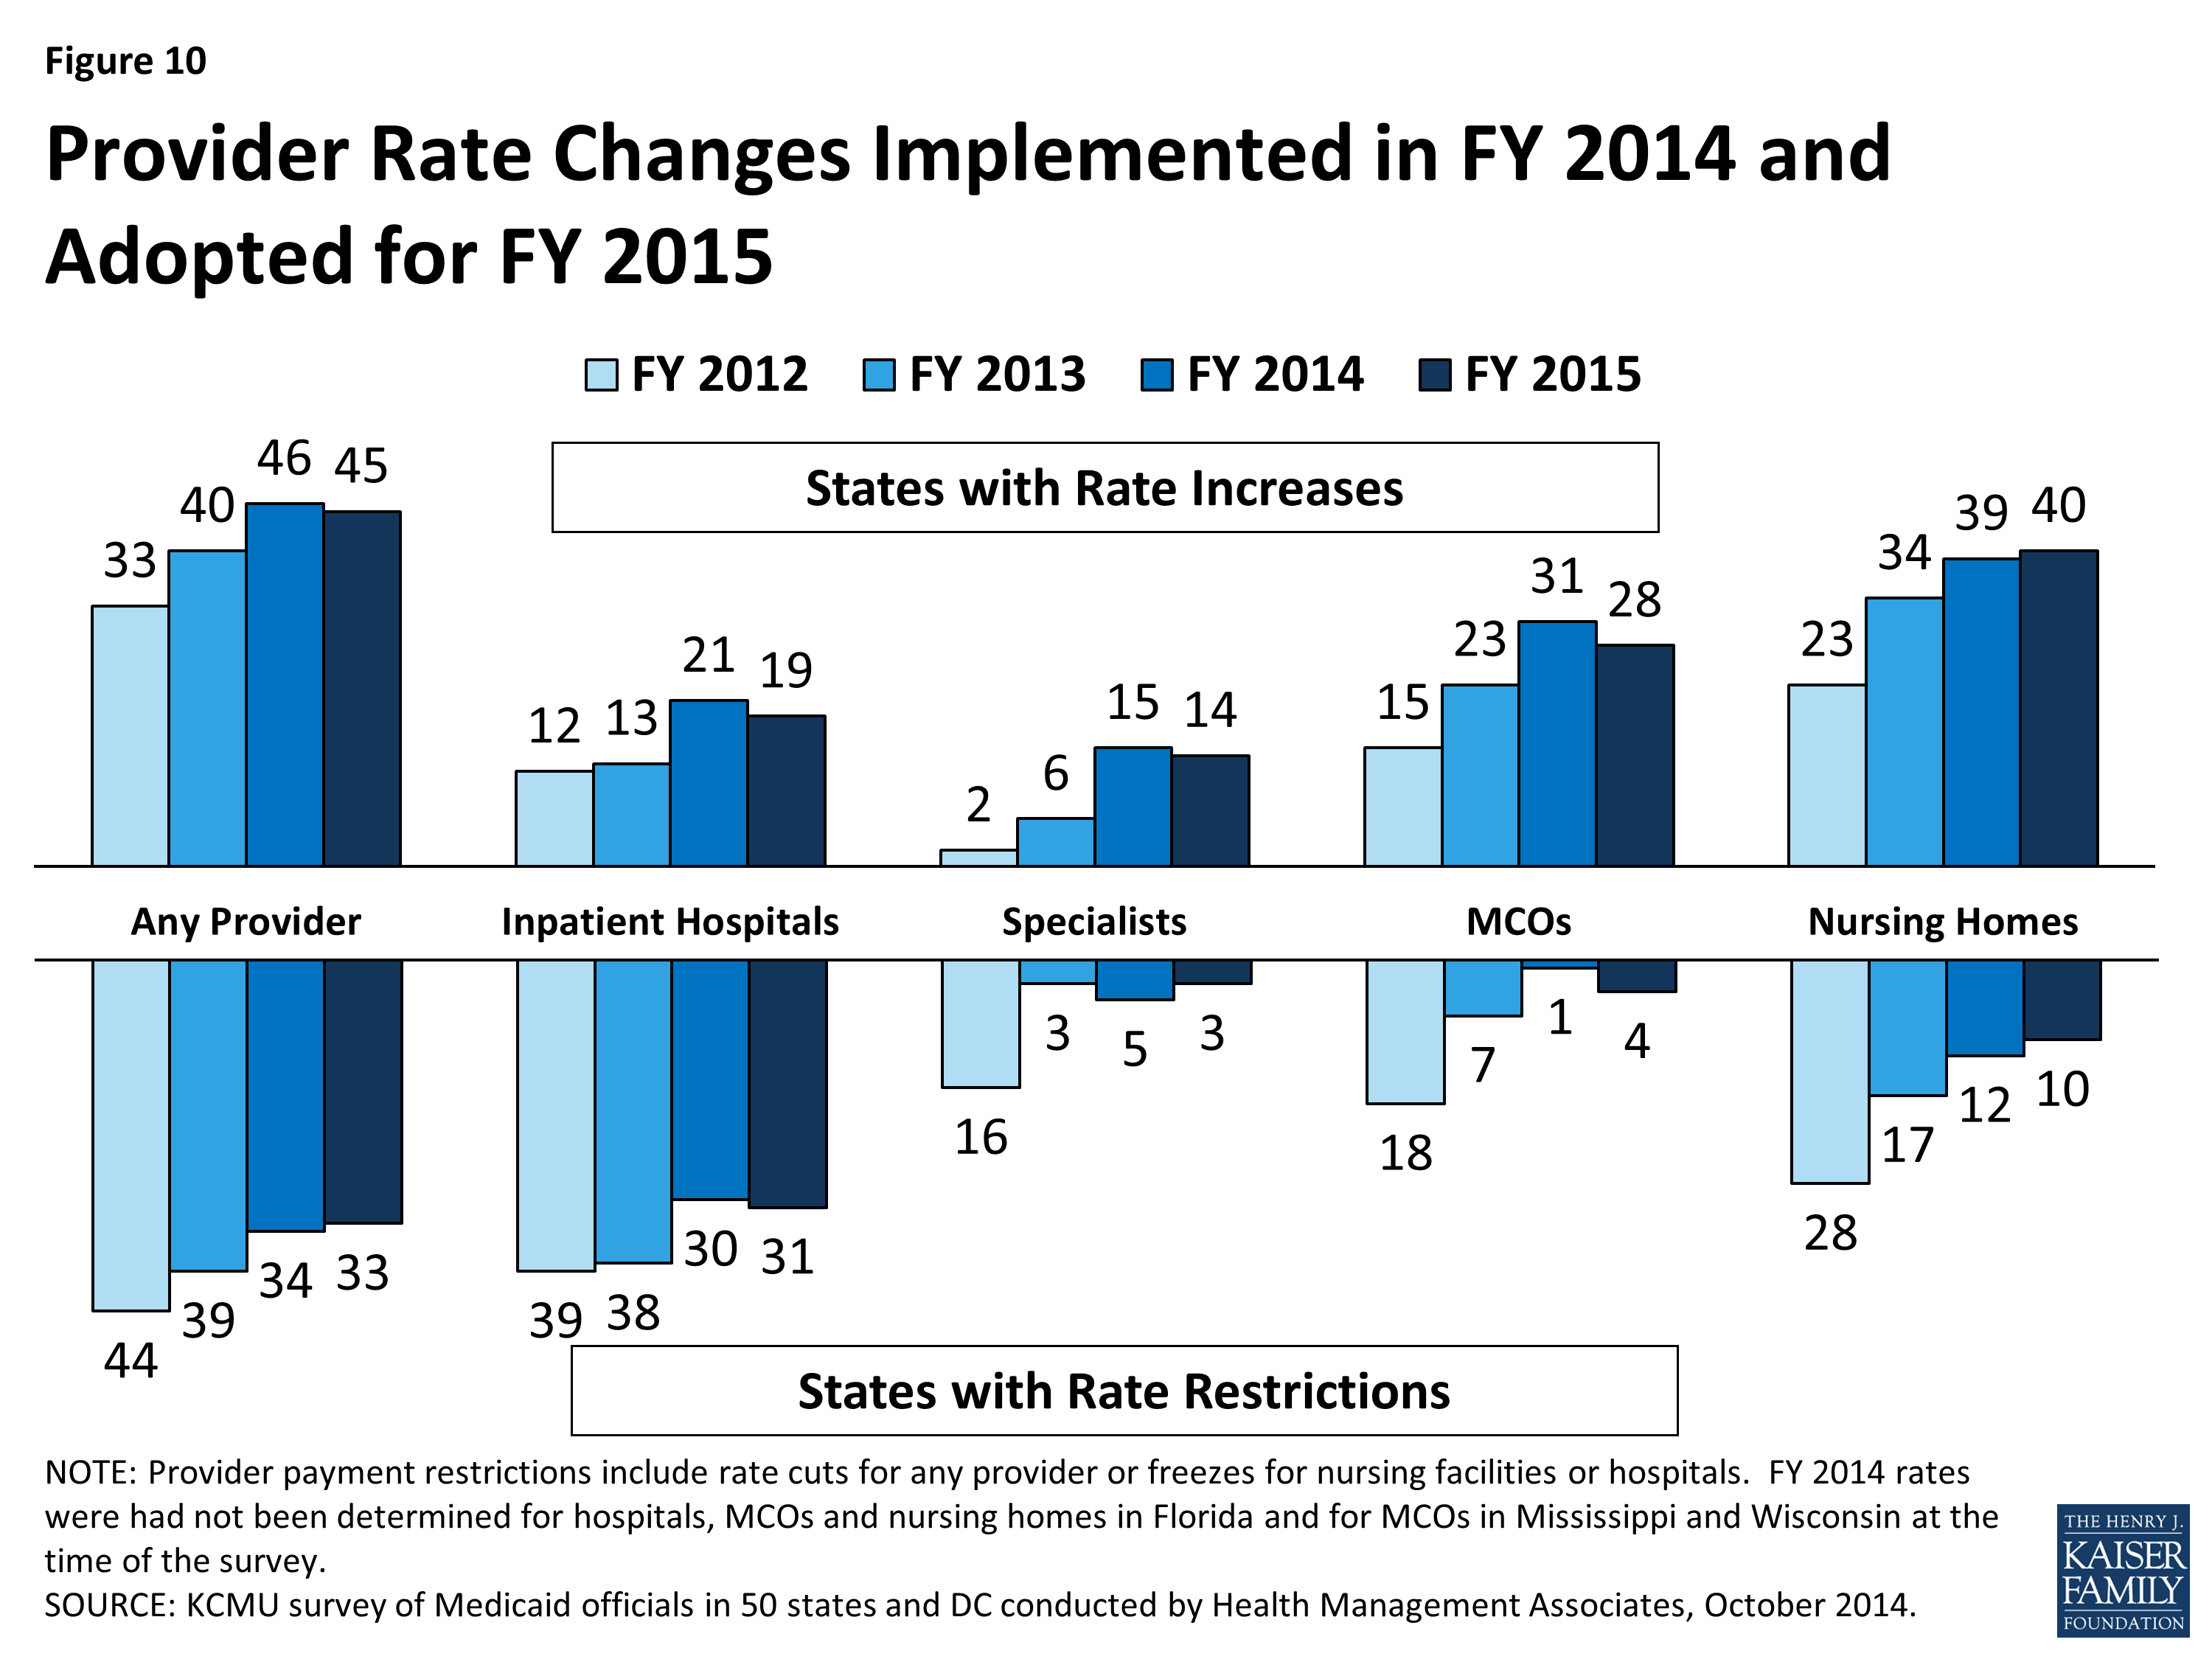
Figure 10: Provider Rate Changes Implemented in FY 2014 and Adopted for FY 2015
Institutional providers like hospitals and nursing homes are more likely than other providers to have inflation adjustments built into their rates, so historically they have been more likely than other groups to have rate increases. States are also more likely to use provider tax arrangements to support Medicaid payment rates for these provider groups. However, even with improvements in the economy and the use of hospital provider taxes in most states, hospitals are not seeing increases in their Medicaid rates in the majority of states while more than half of states report restrictions in hospital rates; nearly all of these states held inpatient hospital rates flat with a small number of states cutting such rates. Managed Care Organizations (MCOs) are generally bolstered by the federal requirement that states pay actuarially sound rates. In FY 2014 and FY 2015, the majority of states reported increases or planned increases in MCO rates with few states reporting restrictions.
Overall, about half of states increased rates for one or more physician groups in both FY 2014 and FY 2015 while fewer states imposed rate cuts for such groups; a sharp change from recent years. The survey asked more specifically about rates for specialists, dentists and for outpatient services. For each of these categories, states reported more rate increases than rate restrictions. (See following table).
| States Changing Rates for Specialist, Dental, and Outpatient Hospital, FY 2012-FY 2015 | ||||||||
| Provider Type | FY 2012 Rates | FY 2013 Rates | FY 2014 Rates | FY 2015 Rates | ||||
| Increase | Decrease | Increase | Decrease | Increase | Decrease | Increase | Decrease | |
| Specialists | 2 | 16 | 6 | 3 | 15 | 5 | 14 | 3 |
| Dentists | 3 | 13 | 5 | 2 | 12 | 4 | 11 | 3 |
| Outpatient Hospital | 14 | 5 | 20 | 7 | 17 | 2 | ||
| NOTE: States were not asked about Outpatient hospital rates in FY 2012 or prior years. | ||||||||
| Primary Care Payments |
The ACA included a provision to increase Medicaid payment rates for primary care services to Medicare rates from January 1, 2013 through December 31, 2014. The federal government funded 100 percent of the difference between Medicaid rates that were in effect as of July 1, 2009 and the full Medicare rates for these two years. States were asked about their plans to extend this provision beyond December 31, 2014 (at regular FMAP rates). For states that have Medicaid rates for physician services that were already at or close to 100 percent of Medicare rates, this issue was not significant.
|
Provider Rates Methodology Note
For the purposes of this report, provider rate restrictions include cuts to rates for physicians, dentists, outpatient hospitals, and managed care organizations as well as both cuts or freezes in rates for inpatient hospitals and nursing homes.
Provider Taxes and Fees
States continue to rely on provider taxes and fees to provide a portion of the non-federal share of the costs of Medicaid. At the beginning of FY 2003, a total of 21 states had at least one provider tax in place; the most common provider tax was a tax on nursing facilities (44 states.) Over the past decade, a majority of states imposed new taxes and increased existing tax rates to raise revenue. By FY 2013, all but one state (Alaska) had one or more provider taxes in place.
Since FY 2013 there have been few changes in the number of provider taxes. In FY 2014, one provider tax (MCO tax in Oregon) was eliminated and two provider taxes (hospital tax in Arizona and a MCO tax in New Mexico2) were added. Arizona’s hospital fee will be used to fund costs related to their coverage restoration and eventually costs related to the Medicaid expansion in later years. In FY 2015, two states (Oregon and the District of Columbia) reported plans to eliminate hospital taxes and two states reported plans to add provider taxes. Illinois plans to implement a tax on providers in the Supportive Living Program; New Hampshire plans to implement a new MCO tax. A limited number of states reported changes to tax rates in FY 2014 and FY 2015, most notable were increases to rates for hospital taxes and fees (6 states in FY 2014 and 8 states in FY 2015) as well as increases to rates for nursing home taxes and fees in five states each year. A small number of states also reported reducing tax rates, again mostly for hospital and nursing home taxes and fees.
Tables 7 and 8 provide a complete listing of Medicaid provider rate changes for FY 2014 and FY 2015. Table 9 provides a complete listing of Medicaid provider taxes in place for FYs 2014 and 2015.
TABLE 7: PROVIDER RATE CHANGES TAKEN BY ALL 50 STATES AND DC, FY 2014 |
||||||||||||||
| States |
Inpatient
Hospital
|
Outpatient Hospital | Specialists | Dentists | Managed Care Organizations | Nursing Facilities | Total | |||||||
| Increase Rates | Restrict Rates | Increase Rates | Restrict Rates | Increase Rates | Restrict Rates | Increase Rates | Restrict Rates | Increase Rates | Restrict Rates | Increase Rates | Restrict Rates | Increase Rates | Restrict Rates | |
| Alabama | X | X | — | — | X | X | X | |||||||
| Alaska | X | X | X | X | — | — | X | X | X | |||||
| Arizona | X | X | X | X | X | X | X | X | ||||||
| Arkansas | X | — | — | X | X | X | ||||||||
| California | X | X | X | X | X | X | X | |||||||
| Colorado | X | X | X | X | X | X | X | |||||||
| Connecticut | X | — | — | X | X | |||||||||
| Delaware | X | X | X | X | X | X | X | X | ||||||
| DC | X | X | X | X | X | X | X | |||||||
| Florida | X | X | X | X | X | X | ||||||||
| Georgia | X | X | X | X | X | |||||||||
| Hawaii | X | X | X | X | ||||||||||
| Idaho | X | X | — | — | X | X | ||||||||
| Illinois | X | X | X | X | X | |||||||||
| Indiana | X | X | X | X | X | X | ||||||||
| Iowa | X | X | X | X | X | X | X | |||||||
| Kansas | X | X | X | X | X | |||||||||
| Kentucky | X | X | X | X | ||||||||||
| Louisiana | X | X | X | X | X | |||||||||
| Maine | X | X | — | — | X | X | X | |||||||
| Maryland | X | X | X | X | X | X | ||||||||
| Massachusetts | X | X | X | X | X | |||||||||
| Michigan | X | X | X | X | X | |||||||||
| Minnesota | X | X | X | X | X | X | X | |||||||
| Mississippi | X | X | X | X | X | |||||||||
| Missouri | X | X | X | X | X | X | ||||||||
| Montana | X | X | X | — | — | X | X | |||||||
| Nebraska | X | X | X | X | X | X | ||||||||
| Nevada | X | X | X | X | X | X | X | |||||||
| New Hampshire | X | X | X | |||||||||||
| New Jersey | X | X | X | X | X | |||||||||
| New Mexico | X | X | X | X | X | |||||||||
| New York | X | X | X | X | X | |||||||||
| North Carolina | X | X | X | X | X | X | ||||||||
| North Dakota | X | X | X | X | X | X | ||||||||
| Ohio | X | X | X | X | X | X | ||||||||
| Oklahoma | X | X | — | — | X | X | X | |||||||
| Oregon | X | X | X | X | X | |||||||||
| Pennsylvania | X | X | X | X | X | |||||||||
| Rhode Island | X | X | X | X | X | |||||||||
| South Carolina | X | X | X | X | X | |||||||||
| South Dakota | X | X | X | — | — | X | X | X | ||||||
| Tennessee | X | X | X | X | ||||||||||
| Texas | X | X | X | X | X | X | ||||||||
| Utah | X | X | X | X | X | X | ||||||||
| Vermont | X | X | X | X | — | — | X | X | ||||||
| Virginia | X | X | X | X | X | |||||||||
| Washington | X | X | X | X | X | |||||||||
| West Virginia | X | X | X | X | ||||||||||
| Wisconsin | X | X | X | X | X | X | ||||||||
| Wyoming | X | X | — | — | X | X | ||||||||
| Totals | 21 | 30 | 20 | 7 | 15 | 5 | 12 | 4 | 31 | 1 | 39 | 12 | 46 | 34 |
|
NOTES: For the purposes of this report, provider rate restrictions include cuts to rates for physicians, dentists, outpatient hospitals, and managed care organizations as well as both cuts or freezes in rates for inpatient hospitals and nursing homes.
Also, mandatory requirements, such as the increase in primary care rates under the ACA, were excluded from these counts. SOURCE: Kaiser Commission on Medicaid and the Uninsured Survey of Medicaid Officials in 50 states and DC conducted by Health Management Associates, October 2014.
|
||||||||||||||
TABLE 8: PROVIDER RATE CHANGES TAKEN BY ALL 50 STATES AND DC, FY 2015 |
||||||||||||||
| States | Inpatient Hospital | Outpatient Hospital | Specialists | Dentists | Managed Care Organizations | Nursing Facilities | Total | |||||||
| Increase Rates | Restrict Rates | Increase Rates | Restrict Rates | Increase Rates | Restrict Rates | Increase Rates | Restrict Rates | Increase Rates | Restrict Rates | Increase Rates | Restrict Rates | Increase Rates | Restrict Rates | |
| Alabama | X | X | X | — | — | X | X | X | ||||||
| Alaska | X | X | X | X | — | — | TBD | TBD | X | |||||
| Arizona | X | X | X | X | X | |||||||||
| Arkansas | X | — | — | X | X | X | ||||||||
| California | X | X | X | X | ||||||||||
| Colorado | X | X | X | X | X | X | X | |||||||
| Connecticut | X | — | — | X | X | |||||||||
| Delaware | X | X | X | X | X | X | X | X | ||||||
| DC | X | X | X | X | X | X | X | |||||||
| Florida | X | TBD | TBD | X | X | X | X | |||||||
| Georgia | X | X | X | X | X | |||||||||
| Hawaii | X | X | X | X | ||||||||||
| Idaho | X | X | X | X | X | |||||||||
| Illinois | X | X | X | X | X | X | ||||||||
| Indiana | X | X | X | X | X | |||||||||
| Iowa | X | X | X | X | ||||||||||
| Kansas | X | X | X | X | X | |||||||||
| Kentucky | X | X | X | X | ||||||||||
| Louisiana | X | X | X | X | X | X | ||||||||
| Maine | X | — | — | X | X | X | ||||||||
| Maryland | X | X | X | X | X | X | ||||||||
| Massachusetts | X | X | X | X | X | |||||||||
| Michigan | X | X | X | X | X | |||||||||
| Minnesota | X | X | X | |||||||||||
| Mississippi | X | X | X | X | X | |||||||||
| Missouri | X | X | X | X | X | X | ||||||||
| Montana | X | X | X | X | — | — | X | X | X | |||||
| Nebraska | X | X | X | X | X | X | X | |||||||
| Nevada | X | X | X | X | X | |||||||||
| New Hampshire | X | X | X | X | X | |||||||||
| New Jersey | X | X | X | X | X | |||||||||
| New Mexico | X | X | X | X | X | |||||||||
| New York | X | X | X | X | X | X | ||||||||
| North Carolina | X | X | X | X | X | |||||||||
| North Dakota | X | X | X | X | TBD | TBD | X | X | ||||||
| Ohio | X | X | X | |||||||||||
| Oklahoma | X | X | X | X | — | — | X | X | ||||||
| Oregon | X | X | X | X | X | |||||||||
| Pennsylvania | X | X | X | X | X | |||||||||
| Rhode Island | X | X | X | X | X | |||||||||
| South Carolina | X | X | X | X | X | |||||||||
| South Dakota | X | X | X | X | — | — | X | X | ||||||
| Tennessee | X | X | X | X | X | |||||||||
| Texas | X | X | X | X | X | |||||||||
| Utah | X | X | X | X | X | X | ||||||||
| Vermont | X | X | X | X | — | — | X | X | ||||||
| Virginia | X | X | X | X | X | X | ||||||||
| Washington | X | X | X | X | ||||||||||
| West Virginia | X | X | X | X | ||||||||||
| Wisconsin | TBD | TBD | TBD | TBD | X | TBD | TBD | X | X | |||||
| Wyoming | X | — | — | X | X | |||||||||
| Totals | 19 | 31 | 17 | 2 | 14 | 3 | 11 | 3 | 28 | 4 | 40 | 10 | 45 | 33 |
|
NOTES: For the purposes of this report, provider rate restrictions include cuts to rates for physicians, dentists, outpatient hospitals, and managed care organizations as well as both cuts or freezes in rates for inpatient hospitals and nursing homes. Changes to primary care rates were asked about separately and are not included in this table. TBD – At the time of the survey, some rates for a few states were still being determined; these are denoted as TBD.
SOURCE: Kaiser Commission on Medicaid and the Uninsured Survey of Medicaid Officials in 50 states and DC conducted by Health Management Associates, October 2014.
|
||||||||||||||
TABLE 9: PROVIDER TAXES IN PLACE IN THE 50 STATES AND DC, FY 2014 AND 2015 |
||||||||||
| States | Hospitals | Intermediate Care Facilities | Nursing Facilities | Other | Any Provider Tax | |||||
| 2014 | 2015 | 2014 | 2015 | 2014 | 2015 | 2014 | 2015 | 2014 | 2015 | |
| Alabama | X | X | X | X | X | X | X | X | ||
| Alaska | ||||||||||
| Arizona | X | X | X | X | X | X | X | X | ||
| Arkansas | X | X | X | X | X | X | X | X | ||
| California | X | X | X | X | X | X | X | X | X | X |
| Colorado | X | X | X | X | X | X | X | X | ||
| Connecticut | X | X | X | X | X | X | X | X | ||
| Delaware | X | X | X | X | ||||||
| DC | X | X | X | X | X | X | X | X | X | |
| Florida | X | X | X | X | X | X | X | X | ||
| Georgia | X | X | X | X | X | X | X | X | ||
| Hawaii | X | X | X | X | X | X | ||||
| Idaho | X | X | X | X | X | X | X | X | ||
| Illinois | X | X | X | X | X | X | X | X | X | |
| Indiana | X | X | X | X | X | X | X | X | ||
| Iowa | X | X | X | X | X | X | X | X | ||
| Kansas | X | X | X | X | X | X | ||||
| Kentucky | X | X | X | X | X | X | X | X | X | X |
| Louisiana | X | X | X | X | X | X | X | X | ||
| Maine | X | X | X | X | X | X | X | X | X | X |
| Maryland | X | X | X | X | X | X | X | X | X | X |
| Massachusetts | X | X | X | X | X | X | X | |||
| Michigan | X | X | X | X | X | X | ||||
| Minnesota | X | X | X | X | X | X | X | X | X | X |
| Mississippi | X | X | X | X | X | X | X | X | X | X |
| Missouri | X | X | X | X | X | X | X | X | X | X |
| Montana | X | X | X | X | X | X | X | X | ||
| Nebraska | X | X | X | X | X | X | ||||
| Nevada | X | X | X | X | ||||||
| New Hampshire | X | X | X | X | X | X | X | |||
| New Jersey | X | X | X | X | X | X | X | X | X | X |
| New Mexico | X | X | X | X | ||||||
| New York | X | X | X | X | X | X | X | X | X | X |
| North Carolina | X | X | X | X | X | X | X | X | ||
| North Dakota | X | X | X | X | ||||||
| Ohio | X | X | X | X | X | X | X | X | ||
| Oklahoma | X | X | X | X | X | X | X | X | ||
| Oregon | X | X | X | X | X | |||||
| Pennsylvania | X | X | X | X | X | X | X | X | X | X |
| Rhode Island | X | X | X | X | X | X | X | X | ||
| South Carolina | X | X | X | X | X | X | ||||
| South Dakota | X | X | X | X | ||||||
| Tennessee | X | X | X | X | X | X | X | X | X | X |
| Texas | X | X | X | X | X | X | ||||
| Utah | X | X | X | X | X | X | X | X | ||
| Vermont | X | X | X | X | X | X | X | X | X | X |
| Virginia | X | X | X | X | ||||||
| Washington | X | X | X | X | X | X | X | X | ||
| West Virginia | X | X | X | X | X | X | X | X | X | X |
| Wisconsin | X | X | X | X | X | X | X | X | X | X |
| Wyoming | X | X | X | X | ||||||
| Totals | 40 | 38 | 37 | 37 | 44 | 44 | 21 | 24 | 50 | 50 |
| NOTES: This table includes Medicaid provider taxes as reported by states. Other taxes include taxes on provider types not listed, including but not limited to MCOs. It is possible that there are other sources of revenue from taxes collected on health insurance premiums not reflected here. In FY 2014 and FY 2015, Louisiana, Missouri, New Jersey, New York, Vermont and West Virginia reported two provider taxes or fees that are categorized as “Other.” In FY 2015 only, New Mexico reported two provider taxes or fees that are categorized as “Other.” SOURCE: Kaiser Commission on Medicaid and the Uninsured Survey of Medicaid Officials in 50 states and DC conducted by Health Management Associates, October 2014. |
||||||||||
Benefits Changes
In this year’s survey, the number of states reporting benefit cuts or restrictions – four in FY 2014 and two in FY 2015 – fell to the lowest level since 2008. (Figure 11) A far larger number of states, 21 states in FY 2014 and 22 in FY 2015, reported enhancing or adding new benefits. (Figure 11) The most common benefit enhancements or additions reported were for behavioral health services (10 in FY 2014; 5 in FY 2015.)
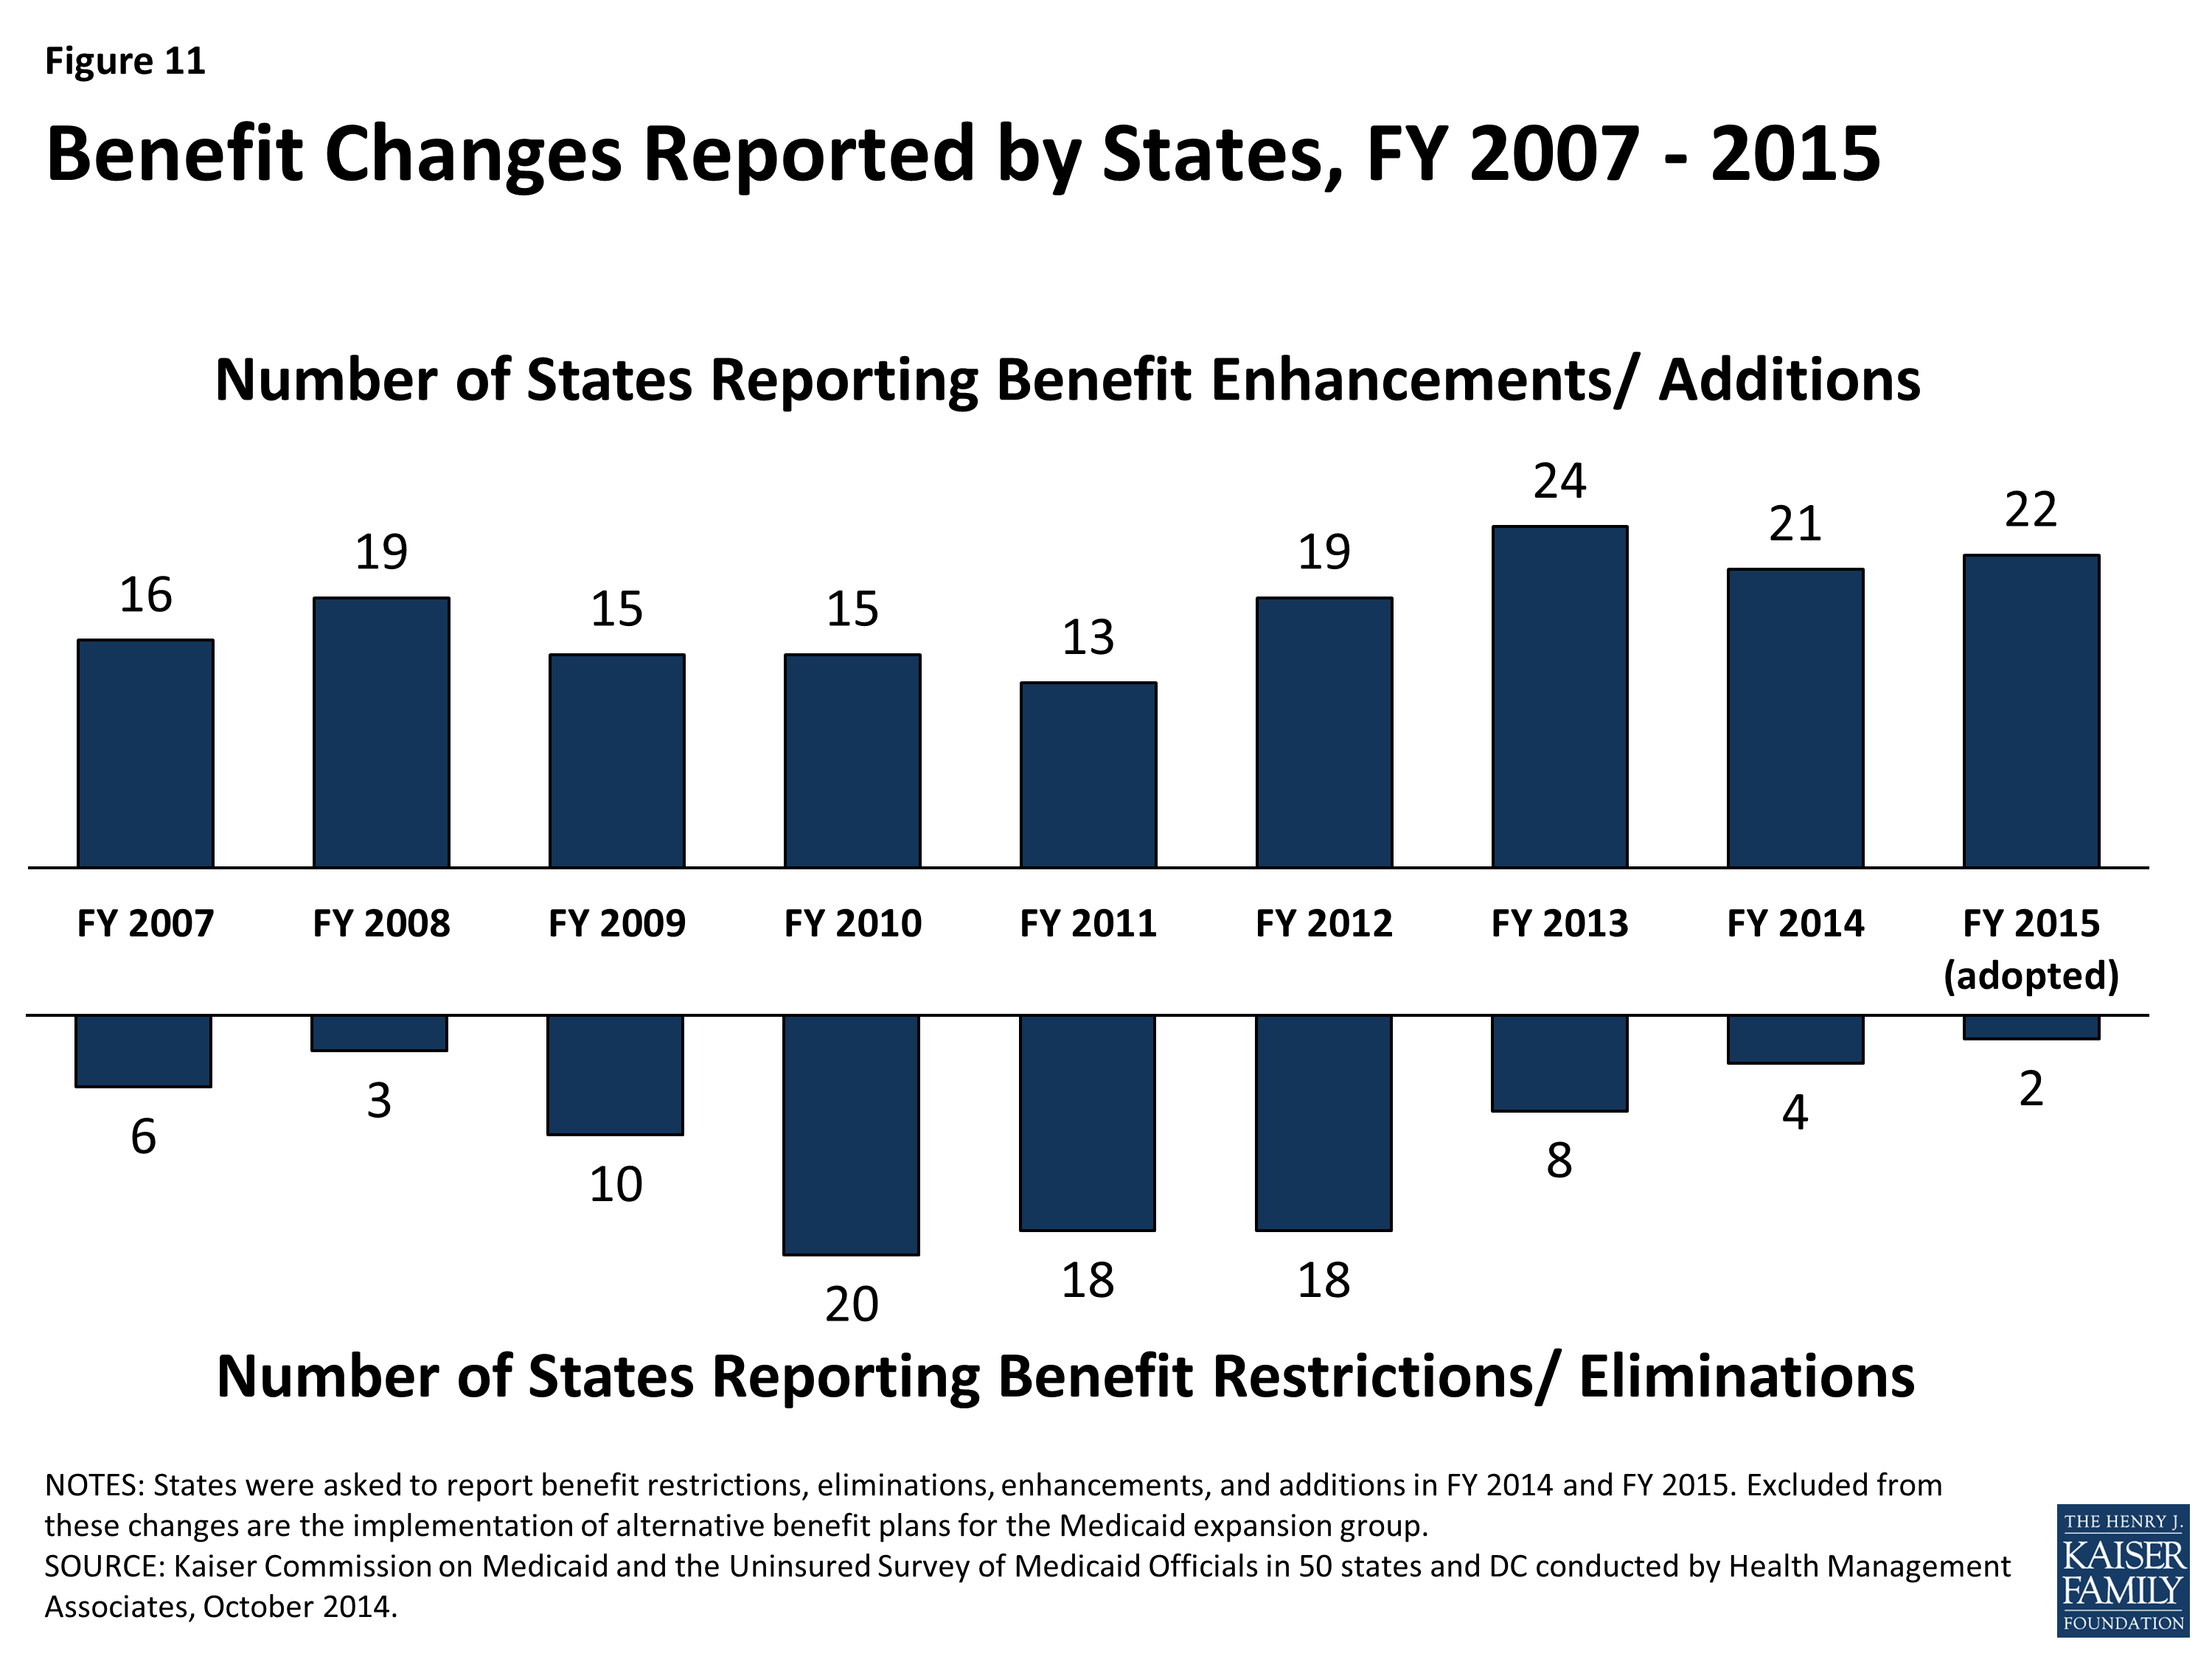
Figure 11: Benefit Changes Reported by States, FY 2007-2015
Other common benefit enhancements reported include home and community-based services (4 states in FY 2014; 9 states in FY 2015) such as Delaware’s new Pathways Program that provides supported employment services for those with disabilities, as well as dental services (7 states in FY 2014; 4 states in FY 2015.) Some states also reported expanding preventive services (adding coverage of vaccines and tobacco cessation services beyond ACA requirements.) South Carolina is planning to expand preventive services (e.g. diabetes screening, physical and behavioral health assessments, HIV screenings) covered under its family planning program. California is planning a notable benefit expansion for pregnant women in FY 2015: since this group will not qualify as “newly eligible” under the ACA, the state is planning to provide the full Medicaid benefit package to pregnant women up to 138 percent FPL in place of the current, more limited pregnancy-related benefit package.
Benefit restrictions reflect the elimination of a covered benefit or the application of utilization controls for existing benefits. Of the four states in FY 2014 reporting cuts or eliminations, two (New York and West Virginia) reported narrowly targeted benefit eliminations. Three states (including New York) applied narrowly targeted limits or utilization controls to existing benefits.
Pennsylvania included several far-reaching benefit changes as part of its original Healthy Pennsylvania waiver proposal. The original waiver proposal would have resulted in two reformed Medicaid benefit packages for all adults: a “high-risk” plan (for medically frail, disabled, pregnant, institutionalized and dual-eligible enrollees) and a “low-risk” plan with fewer benefits. The waiver approved in August 2014 included a one-year waiver that allows the state to not cover non-emergency medical transportation but did not ultimately include most of these benefit changes; instead these changes will be pursued under state plan amendments, based on the agreement reached by CMS and the state on “the overall benefits approach.1” The benefit changes originally proposed included eliminating coverage of some services (e.g. optometry, podiatry, chiropractic, and some long term care services) while also limiting other services (e.g. physician and clinic visits, radiology, laboratory, long-term services.) At the time of this report, state plan amendments had not yet been submitted to CMS.
Table 10 provides a complete listing of Medicaid benefit changes for FYs 2014 and 2015.
| Alternative Benefit Package |
|
In addition to asking about benefit policy changes, this year’s survey asked each of the 28 states that have implemented, or will implement, the ACA Medicaid expansion to identify any key differences between the Alternative Benefits Plan (ABP) offered to newly-eligible adults and the state’s traditional Medicaid State Plan benefit. Alternative Benefit Plans must meet the “Essential Health Benefits” (EHBs) and mental health parity requirements applicable to Qualified Health Plans offering coverage in a Health Insurance Marketplace and also include certain other mandatory services including EPSDT for those under 21, non-emergency medical transportation, family planning services and supplies and FQHC/RHC services.–
–
Most of the Medicaid expansion states reported that their ABP was fully aligned with their regular Medicaid benefit subject to certain exceptions. In some cases, states reported that benefits were added to the ABP that were not included in the regular Medicaid benefits plan including habilitative services in five states, substance abuse or mental health services in three states, chiropractic services in two states, and additional preventive services and hearing aids in one state. Conversely, a number of states identified services found in their standard benefit package that were not included in the ABP including eight states that excluded long term services and supports (LTSS), one state that excluded dental and vision services and one state that excluded certain behavioral health intervention services and inpatient substance abuse and mental health services. Also, both Iowa and Pennsylvania received waiver authority to not offer non-emergency transportation services during the first year only of their waivers.
–
Indiana has submitted a proposal to amend and renew its existing waiver to implement the Medicaid expansion in FY 2015 using the state’s Healthy Indiana Plan (HIP) as a basis. HIP 2.0, if approved, would offer expansion adults two ABPs: HIP Plus and HIP Basic. Expansion adults who make POWER account contributions (described further below under ACA Medicaid Expansion Premium and Cost Sharing Waivers), are eligible for HIP Plus which includes the Essential Health Benefits (EHBs) plus adult vision and dental. HIP Plus is indexed to a comprehensive commercial market benefit plan. New adults at or below 100 percent FPL who do not make POWER account contributions would be eligible for HIP Basic which includes EHBs (but not adult vision and dental) and would be indexed to the lowest actuarial value EHB option. The HIP 2.0 proposal also seeks to waive Non-Emergency Medical Transportation (NEMT) for both HIP Plus and HIP Basic and vision and dental benefits, which are part of EPSDT, would be waived for beneficiaries 19-20 in HIP Basic.2
|
TABLE 10: BENEFIT CHANGES IN THE 50 STATES AND DC, FY 2014 AND 2015 |
||||
| Benefit Changes | ||||
| STATES | FY 2014 | FY 2015 | ||
| Enhancements/ Additions | Restrictions/ Eliminations | Enhancements/ Additions | Restrictions/ Eliminations | |
| Alabama | ||||
| Alaska | ||||
| Arizona | X | X | ||
| Arkansas | ||||
| California | X | X | X | |
| Colorado | X | |||
| Connecticut | X | X | ||
| Delaware | X | X | ||
| DC | X | |||
| Florida | X | |||
| Georgia | X | |||
| Hawaii | X | |||
| Idaho | ||||
| Illinois | X | |||
| Indiana | ||||
| Iowa | ||||
| Kansas | ||||
| Kentucky | X | |||
| Louisiana | X | |||
| Maine | ||||
| Maryland | X | |||
| Massachusetts | X | X | ||
| Michigan | ||||
| Minnesota | X | X | ||
| Mississippi | X | |||
| Missouri | ||||
| Montana | ||||
| Nebraska | X | |||
| Nevada | X | X | ||
| New Hampshire | X | X | ||
| New Jersey | X | |||
| New Mexico | X | |||
| New York | X | X | X | X |
| North Carolina | ||||
| North Dakota | X | |||
| Ohio | ||||
| Oklahoma | ||||
| Oregon | ||||
| Pennsylvania | X | X | ||
| Rhode Island | ||||
| South Carolina | X | X | ||
| South Dakota | ||||
| Tennessee | ||||
| Texas | X | X | ||
| Utah | ||||
| Vermont | X | X | ||
| Virginia | X | X | X | |
| Washington | X | |||
| West Virginia | X | |||
| Wisconsin | X | |||
| Wyoming | ||||
| Totals | 21 | 4 | 22 | 2 |
| NOTES: States were asked to report benefit restrictions, eliminations, enhancements, and additions in FY 2014 and FY 2015. Excluded from these changes are the implementation of alternative benefit plans for the Medicaid expansion group. SOURCE: Kaiser Commission on Medicaid and the Uninsured Survey of Medicaid Officials in 50 states and DC conducted by Health Management Associates, October 2014. |
||||
Table 11: Benefit Actions Taken in the 50 States and the District of Columbia, FY 2014 and FY 20153 |
||
| State | Fiscal Year | Benefit Changes |
| Alabama | 2014 | |
| 2015 | ||
| Alaska | 2014 | |
| 2015 | ||
| Arizona | 2014 |
Adults (+) Restored coverage for well visits. (October 1, 2013)
Adults (+): Added coverage for HPV vaccine for adults ages 21-26. (October 1, 2013)
|
| 2015 | Adults (+): Eliminating 25-day inpatient hospital limit. (October 1, 2014) | |
| Arkansas | 2014 | |
| 2015 | ||
| California | 2014 |
Aged & Disabled (-): Reduced in-home supportive service hours by 8 percent. (July 1, 2013)
Adults (+): Restored adult dental coverage. (May 1, 2014)
All (+): Restored coverage for enteral nutrition. (May 1, 2014)
All (+): Expanded coverage of mental health services (such as individual, family and group therapy) and substance abuse disorder benefits to achieve parity with the selected EHB benchmark plan. All mental health benefits are subject to MHPAEA. (January 1, 2014)
|
| 2015 |
Aged & Disabled (+): Planning to partially restore FY 2014 in-home supportive services hour reduction (changing reduction to a 7% cut instead of an 8% cut).
Pregnant Women (+): Expansion to full-scope coverage to pregnant women 60-133% FPL.
|
|
| Colorado | 2014 |
Aged & Disabled (+): Added consumer-directed attendant support to Brain Injury Waiver.
Adults (+): Added adult dental coverage. (April 1, 2014)
Adults (+): Enhanced the substance abuse disorder benefit.
All (+): Added coverage for additional preventive services. (January 1, 2014)
|
| 2015 | ||
| Connecticut | 2014 | All (+): Added coverage for male and female condoms and spermicide. (July 1, 2013) |
| 2015 | Adults (+): Expanded coverage for licensed behavioral health clinician services provided by independent practitioners (licensed psychologists, licensed clinical social workers, licensed marital and family therapists, licensed alcohol and drug counselors, and licensed professional counselors). (July 1, 2014) | |
| Delaware | 2014 |
Aged & Disabled (+): Added supported employment for a small group under the Developmentally Disabled waiver. (October 1, 2013)
Aged & Disabled (+): Increased long-term care home maintenance.
|
| 2015 |
Aged & Disabled (+): Enhancing behavioral health and substance use disorder services through the PROMISE Program. (July 1, 2014)
Aged & Disabled (+): Added 1915(i) supported employment services for individuals with disabilities (Pathways Program). (July 1, 2014)
|
|
| District of Columbia | 2014 | |
| 2015 |
All (+): Expanding transplant services. (October 1, 2014)
Aged & Disabled (+): Adding coverage for adult day homes under 1915(i). (October 1, 2014)
|
|
| Florida | 2014 |
Pregnant Women (+): Added coverage for flu vaccine. (December 19, 2013)
Pregnant Women (nc): Added smoking cessation counseling (ACA requirement). (Jan 2014)
|
| 2015 | ||
| Georgia | 2014 | |
| 2015 | Adults (+): Adding coverage for medically necessary emergency transportation by rotary wing air ambulance. (Effective date TBD) | |
| Hawaii | 2014 |
All (+): Added substance abuse services that are furnished by certified substance abuse Counselors. (October 1, 2013)
Adults (+): Adding specialized behavioral health services including supported employment, supportive housing, peer specialist and representative payee as part of Section 1115 waiver renewal. (October 1, 2013)
All (+): Added cognitive rehabilitation services and habilitation services. (October 1, 2013) |
| 2015 | ||
| Idaho | 2014 | All (nc): Added coverage for aspirin and tobacco cessation services to the state’s Benchmark Plans to comply with the Essential Health Benefit requirement. |
| 2015 | ||
| Illinois | 2014 | |
| 2015 |
Adults (+): Restoring coverage for adult dental services. (July 1, 2014)
Adults (+): Restoring coverage for adult podiatry services. (October 1, 2014)
|
|
| Indiana | 2014 | Aged & Disabled (nc): Implemented care coordination services for those with serious mental disease under a 1915(i) Behavioral and Primary Healthcare Coordination Program. (June 2014) |
| 2015 | Aged & Disabled (nc): Implementing case management services under 1915(i) for persons with End Stage Renal Disease with incomes up to 300% FPL. (October 1, 2014)Adults (Proposed): The state has submitted a waiver proposal, HIP 2.0, which would use the state’s existing HIP program as a platform for an alternative Medicaid expansion. As part of the waiver proposal expansion adults would be offered two ABPs: HIP Plus and HIP Basic.
|
|
| Iowa | 2014 | |
| 2015 | ||
| Kansas | 2014 | |
| 2015 | ||
| Kentucky | 2014 | All (+): Expanded mental health, substance abuse, chiropractic and private duty nursing services and related networks. (January 1, 2014) |
| 2015 | Aged & Disabled (nc): Modifying and adding new HCBS waiver services to better align member needs with services available and to comply with new HCBS federal requirements. | |
| Louisiana | 2014 | Children (+): Added coverage for Applied Behavioral Analysis services. |
| 2015 | ||
| Maine | 2014 | Non-Pregnant Adults (nc): Restoring coverage of smoking cessation products and services as required by the ACA. (January 1, 2014) |
| 2015 | ||
| Maryland | 2014 | |
| 2015 | All (+): Expanding telemedicine services. (October 1, 2014) | |
| Massachusetts | 2014 |
Adults (+): Added hospice for MassHealth Basic and Essential members. (July 2013)
Adults (+): Restored coverage of fillings for back teeth. (March 1, 2014)
Aged & Disabled (+): Added managed behavioral health to individuals in both MFP 1915(c) waivers. (July 1, 2013)
Aged & Disabled (+): Added Alzheimer’s and dementia coaching, medication dispensing system, home delivery of medications, occupational therapy in Frail Elder 1915(c) waiver.
|
| 2015 |
Adults (+): Adding coverage for treatment of gender dysphoria.
Adults (+): Plan to restore coverage for dentures. (May 15, 2015)
Aged & Disabled (+): Planning to add a shared living benefit to the TBI 1915(c) waiver. |
|
| Michigan | 2014 | |
| 2015 | ||
| Minnesota | 2014 |
Adults (+): Expanded adult dental services by adding house calls, oral/IV sedation, and behavior management. Also allowed additional prophylaxis. (July 1, 2013)
Children (+): Added coverage of therapeutic foster care and psycho-education. (July 2013)
|
| 2015 | All (+): Adding coverage for services provided by certified doulas. (July 1, 2014) | |
| Mississippi | 2014 | |
| 2015 | Aged & Disabled Children (+): Adding coverage for Prescribed Pediatric Extended Care Centers (a new provider type). (July 1, 2014) | |
| Missouri | 2014 | |
| 2015 | ||
| Montana | 2014 | |
| 2015 | ||
| Nebraska | 2014 | All (+): Added coverage for all tobacco cessation products. (January 1, 2014). |
| 2015 | ||
| Nevada | 2014 | Adult Non-Citizens (+): Added coverage for emergency ESRD services. (August 1, 2013) |
| 2015 | Aged & Disabled (+): Adding skilled nursing services in the 1915(c) waiver for individuals with intellectual disabilities. | |
| New Hampshire | 2014 | All (+): Eliminated 4 visit limit per state fiscal year on emergency room services. (Aug 2013) |
| 2015 | All (+): Removing service limits on psychotherapy, X-ray and outpatient hospital (to harmonize with Alternative Benefit Plan for the expansion population). | |
| New Jersey | 2014 | |
| 2015 | Aged & Disabled (+): Implementing managed long term services and supports and consolidating 1915(c) waivers into state’s Section 1115 which will provide LTSS beneficiaries with a greater array of LTSS services. (July 1, 2014) | |
| New Mexico | 2014 | All (+): Expanded behavioral health services. (January 1, 2014) |
| 2015 | ||
| New York | 2014 |
Pregnant women (+): Added lactation counseling coverage for those eligible. (April 2013)
All (+): Expanded coverage for hospital observation services. (April 1, 2013)
All (+): Expanded frequency of smoking cessation counseling coverage. (January 1, 2014
All (-): Limited coverage for percutaneous coronary intervention. (July 1, 2013)
All (-): Discontinued coverage for Functional Electrical Stimulators (FES) for Spinal Cord and Head Injury, Cerebral Palsy, and Upper Motor Neuron Disease. (November 1, 2013)
All (-): Discontinued coverage of lumbar discography for chronic low back pain. (November 1, 2013)
All (-): Limited coverage of Transcutaneous Electrical Nerve Stimulation for pain associated with knee osteoarthritis. (November 1, 2013)
All (-): Discontinued coverage of implantable Opioid infusion pumps, except in cases of intractable cancer pain. (November 1, 2013)
|
| 2015 |
All (-): Discontinued coverage for viscosupplementation of the knee for an enrollee with a diagnosis of osteoarthritis of the knee. (April 1, 2014)
All (+): Expanded smoking cessation counseling providers to include dental practitioners. (April 1, 2014 for FFS and July 1, 2014 for managed care)
|
|
| North Carolina | 2014 | |
| 2015 | ||
| North Dakota | 2014 | |
| 2015 | Aged & Disabled (+): Adding personal care with supervision to the Home and Community Based waiver to allow individuals with a primary diagnosis of dementia or traumatic brain injury to receive 24 hour supervision with a daily rate. (October 2014) | |
| Ohio | 2014 | Expansion Adults (nc): Removed hard limits on mental health services for ACA expansion group to comply with Mental Health Parity Act. (January 1, 2014) |
| 2015 | ||
| Oklahoma | 2014 | |
| 2015 | ||
| Oregon | 2014 | |
| 2015 | ||
| Pennsylvania | 2014 | |
| 2015 |
The following benefit changes were originally part of the state’s Healthy PA plan; after reaching a “conceptual agreement” with CMS that will be pursued through SPA:5
Adults (+): Add 1 more inpatient rehab hospital admission a year for high-risk MA group.
Adults (+): Increase limit on inpatient psychiatric hospital days for high-risk MA group.
Adults (-): Eliminate coverage of optometrist, podiatrist, and chiropractor services.
Adults (-): Reduce the number of total combined visits from 18 to 12 per year for those in the low-risk MA plan across the following types: routine adult visits, specialists visits, certified RN practitioner, FQHC/RHCs, clinics and hearing screenings.
Adults (-): Add limits to radiology and laboratory services.
Adults (-): Implement limits on outpatient surgery (SPU/ASC.)
Adults (-): Limit non-emergency inpatient hospital admissions and inpatient drug and alcohol admissions.
Adults (-): Increase visit limit for some outpatient mental health, substance abuse services.
Adults (-): Eliminate behavioral health targeted case management for low-risk MA group.
Adults (-): Limit some long-term care related services (e.g. skilled nursing facility, home health care visits and eliminate ICF/ID and ICF/ORC coverage) for low-risk MA group.
Adults (-): Limit medical supplies ($1000/year for low-risk and $2500/year for high-risk.) |
|
| Rhode Island | 2014 | |
| 2015 | ||
| South Carolina | 2014 | Adults (+): Reinstated the Adult Emergency Dental benefit (April 1, 2014) |
| 2015 |
Family Planning Adults (+): Adding coverage for additional preventive services including diabetes screening, health and behavioral assessments, cholesterol abnormalities screening, and HIV screening. (September 1, 2014)
Adults (+): Adding a preventative dental benefit with a maximum benefit of $750 per beneficiary per state fiscal year. (July 1, 2014)
|
|
| South Dakota | 2014 | |
| 2015 | ||
| Tennessee | 2014 | |
| 2015 | ||
| Texas | 2014 | MLTSS Adults (+): Added coverage of cognitive rehabilitation therapy services to the STAR+PLUS Program. (March 1, 2014) |
| 2015 |
MLTSS Adults (+): Adding supported employment and employment assistance to the HCBS waiver service array in the STAR+PLUS program. (September 1, 2014)
Aged & Disabled (nc): Will allow providers other than Local Mental Health Authorities (LMHAs) to provide Mental Health Targeted Case Management and Mental Health Rehabilitative services already available through STAR Health. (September 1, 2014)
|
|
| Utah | 2014 | |
| 2015 | ||
| Vermont | 2014 |
Non-Pregnant Adults (+): Increased dental cap from $495 to $510. (January 1, 2014)
All (+): Added coverage for face to face tobacco cessation counseling services to all eligible non-pregnant Medicaid beneficiaries. (January 1, 2014)
|
| 2015 |
All (+): Adding a tele-monitoring benefit. (August 1, 2014)
Disabled Children (+): Adding coverage for applied behavioral analysis. (Effective date TBD)
|
|
| Virginia | 2014 |
LTC Adults (-): Limited dental utilization in LTC settings by modifying allowable deductions for dental expenses. (July 1, 2013)
Aged & Disabled (+): Added nutrition counseling and inpatient substance abuse services for Medicaid Works (working disabled eligibility group). (January 1, 2014)
|
| 2015 | Pregnant Women (+): Plan to expand comprehensive dental benefits. | |
| Washington | 2014 |
Adults (+): Restored adult dental coverage. (January 1, 2014)
All (+): Eliminated limits on mental health services and added screening, brief intervention and referral treatment (SBIRT) benefit. (January 1, 2014)
Adults (+): Expanded list of qualified mental health providers (already in place for children). (January 1, 2014)
Adults age 60+ (+): Added coverage for shingles vaccination. (January 1, 2014)
All (+): Added coverage of services provided by naturopath providers. (January 1, 2014)
Pregnant Women (nc): Expanded coverage for smoking cessation services (ACA required for pregnant women). (July 1, 2013)
Expansion Adults (nc): Habilitation added for expansion group only. (January 1, 2014)
|
| 2015 | ||
| West Virginia | 2014 | Children and AFDC-related Adults (-): Eliminated the Mountain Health Choices Basic and Enhanced benchmark benefit plans resulting in the elimination of coverage for weight management services. (December 31, 2013) |
| 2015 | ||
| Wisconsin | 2014 | |
| 2015 | Aged & Disabled (+): Adding the following HCBS waiver services for persons meeting nursing facility level of care: Peer Recovery Support Services, Consultative Clinical and Therapeutic Services for Caregivers, and Training Services for Unpaid Caregivers. (January 1, 2015) | |
| Wyoming | 2014 | |
| 2015 | ||
Premiums and Cost-sharing
Medicaid beneficiaries tend to be poorer and sicker than those enrolled in private insurance. Given these characteristics, federal law limits the extent to which states can charge premiums and cost-sharing, particularly for pregnant women, children and adults with disabilities but allows flexibility for individuals with higher incomes. Over the years, Medicaid premiums and cost-sharing have been used to limit state program costs, to encourage more personal responsibility over health care choices, and to better align public coverage with private coverage where states have expanded coverage. The use of premiums has been targeted to certain populations while copayments have been used more broadly across states. In July 2013, CMS released final rules that streamlined and simplified existing regulations around premiums and cost-sharing while also making some changes to regulations for cost-sharing. The table below summarizes cost-sharing limits for 2014.
| Federal Maximum Allowable Cost-Sharing for 2014 | |||||
| Notable Cost-Sharing Changes | Individuals with family income: | ||||
| < 100% FPL | 101 – 150% FPL | > 150% FPL | |||
|
Outpatient Services (physician visit, physical therapy, etc.)
–
Inpatient Stay
|
$4
(CPI-U Annual Update) –
$75
(CPI-U Annual Update) |
10% of cost for entire stay | 20% of cost for entire stay | ||
| Preferred Drugs | $4 | $4 | $4 | ||
| Non-Preferred Drugs | $8 | $8 | 20% of cost | ||
| Non-emergency Use of the ER | $8 | $8 | No Limit | ||
| 78 Fed. Reg. 42307-42310. (July 15, 2013). | |||||
Total Medicaid premiums and cost-sharing incurred by all individuals in a Medicaid household may not exceed an aggregate limit of 5 percent of the family’s income applied on either a quarterly or monthly basis. States are further required to have an effective process for tracking the 5 percent cap that does not rely on beneficiary documentation. In this year’s survey, some states commented on the difficulty of implementing a tracking process that would assure compliance with this requirement and the various applicable exemptions.
Premiums
While states are generally limited to charging premiums to Medicaid beneficiaries with incomes over 150 percent FPL, there are certain other populations for which premiums may be charged (sometimes labeled as “buy-in” programs) including: working people with disabilities eligible under the Ticket to Work and Work Incentives Improvement Act (TWWIIA) and children with disabilities eligible under the Family Opportunity Act (FOA). States are also allowed under certain circumstances to impose premiums on parents with increased income receiving Transitional Medical Assistance (TMA.) Prior to the ACA, a number of states also received Section 1115 waiver authority to expand coverage to higher income groups with premium requirements.
In this year’s survey, many of the premium-related policy actions reported were related to ACA coverage expansions including the elimination of waiver programs that included premium requirements and the imposition of new premium requirements on expansion adults. Of the four states reporting new or increased premium requirements (one in 2014, three in FY 2015), two were new premium requirements on ACA Medicaid expansion adults in FY 2015 (in Iowa and Michigan.) Wisconsin implemented a new premium for parents and caretakers in the TMA program in April 2014; these parents and caretakers will not pay for the first six months. Georgia reported premiums in the buy-in program will increase in FY 2015. In addition, Arizona reported plans to implement a mandatory premium for ACA Medicaid expansion adults in FY 2015 that still required waiver approval at the time of this survey.
Of the seven states reporting premium decreases or eliminations in FY 2014, three (Arkansas, Rhode Island and Wisconsin) eliminated coverage programs with premium requirements (due to the availability of subsidized coverage in Health Insurance Marketplaces), one state (Minnesota) decreased MinnesotaCare premium levels and changed them to a fixed monthly amount per person to align with the Basic Health Plan (BHP) requirements (in advance of the conversion of MinnesotaCare enrollees to BHP coverage in 2015) and one state (Utah) eliminated a $50 enrollment fee as a condition of renewal of its Section 1115 Primary Care Network (PCN) waiver. In addition, Vermont reported eliminating premiums for pregnant women; pregnant women with incomes over 185 percent FPL had previously been subject to a premium requirement under the state’s Dr. Dynasaur program. Washington eliminated TMA premiums for adults for the second 6 months.
Copayment Requirements
Most state Medicaid programs impose copayment requirements, but to varying degrees. This year’s survey saw a modest increase in the number of states reporting actual or planned cost-sharing increases in FY 2014 and FY 2014 (8 states each year) compared to FY 2013 (4 states) and FY 2012 (6 states).1 The new requirements and increases are highlighted below.
ACA Expansion-related Increases. Three states in FY 2014 (Arkansas, Michigan, and West Virginia) and one state in FY 2015 (Arizona) adopted broader copayment policies (in terms of the dollar amount or the number of services subjected to copayment requirements) for their expansion populations compared to the copayment policies applicable to previously eligible, lower income groups.
Increases to Federal Maximum Amounts. Four states in FY 2015 (Arizona, Illinois, North Carolina and Tennessee) reported plans to increase copayment amounts to the maximum federal level. Oklahoma and Wyoming reported plans to increase most copays from $3 to $4 in FY 2015.
Emergency Room. Three states in FY 2014 (Kentucky, New Mexico and West Virginia) and one state in FY 2015 (Iowa) reported plans to implement or increase copayments for non-emergency use of the emergency room. Two additional states (Arizona and California) reported plans to implement copayments for non-emergency use of the emergency room above amounts allowable under current law, which would require waiver approval from CMS.
Pharmacy. Several states reported new or increased pharmacy copayments including five states in FY 2014 (Kentucky, New Mexico, Oklahoma, Tennessee and West Virginia) and one state in FY 2015 (New Hampshire).
Nine states in FY 2014 and three states in FY 2015 reported plans to decrease or eliminate a copayment requirement. Of the nine states in FY 2014, the changes in five were related in some way to the ACA coverage expansions and waiver renewals, such as states transitioning waiver coverage to the ACA Medicaid expansion (Arizona and Maryland), states preparing to implement the Basic Health Plan (Minnesota) or changes made as part of waiver renewals (Utah and Wisconsin.) A few other states reported cost sharing reductions or eliminations for select services such as preventive services (Colorado and Wisconsin.)
Additional information on FY 2014 or FY 2015 changes to premiums and copayments is reported in Table 11.
| ACA Medicaid Expansion Premium and Cost Sharing Waivers |
|
Three states (Arizona, Iowa and Michigan), used or plan to use Section 1115 demonstration waiver authority to implement premium and/or cost sharing requirements for their expansion populations beginning in FY 2014 or FY 2015.
–
Under Iowa’s Health and Wellness Plan, Medicaid expansion enrollees receive coverage through existing Medicaid delivery systems (for those with incomes up to 100 percent FPL) and through purchasing coverage through QHPs in the state’s Health Insurance Marketplace (for those with incomes over 100 percent FPL). In both cases, there are no copayment requirements except for non-emergency use of the emergency department, which is waived during the first year of enrollment. Iowa’s demonstration includes monthly premiums for enrollees with incomes over 50 percent FPL, beginning in the second year of coverage, which could be waived if the member completes specified wellness activities. However, premiums are not a condition of eligibility for beneficiaries with incomes from 50 to 100 percent FPL, and this group cannot lose Medicaid coverage for non-payment. Premium amounts are indexed to be approximately three percent of income for a two-person household where both participants are enrolled in the Iowa Health and Wellness Plan.
–
The Healthy Michigan Plan requires contributions equal to two percent of annual income for persons between 100 and 138 percent of the FPL after they have been in the health plan for six months. Total cost-sharing, including copayments, cannot exceed five percent of annual household income and is paid through the use of a dedicated health account called the “Michigan Health Account.” Enrollees can reduce their annual cost sharing by participating in healthy behavior activities which include completing an annual health risk assessment and changing unhealthy activities.
–
Arizona is seeking waiver authority to impose a $200 copayment for non-emergency use of the emergency room for the expansion population; the states also reported plans to implement additional copays for this population up to the federal maximum allowable amounts.
–
Pennsylvania’s Healthy PA waiver applies existing cost-sharing amounts included in the state plan to new enrollees under the Healthy PA waiver (which begins coverage in January 2015.) Premiums (not to exceed two percent of income) will also apply to individuals with incomes above 100 percent FPL starting the second year of coverage (January 1, 2016); beneficiaries can reduce premium and cost-sharing amounts by engaging in healthy behaviors (which for the first year is the completion of an annual wellness exam. 2)
–
Indiana has submitted a proposal to amend and renew its existing waiver to implement the Medicaid expansion using the state’s Healthy Indiana Plan (HIP) as a base. HIP 2.0, if approved, would require most non-disabled adults (including those previously eligible) with incomes up to 138 percent FPL to contribute to a Personal Wellness and Responsibility (POWER) Account, which is modeled after a Health Savings Account (HSA.) Required POWER account contributions range from $3 per month for individuals with incomes up to 22 percent FPL to $25 per month for individuals with incomes between 100 and 138 percent FPL. (For current HIP enrollees, contribution amounts would decrease.)
–
Individuals who make these contributions will be eligible for the HIP Plus Plan that includes no cost-sharing (except for non-emergency use of the hospital emergency department) and expanded benefits. Coverage in HIP Plus would begin the first of the month after a beneficiary’s first contribution. (The state is seeking a waiver of retroactive eligibility). Individuals who fail to make contributions with incomes between 100-138 percent FPL will be dis-enrolled from coverage and barred from re-enrolling for six months. Individuals with incomes at or below 100 percent FPL who fail to make POWER account contributions will be moved to the HIP Basic Plan that has fewer benefits and requires cost-sharing for most health care services including $4 for outpatient services and preferred drugs, $8 for non-preferred drugs, $25 for non-emergency ED visits and $75 for inpatient services.3 Total cost-sharing requirements for both copayments and POWER account contributions would be limited to five percent of family income.
|
Table 12: Premium and Copayment Actions Taken in the 50 States and the District of Columbia, FY 2014 and FY 20154 |
||
| State | Fiscal Year | Premium and Copayment Changes |
| Alabama | 2014 | |
| 2015 | ||
| Alaska | 2014 | |
| 2015 | ||
| Arizona | 2014 | Copayments (Eliminated): Copays for waiver expansion group eliminated due to expiration of waiver. (Jan 2014) |
| 2015 |
Premiums (Proposed): Will impose a mandatory premium of not more than 2% of household income on ACA expansion adults. (Upon CMS approval)
Copayments (New): Plan to implement mandatory copays to the maximum extent allowed under federal law for ACA expansion adults.
Copayments (Proposed): Plan to pursue a waiver to impose a $200 copay for non-emergent use of the ER on ACA expansion adults. (Upon CMS approval)
|
|
| Arkansas | 2014 |
Premiums (Eliminated): Coverage through the ARHealthNet premium program ended December 31, 2013.
Copayments (New): Higher cost-sharing levels imposed for the ACA “Private option” expansion population and enforceable for expansion adults above 100% FPL. (Jan 2014)
|
| 2015 | ||
| California | 2014 | |
| 2015 | Copayments (Proposed): Plan to pursue a waiver to implement a $15 copayment on non-emergent use of the emergency room for adults at or above 100% FPL and enrolled in managed care. (Upon CMS approval) | |
| Colorado | 2014 | Copayments (Eliminated): Eliminated copays for preventive services. (Jan 2014) |
| 2015 | ||
| Connecticut | 2014 | |
| 2015 | ||
| Delaware | 2014 | |
| 2015 | ||
| District of Columbia | 2014 | |
| 2015 | ||
| Florida | 2014 | |
| 2015 | ||
| Georgia | 2014 | |
| 2015 | Premium (Increase): Plan to increase the Medicaid Buy-in premium for dual eligible beneficiaries. | |
| Hawaii | 2014 | |
| 2015 | ||
| Idaho | 2014 | |
| 2015 | ||
| Illinois | 2014 | Copayments (New): Imposed a new copayment on behavioral health services for all copay eligible populations. (Feb 2014) |
| 2015 | Copayments (Increased): Planning an across-the-board increase to all nominal copayment levels (with limited exceptions). | |
| Indiana | 2014 | |
| 2015 |
Premiums (Proposed): Under proposed HIP 2.0 waiver (pending CMS approval), most non-disabled adults with incomes up to 138 percent FPL required to contribute to an HSA-like Personal Wellness and Responsibility (POWER) Account. Required POWER account contributions range from $3 per month for individuals with incomes up to 22% FPL to $25 per month for individuals with incomes between 100% and 138% FPL. For current HIP enrollees, contribution amounts would decrease.
Copayments (Proposed): Individuals with incomes at or below 100% FPL who fail to make required POWER account contributions subject to new copayments on most outpatient services ($4) and inpatient hospital services ($75) and increased copayments on preferred drugs ($4) and non-preferred drugs ($8) and non-emergency ED visits (up to $25).
|
|
| Iowa | 2014 | |
| 2015 |
Premiums (New): Under the Iowa Health and Wellness Plan (IHWP), enrollees with incomes over 50 percent FPL are required to make a monthly premium contribution, beginning in the second year of coverage, which could be waived if they complete specified wellness activities. Premium amounts would be about 3 percent of income for a two-person household where both participants are enrolled in IHWP. (Jan 2015)
Copayments (New): All IHWP enrollees will be subject to $8 copay for non-emergent use of the ED. Cost-sharing will be waived during the first year of enrollment. (Jan 2015)
|
|
| Kansas | 2014 | |
| 2015 | ||
| Kentucky | 2014 | Copayments (Increased): Increased copay amounts for pharmacy, physician office visits and non-emergent use of the ER. (Jan 2014) |
| 2015 | ||
| Louisiana | 2014 | |
| 2015 | ||
| Maine | 2014 | |
| 2015 | ||
| Maryland | 2014 | Copayments (Decrease): Copayment enforceability ended for waiver expansion population that transitioned to ACA Medicaid expansion in 2014. Also, generic drug copayments for this population are lower following the transition. (Jan 2014). |
| 2015 | ||
| Massachusetts | 2014 | |
| 2015 | ||
| Michigan | 2014 |
Copayments (New): Healthy Michigan Plan copayments required for physician visits, outpatient hospital clinic visits, non-emergent use of the ER, inpatient hospital stays, pharmacy, hearing aids, chiropractic, dental, podiatry and vision visits.
Total cost sharing, including copays, cannot exceed 5% of annual household income and will be paid through a dedicated health account (MI Health Account.) Enrollees can reduce their annual cost-sharing by participating in healthy behavior activities, which include completing an annual health risk assessment and changing unhealthy activities.
Copayments (Decrease): Applied co-payment exemptions for drugs used to treat State defined chronic conditions.
|
| 2015 | Premiums (New): Healthy Michigan Plan requires contributions equal to 2% of annual income for persons between 100% and 133% FPL after they have been in the health plan for 6 months. (MI Health Account also applies to premiums/monthly contributions.) | |
| Minnesota | 2014 |
Premiums (Decreased): Decreased premium levels and changed to a fixed monthly amount/person based on income for MinnesotaCare adults to align with Basic Health Plan.
Copayments (Eliminated): Eliminated inpatient hospital coinsurance requirement and cap for MinnesotaCare childless adults to align with BHP requirements. (Jan 2014)
|
| 2015 | ||
| Mississippi | 2014 | |
| 2015 | ||
| Missouri | 2014 | |
| 2015 | ||
| Montana | 2014 | |
| 2015 | ||
| Nebraska | 2014 | |
| 2015 | ||
| Nevada | 2014 | |
| 2015 | ||
| New Hampshire | 2014 | |
| 2015 | Copayments (Eliminated): Eliminating pharmacy copays ($1-$2) for adults under poverty.Copayments (New): Imposing $1& $4 pharmacy copays on adults at or above 100% FPL (ACA expansion population). | |
| New Jersey | 2014 | |
| 2015 | ||
| New Mexico | 2014 | Copayments (New): For newly eligible adults, copays added for non-emergent use of the ED and for brand-name prescriptions when there is a less expensive generic equivalent medicine available. (Jan 2014) |
| 2015 | Copayments (Decreased): Pharmacy copayment decreased from $5.00 to $4.00 for Working disabled Individuals. (Effective date TBD) | |
| New York | 2014 | |
| 2015 | ||
| North Carolina | 2014 | |
| 2015 | Copayments (Increased): Increasing copay amounts up to the federal maximum for all non-exempt enrollees. (Nov 2014) | |
| North Dakota | 2014 | |
| 2015 | ||
| Ohio | 2014 | |
| 2015 | ||
| Oklahoma | 2014 | Copayments (Increased): Copays for prescriptions, physician, and outpatient visits increased for Insure Oklahoma waiver adults. (Jan 2014) |
| 2015 | Copayments (Increased): Most SoonerCare copayments will increase ($3 to $4.) (July 2014) | |
| Oregon | 2014 | |
| 2015 | ||
| Pennsylvania | 2014 | |
| 2015 | Copayments (New): New enrollees under the state’s Healthy PA waiver will be subject to cost-sharing under state plan. (Jan 2015) | |
| Rhode Island | 2014 | Premiums (Eliminated): Premiums eliminated for Medicaid and CHIP eligible children and families over 150% FPL participating in RIte Care. (Jan 2014) |
| 2015 | ||
| South Carolina | 2014 | |
| 2015 | Copayments (Eliminated): Exempting certain high value drugs (including maintenance and certain psychiatric drugs) from copay requirements. (Oct 2014) | |
| South Dakota | 2014 | Copayments (Eliminated): Eliminated cost-share in Breast & Cervical Cancer Program. (Jan 2014) |
| 2015 | ||
| Tennessee | 2014 | Copayments (New): Instituted a new copayment for generic drugs for adults not receiving LTC and Standard Kids. (July 2013) |
| 2015 | Copayments (Increased): Raising all copay to maximum allowable amount. (July 2014) | |
| Texas | 2014 | |
| 2015 | ||
| Utah | 2014 |
Premiums (Eliminated): $50 enrollment fee eliminated on PCN Waiver adults. (Jan 2014)
Copayments (Decreased): As a condition of PCN Waiver renewal, copayments reduced for PCN TANF-related waiver participants (1925 & 1931 adults). (January 1, 2014)
|
| 2015 | ||
| Vermont | 2014 |
Premiums (Eliminated): Premiums for pregnant women eliminated. (Jan 2014)
Copayments (Eliminated): Eliminated copayment requirements for DME. (July 2013)
|
| 2015 | ||
| Virginia | 2014 | |
| 2015 | ||
| Washington | 2014 | Premiums (Eliminated): Eliminated TMA second 6 month premium for adults. (Oct 2013) |
| 2015 | ||
| West Virginia | 2014 |
Copayments (New): Imposed new copayment requirements, tiered by income, on all non-exempt MAGI based eligibility groups (Jan 2014) including:
0-50%FPL: $0.50 – $3 for prescription drugs (tiered by drug price); and $8 for non-emergency use of the ER
50-100% FPL: $0.50 – $3 for prescription drugs (tiered by drug price); $8 for non-emergency use of the ER, $2 on outpatient services and $35 for inpatient hospital
Over 100% FPL: $0.50 – $3 for prescription drugs (tiered by drug price); $8 for non-emergency use of the ER, $4 on outpatient services and $75 for inpatient hospital
|
| 2015 | ||
| Wisconsin | 2014 |
Premiums (Eliminated): Premium-based coverage for infants in families with incomes above 200% FPL ended February 1, 2014.
Premiums (New): Premiums imposed on parents/caretakers on Transitional Medical Assistance with incomes between 100% and 133% FPL after first 6 months of coverage. (April 2014)
Copayments (Eliminated): Eliminated copayments on preventive services for enrollees in the BadgerCare Plus Standard Plan. (Jan 2014)
Copayments (Decreased): Copayments for services under the state’s benchmark plan were reduced to the amounts under the standard Medicaid benefit plan when the benchmark plan was ended March 31, 2014.
|
| 2015 | ||
| Wyoming | 2014 | |
| 2015 | Copayments (Increased): Increasing copays amounts from $3 to $4. (Effective date TBD) | |
Prescription Drug Utilization and Cost Control Initiatives
Almost all state Medicaid programs employ a sophisticated array of pharmacy management tools including preferred drug lists (PDLs), supplemental rebate programs, prior authorization programs, state maximum allowable cost (“state MAC”) programs, generic incentives and other utilization management controls. This year’s survey finds that a little over half of the states continue to take steps to refine their pharmacy programs, but that almost all states are concerned about the potential future fiscal impact of new and emerging specialty drug therapies.
Pharmacy Management Policies in Place
In FY 2014, a total of 46 states indicated that they had adopted a Preferred Drug List (PDL) and 45 were obtaining supplemental rebates. Of the remaining five states that have not adopted a PDL or implemented a supplemental rebate program, three (Arizona, Hawaii, and New Jersey) have less of an incentive to do so because they rely heavily or completely on capitated managed care organizations (MCOs) to administer the Medicaid pharmacy benefit. The number of states with limits on the number of prescriptions that Medicaid will pay for each month decreased slightly to 16 states in FY 2014 from 18 in FY 2013.
Summary of FY 2014 and FY 2015 Pharmacy Policy Changes and Cost Containment Efforts
Twenty-eight states in FY 2014 and 20 states in FY 2015 implemented cost-containment initiatives in the area of prescription drugs, comparable to the number of states taking action in FY 2013 (24) but fewer than the number of states taking such actions in FY 2012 (33), FY 2011 (31 states) or FY 2010 (38 states). As PDL and related supplemental rebate programs have matured in most states and as more states have carved the pharmacy benefit into capitated managed care arrangements, the number of states reporting PDL or supplemental rebate changes (e.g., adding new PDL drug classes or joining a multi-state rebate pool) has dropped significantly to (3 to 5 states) compared to 24 to 28 states in FY 2009. A small number of states reported reductions in ingredient cost reimbursement (3 states in FY 2014 and 5 states in FY 2014), often associated with the adoption of an actual acquisition cost methodology (discussed further below), and an even smaller number reported dispensing reductions (1 state in FY 2014 and 1 state in FY 2015) or imposing new limits on the number of monthly prescriptions (1 state in FY 2014 and no states in FY 2015). The most significant type of reduction reported (included under “Other Pharmacy Changes”) related to the application of clinical management protocols for Sovaldi, a recently approved specialty drug for the treatment of hepatitis C.
| NADAC Ingredient Cost Pricing |
| State Medicaid programs reimburse pharmacies for the “ingredient cost” of each prescription, plus a dispensing fee.1 Responding to the urging of a number of states2, in June 2012 CMS launched its outpatient drug acquisition cost survey of retail community pharmacies3 for the purpose of developing a database of National Average Drug Acquisition Costs (NADACs) that states could then use for Medicaid pharmacy pricing. Effective November 27, 2013, CMS began posting final NADAC files for state use. In this year’s survey, one state in FY 2014 (Delaware) and four states in FY 2015 (Alaska, Mississippi, Nevada and Wyoming) reported adopting, or plans to adopt, a NADAC ingredient cost methodology.4 |
Sovaldi and Other High-Cost Specialty Drugs
While specialty drugs accounted for less than one percent of all U.S. prescriptions in 2013, they comprised more than a quarter (27.7%) of the country’s total pharmacy expenditures for the first time.5 U.S. spending on specialty medications increased by 14.1 percent in 2013; however, the forecasts call for more dramatic increases between 2014 and 2016 driven in large part by a new specialty medication to treat hepatitis C costing more than $80,000 for a 12-week course of treatment (Sovaldi). In its 2013 Drug Trend Report, pharmacy benefit manager Express Scripts forecasted that U.S. spending on hepatitis C medications would increase 1,800 percent between 2014 and 2016 stating: “[n]o major therapy class has experienced this high of a rate increase in the 21 years Express Scripts has recorded drug trend data.6” While all payers are expected to be affected, public payers such as Medicaid (and Medicare) are expected to be disproportionately affected as many of the estimated 3.2 million Americans infected with hepatitis C are elderly, poor or imprisoned.7
In this year’s survey, virtually every state indicated concern regarding recently approved high-cost specialty drugs, especially Sovaldi. States were asked to comment on the whether their state had adopted or planned to adopt new coverage and reimbursement policies to address Sovaldi in FY 2014 or FY 2015. Twenty-two states commented that new clinical prior authorization criteria were already in place or under development. One state (New Jersey) noted that it was exploring clinical protocols to restrict Sovaldi utilization – an unusual step for a state with no Medicaid PDL and only minimal pharmacy prior authorization requirements. Seven states indicated that they were standardizing the clinical criteria across both fee-for-service and managed care and seven states reported plans to carve-out Sovaldi and/or related drugs or partially supplement and/or provide pass-through payments to managed care plans for some of the costs of Solvadi, some on a temporary basis. Vermont also expressed the concern that the coverage of high cost drugs like Sovaldi could put its Global Commitment waiver budget neutrality ceiling at risk.
Other Pharmacy Policy Changes
Other pharmacy actions counted as cost containment measures for FY 2014 and FY 2015 included: implementing or expanding a 340B initiative (Minnesota, Oklahoma, Texas, Utah); expanded step therapy or prior authorization programs (Connecticut, New York and Washington); changes to pricing or rebate collection policies for physician administered drugs (District of Columbia, Rhode Island); imposing a mandatory 3 month supply requirement for maintenance drugs (Alabama); application of a 10 percent payment reduction to pharmacy claim reimbursement for select prescription drug claims in FY 2014 (California); implementation of new specialty drug adherence monitoring measures (Massachusetts); initiatives to control behavioral health drug utilization (Maryland); new strategies to address opioid overuse (South Carolina); implementation of a closed pharmacy network and added application limits on ADHD drugs for children (Washington), and revised reimbursement policies for blood clotting factor (Wisconsin).
In addition, several states reported other pharmacy-related actions that were not included in the count of cost containment actions. Delaware reported plans to transition the pharmacy benefit to MCOs, Indiana reported implementing e-prescribing technology and a new pharmacy benefit manager contract; Kansas reported moving the diabetic testing supplies benefit to its pharmacy program; Mississippi reported plans to move to a uniform PDL for MCOs in October 2014 and Washington reported requiring MCOs to use a uniform PDL for antipsychotics effective January 1, 2014; and Montana reported new administrative rules regarding prescription drug fraud and abuse and plans to allow pharmacies to bill for vaccine administration.
Finally, a few states reported pharmacy-related expansions or reversals of previous pharmacy cost containment actions. Six states increased dispensing fees in FY 2014 (Alaska, Delaware, Iowa, Indiana, Montana and Utah) and four states planned to increase dispensing fees in FY 2015 (Mississippi, Montana, Nevada and Wyoming). In four of these states (Delaware, Mississippi, Nevada and Wyoming), dispensing fee increases were expected to partially offset reimbursement decreases resulting from the adoption of the NADAC ingredient cost reimbursement methodology. South Carolina reported exempting some chronic medications from its monthly prescription cap in FY 2014 but expects this change to generate medical savings that will offset increased pharmacy costs. West Virginia reported that the elimination of the Mountain Health Choices benchmark plan in January 2014 resulted in the elimination of the related monthly prescription cap.
See Tables 13 and 14 for more detail on pharmacy cost containment actions.
TABLE 13: PHARMACY COST CONTAINMENT POLICIES IN PLACE IN THE 50 STATES AND DC AT THE START OF FY 2014 |
|||
| States | Preferred Drug List | Supplemental Rebates | Script Limits |
| Alabama | X | X | X |
| Alaska | X | X | |
| Arizona | |||
| Arkansas | X | X | X |
| California | X | X | X |
| Colorado | X | X | |
| Connecticut | X | X | |
| Delaware | X | X | |
| DC | X | X | |
| Florida | X | X | |
| Georgia | X | X | |
| Hawaii | |||
| Idaho | X | X | |
| Illinois | X | X | X |
| Indiana | X | X | |
| Iowa | X | X | |
| Kansas | X | X | X |
| Kentucky | X | X | X |
| Louisiana | X | X | X |
| Maine | X | X | X |
| Maryland | X | X | |
| Massachusetts | X | ||
| Michigan | X | X | |
| Minnesota | X | X | |
| Mississippi | X | X | X |
| Missouri | X | X | |
| Montana | X | X | |
| Nebraska | X | X | |
| Nevada | X | X | |
| New Hampshire | X | X | |
| New Jersey | |||
| New Mexico | X | X | |
| New York | X | X | |
| North Carolina | X | X | |
| North Dakota | |||
| Ohio | X | X | |
| Oklahoma | X | X | X |
| Oregon | X | X | |
| Pennsylvania | X | X | X |
| Rhode Island | X | X | |
| South Carolina | X | X | X |
| South Dakota | |||
| Tennessee | X | X | X |
| Texas | X | X | X |
| Utah | X | X | X |
| Vermont | X | X | |
| Virginia | X | X | |
| Washington | X | X | |
| West Virginia | X | X | X |
| Wisconsin | X | X | |
| Wyoming | X | X | |
| Totals | 46 | 45 | 16 |
| NOTES: These are cost containment initiatives in place at the start of FY 2014. SOURCE: Kaiser Commission on Medicaid and the Uninsured Survey of Medicaid Officials in 50 states and DC conducted by Health Management Associates, October 2014. |
|||
TABLE 14: PHARMACY COST CONTAINMENT ACTIONS TAKEN IN THE 50 STATES AND DC, FY 2014 AND 2015 |
||||||||||||||
| States | Impose Script Limits | Reduce Dispensing Fee | Reduce Ingredient Costs | Preferred Drug List Changes | Supplemental Rebate Changes | Other Pharmacy Actions | Total Pharmacy Actions Taken | |||||||
| 2014 | 2015 | 2014 | 2015 | 2014 | 2015 | 2014 | 2015 | 2014 | 2015 | 2014 | 2015 | 2014 | 2015 | |
| Alabama | X | X | X | X | X | |||||||||
| Alaska | X | X | X | |||||||||||
| Arizona | X | X | ||||||||||||
| Arkansas | ||||||||||||||
| California | X | X | X | X | ||||||||||
| Colorado | X | X | ||||||||||||
| Connecticut | X | X | ||||||||||||
| Delaware | X | X | ||||||||||||
| DC | X | X | ||||||||||||
| Florida | X | X | ||||||||||||
| Georgia | X | X | ||||||||||||
| Hawaii | ||||||||||||||
| Idaho | X | X | ||||||||||||
| Illinois | X | X | ||||||||||||
| Indiana | X | X | X | X | X | X | X | |||||||
| Iowa | X | X | ||||||||||||
| Kansas | ||||||||||||||
| Kentucky | ||||||||||||||
| Louisiana | X | X | ||||||||||||
| Maine | ||||||||||||||
| Maryland | X | X | ||||||||||||
| Massachusetts | X | X | X | X | ||||||||||
| Michigan | X | X | X | X | X | |||||||||
| Minnesota | X | X | ||||||||||||
| Mississippi | X | X | X | |||||||||||
| Missouri | ||||||||||||||
| Montana | ||||||||||||||
| Nebraska | ||||||||||||||
| Nevada | X | X | ||||||||||||
| New Hampshire | X | X | ||||||||||||
| New Jersey | X | X | ||||||||||||
| New Mexico | ||||||||||||||
| New York | X | X | X | X | X | |||||||||
| North Carolina | X | X | X | X | ||||||||||
| North Dakota | ||||||||||||||
| Ohio | X | X | ||||||||||||
| Oklahoma | X | X | X | |||||||||||
| Oregon | ||||||||||||||
| Pennsylvania | ||||||||||||||
| Rhode Island | X | X | ||||||||||||
| South Carolina | X | X | ||||||||||||
| South Dakota | ||||||||||||||
| Tennessee | X | X | X | |||||||||||
| Texas | X | X | X | X | X | |||||||||
| Utah | X | X | ||||||||||||
| Vermont | ||||||||||||||
| Virginia | X | X | X | X | ||||||||||
| Washington | X | X | X | X | X | X | X | |||||||
| West Virginia | X | X | X | |||||||||||
| Wisconsin | X | X | X | X | ||||||||||
| Wyoming | X | X | X | X | ||||||||||
| Totals | 1 | 0 | 1 | 1 | 3 | 5 | 4 | 5 | 4 | 3 | 25 | 13 | 28 | 20 |
| SOURCE: Kaiser Commission on Medicaid and the Uninsured Survey of Medicaid Officials in 50 states and DC conducted by Health Management Associates, October 2014. | ||||||||||||||
Program Integrity Initiatives
Medicaid has always focused on detection and prevention of fraud and abuse. As Medicaid has grown in size and scope, those efforts have intensified at both the federal and state levels.1 For example, the ACA included a number of provisions aimed at preventing fraud and abuse in the Medicare, Medicaid and CHIP programs. According to CMS, these measures, including enhanced provider screening, expanded audit efforts and new enforcement tools, will help shift fraud and abuse efforts “from a ‘pay and chase’ approach to one that makes it harder to commit fraud in the first place.”2 Medicaid Directors have also noted strong support for the Medicaid Integrity Institute, the first national Medicaid program integrity training center for states established in 2007 and operated under an interagency agreement with the US Department of Justice in South Carolina.3 In this year’s survey, states were asked to describe any significant new program integrity initiatives or enhancements implemented or planned for FY 2014 or FY 2015.
Advanced Data Analytics and Predictive Modeling. Medicaid claims data contain a wealth of information that can be “mined” to detect aberrant and suspicious billing patterns. Predictive modeling and other analytic technologies can be used both to prevent improper payments from occurring and to flag specific claims and providers for post-payment review and investigation. Seventeen states reported plans to implement, enhance or expand predictive modeling or other analytical technologies. Ten states also reported new or planned system procurements that would enhance their program integrity efforts including MMIS’s (Medicaid Management Information Systems), Decision Support Systems, Data Warehouses, Surveillance and Utilization Review (SUR) systems, Fraud and Abuse Detection Systems and fraud case management systems.
Managed Care Initiatives. Thirteen states commented on efforts to expand program integrity activities to managed care including applying data analytic technologies to managed care encounter claims, increased MCO site visits and audits, implementation of a managed care pharmacy utilization collaborative, and reviews of MCO providers. New York also reported that it was building a provider encounter transaction intake system which adds Qualified Health Plan encounters from private plans selected through the Marketplace. Recent recommendations on program integrity efforts from the National Association of Medicaid Directors (NAMD) include, among others, a focus on managed care plans; the recommendations call for CMS to mandate that all Medicaid managed care entities submit an annual fraud, waste and abuse plan to the state with the states establishing the specific requirements as part of their policies and contracts with risk-bearing entities. NAMD also recommends that states establish minimum standards for compliance staffing for risk-bearing entities. To ensure Medicaid is the last payer of resort, NAMD recommends that CMS require state to maintain and provide to risk-based entities centralized lists of Medicaid clients that have commercial insurance coverage.4
Enhanced Provider Screening. New and enhanced provider screening initiatives are designed to avoid payment of fraudulent claims by preventing dishonest entities from enrolling as providers. Seven states reported plans to implement or expand an enhanced provider screening initiative. For example, Alabama reported requiring DME and home health providers to re-enroll annually (instead of once every three and five years, respectively); Arizona’s Office of Inspector General (OIG) is automating the provider registration process to increase its efficiency and effectiveness and has also prioritized the development of the automated Excluded Provider Screening process and the expansion of this initiative to include provider employees; California will launch the Provider Application and Validation for Enrollment (PAVE) system in FY 2015; Nebraska will contract with a vendor in FY 2015 to implement ACA compliant provider screening and enrollment services; New Jersey and New Mexico are expanding provider screening site visits; New Mexico reported more extensive background checks, and Pennsylvania is working to streamline the provider enrollment process and achieve a single entry point for all provider enrollment.
Public/Private Data Sharing Initiatives. All health care payers, public and private, are vulnerable to fraud and abuse and therefore have an incentive to share data and information that could enhance their detection and prevention efforts. In this year’s survey, four states commented on public/private data sharing initiatives. For example, Alabama reported that its staff participates in a task force that meets quarterly to share information and audit findings. Task force members include the U.S. Attorney’s Office, the Medicaid Fraud Control Unit, private insurers, the FBI and the OIG. New Mexico reported on its efforts to conduct joint investigations with sub-contractors, MCOs and other government agencies. Vermont reported that it had recently joined the Healthcare Fraud Prevention Partnership (HFPP) facilitated by CMS. The HFPP exchanges facts and information between public and private sectors to detect and prevent healthcare fraud. Data is collected by a trusted third party and analyzed and reported through CMS back to the partners. West Virginia reported that its Office of Program Integrity began structured collaboration with the state’s MCOs by hosting quarterly meetings with the MCOs, Medicaid Fraud Control Unit and the Office of Program Integrity.
Other Program Integrity Initiatives. Seventeen states reported on a wide range of other program integrity efforts or initiatives. Three states identified initiatives related to home health or personal care services (Maryland, Nebraska and New Jersey); three states reported on increased provider education efforts (Florida, Indiana and Maryland); two states enhanced pharmacy lock-in programs (South Carolina and Utah); two states reported initiatives relating to member eligibility and redeterminations (Illinois and Oklahoma); Virginia reported on reviews of LTC facilities for compliance with federal and state requirements regarding RUG (Resource Utilization Group) reimbursement limits; Alaska reported implementing a Super Utilizer program; Arizona reported that its OIG was planning to create a False Claims Act statute for Medicaid; Finally, Georgia reported expanding the use of PARIS5 starting with interstate data matches and moving to Department of Veteran Services matches thereafter; Hawaii reported contracting with a new vendor to perform data matches for commercial insurance; Iowa is working towards obtaining permission to use dual eligible data for program integrity activities; Mississippi reported generally on plans to enhance to its Surveillance Utilization Reviews and case tracking activities, and Ohio reported increasing onsite audits.
Medicaid Administration and Priorities
Today, the Medicaid program is evolving more rapidly than at previous time in its history. States and the federal government are working to maximize the value and efficiency of Medicaid by reforming payment to reward value over volume, integrating effective care coordination across payers, and streamlining key processes like eligibility determinations across coverage programs. Underpinning a state’s ability to implement these reforms is its capacity to manage its Medicaid program effectively and efficiently. Through the recession, Medicaid, along with other state agencies, often faced cuts in staff and other resources.1 This combined with the transformation of the program, high demand for services and tight deadlines tied to ACA implementation and other federal initiatives (e.g. ICD-10 conversion, HIT meaningful use incentives, etc.) have strained Medicaid administrative staff for the past several years. These transformations also have resulted in the need for different skills for staff and leadership, additional resources and new systems.
In 2013 and 2014, Medicaid agencies implemented complex new systems related to the implementation of the ACA, including implementation of a new Medicaid eligibility system using Modified Adjusted Gross Income (MAGI). At the same time, many Medicaid agencies were updating or replacing their Medicaid Management Information Systems, finalizing system requirements for the exchange of data with the new health insurance Marketplaces (Exchanges), developing and implementing a range of delivery system, payment reform and program integrity initiatives. In implementing these vast changes, directors reported that staffing has been a significant challenge, but that with temporary workers, overtime and contractors, the work has gotten done. Of particular concern was staff for eligibility determinations and IT.
During FY 2014 and 2015, a total of 33 states indicated that they were able to add staff and other resources to address the increased workload, with staff being added most often for eligibility and processing of applications, call centers, data analytics, staff to manage the new reporting requirements and program integrity.
Medicaid agencies cited significant challenges in finding and retaining staff that have the skill sets, experience and credentials required for critical functions. The most frequently mentioned challenges related to the ability to attract and retain specialized staff within the constraints of state civil service hiring rules and state salaries. Medicaid must compete with the private sector in hiring for these types of positions. Medicaid agencies mentioned challenges to find and retain positions most often in these areas: systems and information technology, data analytics, actuarial expertise, managed care expertise, clinical professionals, attorneys, and executive level administrators. In addition, it is a challenge finding staff with experience and knowledge of complex Medicaid rules, policies and procedures.
Given the administrative and staffing challenges, Medicaid directors often pointed to program improvements through delivery and payment system reforms and implementation of eligibility system improvements (including the conversion to MAGI) as major successes. In addition, Medicaid officials that had implemented the ACA eligibility expansion uniformly took pride in the state’s coverage expansion, and in their experience to date as large numbers had enrolled, often at a pace faster than had been anticipated. State officials also mentioned their pride in the efficiency of program administration, the low growth in the cost of care per Medicaid beneficiary, and the productive relationship with providers and other stakeholders in addressing issues and developing new policies and initiatives. An upcoming survey report on Medicaid Operations from the National Association of Medicaid Directors describes the administrative capacity issues and their implications in more detail.2
“We take pride in the amazing, dedicated, passionate, professional team that has dealt with an unprecedented level of change and scrutiny of the Medicaid program and how they have gone above and beyond the call of duty to provide comprehensive, quality and cost effective care to those in need in our state.”
“…a good steward of public funds through effective and efficient administration of Medicaid.”
“…successfully implemented statewide managed care across both physical and behavioral health delivery systems.”
“We are pleased to have expanded coverage to ACA adults, to have managed the expansion as efficiently as possible, and to have achieved a high degree of coordination with marketplace.”
Medicaid Priorities for the Future
When looking forward over the next year, Medicaid directors outlined an ambitious list of both policy and operational priorities for the immediate future. Directors most frequently listed payment and delivery system reform as a top priority with a particular interest in achieving greater value and performance through these reforms. Some Medicaid directors listed specific examples, including the integration of physical health and behavioral health services, or integration of physical health and long term care services and supports. Some states were developing plans in this area and others were in the initial stages of implementation. A significant number of states mentioned as a priority their efforts to improve quality of care, including a focus on improving outcomes and improvements in population health measures. In some cases these were associated with system improvements and their goal to have greater capability for data analytics that would help measure and monitor improvements in quality and measures of health.
A number of states mentioned continued implementation of the ACA as a high priority. In some cases this referred to major upgrades to state Medicaid eligibility systems and the MAGI eligibility rules that are being implemented in 2014, and in other cases this priority referred to the continued enrollment of newly eligible individuals, as sustained enrollment growth continued to occur at the time of the survey across those states implementing the ACA eligibility expansion.
New eligibility systems, a new MMIS or other information technology or systems were listed by a majority of states as top operational priorities. A number of directors also mentioned a focus on data analytic capabilities that would assist in policy development and analysis, as well as be a tool for program integrity. Other operational priorities in some states involved staffing and organizational changes designed to better position the program to address the challenges facing a modern Medicaid program.
“Driving plans and providers to more value-based arrangements as part of our payment modernization efforts.”
“We will continue to work on payment reform to better align payments with value-based outcomes.”
“Implementation of integrated care for dual eligibles, re-procurement of health plan contracts, and continuation of the Medicaid expansion ramp up.”-
“Medicaid will focus on continuing to integrate acute care and long term services and supports into Medicaid managed care [and also] to integrate behavioral health and physical health services.”
“Develop options with regards to high cost treatments like Sovaldi that threaten the overall sustainability of programs like Medicaid.”
“We are working to ensure the online application, eligibility and enrollment system will be ready for open enrollment.”
“Getting the new MMIS in place and functioning is a huge priority. Also, ACA implementation issues and bringing up the new eligibility system.”
Finally, a significant number of states listed a priority of budget stability or cost control. Even as state budget situations continue to improve, Medicaid is subject to perennial pressure to control the growth in Medicaid spending. These issues are tied to strategies of delivery system and payment reforms, which focus on delivering better value and improving outcomes.
Methodology
The focus of the annual survey is on Medicaid policy changes and new initiatives that are implemented, or are adopted and planned for implementation. This survey asked state officials to describe policy changes that occurred in FY 2014 and those adopted for implementation for FY 2015.The survey does not attempt to catalog all Medicaid policies. Experience has shown that adopted policies are sometimes delayed or not implemented, for reasons related to legal, fiscal, administrative, systems or political considerations, or due to delays in approval from CMS. Policy changes under consideration are not included in the survey.
Appendix
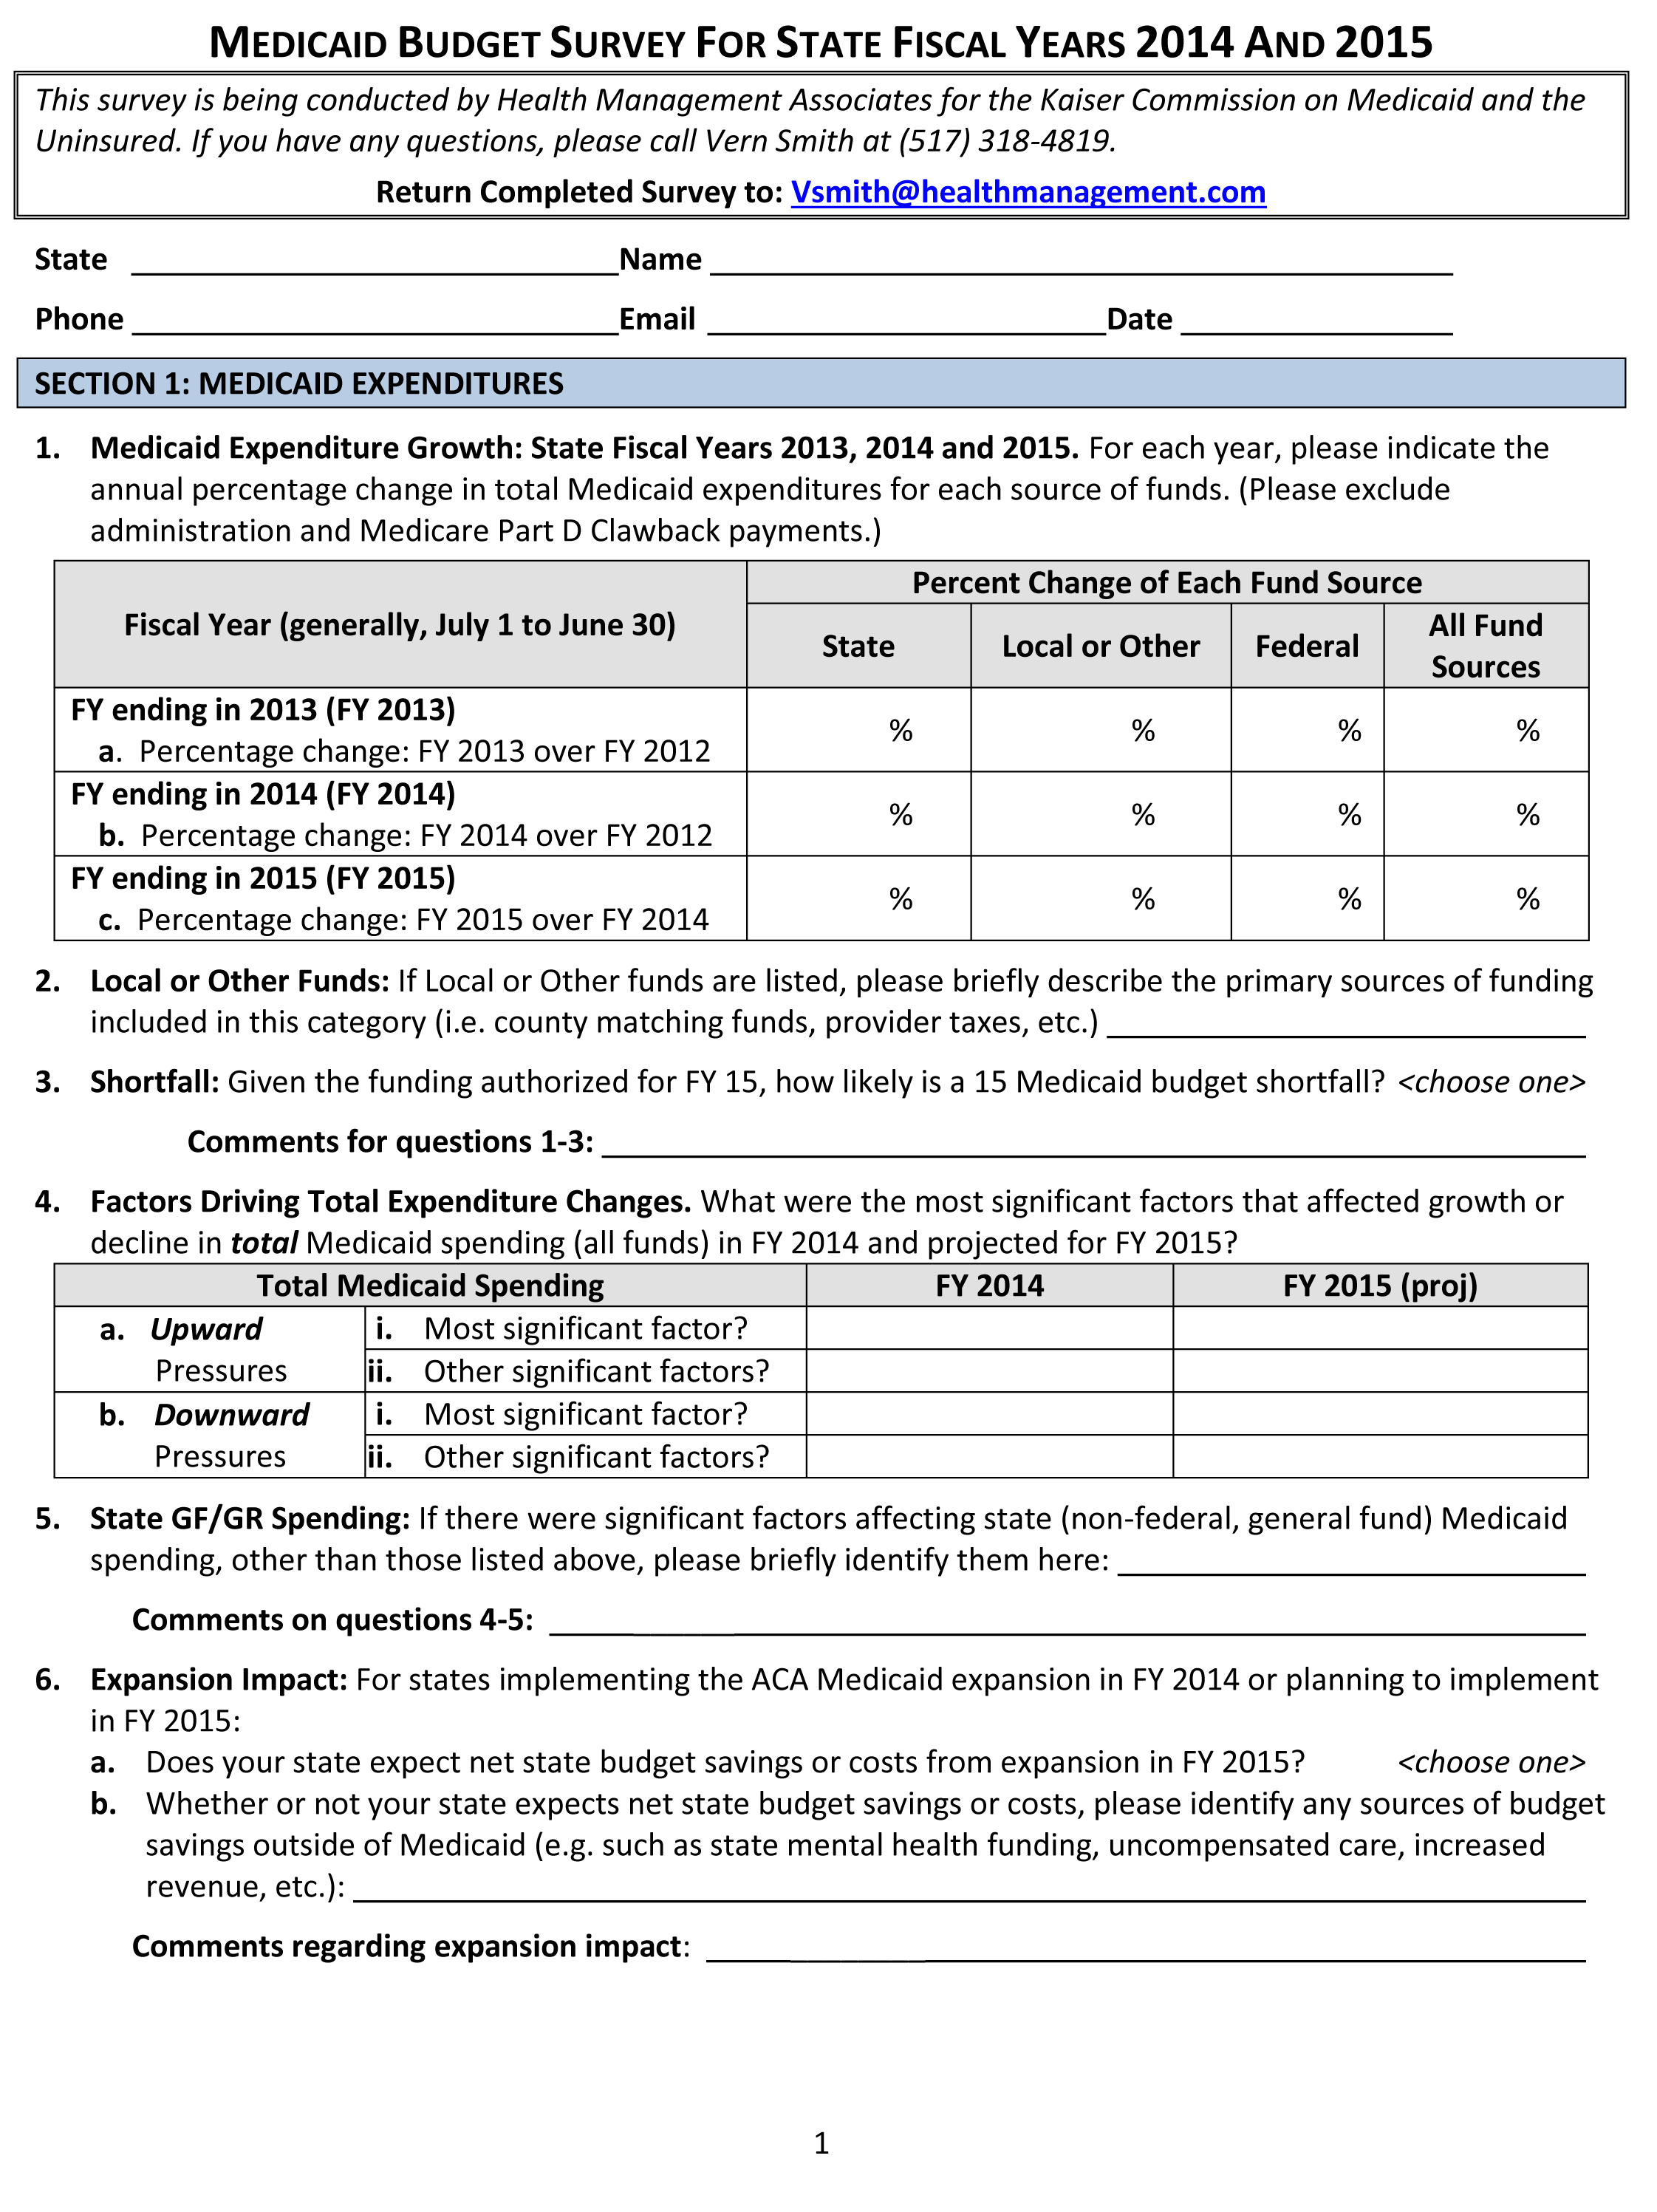
Endnotes
Report
Introduction
State fiscal years begin on July 1 except for these states: NY on April 1; TX on September 1; AL, MI and DC on October 1.
Eligibility and Enrollment
Connecticut covered parents up to 201% FPL; childless adults with incomes above 138% FPL were not covered under Medicaid in the state.
Under the HIP waiver extension, parents will not be limited by enrollment caps or open enrollment periods, and will have the ability to enroll in HIP provided they make the required contributions. Enrollment for childless adults will continue to be capped; however, the cap was increased as part of the waiver renewal.
Family planning waivers and SPAs offer limited benefits while the breast and cervical cancer treatment program and the medically needy spend-down programs offer full Medicaid benefits but are limited to those with either a specific condition or after meeting spend-down requirements.
Louisiana is planning to shift those under 133% FPL from the Family Planning waiver to a SPA.
Indiana operated as a Section 209(b) state; under Section 209(b) of the Social Security Act, states develop their own disability determination methods for determining eligibility for aged, blind, and disabled groups. As part of this option, states must operate a spend-down program. Indiana switched to operate as a Section 1634 state, which relies on disability determinations by the Social Security Administration. As a Section 1634 state, Indiana could no longer operate a spend-down program.
New Hampshire had also previously implemented 12 month continuous eligibility for adults through an 1115 waiver.
Center for Medicaid and CHIP Services, CMCS Informational Bulletin: Implementation of Hospital Presumptive Eligibility, (Centers for Medicare and Medicaid Services, January 24, 2014.) http://www.medicaid.gov/Federal-Policy-Guidance/downloads/CIB-01-24-2014.pdf.
- Positive changes from the beneficiary’s perspective that were counted in this report are denoted with (+). Negative changes from the beneficiary’s perspective that were counted in this report are denoted with (-). Several states made reductions to Medicaid eligibility pathways in response to either the availability of coverage through the Marketplaces and/or through the Medicaid expansion; these changes were denoted as (#) since most affected beneficiaries will have access to coverage through an alternative pathway. Other changes to Medicaid eligibility that are not likely to affect beneficiaries but were reported by states are denoted with (nc).
- This is in lieu of the “217-like option” which had been approved by CMS as part of the state’s comprehensive waiver, but proved challenging to implement.
Delivery System Reforms
Mississippi is included in the counts for states operating MCOs; however, their risk-based managed care program does not cover inpatient hospital services. ID’s MMCP program, which is secondary to Medicare, has been re-categorized by CMS from a PAHP to an MCO by CMS but is not counted here as such. CA has a small PCCM program operating in LA county for those with HIV.
Vermont noted that under the state’s Section 1115 Global Commitment waiver which includes a global cap, the state’s PCCM program operates as if it were a public sector risk-bearing MCO. The SIM grant is part of the state’s efforts to move eventually to a single-payer system. The state passed legislation in 2011 to implement a single-payer health care system after additional waiver authority through the ACA becomes available.
Not counted here is Massachusetts; this state also adopted policies (expanding the availability of other options) which resulted in decreased enrollment in PCCM programs; however, this was not the intent of the policy changes.
Hawaii auto assigns all new members to a health plan and then offers them a choice.
Kaiser Commission on Medicaid and the Uninsured, Decoding Medicaid Care Delivery and Financing Models: A Glossary of Widely Used Terms, (Washington, DC: Kaiser Commission on Medicaid and the Uninsured,) May 2012. http://www.kff.org/medicaid/8313.cfm.
States can submit more than one SPA targeting different populations and there are no deadlines related to this option. The enhanced funding is available for the first 8 quarters of each SPA.
Julia Paradise, Health Homes for Medicaid Beneficiaries with Chronic Conditions, (Washington, DC: Kaiser Commission on Medicaid and the Uninsured,) August 2012. http://www.kff.org/medicaid/8340.cfm.
Kaiser Commission on Medicaid and the Uninsured, Decoding Medicaid Care Delivery and Financing Models: A Glossary of Widely Used Terms, (Washington, DC: Kaiser Commission on Medicaid and the Uninsured,) May 2012. http://www.kff.org/medicaid/8313.cfm.
Kaiser Family Foundation analysis of CMS Medicare Current Beneficiary Survey Cost and Use file, 2009.
Katherine Young, Rachel Garfield, MaryBeth Musumeci, Lisa Clemans-Cope, and Emily Lawton. Medicaid’s Role for Dual Eligible Beneficiaries, (Kaiser Commission on Medicaid and the Uninsured,) August 2013. https://www.kff.org/wp-content/uploads/2013/08/7846-04-medicaids-role-for-dual-eligible-beneficiaries.pdf.
Ten of the states planning to implement a financial alignment demonstration in FY 2015 had MOUs approved with CMS; Connecticut, Rhode Island and Oklahoma had proposals pending at CMS.
Musumeci, MaryBeth, Financial and Administrative Alignment Demonstrations for Dual Eligible Beneficiaries Compared: States with Memoranda of Understanding Approved by CMS, (Kaiser Family Foundation, July 2014.) https://www.kff.org/medicaid/issue-brief/financial-alignment-demonstrations-for-dual-eligible-beneficiaries-compared/.
State Health Facts, Distribution of Medicaid Spending by Service, FY 2012. (Kaiser Family Foundation) accessed September 2014. https://www.kff.org/medicaid/state-indicator/distribution-of-medicaid-spending-by-service/.
The “Program of all All-Inclusive Care for the Elderly” (PACE) is a capitated managed care benefit for the frail elderly provided by a not-for-profit or public entity that features a comprehensive medical and social service delivery system. It uses a multidisciplinary team approach in an adult day health center supplemented by in-home and referral services in accordance with participants' needs.
The “Program of all All-Inclusive Care for the Elderly” (PACE) is a capitated managed care benefit for the frail elderly provided by a not-for-profit or public entity that features a comprehensive medical and social service delivery system. It uses a multidisciplinary team approach in an adult day health center supplemented by in-home and referral services in accordance with participants' needs.
Governor Dannel P. Malloy, Gov. Malloy Announces $9 Million in Nursing Home “Rebalancing” Grants, (Office of the Governor of Connecticut, March 21, 2014.) http://www.governor.ct.gov/malloy/cwp/view.asp?A=4010&Q=542054.
“Conflict-free case management” assures, in part, that the person or entity that conducts the functional assessment and/or case management services for a member does not also provide services to that individual.
Single points of entry (SPOE) systems offer consumers one-stop access to information, support, and linkages to local care services thereby reducing service fragmentation and simplifying access to long-term supports and services.
A reduction of in-home supportive services hours reported by California for FY 2014 has been recorded as a benefit change.
States can implement this option through a SPA or waiver. An enhanced FMAP is available and varies depending on the share of long term care spending dedicated to HCBS in 2009 ranging from an additional 5 percent for states that dedicated less than 25 percent of their long term care spending on HCBS in 2009 and an additional 2 percent for states that spent between 25 and 50 percent of long term care spending on HCBS in 2009.
New Hampshire and Ohio had applications for the BIP program approved prior to FY 2015.
77 Fed. Reg. 26828 (May 7, 2012).
State of California Health and Human Services Agency, California Receives First-in-the-Nation Approval of New Community-Based Care Option for At-Risk Seniors and Persons with Disabilities. (Sacramento, CA: State of California Health and Human Services Agency,) September 4, 2012. http://www.cdss.ca.gov/cdssweb/default.htm.
CMS Fact Sheet: Summary of Key Provisions of the Home and Community-Based Services (HCBS) Settings Final Rule (CMS 2249-F/2296-F), January 10, 2014.
States’ efforts to expand HCBS options for LTSS are driven in part by the United States Supreme Court’s 1999 decision in Olmstead v. L.C., which found that the unjustified institutionalization of people with disabilities violates the Americans with Disabilities Act.
Provider Rates and Taxes or Fees
Rates for FY 2015 not yet determined at the time of the survey included MCO rates for North Dakota and Wisconsin, inpatient hospital, rates for Wisconsin, and nursing home rates for Alaska. North Carolina did not provide responses for FY 2015.
New Mexico reported an existing MCO provider tax that is tied to their Medicaid’ Insurance Pool, a high risk pool program. The state also reported a new MCO tax added in FY 2014 as well.
Benefits Changes
Centers for Medicare and Medicaid Services, Letter of waiver approval to Secretary Mackereth, August 28, 2014. http://www.healthypa.com/.
Kaiser Commission on Medicaid and the Uninsured, Proposed Medicaid Expansion in Indiana through HIP 2.0, (Kaiser Family Foundation, September 2014.) https://www.kff.org/medicaid/fact-sheet/proposed-medicaid-expansion-in-indiana-through-hip-2-0/.
- Positive changes counted in this report are denoted with (+). Negative changes counted in this report are denoted with (-). Changes that were not counted as positive or negative in this report, but were mentioned by states in their responses, are denoted with (nc).
- Ibid.
- Centers for Medicare and Medicaid Services, Letter of waiver approval to Secretary Mackereth, August 28, 2014. http://www.healthypa.com/.
Premiums and Cost-sharing
Pennsylvania, as part of their waiver, will apply existing cost-sharing requirements to the new expansion population. This change is reported as new in the table, but is not included in the counts of increases.
Ibid.
Kaiser Commission on Medicaid and the Uninsured, Proposed Medicaid Expansion in Indiana through HIP 2.0, (Kaiser Family Foundation, September 2014.) https://www.kff.org/medicaid/fact-sheet/proposed-medicaid-expansion-in-indiana-through-hip-2-0/.
- New premiums or copayments as well as new requirements such as making copayments enforceable are denoted as (NEW). Increases in existing premiums or copayments are denoted as (Increased), while decreases are denoted as (Decreased) and eliminations are denoted as (Eliminated).Entries marked as (Proposed) require waiver approval from CMS to implement.
Prescription Drug Utilization and Cost Control Initiatives
In accordance with federal and state law, states pay the lower of (a) the ingredient cost rate plus a dispensing fee; (b) the Federal Upper Limit (FUL) or State Maximum Allowable Cost rate, if applicable, plus a dispensing fee; or (c) the pharmacy’s Usual and Customary Charge.
“Post AWP Pharmacy Pricing and Reimbursement,” American Medicaid Pharmacy Administrators Association and National Association of State Medicaid Directors, White Paper, June 2010.
CMCS Informational Bulletin, “Medicaid Pharmacy – Survey of Retail Prices,” May 31, 2012. http://www.medicaid.gov/Federal-Policy-Guidance/Downloads/CIB-05-31-12.pdf.
Alaska reported plans to adopt NADAC pricing for only its State Maximum Allowable Cost list drugs.
Express Scripts, The 2013 Drug Trend Report, (Express Scripts, April 2014). http://lab.express-scripts.com/drug-trend-report/.
The Express Scripts Lab, The 2013 Drug Trend Report Highlights, (Express Scripts, April 2014.) http://lab.express-scripts.com/drug-trend-report/~/media/ace07d91fe7643f6ae2bb9aef764905d.ashx.
Chris Kardish, “The Risky Business of Limiting Medicaid Access to Sovaldi.” (Governing, August 19, 2014.) http://www.governing.com/topics/health-human-services/gov-hepatitis-coverage-solvaldi-lawsuits.html.
Express Scripts, State Governments May Spend $55 Billion on Hepatitis C Medications, (Express Scripts, July 2014.) http://lab.express-scripts.com/insights/specialty-medications/~/media/44c9ff2df0fb463d9c48a4fa4837d367.ashx
Tricia Neuman, Jack Hoadley, and Juliette Cubanski. “The Cost of a Cure: Medicare’s Role in Treating Hepatitis C.” (Health Affairs, June 5, 2014.) http://healthaffairs.org/blog/2014/06/05/the-cost-of-a-cure-medicares-role-in-treating-hepatitis-c/.
Program Integrity Initiatives
Kaiser Commission on Medicaid and the Uninsured, Program Integrity in Medicaid: A Primer. (Kaiser Family Foundation, July 2012.) http://www.kff.org/medicaid/8337.cfm.
HHS announces new tools and resources from the Affordable Care Act…, HHS News Release, September 20, 2010, available at http://wayback.archive-it.org/3926/20131018160558/http://www.hhs.gov/news/press/2010pres/09/20100920e.html.
National Association of Medicaid Directors, Medicaid Managed Care Modernization: Employing New Tools and Efficiencies to Strengthen Program Integrity, (National Association of Medicaid Directors, September 2014.) http://medicaiddirectors.org/sites/medicaiddirectors.org/files/public/namd_mmc_pi_modernization_proposals_140902.pdf.
Ibid.
The Public Assistance Reporting Information System (PARIS) is a federal and state partnership that collects, houses and matches public assistance eligibility information to improve program integrity among participating states.
Medicaid Administration and Priorities
Eileen Griffin, Trish Riley, Vikki Wachino and Robin Rudowitz. Managing a High Performance Medicaid System. (Kaiser Commission on Medicaid and the Uninsured, October 2013.) https://www.kff.org/medicaid/report/managing-a-high-performing-medicaid-program/.
See Forthcoming NAMD report from its Survey of Medicaid Operations. http://www.medicaiddirectors.org.
Methodology
State fiscal years begin on July 1 except for these states: NY on April 1; TX on September 1; AL, MI and DC on October 1.