Kaiser Health Tracking Poll: December 2013
The Latest Kaiser Health Tracking Poll finds a 13 percentage point rebound in support for the Affordable Care Act (ACA) among Democrats this month, but no overall movement in support or opposition to the ACA since the November poll found a negative shift in views following the problem-plagued rollout of the law. In December, 34 percent have a favorable view of the ACA and 48 percent have an unfavorable view. The share of Americans that expect to see no personal impact from the law reached a new high in Kaiser polling this month and now stands at nearly half the public. Still, the public is more likely to attribute negative consequences to the law (believing it has increased the federal deficit and caused many people to lose their insurance coverage) than to say it has had positive effects (such as lowering prescription costs for seniors, eliminating cost-sharing for preventive services, and providing rebates to consumers whose health plans spent too much on administration). Americans are divided on what they would like Congress to do next with the law, with about four in ten wanting the law to be expanded or kept as is and a similar share wanting to see it repealed (either being replaced with a Republican alternative or repealed and not replaced). This month’s survey also highlights some of the problems the uninsured continue to experience in accessing and paying for health care; for example, the uninsured are about twice as likely as those with insurance to report problems paying medical bills, and four times as likely to say they had trouble getting medical care in the past year.
Overall Views Remain The Same As In November, Despite Rallying Support From Democrats
The latest Kaiser Health Tracking Poll finds that in December, about a third (34 percent) of the public has a favorable view of the ACA, while nearly half (48 percent) view the law unfavorably, shares that are largely unchanged from November. Support rallied this month among Democrats – 68 percent of them now express a favorable view of the law, up from 55 percent last month.
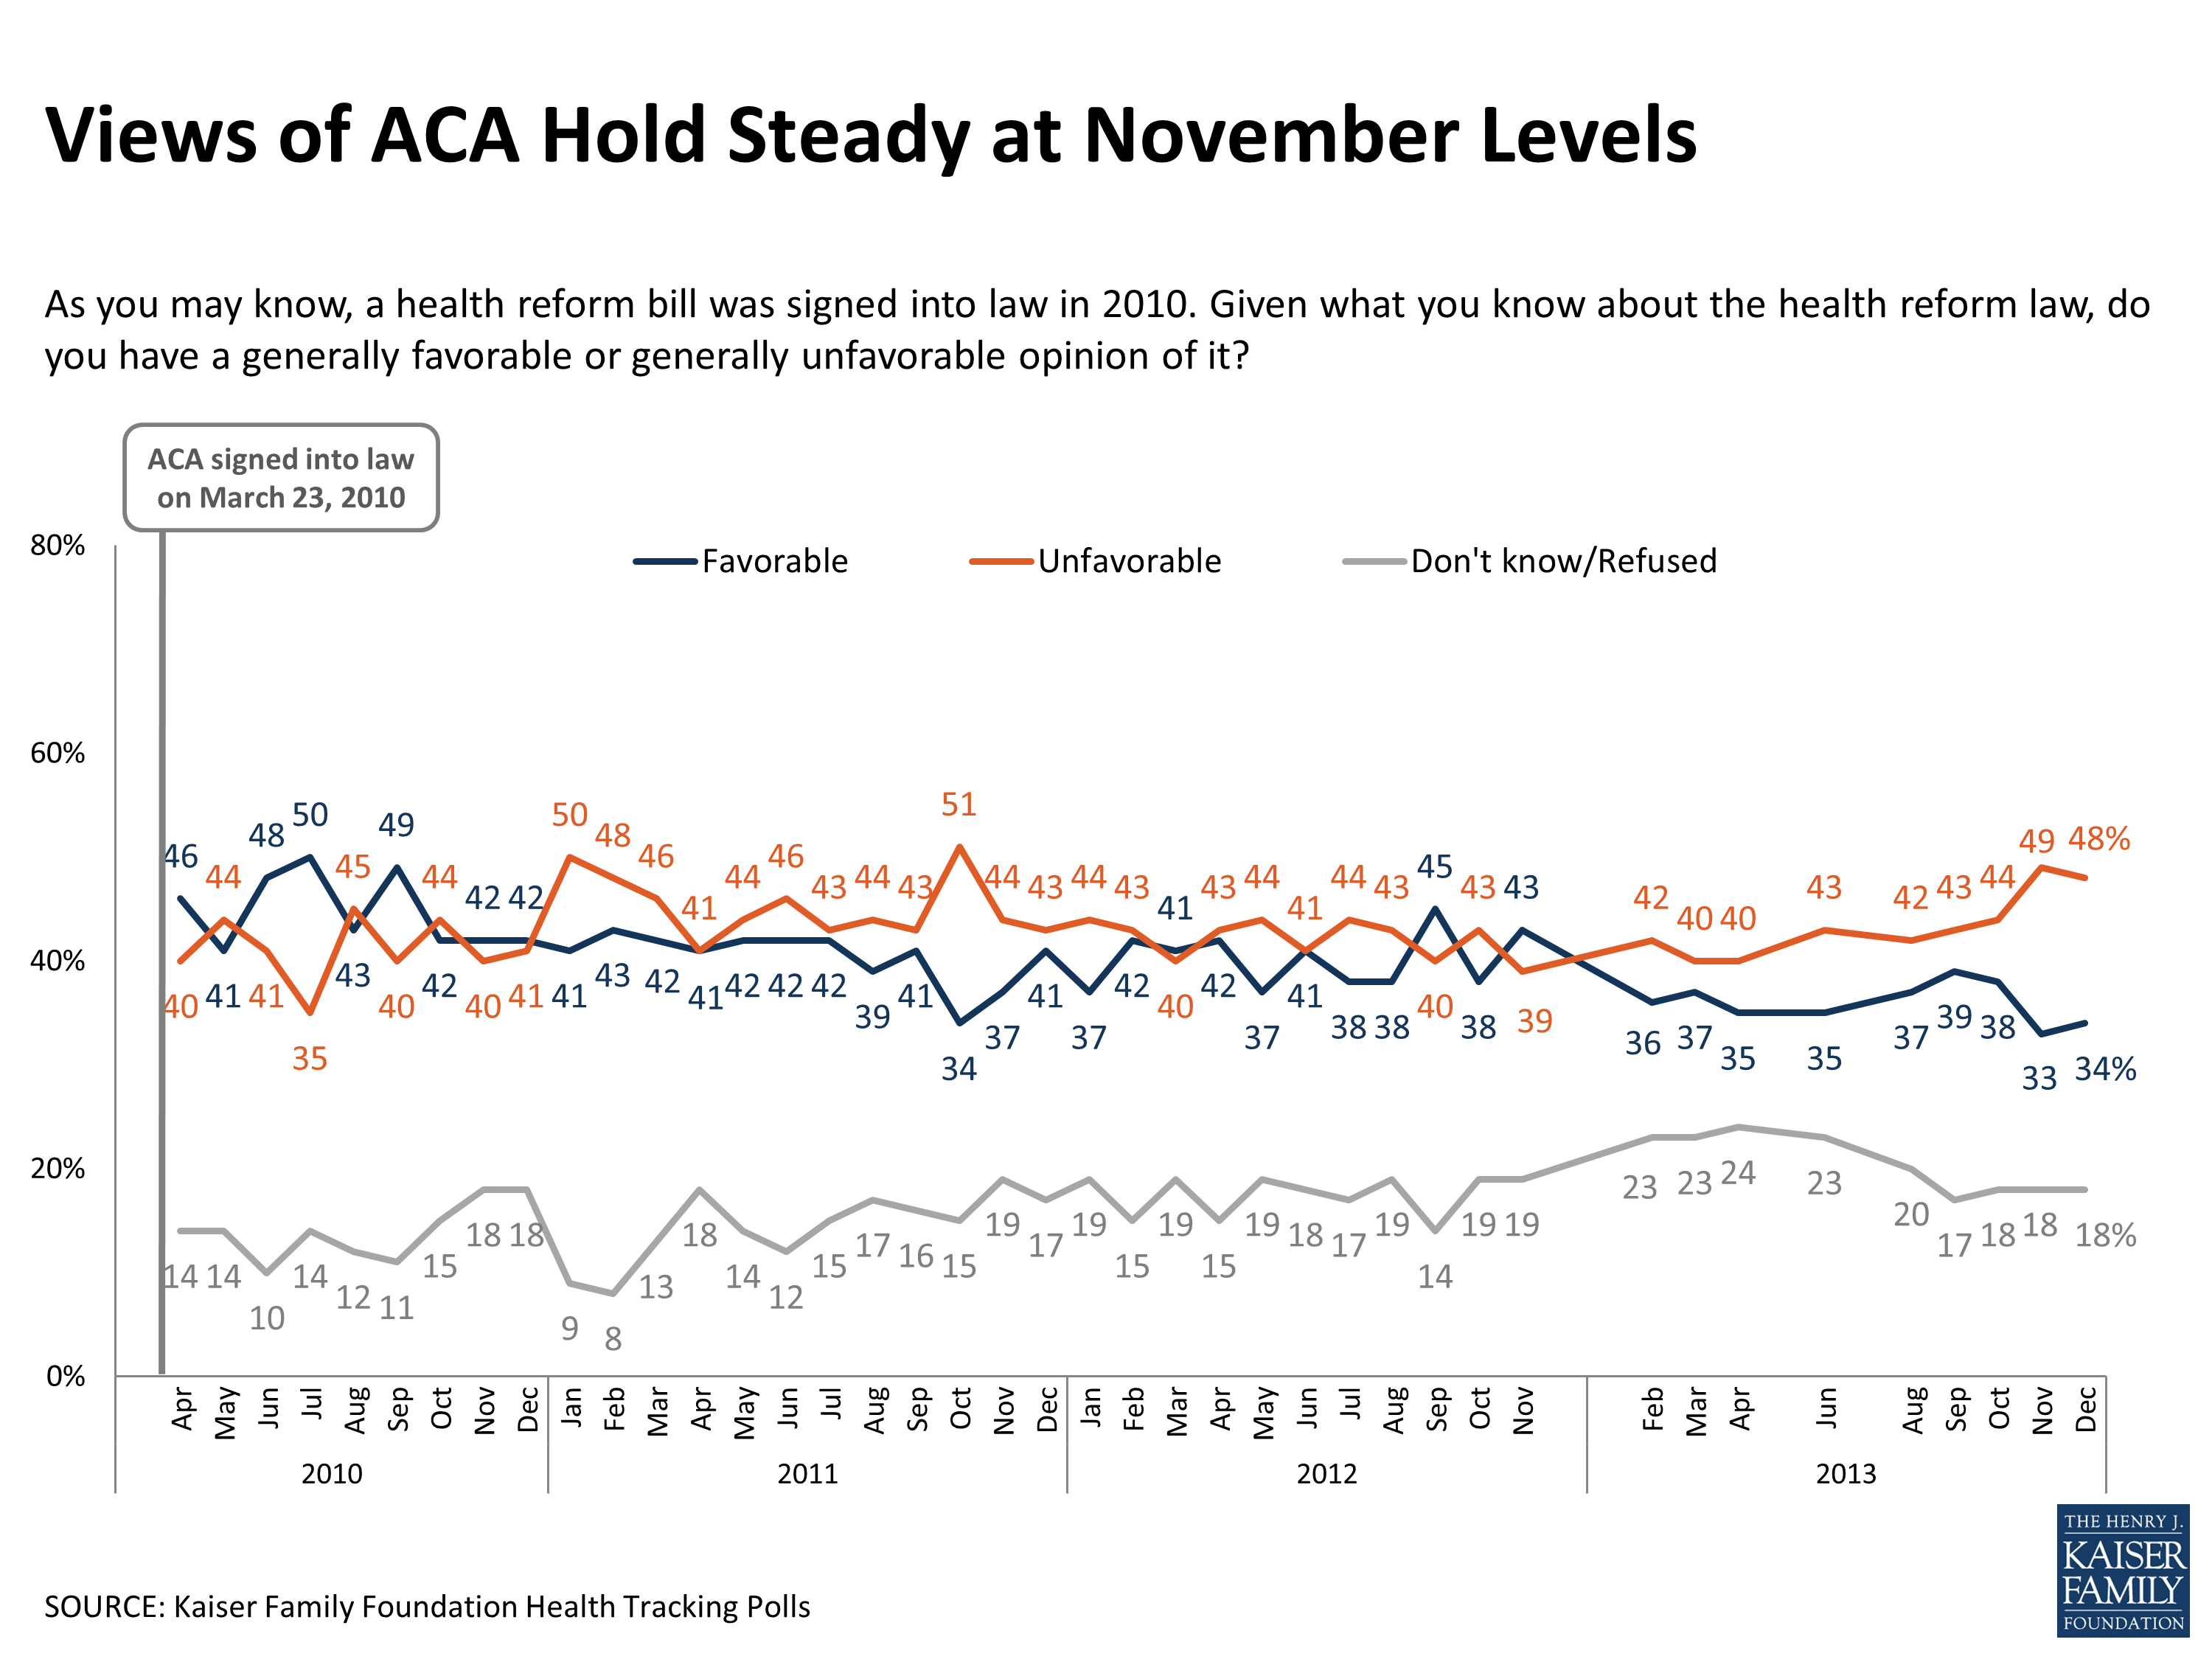
Figure 1
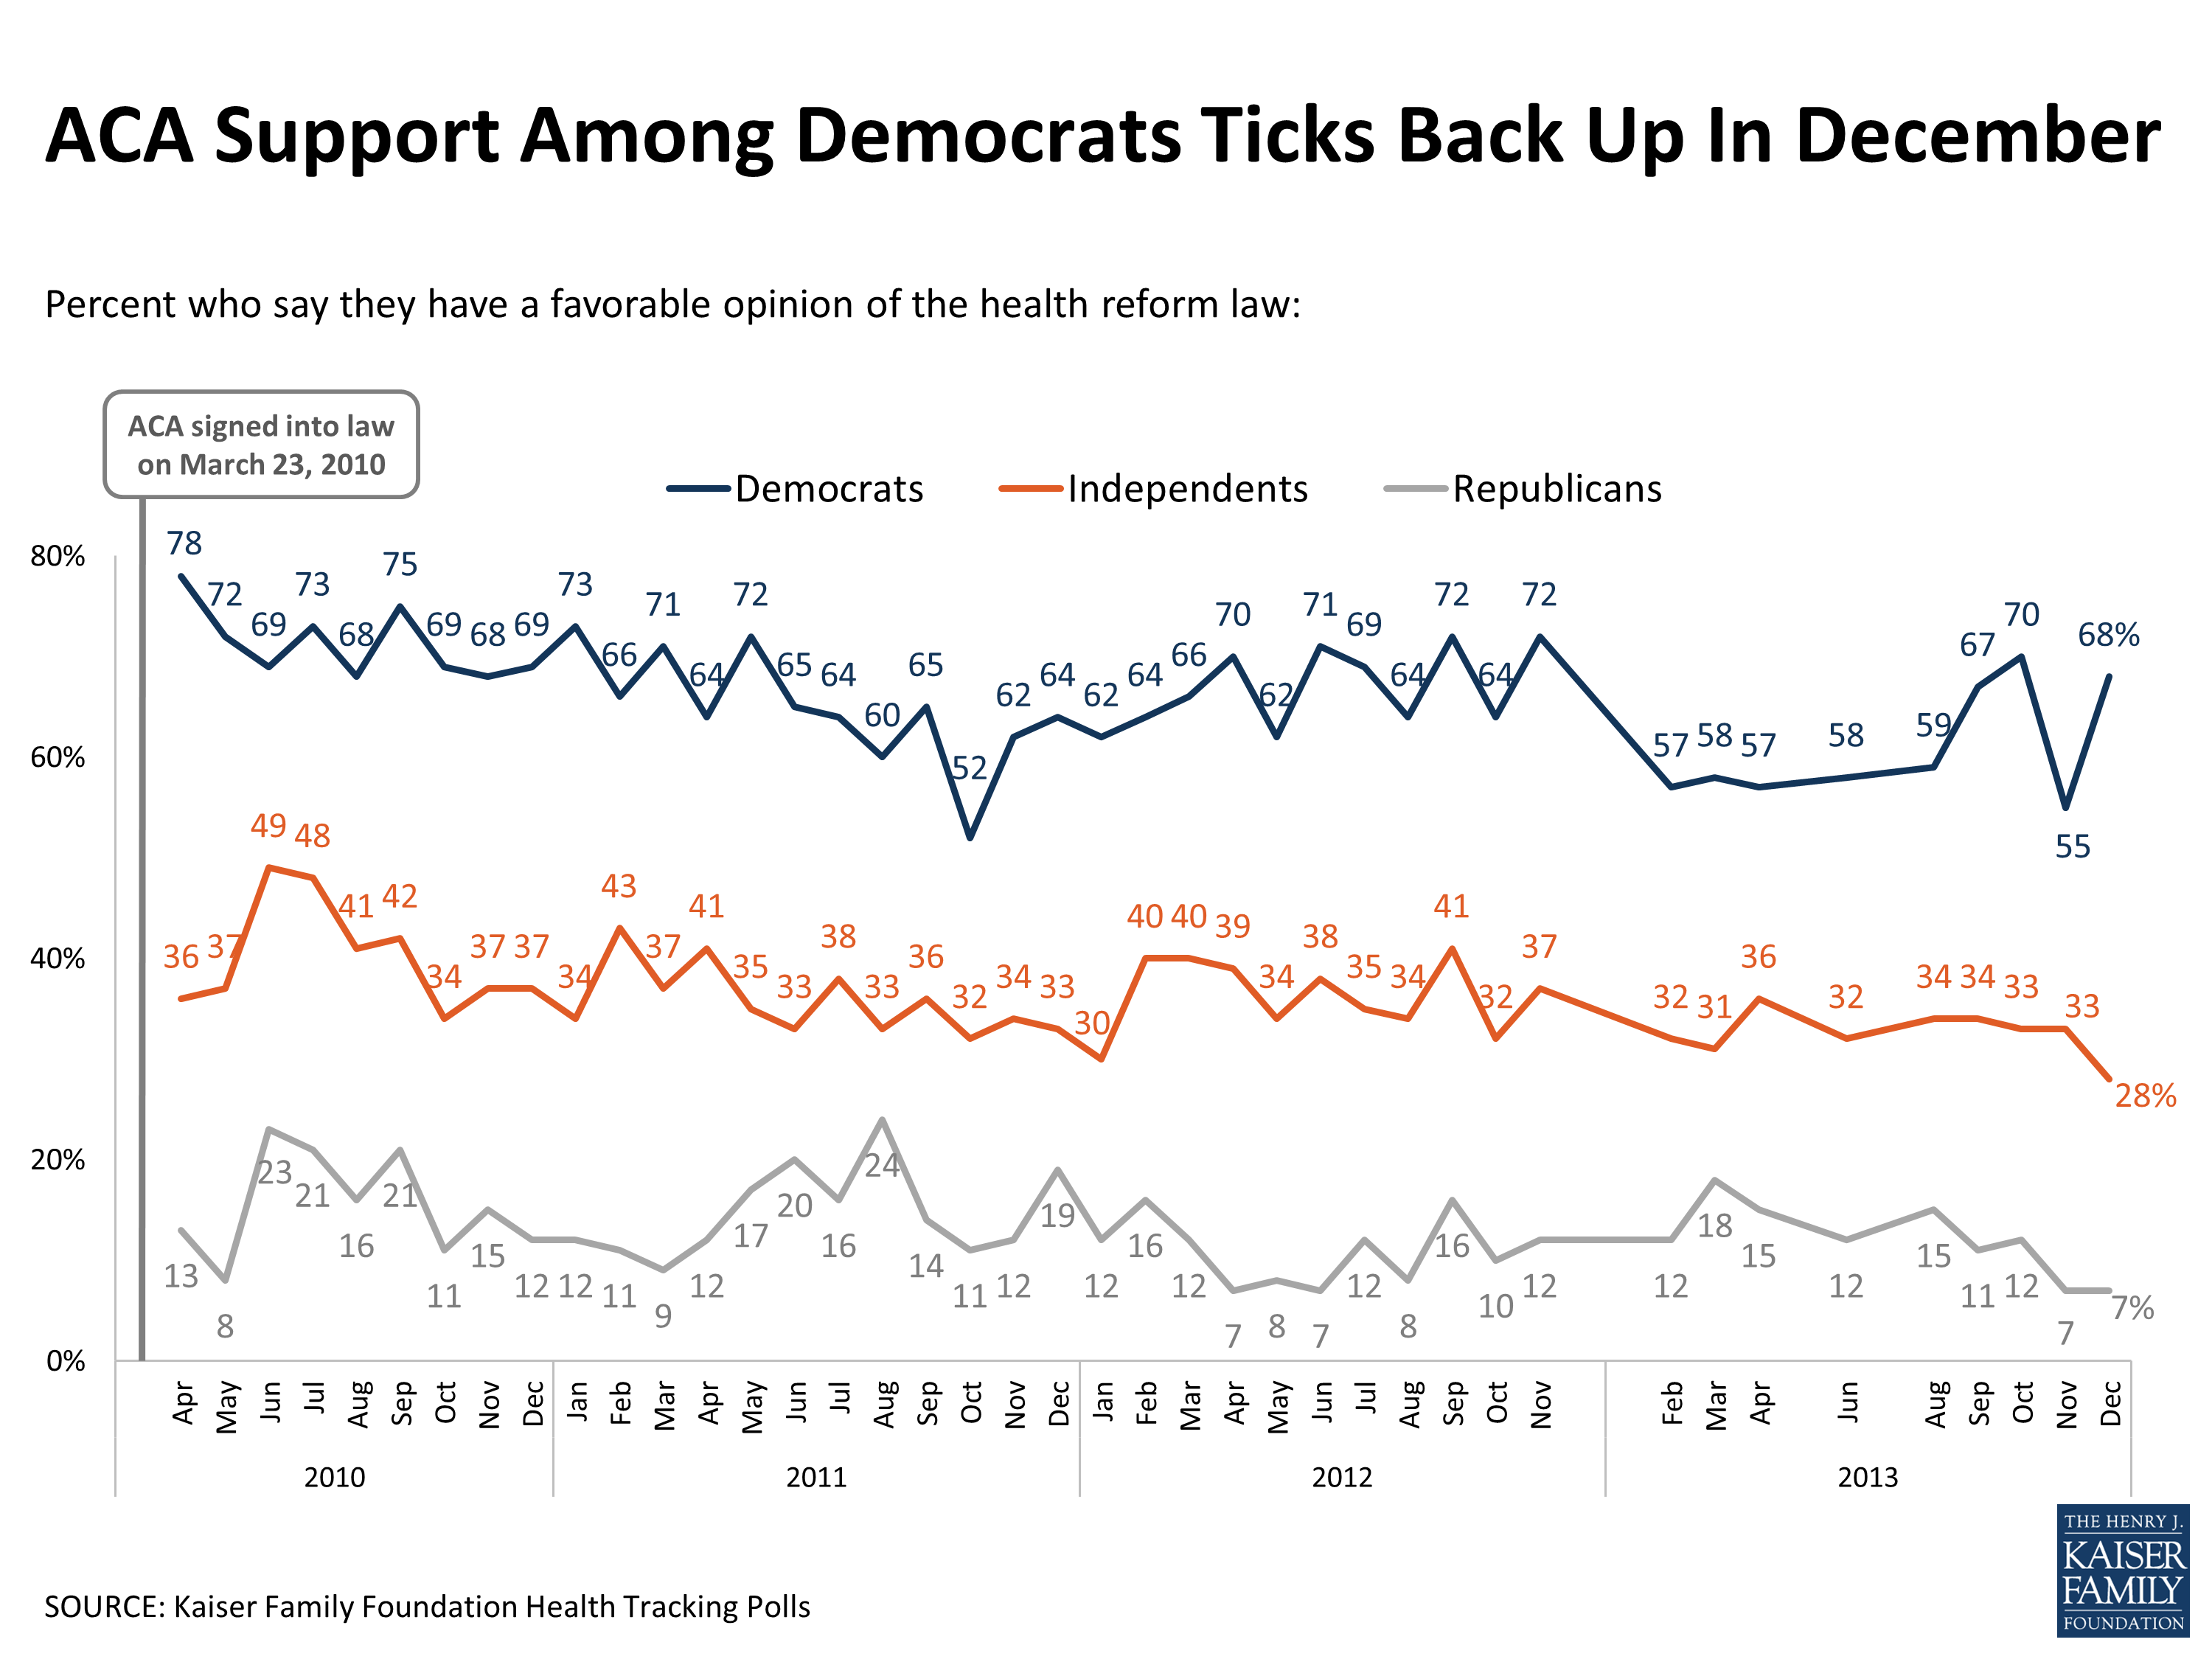
Figure 2
This month’s poll did not find a similar rebound in support among independents who say they lean toward the Democratic Party. In previous polls, this group’s views have pretty closely mirrored those of Democrats, but while the share of Democrats with a favorable view of the ACA jumped 13 percentage points from November to December, the share of Democratic-leaning independents viewing the law favorably was flat (49 percent in December, the same share measured in the November poll).
Views of the law continue to be overwhelmingly negative among both Republicans and Republican-leaning independents. Among “pure” independents this month (those who say they don’t lean towards either party), unfavorable views outnumber favorable ones by a margin of two to one (52 percent unfavorable versus 25 percent favorable).
|
FIGURE 3: Views Of The ACA Sharply Divided By Party ID
|
||||||
|
As you may know, a health reform bill was signed into law in 2010. Given what you know about the health reform law, do you have a generally favorable or generally unfavorable opinion of it?
|
Total public
|
Democrats
|
Democratic-leaning independents
|
“Pure” independents (don’t lean)
|
Republican-leaning independents
|
Republicans
|
|
Favorable
|
34
|
68
|
49
|
25
|
12
|
7
|
|
Unfavorable
|
48
|
13
|
25
|
52
|
78
|
80
|
|
Don’t know/Refused
|
18
|
19
|
27
|
23
|
10
|
13
|
Views also continue to tilt negative among women this month – a group that had historically been more evenly split on the law but shifted negative in November. This month, 49 percent of women have an unfavorable view of the ACA and 35 percent have a favorable view. This is similar to the split among men (32 percent favorable, 48 percent unfavorable).
When those with an unfavorable view of the law are asked why they feel this way, the most common responses have to do with concerns about costs (23 percent of those with an unfavorable view), opposition to the law’s individual mandate (18 percent), and concerns about the role of government (13 percent). Smaller shares say they are opposed to the process by which the law was passed or that individuals should have to pay for their own insurance (7 percent each). Two issues that have recently been in the news were each mentioned each by 6 percent as a reason their views are unfavorable: employers cancelling health insurance policies and a sense that the government hasn’t delivered on its promises.
| FIGURE 4: In Their Own Words | ||
|
Among the 48 percent who have an unfavorable view: Could you tell me in your own words what is the main reason you have an unfavorable opinion of the health reform law?
|
||
|
Category
|
Percent mentioning
|
Quotes
|
|
Cost concerns
|
23
|
“I am now paying more for my insurance than I was before.”
“Increased the cost of my health care.”
“The cost to the consumer is more.”
“It’s going to bankrupt the country.”
|
|
Opposed to individual mandate/
Unconstitutional
|
18
|
“Because it does not give me a choice of whether I want it or not.”
“That it shouldn’t be forced upon people.”
“It forcing people to do things they don’t want to do.”
“I believe it is unconstitutional and it takes away from our freedoms as Americans.”
|
|
Concerns about government
|
13
|
“Because the government shouldn’t be involved in our health care.”
“I don’t want the government sticking their nose into my private business.”
“I think it’s an overreach of the federal government.”
“Not a fan of socialized medicine.”
|
|
Opposed to process
|
7
|
“It was poorly thought out it was poorly executed it’s still not working out properly.”
“Poorly thought out and poorly organized.”
|
|
Individuals should pay their own way
|
7
|
“Because it is asking those who work for a living to provide health care for people who take from the government.”
“Because I’m getting tired of paying everybody’s bills.”
“I think everyone should be able to fend for themselves and get what they can afford.”
|
|
Policy cancellations
|
6
|
“Don’t like the idea that some people had to have their health care cancelled, and the idea of them losing their doctors.”
“My existing plan was cancelled and cost for my insurance has more than doubled.”
|
|
Didn’t do what it was supposed to
|
6
|
“I believe we were misled by the president.”
“Because it was supposed to lower prices, but my premium has gone up.”
“Because it’s nothing of what was promised, it’s caused all these people to lose their health care.”
|
Among those with a favorable view of the law, by far the most common reasons given have to do with the fact that the law will expand access to health care and insurance (57 percent). Just under one in ten of those with a favorable view also mention a belief that the law will control or decrease health care costs (9 percent), help people with pre-existing conditions (8 percent), and leave the country better off in general (7 percent).
|
FIGURE 5: In Their Own Words
|
||
|
Among the 34 percent who have a favorable view: Could you tell me in your own words what is the main reason you have a favorable opinion of the health reform law?
|
||
|
Category
|
Percent mentioning
|
Quotes
|
|
Expanding access to care and insurance
|
57
|
“Because it provides health care to a lot of people who wouldn’t have it otherwise.”
“Because health care should be accessible for everybody.”
“I can stay with my parents insurance.”
“It gives our low income families in the country a chance at health care.”
|
|
Will make health care more affordable/control costs/lower costs
|
9
|
“Because for years the rising cost of health care has bankrupted the country. At least we are trying to do something.”
“I believe it’s making health care more affordable.”
“Because there are too many people who don’t have a way of paying for their health care without going bankrupt.”
|
|
Insurance reforms/Will help people with pre-existing conditions
|
8
|
“No cap, and that they can’t hold it against you for having a pre-existing condition.”
“People are not being denied for no reason.”
“It allows people with pre-existing conditions to get health insurance.”
|
|
Country/people will be better off generally
|
7
|
“A lot people have been benefited of the new health care law.”
“I think it will be good in the long run for Americans.”
“It helps people that need help.”
|
The public is divided this month on what it would like to see Congress do next with the law. Just over four in ten (42 percent) want to see the law repealed (including 16 percent who want it replaced with a Republican alternative and 26 percent who want it repealed and not replaced), while a similar share (43 percent) want Congress to expand the law (23 percent) or keep it as is (20 percent). This is a shift from October, when those who wanted to keep or expand the law outnumbered those who wanted to repeal it by a 10-point margin.
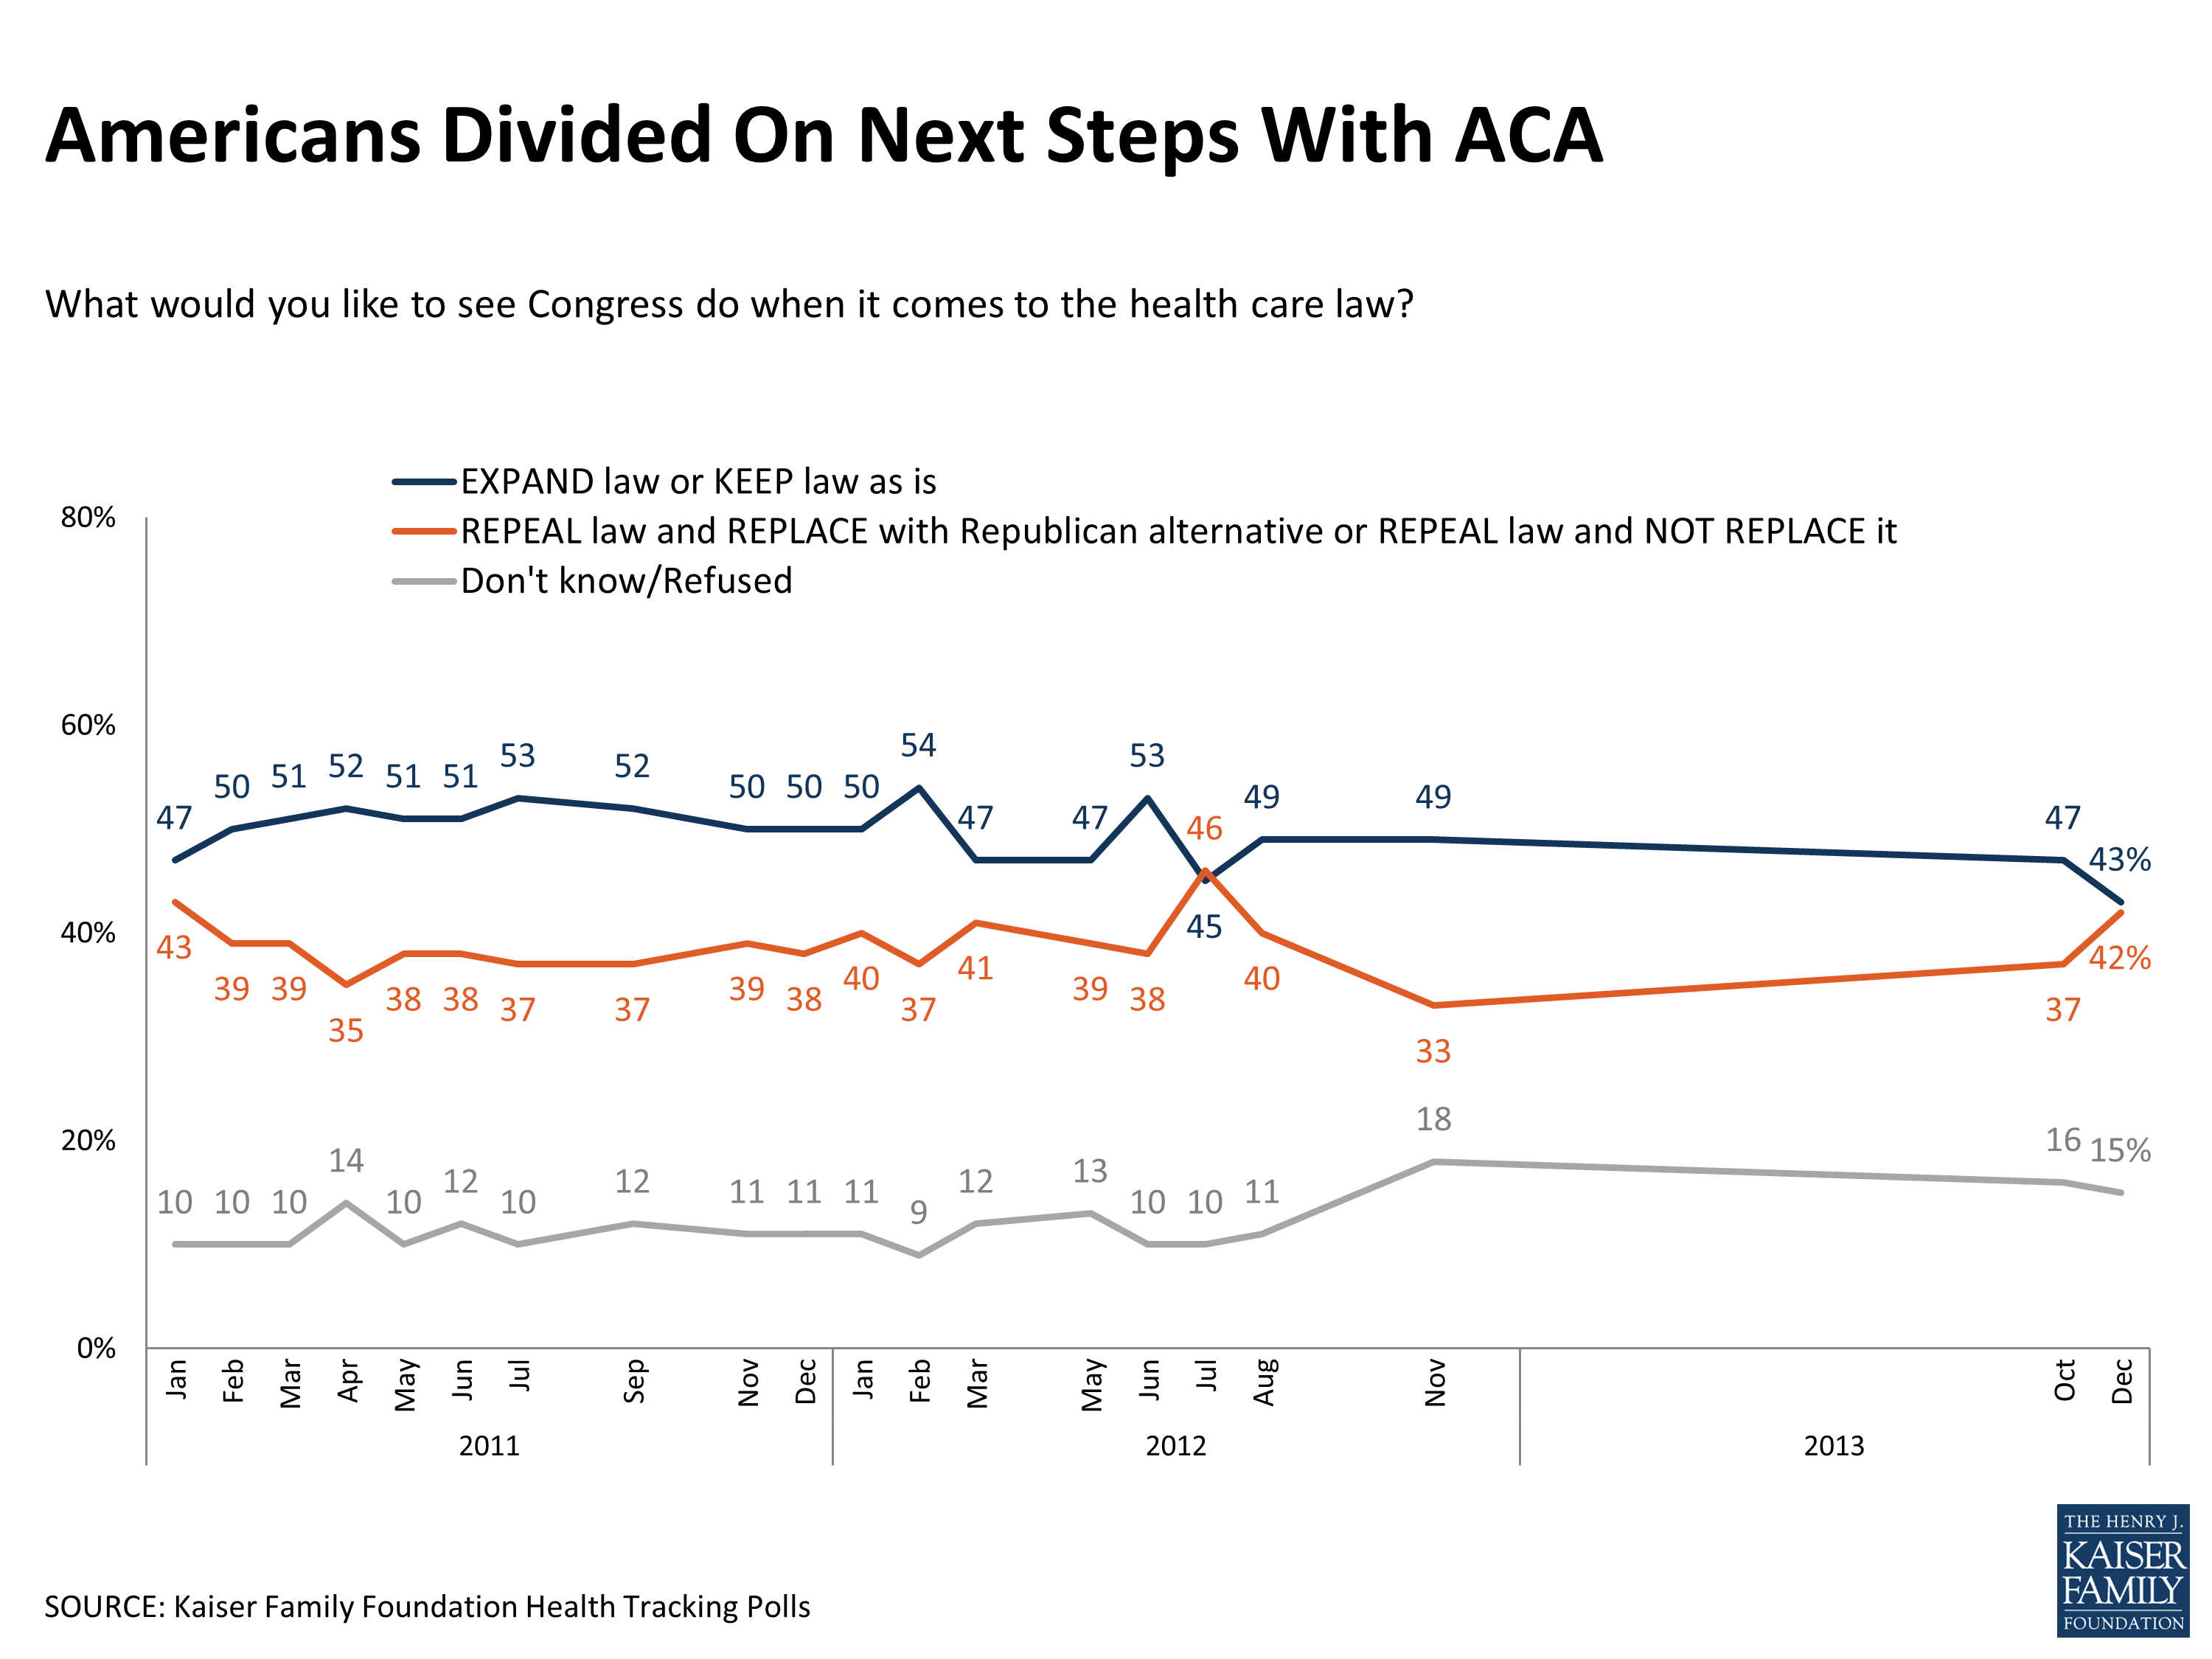
Figure 6
Public More Likely To Attribute Negative Than Positive Consequences To Law
In terms of views of what the law has accomplished so far, Americans are more likely to attribute negative rather than positive consequences to the ACA. Perhaps reflecting the recent focus on policy cancellations in the non-group market, six in ten believe the law has caused many people to lose their health coverage (61 percent), and a similar share believe it has increased the federal budget deficit (57 percent). These beliefs reflect deeper divisions on the law, as Republicans and those with an unfavorable view of the law are much more likely to attribute these consequences to the ACA than are Democrats and those with a favorable view.
When it comes to positive consequences, about half think the law has allowed many young adults to obtain coverage (48 percent), and a similar share believe the law has already reduced the number of people who are uninsured (45 percent). The public is less likely to think the law has lowered prescription drug costs for seniors (29 percent say the law has done this, including 22 percent of seniors), eliminated cost-sharing for preventive services (29 percent), helped slow down the rate of increase in health care costs (28 percent), and provided refunds for consumers whose health plans spent too much on administrative costs (21 percent). Democrats are more likely than Republicans and independents to attribute these positive consequences to the law, but still more than half of Democrats say the law has not done each of these four things or they are not sure if it has.
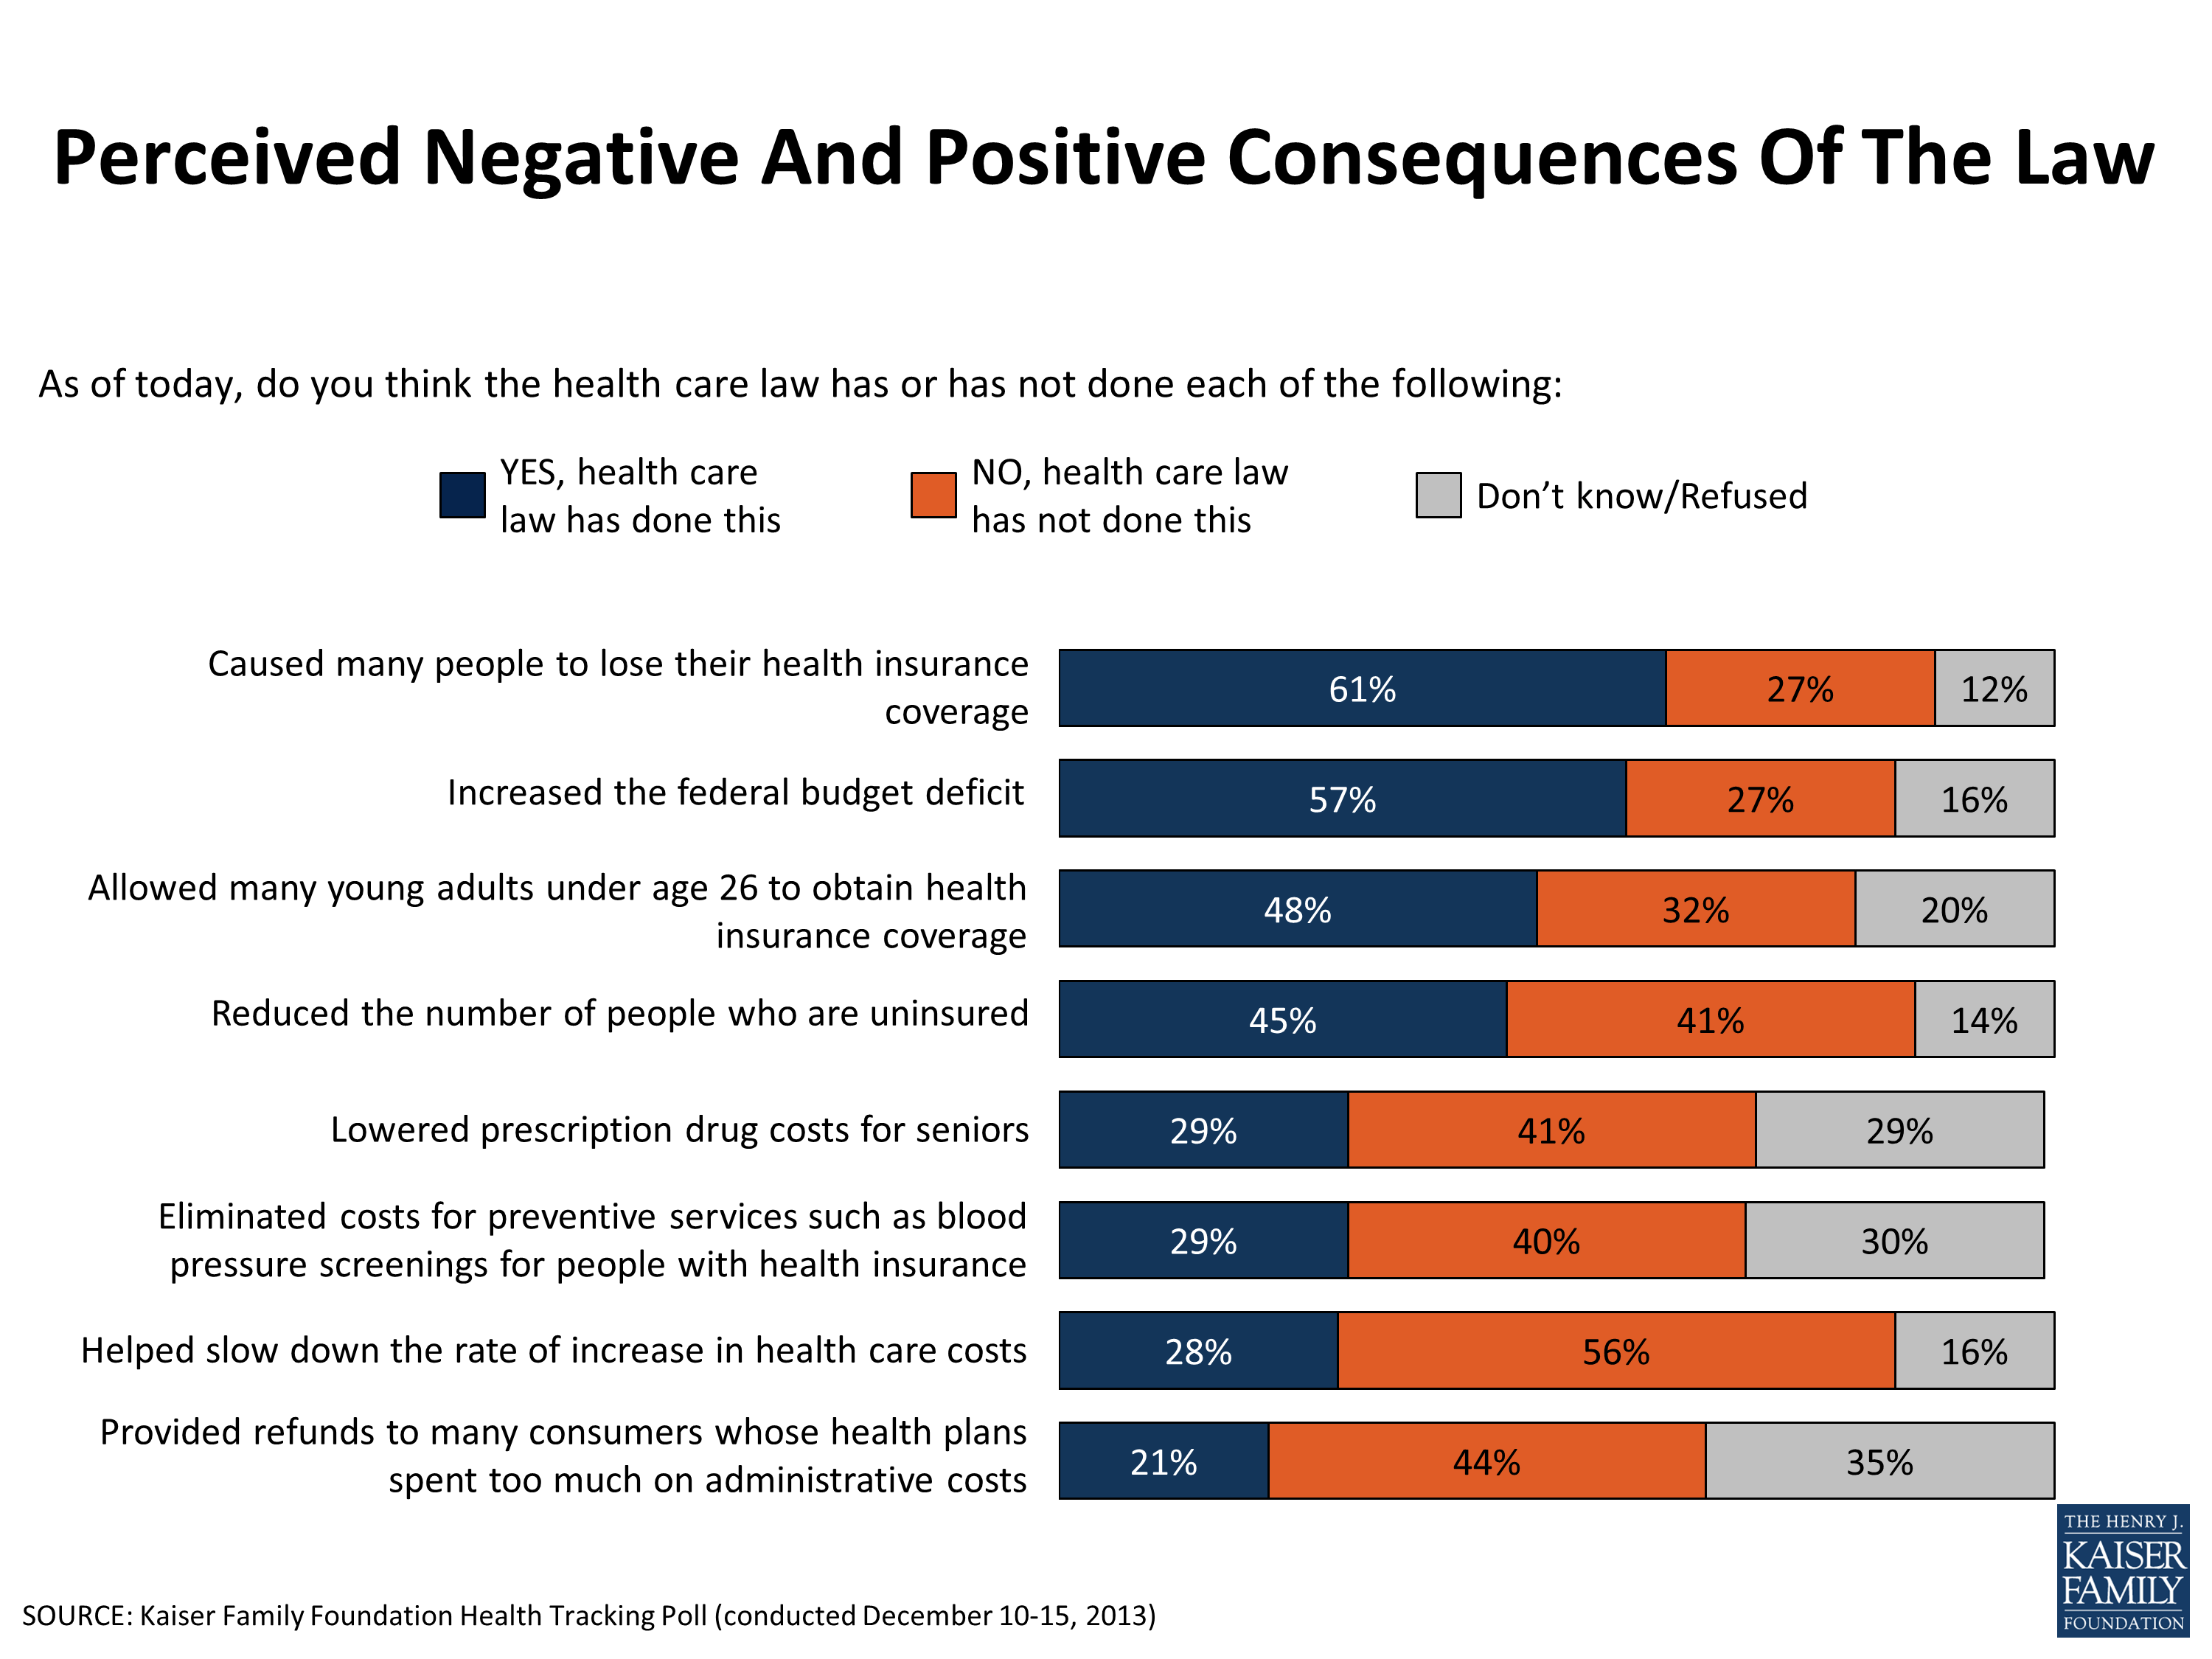
Figure 7
Largest Share Continue To Expect No Personal Impact
On a personal level, the share of the public saying they expect the law won’t make much difference for their own families reached a new high in Kaiser tracking this month. Nearly half (47 percent) now say they don’t expect the law to impact them, up from 41 percent last month. As to whether they’ve already been impacted, nearly two-thirds (64 percent) say they haven’t been helped or hurt by the law so far, while about a quarter say they’ve been negatively affected and one in nine say they’ve benefited from the law.
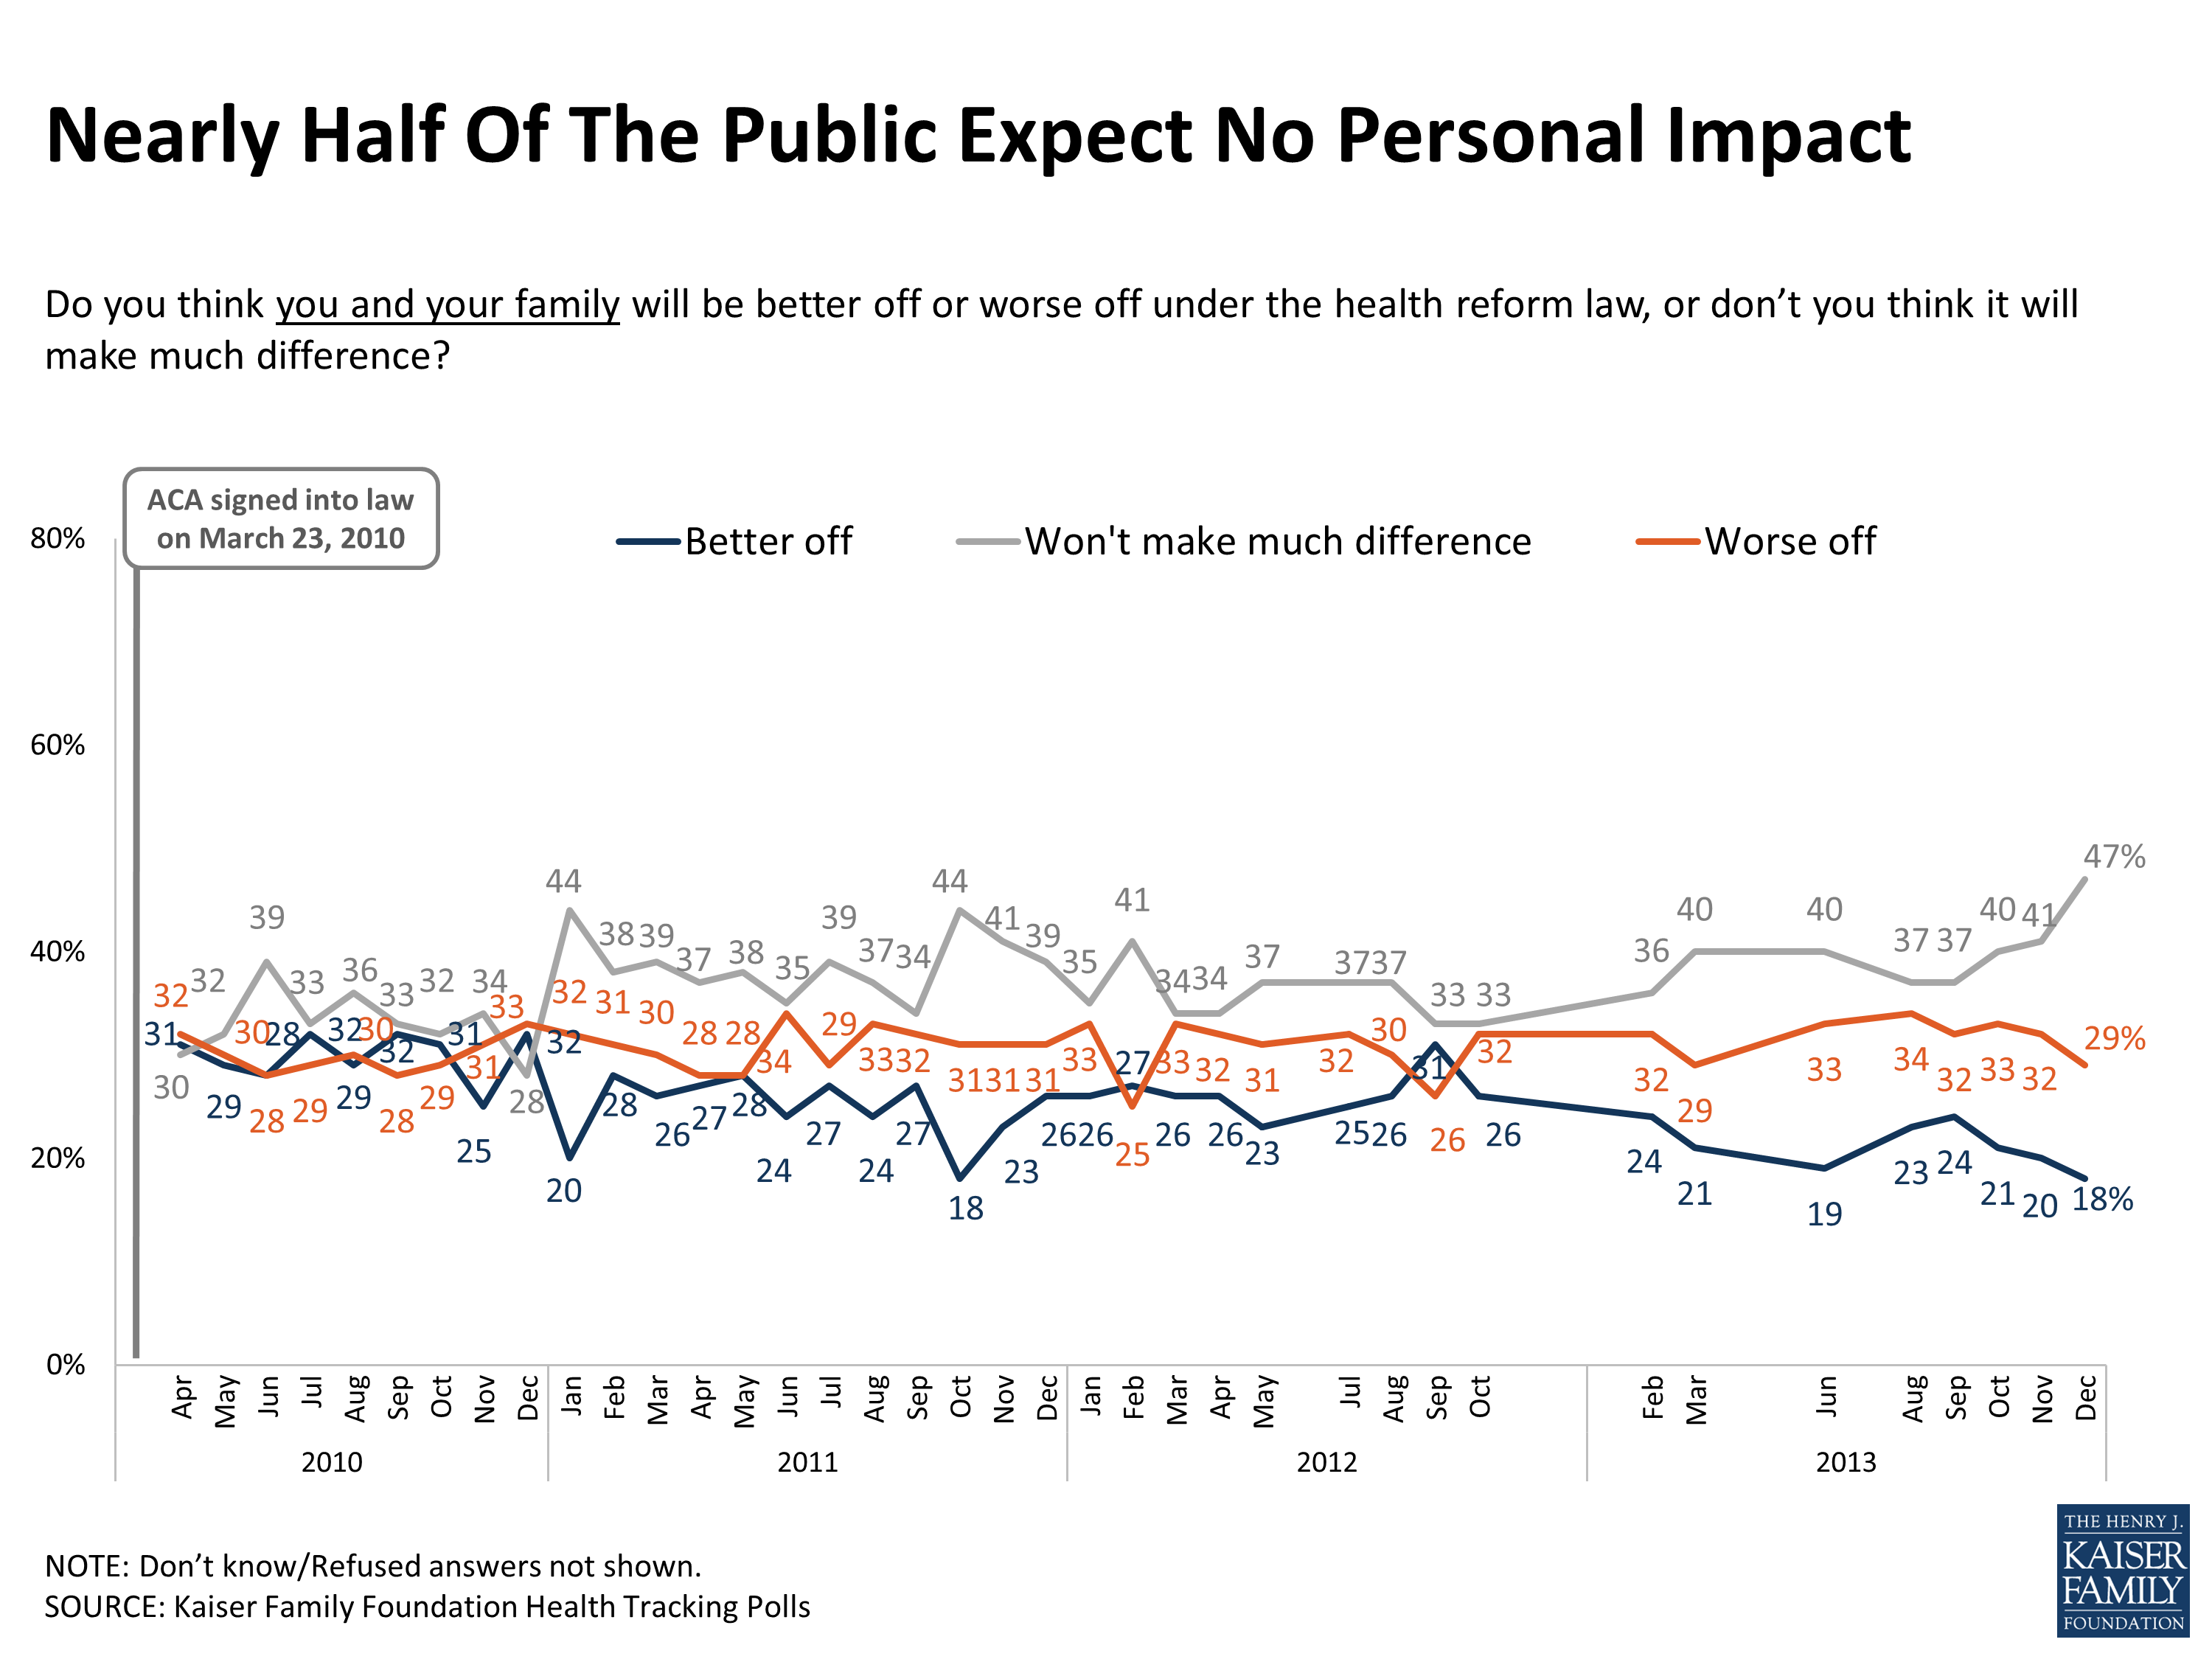
Figure 8
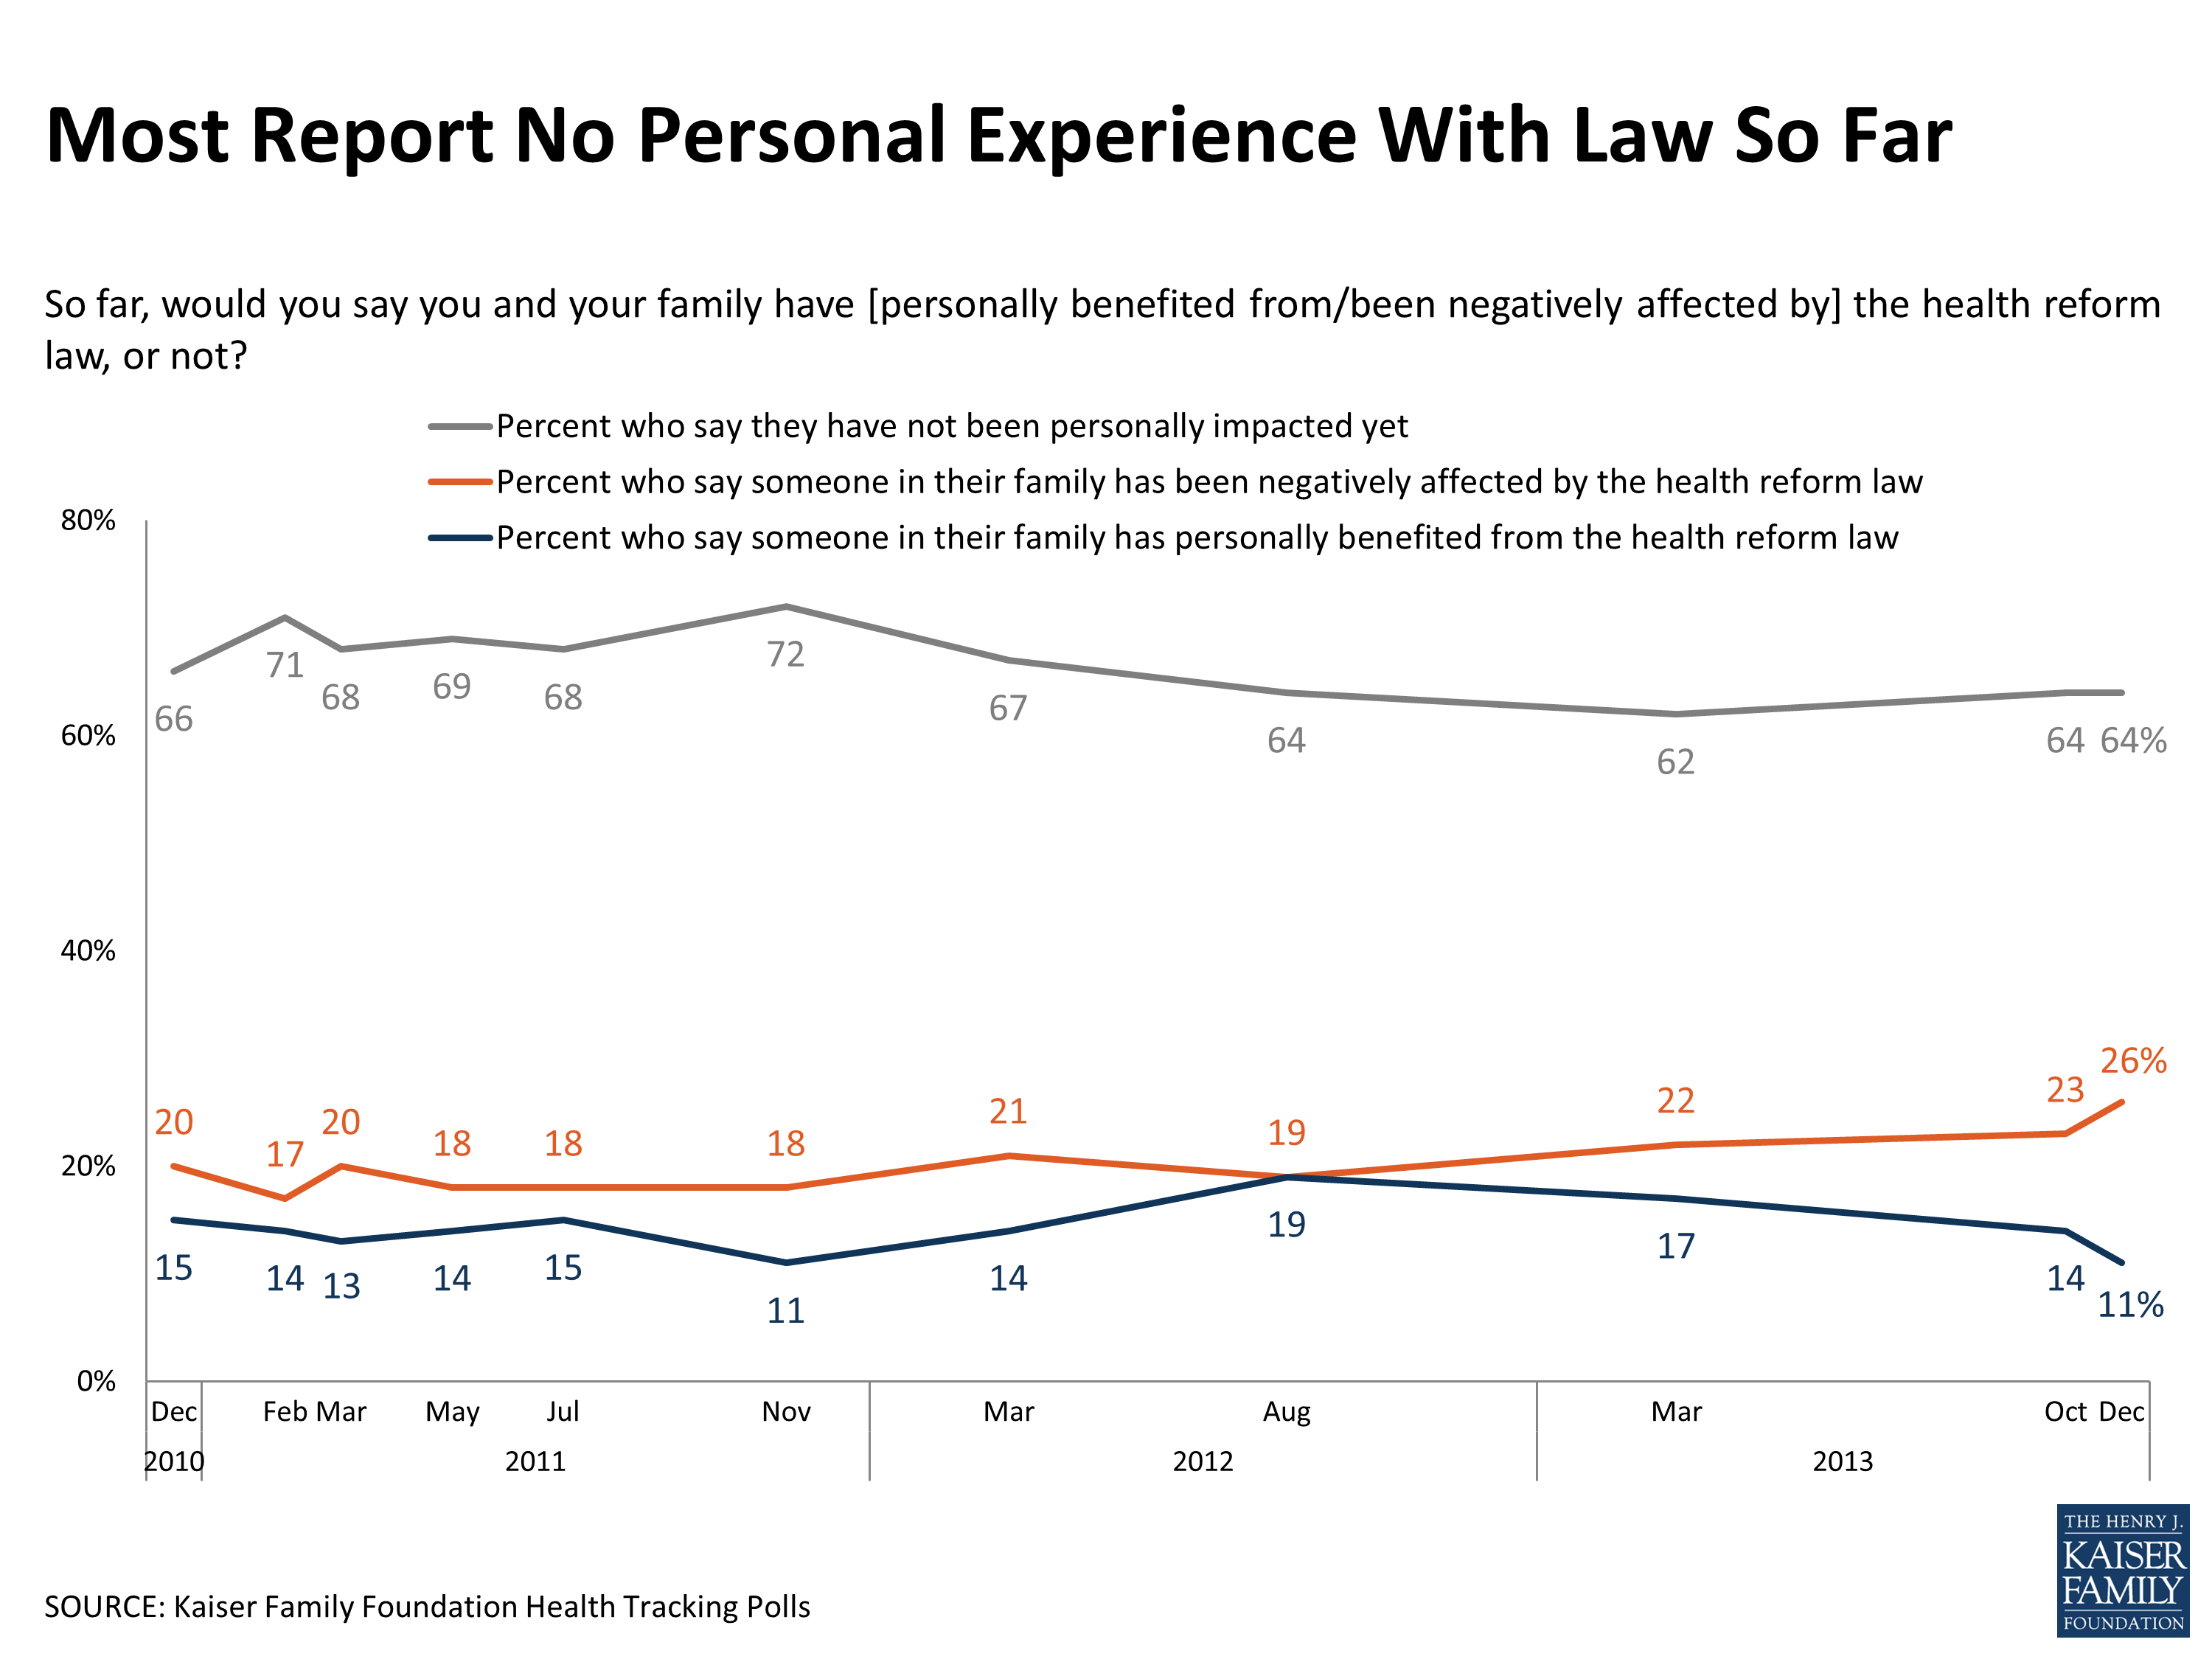
Figure 9
Among those who say they’ve been negatively affected by the law, most (59 percent) point to concerns about health care costs as the specific way in which the law has hurt them. Just over one in ten mention cuts in benefits or scaled-back choices (13 percent), while ten percent mention coverage cancellations (either that they or someone they know has had their coverage cancelled, or that they fear their coverage will be cancelled because of the law). Among those who feel they’ve been helped by the law, nearly half (47 percent) mention expanded access to health care or benefits, while a quarter (25 percent) point to lower health care costs and 12 percent mention the extension of dependent coverage to adults under age 26.
Some Progress Perceived In Fixing Website Problems, But Government Still Gets Poor Ratings For Implementation
Attention to news about the ACA rollout continues to be high in December, with about six in ten saying they followed these news stories very (21 percent) or fairly closely (38 percent). The share saying they closely followed news about the ACA rollout is somewhat lower than the share paying as much attention to reports about the U.S. economy (67 percent), and about equivalent to the share that reports following news about the death of Nelson Mandela (62 percent). Just over half the public continues to say that news coverage of the law is mainly about politics and controversies, while 7 percent say it’s mostly about how the law will impact people and a third say it’s a balance of the two. The plurality (40 percent) say news coverage is mostly unbiased, but twice as many say coverage is biased against (34 percent) as biased in favor of the law (17 percent).
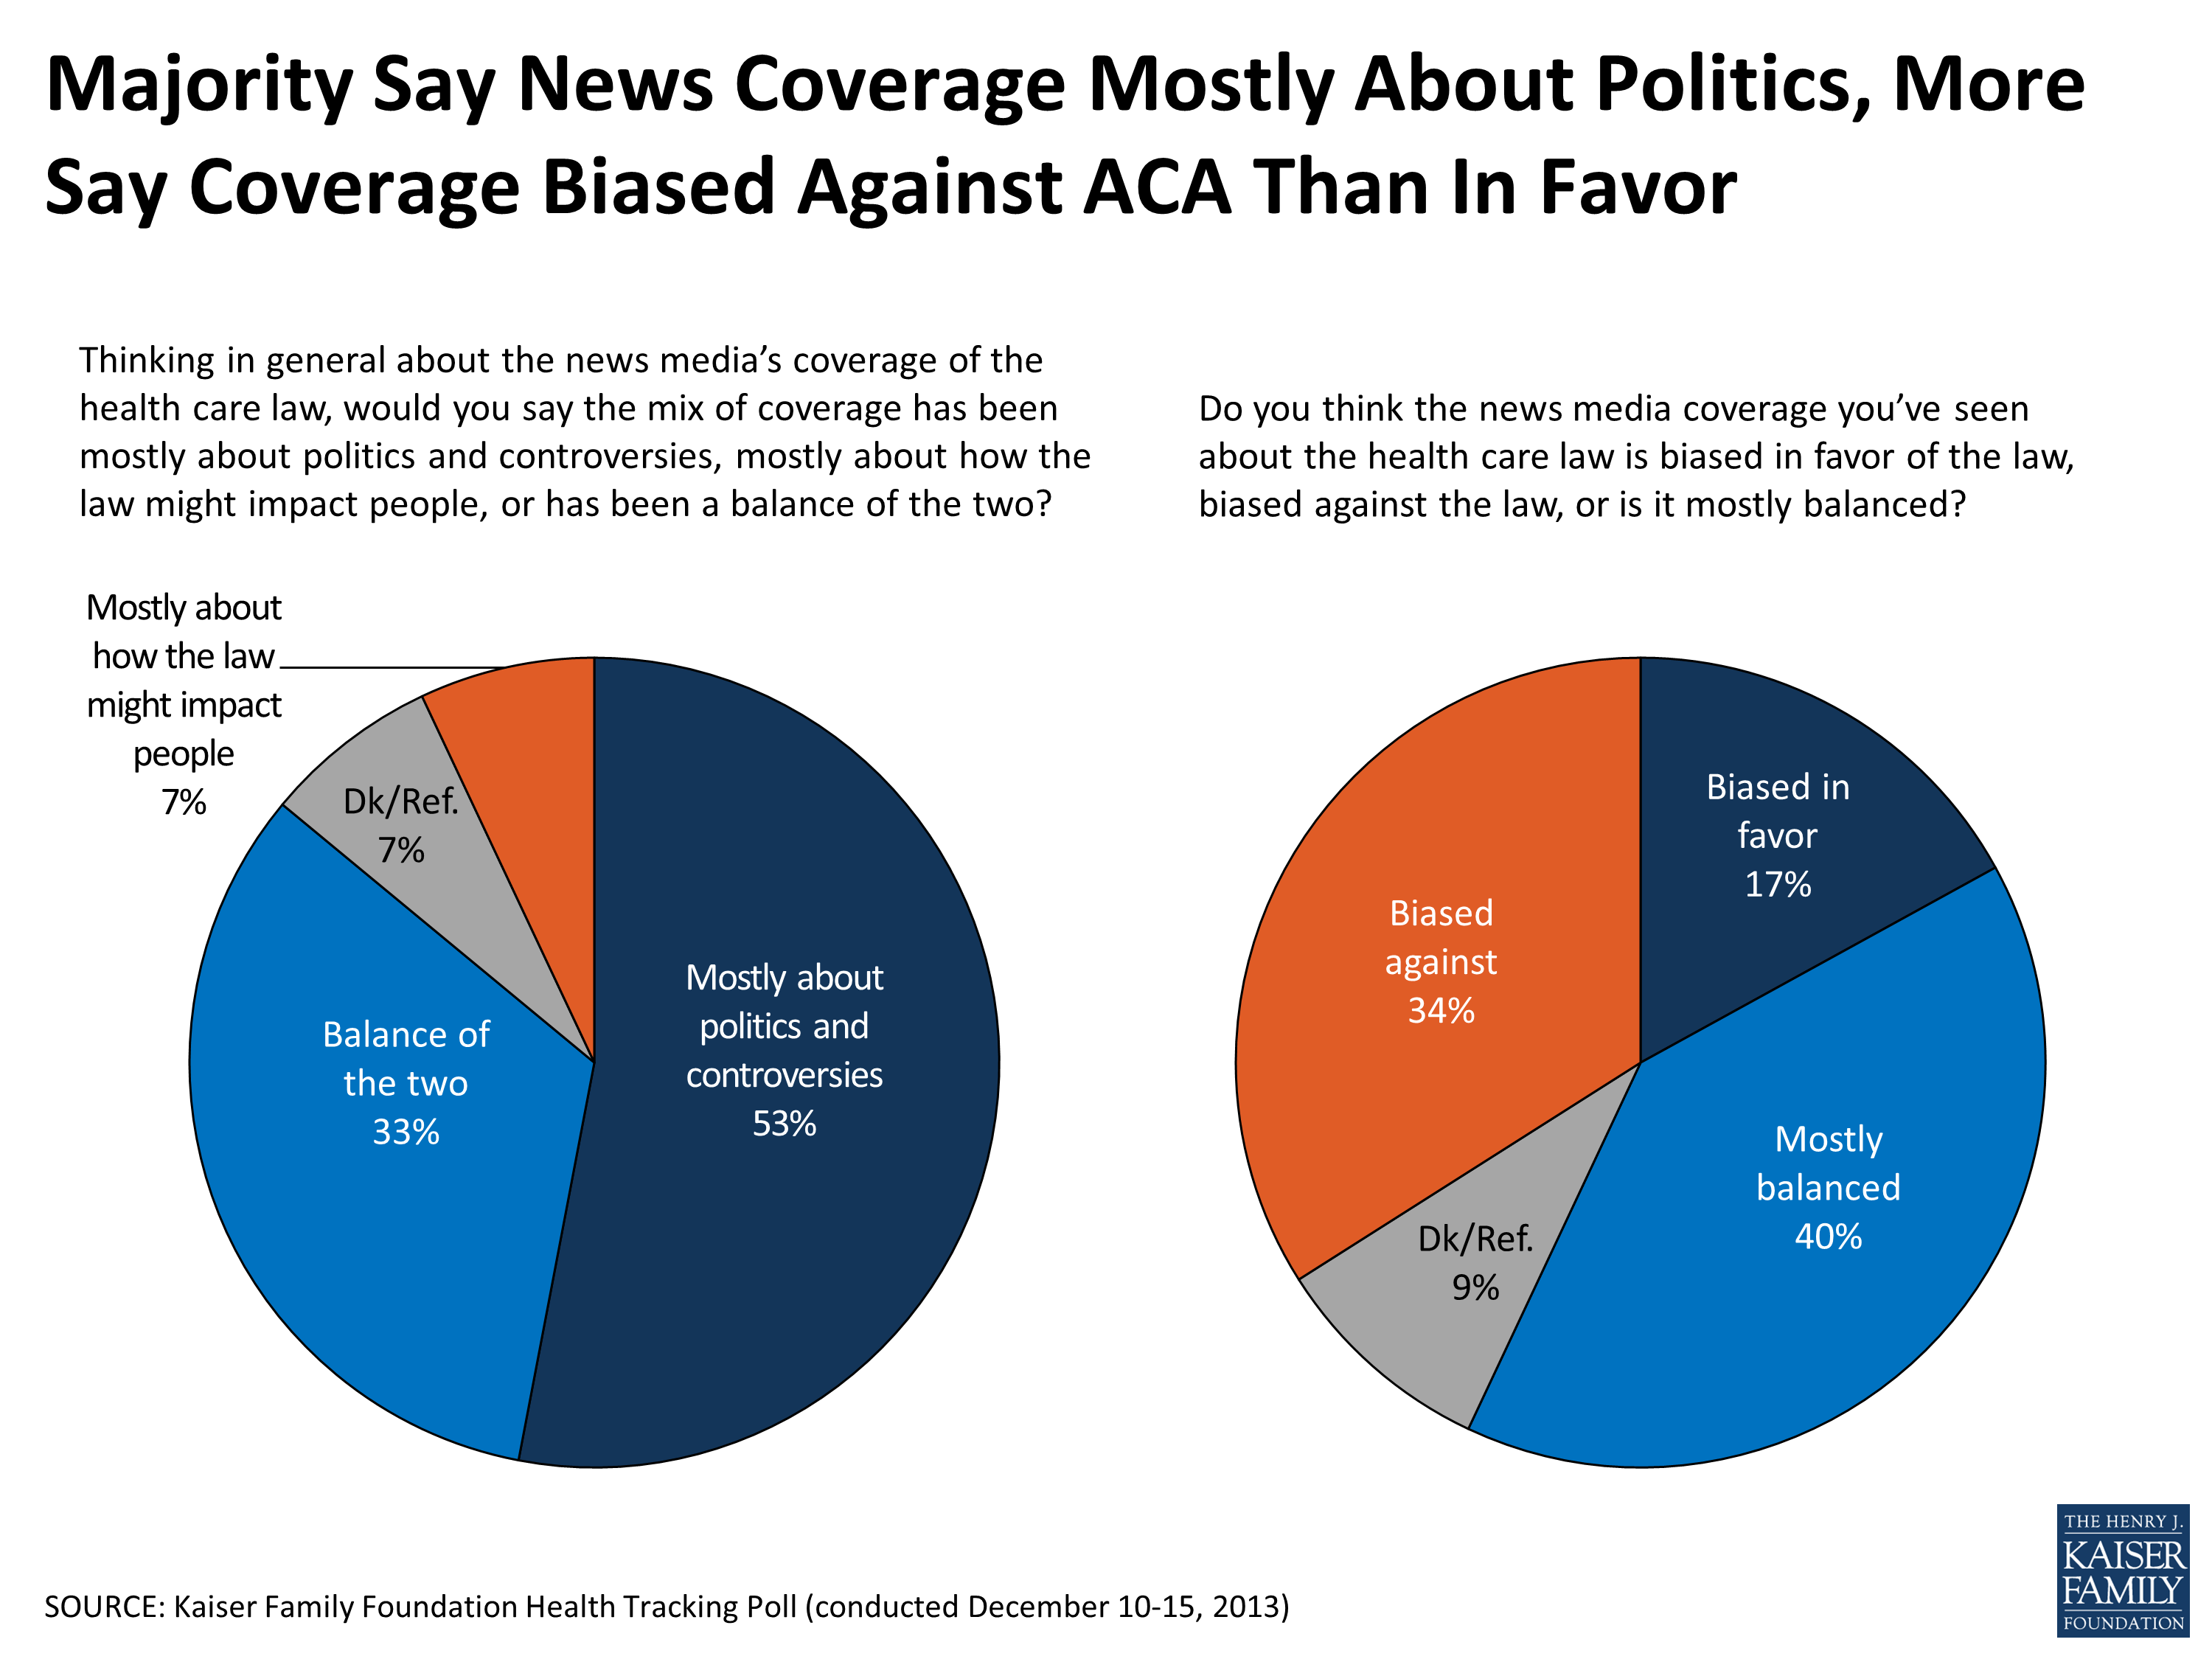
Figure 10
One of the main ACA stories in the news this month has been the ongoing government efforts to fix the website problems with the online health insurance marketplace, Healthcare.Gov. Half the public believes the federal government has made “a lot” (11 percent) or “some” progress (39 percent) in fixing these problems, while four in ten say there has been “not much” progress (26 percent) or “no progress at all” (15 percent).
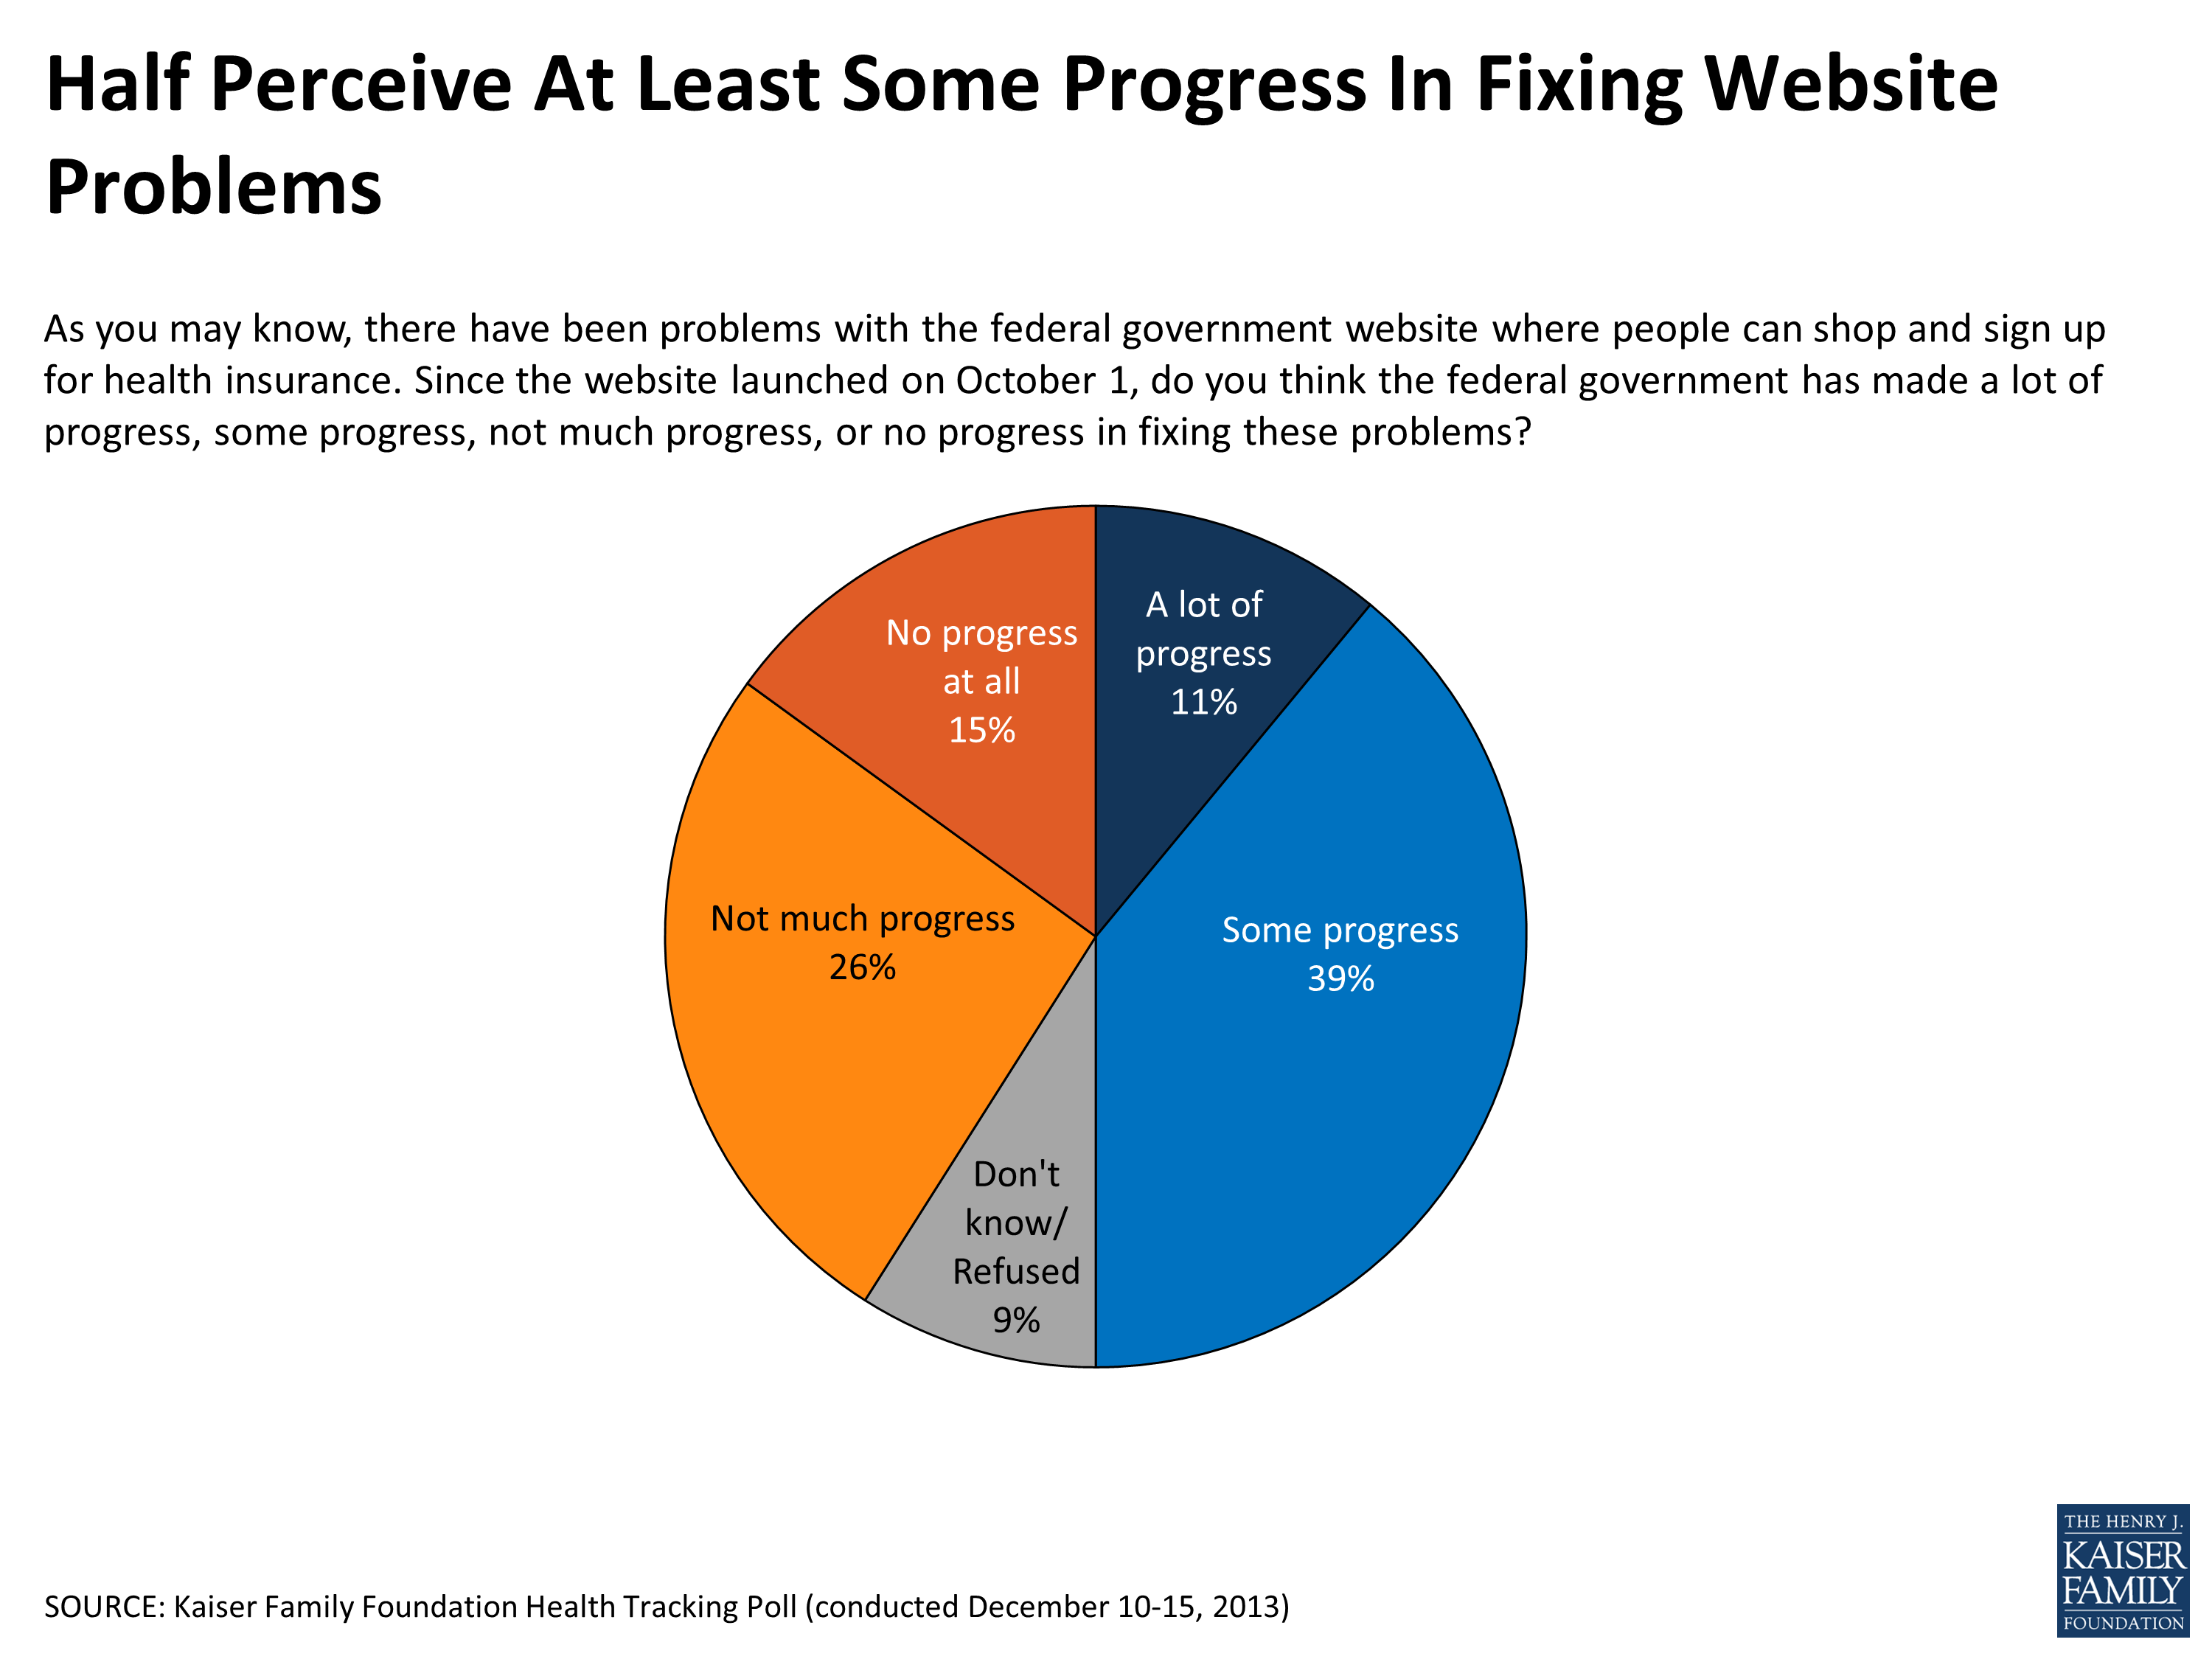
Figure 11
Despite perceiving at least some progress on this front, the public continues to give the federal government very low ratings for implementing the law – eight in ten say they’re doing an “only fair” (31 percent) or “poor” job (50 percent), while just 15 percent rate it as “excellent” or “good,” similar to October’s ratings.
The public gives their state governments somewhat higher ratings than the federal government when it comes to implementing the law, though still more than six in ten think their state is doing an “only fair” or “poor” job. Residents of states that are operating their own health insurance marketplaces are about twice as likely as those in states defaulting to the federal marketplace to give their state government a positive rating for implementation (33 percent versus 17 percent), but even in these states the majority say the state is doing an “only fair” or “poor” job.
|
FIGURE 12: Federal Government Gets Poor Ratings for Implementation, States Only Slightly Setter
|
||||
| Regardless of whether you support or oppose the health care law, how good a job would you say the FEDERAL GOVERNMENT is doing implementing the law? | Regardless of whether you support or oppose the health care law, how good a job would you say your STATE GOVERNMENT is doing implementing the law? | |||
|
Total public
|
Total public
|
Among those in states operating their own marketplace
|
Among those in states defaulting to the federal marketplace*
|
|
|
NET Excellent/Good
|
15
|
23
|
33
|
17
|
|
Excellent
|
3
|
4
|
6
|
2
|
|
Good
|
12
|
19
|
27
|
15
|
|
NET Only fair/Poor
|
81
|
63
|
55
|
68
|
|
Only fair
|
31
|
34
|
33
|
35
|
|
Poor
|
50
|
29
|
22
|
33
|
|
Don’t know/Refused
|
4
|
14
|
13
|
15
|
|
*includes those states with a state-federal partnership exchange
|
||||
A Spotlight On The Uninsured
With new coverage for some individuals set to begin in a few weeks, more than half (54 percent) of the non-elderly uninsured continue to say they don’t have enough information about the ACA to know how the law will impact them, and seven in ten (69 percent) say they’ve heard only a little or nothing about the new health insurance marketplace. This month, 15 percent of the uninsured say they’ve been personally contacted by someone about the law through a phone call, email, text message, or door-to-door visit.
The survey also highlights the difficulties those without health insurance continue to experience in accessing and paying for medical care. Roughly half (49 percent) of the uninsured say their family has had problems paying medical bills in the last year, about twice as many as adults under age 65 with health insurance (26 percent). And 44 percent of the uninsured say they’ve had trouble getting medical care, four times the rate reported by those with insurance (11 percent). The uninsured also report other financial struggles at higher rates, including taking on a second job or extra hours at work and having difficulty paying housing costs.
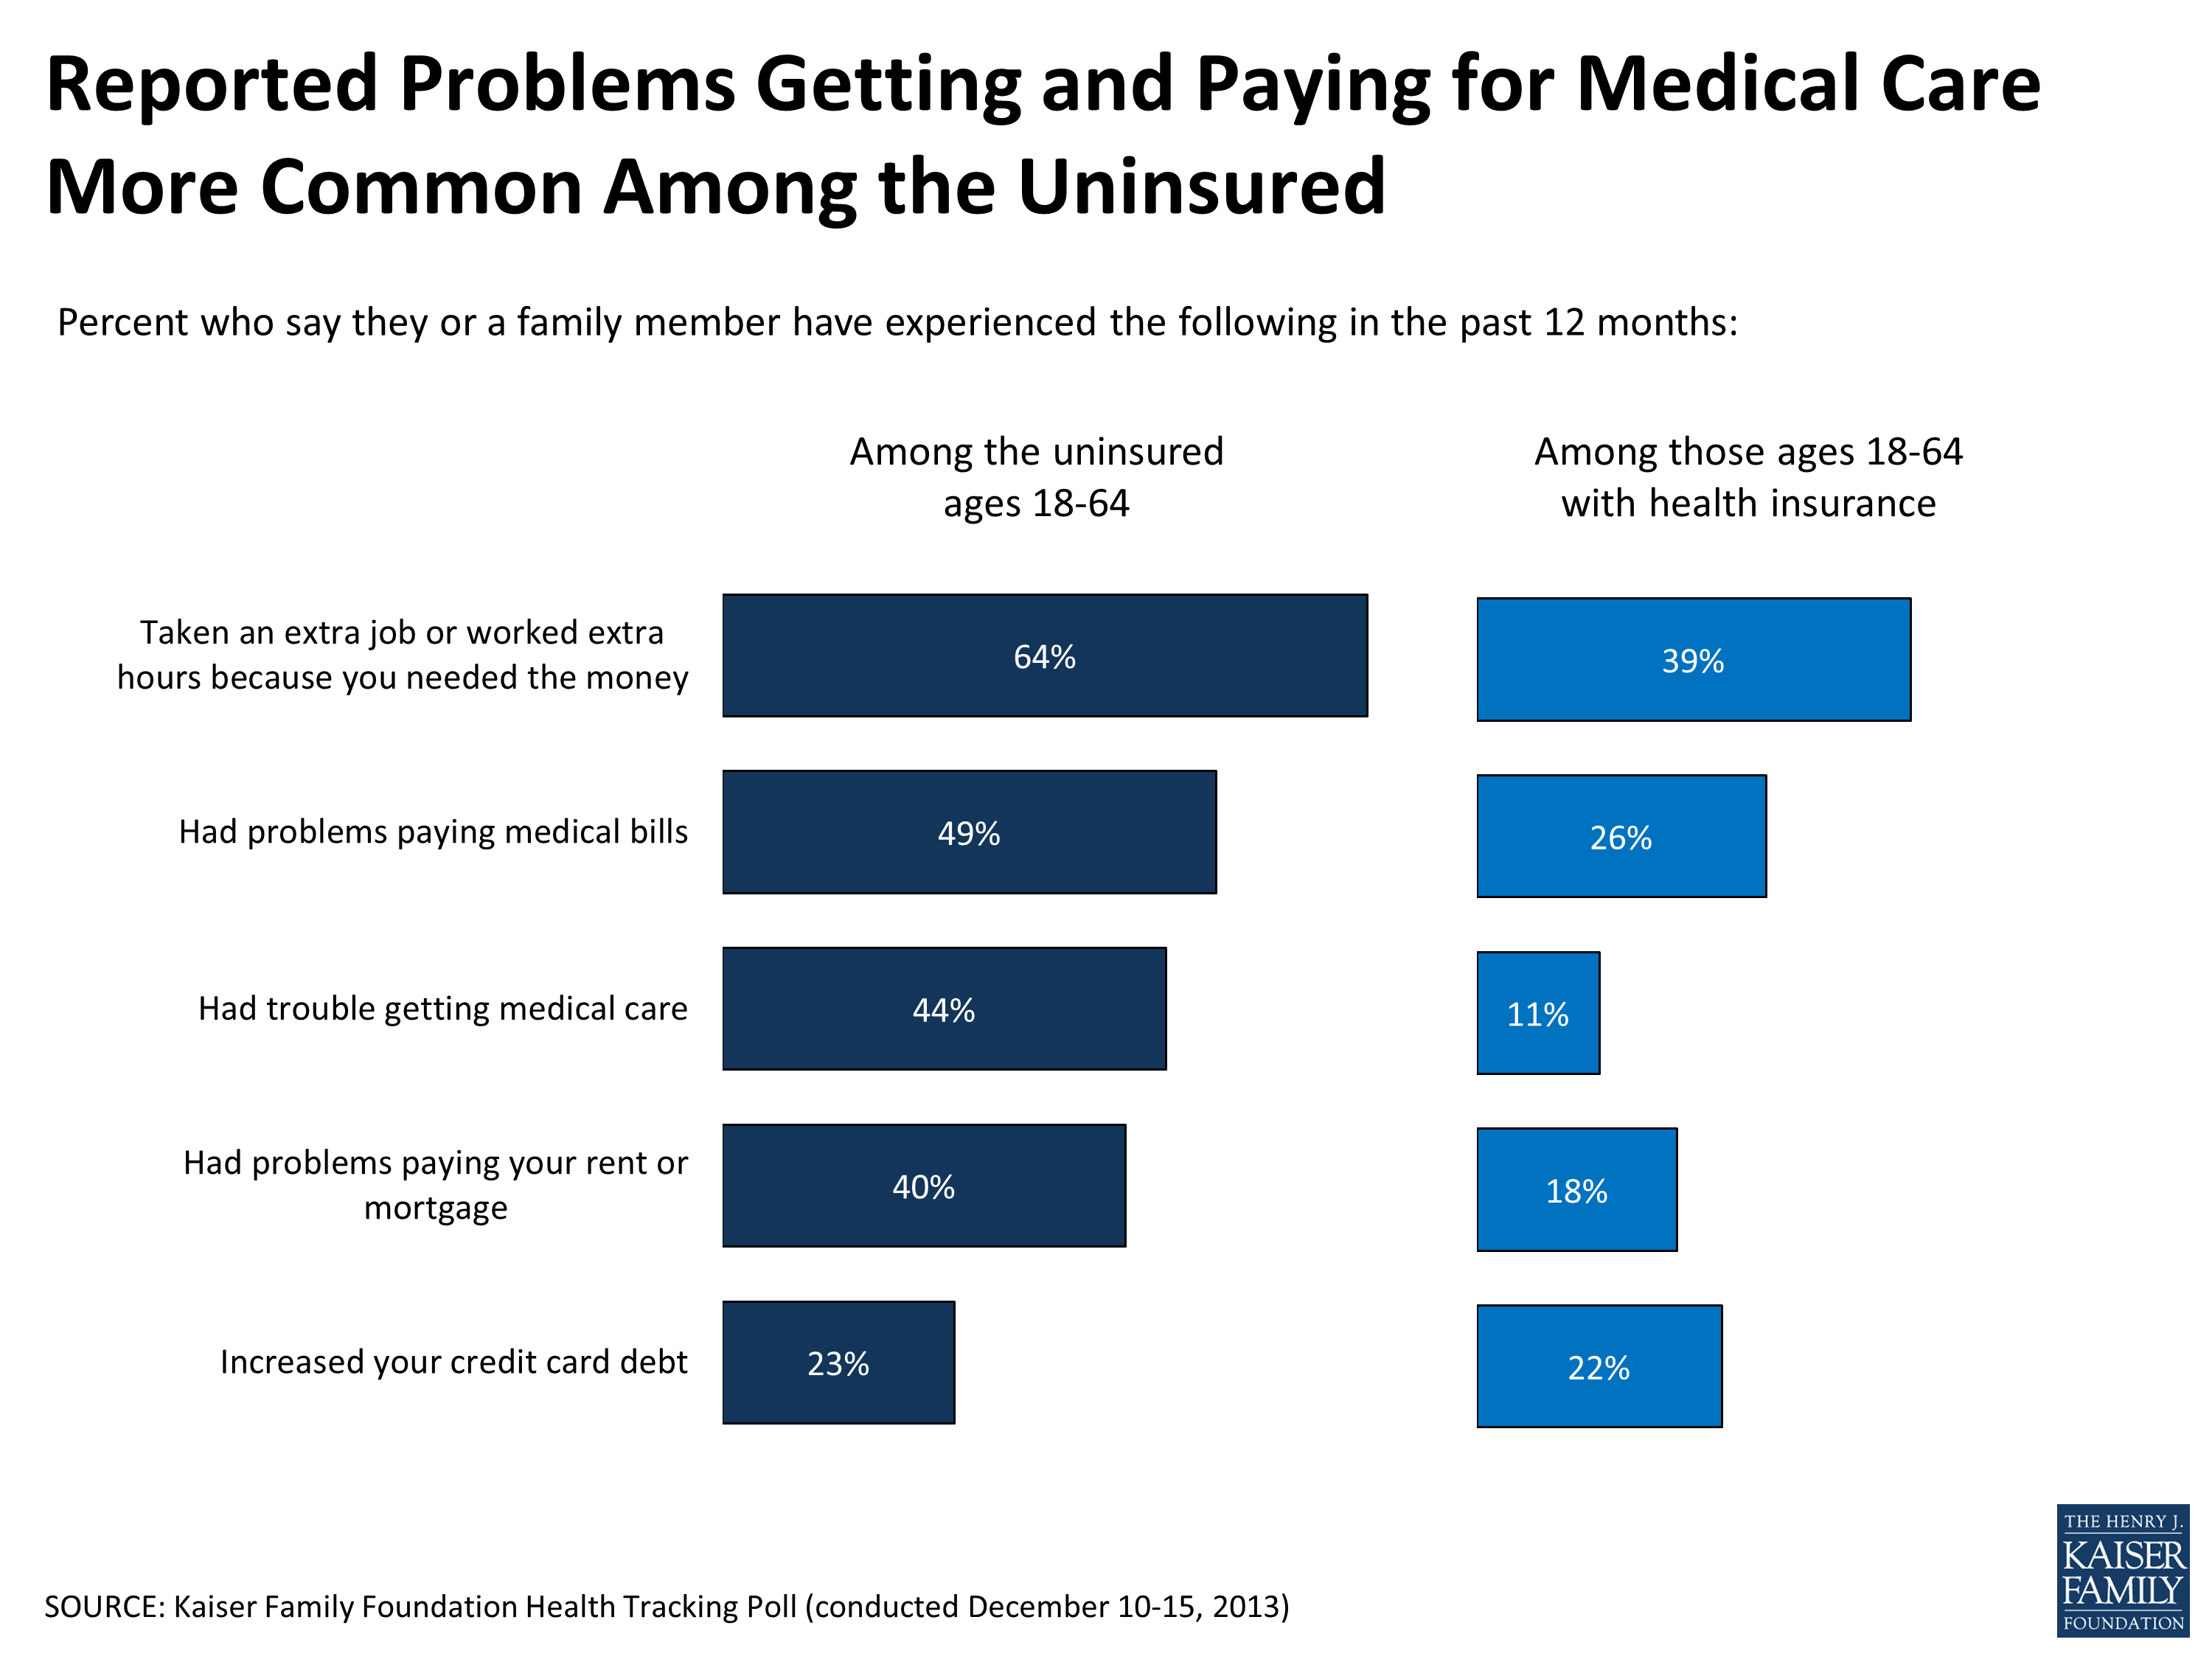
Figure 13
The uninsured are also less likely than those with insurance to say their health needs are being met “very well.” This is true when it comes to both their physical health needs (31 percent of the uninsured versus 61 percent of the insured under age 65) and their mental or emotional health needs (42 percent versus 64 percent).