Income and Assets of Medicare Beneficiaries, 2014 – 2030
Introduction
Many Medicare beneficiaries, including seniors and younger adults with disabilities, live on fixed incomes supplemented by the savings they accumulated during their working years. Their income and accumulation of savings is tied to many life experiences, including their education, health status, marital status, number of work years, household income, periods of unemployment, investments, years of homeownership, access to employer retirement benefits, inheritance, other financial supports, and various economic factors. As a result, the income and assets of Medicare beneficiaries vary greatly.1 This data brief updates previous work that describes the income and assets of Medicare beneficiaries now, and in the future (2030).2 It incorporates updated projections about the current and future U.S. economy, and the effects of the economic downturn and recovery on current and future beneficiaries’ income, savings, and home equity. This brief provides context for understanding the extent to which the current and future generations of beneficiaries can afford to absorb higher health care costs.
Income of Medicare Beneficiaries
In this analysis, the income of the Medicare population takes into account Social Security, pensions, earnings, and other income sources, including income from assets, rental income, and retirement account (IRA) withdrawals. Income is presented on a per person basis; for married people, income is divided equally between spouses to calculate per capita income. Projected growth in income is adjusted for inflation and all dollar amounts are in 2014 per capita dollars.
In 2014
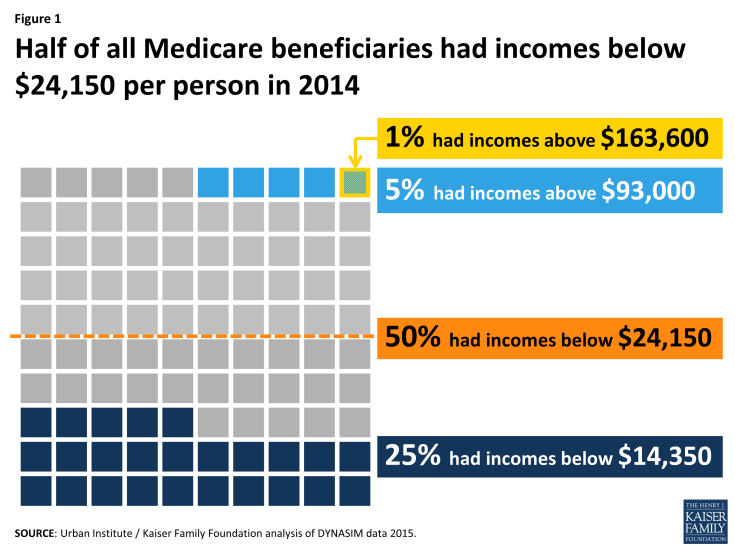
Half of all Medicare beneficiaries had incomes below $24,150 in 2014, but incomes varied substantially among beneficiaries (Figure 1). One-quarter of beneficiaries had incomes below $14,350, while at the other end of the distribution, five percent had incomes exceeding $93,000, including one percent who had incomes exceeding $163,600 in 2014.
Incomes among beneficiaries varied across demographic characteristics (Figure 2). Median per capita income was substantially higher for white beneficiaries ($27,450) than for black beneficiaries ($16,150) or Hispanic beneficiaries ($12,800). Across all ages, median per capita income was lower for beneficiaries under the age of 65 with permanent disabilities ($17,050) than among seniors. Among seniors, median income declines with age. More than half of all beneficiaries ages 85 and older lived on an income of less than $18,850 in 2014. Married individuals had higher median per capita incomes ($28,300 per beneficiary) than divorced, widowed or single beneficiaries ($20,500, $21,800, and $14,450, respectively) in 2014. As might be expected, median income varied by years of education, and was three times higher among beneficiaries with college degrees ($41,500) than among beneficiaries with less than a high school education ($13,850) in 2014 (Table 1).
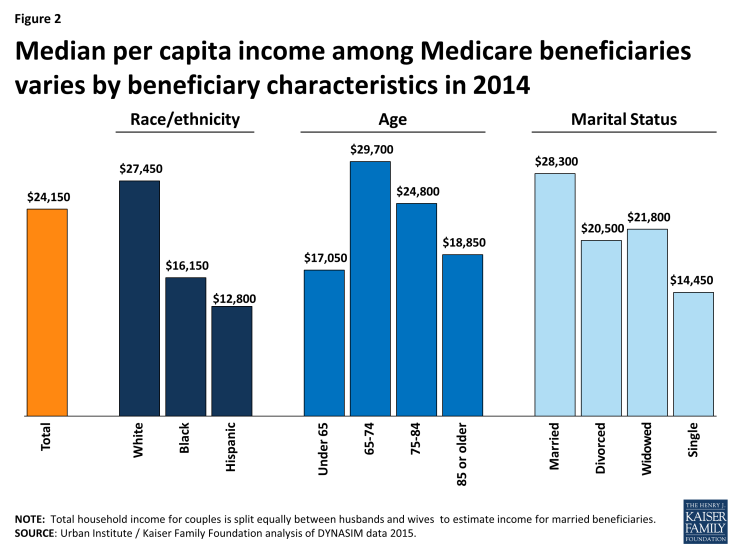
Figure 2: Median per capita income among Medicare beneficiaries varies by beneficiary characteristics in 2014
In 2030
Per capita income among the Medicare population will be moderately higher in 2030 than it is today, after adjusting for inflation; however, much of the growth is projected to be in the upper incomes (Figure 3). Incomes are projected to be 22 percent higher for beneficiaries in the top five percent of the income distribution in 2030 compared to the current generation, an increase of about $20,650 between 2014 and 2030, after adjusting for inflation. In contrast, per capita income for beneficiaries in the bottom quartile of the income distribution are projected to be 13 percent higher in 2030 (an increase of less than $2,000, after adjusting for inflation) and among beneficiaries in the middle of the income distribution, incomes are projected to be just 18 percent ($4,300) higher in 2030 than in 2014, after adjusting for inflation. In 2030, twenty-five percent of beneficiaries are projected to have incomes below $16,200 and about half will have incomes below $28,450. Ten percent of beneficiaries are projected to have incomes above $84,600 and five percent are projected to have incomes above $113,650 in 2030, after adjusting for inflation.
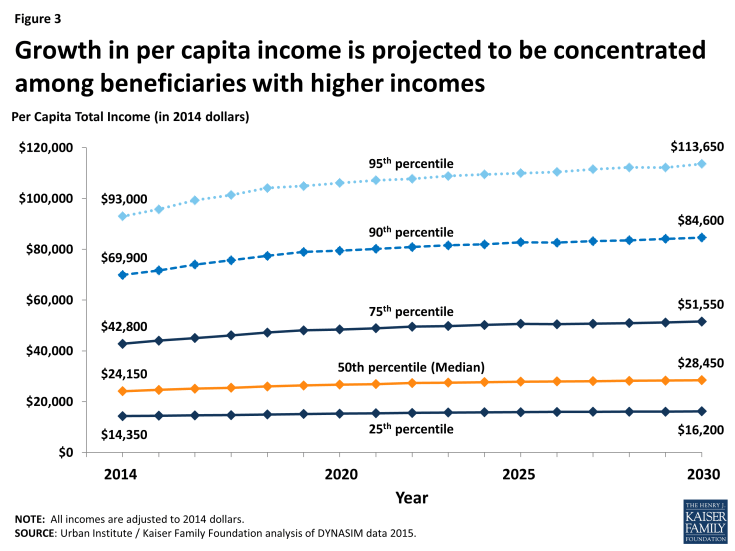
Figure 3: Growth in per capita income is projected to be concentrated among beneficiaries with higher incomes
Savings of Medicare Beneficiaries
In this analysis, the total savings of the Medicare population includes retirement account holdings (such as IRAs or 401Ks) and other financial assets, including savings accounts, bonds and stocks. Savings are presented on a per person basis; for married people, savings are divided equally between spouses to calculate per capita savings. Projected growth in savings is adjusted for inflation and all dollar amounts are in 2014 dollars.
In 2014
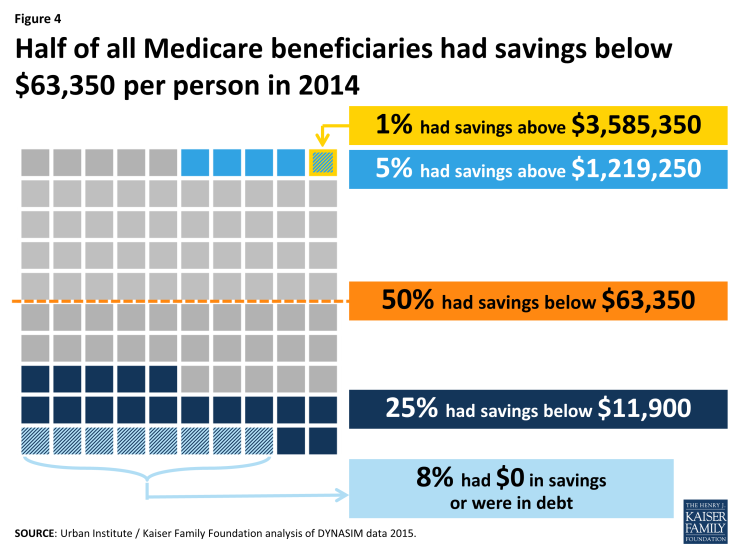
In 2014, nearly all beneficiaries (92%) had some savings, but eight percent had no savings or were in debt (i.e., negative savings), with median debt of $850. Half of all beneficiaries had savings below $63,350, with substantial variation in savings across beneficiaries (Figure 4). One-quarter of beneficiaries had savings below $11,900, including beneficiaries who had no savings or were in debt. At the other end of the distribution, five percent had more than $1.2 million in savings, including one percent who had more than $3.5 million in savings in 2014.
Like income, savings among beneficiaries varied greatly across demographic characteristics (Figure 5). While nearly all beneficiaries (92%) had some savings, rates of savings were lower among some groups, particularly black beneficiaries (80%), Hispanic beneficiaries (76%), beneficiaries under the age of 65 with disabilities (87%), and beneficiaries who were divorced or single (88% and 79%, respectively). Median per capita savings among white beneficiaries ($91,950) was more than seven times higher than median per capita savings among black beneficiaries ($12,350) or Hispanic beneficiaries ($9,800). Median per capita savings among beneficiaries under the age of 65 and disabled ($29,500) was lower than for seniors of any age group; among seniors, those ages 85 and older had relatively low savings, with more than half having less than $30,700 in savings in 2014. Median savings also differed by marital status and was higher among married beneficiaries ($86,150) than among divorced, widowed, or single beneficiaries ($44,950, $51,250, and $20,950, respectively).
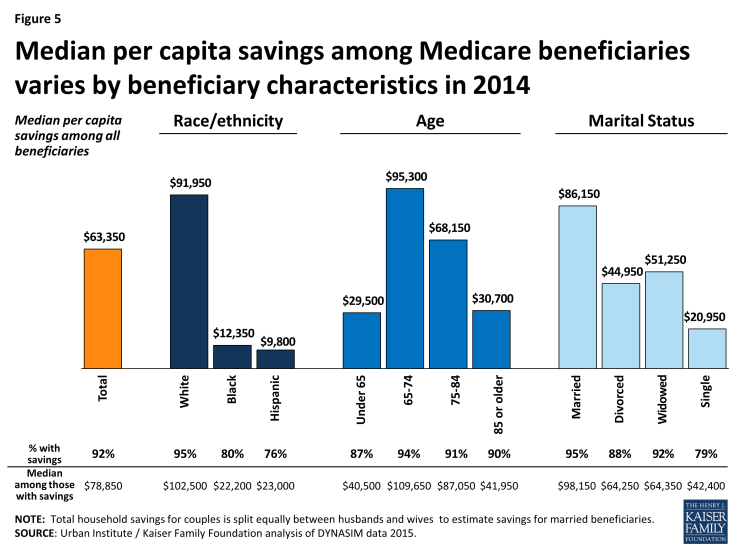
Figure 5: Median per capita savings among Medicare beneficiaries varies by beneficiary characteristics in 2014
Median per capita savings was higher among beneficiaries with more years of education; the median savings of college-educated beneficiaries ($226,200) was nearly 22-times higher than the median savings among beneficiaries with less than a high-school education ($10,300; Table 1).
In 2030
Median savings among the Medicare population in 2030 is projected to be somewhat higher than among the current generation of beneficiaries, after adjusting for inflation, with much of the growth in savings expected to be realized among a relatively small share of beneficiaries (Figure 6). Among beneficiaries in the top five percent of the savings distribution, savings are projected to be 29% greater (approximately $351,000) for the next generation of beneficiaries, compared to the current generation of beneficiaries, after adjusting for inflation. In contrast, among beneficiaries in the middle of the savings distribution, savings are projected to be nearly $39,500 higher in 2030 than in 2014, after adjusting for inflation. This difference points to a widening gap in savings between beneficiaries in the top five percent and middle of the distribution. In 2030, twenty-five percent of beneficiaries are projected to have savings below $23,900, including 8 percent of beneficiaries who are projected to have no savings or be in debt, and about half are projected to have savings below $102,800 in 2030. At the other end of the spectrum, ten percent of beneficiaries are projected to have savings above $921,750 and five percent are projected to have savings above $1.5 million in 2030, after adjusting for inflation.
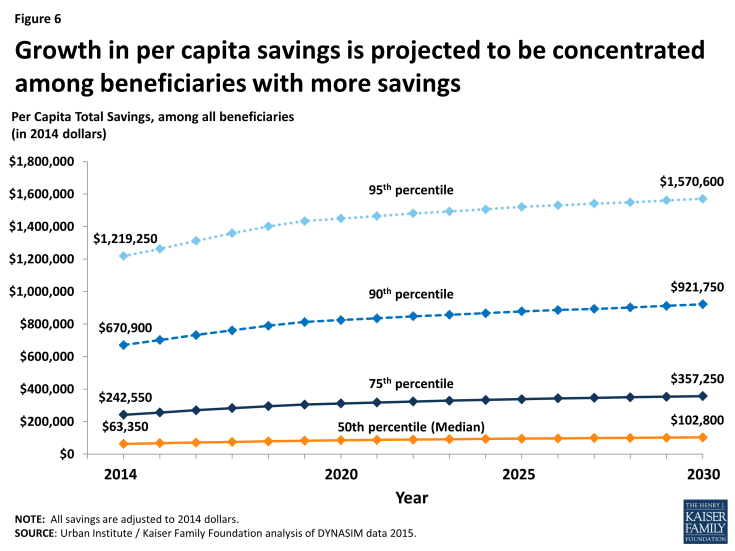
Figure 6: Growth in per capita savings is projected to be concentrated among beneficiaries with more savings
Home Equity of Medicare Beneficiaries
As with income and savings, home equity values are divided equally between spouses to calculate per capita home equity. Projected growth in home equity values is adjusted for inflation and all dollar amounts are in 2014 per capita dollars. The home equity values shown account for any decrease in home equity values that occurred as a result of the mortgage crisis; it has been estimated that more than 1.5 million Americans over age 50 lost their homes between 2007 and 2011.3
In 2014
Most Medicare beneficiaries (76%) had some home equity in 2014, with substantial variation in the value of their home equity. Half of all beneficiaries had less than $65,500, and one-quarter had less than $5,200 in home equity, including 24 percent who had no home equity at all in 2014 (Figure 7). At the other end of the distribution, five percent had more than $418,400 in home equity, including one percent who had more than $773,550 in home equity in 2014.
The share of beneficiaries with home equity, and the value of home equity, differed across demographic characteristics in 2014 (Figure 8). Rates of home equity were lower among single beneficiaries (30%) and divorced beneficiaries (57%) than among married or widowed beneficiaries (86% and 83%, respectively). Home equity rates were also lower among Hispanic and black beneficiaries (52% and 57%, respectively) than whites (82%), and lower among beneficiaries under the age of 65 with disabilities (57%) in 2014.
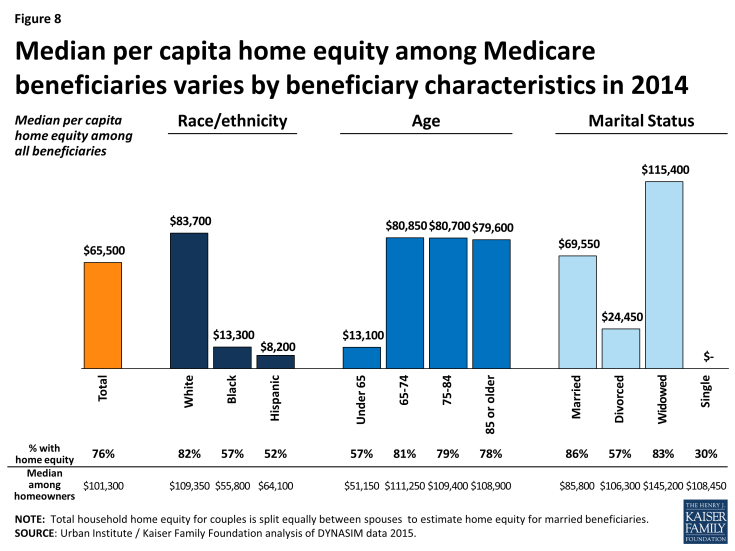
Figure 8: Median per capita home equity among Medicare beneficiaries varies by beneficiary characteristics in 2014
Among beneficiaries with home equity, median per capita home equity was $101,300 in 2014, with higher home equity values among white beneficiaries ($109,350) than among black beneficiaries ($55,800) or Hispanic beneficiaries ($64,100).
Median home equity among beneficiaries under age 65 with home equity ($51,150) was less than half the median home equity among seniors with home equity ($110,300). Among seniors with home equity, the value is slightly higher among 65-74 year olds ($111,250) than older groups, including beneficiaries ages 85 and older ($108,900) in 2014. Among beneficiaries with home equity, median home equity values were higher among widowed beneficiaries ($145,200) than among married, divorced, or single beneficiaries ($85,800, $106,300, and $108,450) in 2014. Among those with home equity, median home equity was also higher among beneficiaries with more years of education, and the median home equity of college-educated beneficiaries ($151,650) was more than double the median home equity of beneficiaries with less than a high-school education ($64,300) in 2014 (Table 1).
In 2030
Home equity values among Medicare beneficiaries in 2030, adjusted for inflation, are projected to be moderately higher than they are in 2014, with much of the growth in home equity values among people in the top decile; however, the share of beneficiaries with home equity (76%) is projected to remain flat (Figure 9). Median home equity is projected to grow by approximately $5,400, or eight percent, from $65,500 in 2014 to $79,000 in 2030, after adjusting for inflation. In contrast, among beneficiaries in the top five percent of the home equity distribution, median home equity is projected to be 38 percent higher among the next generation of beneficiaries than among the current generation, growing by $162,400, from $418,400 in 2014 to $580,400 in 2030, after adjusting for inflation. As a result, the distribution of home equity values is projected to widen over time.
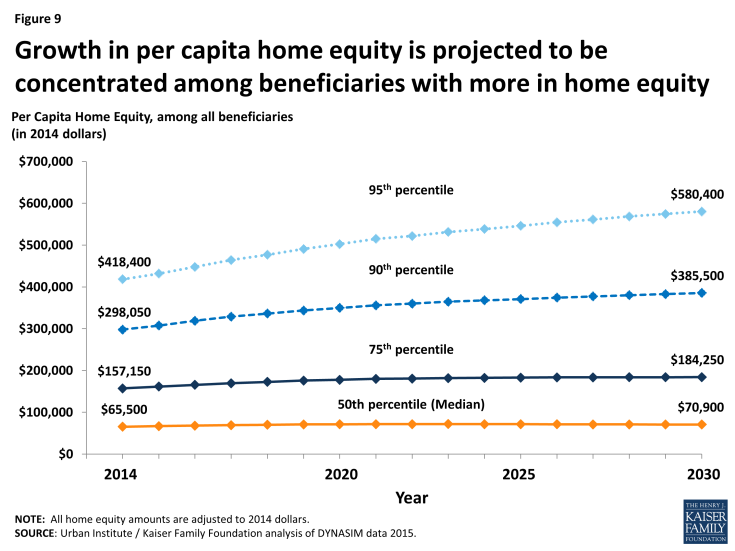
Figure 9: Growth in per capita home equity is projected to be concentrated among beneficiaries with more in home equity
Conclusion
While a small share of the Medicare population lives on relatively high incomes, most are of modest means, with half of people on Medicare living on less than $24,150 in 2014. The typical beneficiary has some savings and home equity, but the range of asset values among beneficiaries is wide and varies greatly across demographic characteristics. Looking to the future, the income, assets and home equity values of Medicare beneficiaries overall are projected to be somewhat greater in 2030 than in 2014 after adjusting for inflation; yet, much of the growth is projected to be realized among those with relatively high incomes and assets. As policymakers consider options for decreasing federal Medicare spending and addressing the federal debt and deficit, these findings raise questions about the extent to which the next generation of Medicare beneficiaries will be able to bear a larger share of costs.

