Data Note: 2019 Medical Loss Ratio Rebates – Data Note
A Data Note on 2020 Medical Loss Ratio Rebates is now available here.
The Medical Loss Ratio (or MLR) requirement of the Affordable Care Act (ACA) limits the portion of premium dollars health insurers may use for administration, marketing, and profits. Under the ACA, health insurers must publicly report the portion of premium dollars spent on health care and quality improvement and other activities in each state in which they operate.
The Medical Loss Ratio provision requires insurance companies that cover individuals and small businesses to spend at least 80% of their premium income on health care claims and quality improvement, leaving the remaining 20% for administration, marketing, and profit. The MLR threshold is higher for large group insured plans, which must spend at least 85% of premium dollars on health care and quality improvement. Insurers failing to meet the applicable MLR standard have been required to pay rebates to consumers since 2012 (based on their 2011 experience). Currently, MLR rebates are based on a 3-year average, meaning that 2019 rebates are calculated using insurers’ financial data in 2016, 2017, and 2018. Insurers may either issue rebates in the form of a premium credit or a check payment and, in the case of people with employer coverage, the rebate may be shared between the employer and the employee. Insurers have until September 30 to begin issuing rebates this year. Rebates issued in 2019 will go to subscribers who were enrolled in rebate-eligible plans in 2018.
Using data reported by insurers to CMS, we estimate insurers will be issuing a total of at least $1.3 billion across all markets – exceeding the previous record high of $1.1 billion in 2012 (based on 2011 experience). The amount varies by market, with insurers reporting at least $743 million in the individual market, $312 million in the small group market, and $284 million in the large group market.
| Table 1: Insurer Reported Rebate Payments in 2019 | ||||
| Individual Market | Small Group Market | Large Group Market | Total – All Markets | |
| Total Rebates* | $743.3M | $312.0M | $284.2M | $1.3B |
| Number of subscribers/ employers owed a rebate** | 2,748,000 subscribers | 262,000 employers | 27,000 employers | N/A |
| Average rebate per subscriber / employer | $270 per subscriber | $1,190 per employer | $10,660 per employer | N/A |
| % of rebates being paid by premium credit | 24% | 7% | 5% | 17% |
| % of rebates being paid by lump-sum reimbursement | 76% | 93% | 95% | 83% |
| Amount of unclaimed rebates from prior MLR reporting years | $37.5M | $27.7M | $11.6M | $76.9M |
| Notes: Rebate amounts are rounded to the nearest $100,000. The number of subscribers or employers is rounded to the nearest 1,000. Some insurers did not file MLR data, and any rebates they might owe are missing from these figures. Source: Kaiser Family Foundation analysis of rebate submissions by insurers to CMS. |
||||
Insurers in the individual market in 2018 are driving this record-high year of MLR rebates in 2019. Rebates issued in 2019 are based on 2016, 2017, and 2018 financial performance. As our previous analysis of insurer financial performance found, in 2016, insurers in the individual market were operating with significant losses on average, but by 2017 financial performance in the market had begun to stabilize as premiums rose. Insurers in 2018 were highly profitable and arguably overpriced, which is why rebates are so large despite being averaged across less favorable years (2016 and 2017).
Rebates may either be paid out in the form of a premium credit (for those who are currently enrolled with the same insurer), or as a lump-sum payment. As shown in the figure above, most insurers report they are issuing rebates in the form of a lump sum. Insurers also report the amount of previous years’ rebates that have gone unclaimed, which currently totals $76.9 million across the three commercial markets.
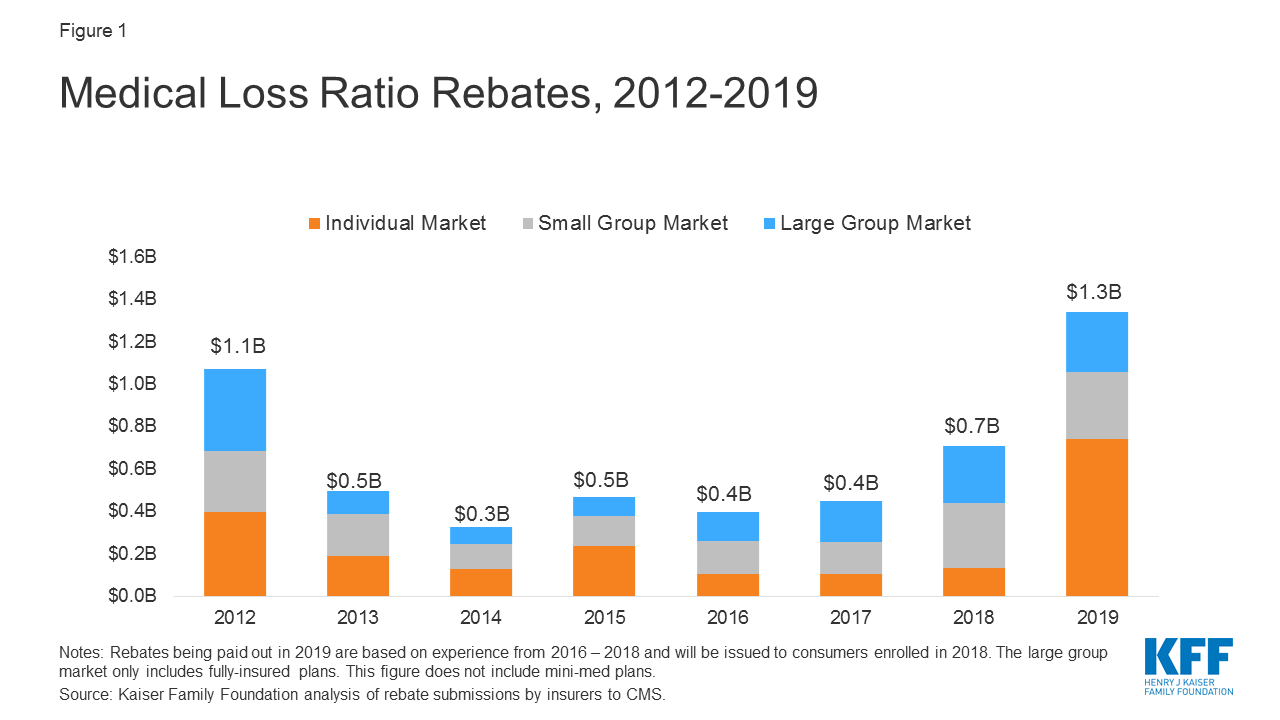
Figure 1: Medical Loss Ratio Rebates, 2012-2019
Rebates in the small and large group markets are more similar to past years. In the case of employer-sponsored insurance plans, the cost of coverage is often split between the employer and employees. Therefore, for many employer-sponsored plans, the handling of refunds to employers and employees may depend on the plan’s contract and the manner in which the policyholder and participants share premium costs. If the amount of the rebate is exceptionally small (“de minimis”, $5 for individual rebates and $20 for group rebates), insurers are not required to process the rebate, as it may not warrant the administrative burden required to do so.
Rebates also vary by state. Across all markets, insurers in Virginia will pay out the highest total rebates ($149.6 million), followed by Pennsylvania ($130 million) and Florida ($107.4 million). In the individual market alone, total rebates range from $0 in at least 13 states to a high of $111.3 million in Virginia, followed by Arizona ($92.3 million) and Texas ($80.4 million). In the small group market, total rebates range from $0 in 26 states to $78.0 million in California. In the large group market, total rebates range from $0 in 13 states to $42.2 million in Florida. On a per subscriber (Table 3) basis in the individual market, insurers will pay the highest rebates in Pennsylvania ($990 per subscriber), Virginia ($770 per subscriber) and Minnesota ($670).
Figure 2: Total MLR Rebates paid in 2019 by State
Insurers issuing the largest rebates across the individual market include Centene, HCSC, Cigna, and Highmark. These insurers tend to have high enrollment and participate in a number of states. There are, however, some insurers with smaller footprints owing large per person rebates, such as Sentara (Optima) in Virginia, which reports owing $98.9 million in the individual market.
| Table 2: Insurers issuing the largest total rebates in the individual market in 2019 | ||
| Insurer (# of states where insurer owes rebates) | Total Rebates, Individual Market | Per Subscriber Rebates, Individual Market |
| Centene (at least 7 states) | $216.9M | $420 |
| Sentara/Optima (1 state: VA) | $98.9M | $1,850 |
| HCSC (3 states) | $78.5M | $180 |
| Cigna (5 states) | $55.9M | $320 |
| Highmark (1 state: PA) | $50.8M | $1,250 |
| Note: Centene has not filed MLR data in Nevada and Kansas, so their total rebates may be higher than is shown here. | ||
So far in 2019, insurer financial performance in the individual market remains strong, despite the effective repeal of the individual mandate penalty effective this year. It is likely that individual market insurers will continue to owe large rebates next year, in September 2020, as the rebate calculation at that time will be based on 2017, 2018, and 2019, and will no longer include a year with significant losses.
| Table 3: Individual Market Rebates and Subscribers by State, 2019 | |||
| State | 2019 MLR Rebates | Subscribers Owed a Rebate | Average Rebates per Subscriber |
| Alabama | Less than $100,000 | NA | NA |
| Alaska | $5.9 M | 15,000 | $380 |
| Arizona | $92.3 M | NA | NA |
| Arkansas | $12.3 M | 113,000 | $110 |
| California | $0.1 M | NA | NA |
| Colorado | $10.8 M | NA | NA |
| Connecticut | Less than $100,000 | NA | NA |
| Delaware | $0 | 0 | $0 |
| DC | Less than $100,000 | Less than 1,000 | $60 |
| Florida | $20.9 M | NA | NA |
| Georgia | $59.9 M | NA | NA |
| Hawaii | $0 | 0 | $0 |
| Idaho | $0 | 0 | $0 |
| Illinois | $5.6 M | 24,000 | $230 |
| Indiana | $0.8 M | 43,000 | $20 |
| Iowa | $0.8 M | 36,000 | $20 |
| Kansas | NA | NA | NA |
| Kentucky | $0 | 0 | $0 |
| Louisiana | Less than $100,000 | NA | NA |
| Maine | $0 | 0 | $0 |
| Maryland | Less than $100,000 | NA | NA |
| Massachusetts | $34.8 M | 153,000 | $230 |
| Michigan | Less than $100,000 | NA | NA |
| Minnesota | $50.2 M | 75,000 | $670 |
| Mississippi | $32.6 M | 66,000 | $500 |
| Missouri | $25.0 M | 55,000 | $460 |
| Montana | NA | NA | NA |
| Nebraska | $0 | 0 | $0 |
| Nevada | NA | NA | NA |
| New Hampshire | $24.3 M | 85,000 | $290 |
| New Jersey | $0 | 0 | $0 |
| New Mexico | $12.7 M | 26,000 | $500 |
| New York | $0.1 M | NA | NA |
| North Carolina | $9.8 M | 376,000 | $30 |
| North Dakota | NA | NA | NA |
| Ohio | $0.3 M | NA | NA |
| Oklahoma | $3.2 M | 109,000 | $30 |
| Oregon | $0 | 0 | $0 |
| Pennsylvania | $69.5 M | 70,000 | $990 |
| Rhode Island | $0 | 0 | $0 |
| South Carolina | Less than $100,000 | NA | NA |
| South Dakota | $0 | 0 | $0 |
| Tennessee | $56.9 M | NA | NA |
| Texas | $80.4 M | NA | NA |
| Utah | $4.2 M | 13,000 | $320 |
| Vermont | $0 | 0 | $0 |
| Virginia | $111.3 M | 144,000 | $770 |
| Washington | Less than $100,000 | NA | NA |
| West Virginia | $0 | 0 | $0 |
| Wisconsin | $18.5 M | NA | NA |
| Wyoming | $0 | 0 | $0 |
| NOTES: Values of NA in the rebates column indicate that insurers representing more than 10% of state enrollment have not filed MLR data. Values of NA in the subscribers and average rebates column indicate that at least one insurer in a state filed rebates but did not file the number of subscribers receiving rebates. Zeros represent true zeros in the data. Rebate amount are rounded to the nearest $100,000. Subscribers are rounded to the nearest 1,000. Average rebates per subscriber are rounded to the nearest $10. | |||